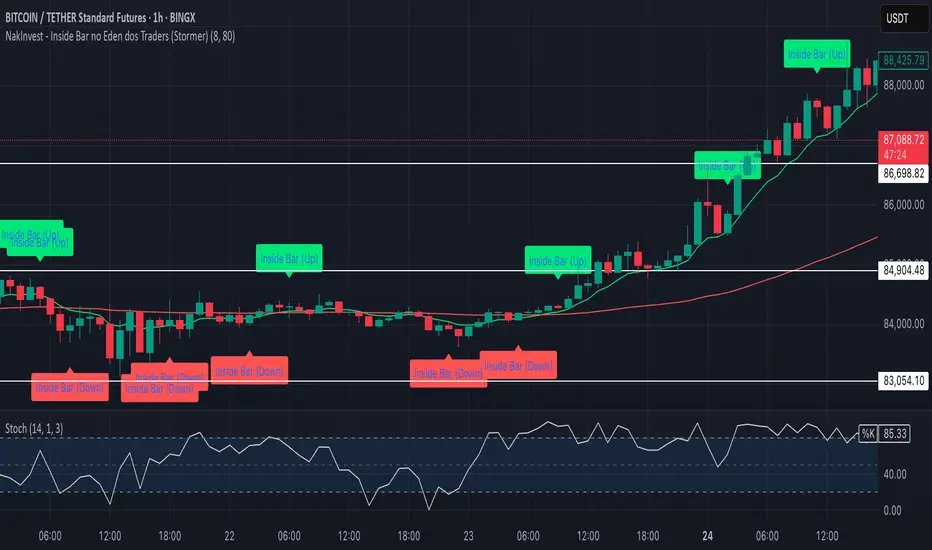
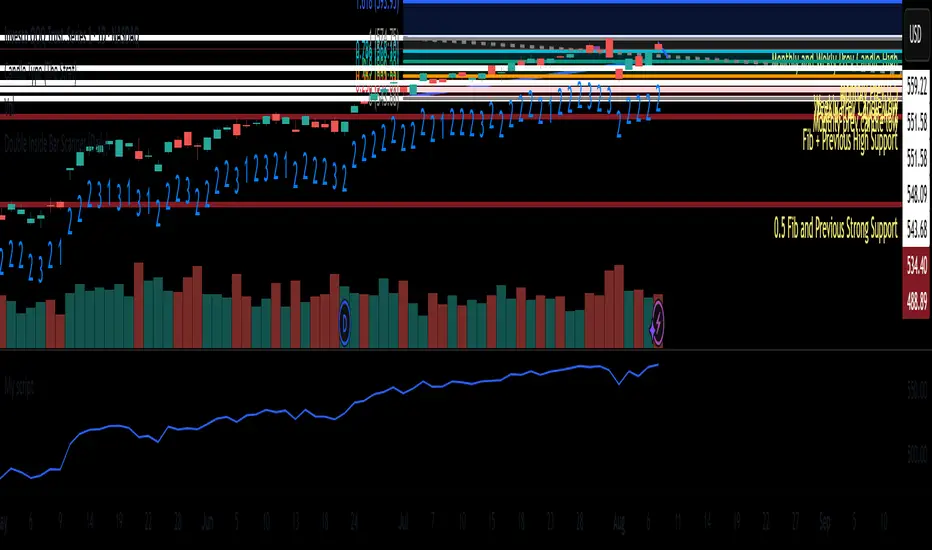
NakInvest - Inside Bar no Eden dos Traders (Stormer)📌 NakInvest - Inside Bar Detector (Éden dos Traders Enhanced Detection)
This indicator is designed to identify Inside Bars that occur during strong trending conditions, following the popular Éden dos Traders strategy by Stormer, famous brazilian trader. It uses the relationship between two EMAs (Short EMA & Long EMA) to determine whether the market is in a bullish or bearish trend, and highlights Inside Bars that meet specific criteria.
⸻
🔍 What This Indicator Does:
1. EMA-Based Trend Detection:
• Identifies Uptrends when the Short EMA is above the Long EMA.
• Identifies Downtrends when the Short EMA is below the Long EMA.
2. Inside Bar Detection:
• An Inside Bar is detected when the entire candle (body & wicks) is contained within the body of the previous candle.
• This pattern suggests consolidation and potential breakouts, especially when found within a strong trend.
3. Debug Mode for Transparency:
• When enabled, provides visual markers to indicate when the conditions for trend detection and Inside Bars are met.
• Helps traders understand why certain candles are detected and others are not.
⸻
📈 How to Use:
• Apply this indicator to any market and timeframe, but it’s most effective on higher timeframes (H1, H4, Daily).
• Ideal for traders looking for trend-continuation setups or reversal signals after periods of consolidation.
• Combine this indicator with other tools (e.g., Volume Analysis, Price Action Patterns) for greater accuracy.
⸻
⚙️ Indicator Settings:
1. Short EMA Length: The period for the fast-moving average (default: 8).
2. Long EMA Length: The period for the slow-moving average (default: 80).
3. Enable Debug Mode: Toggle visibility of debug markers to better understand condition logic.
⸻
📢 Alerts:
This script includes labels for:
• IB (Up): Inside Bar detected during an uptrend.
• IB (Down): Inside Bar detected during a downtrend.
⸻
📌 Disclaimer:
This indicator is intended for educational purposes only and is not financial advice. Always perform your own research and consult with a financial professional before making any trading decisions.
ابحث في النصوص البرمجية عن "inside bar"
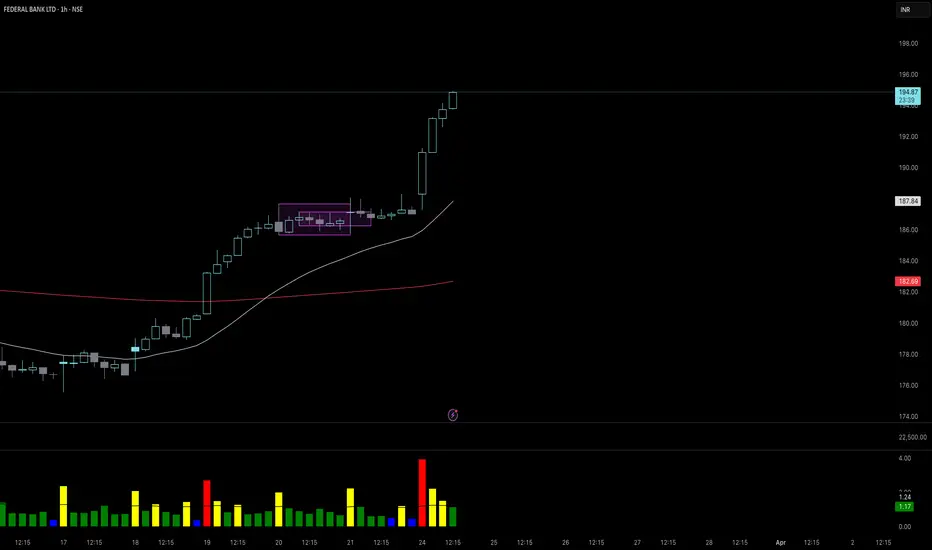
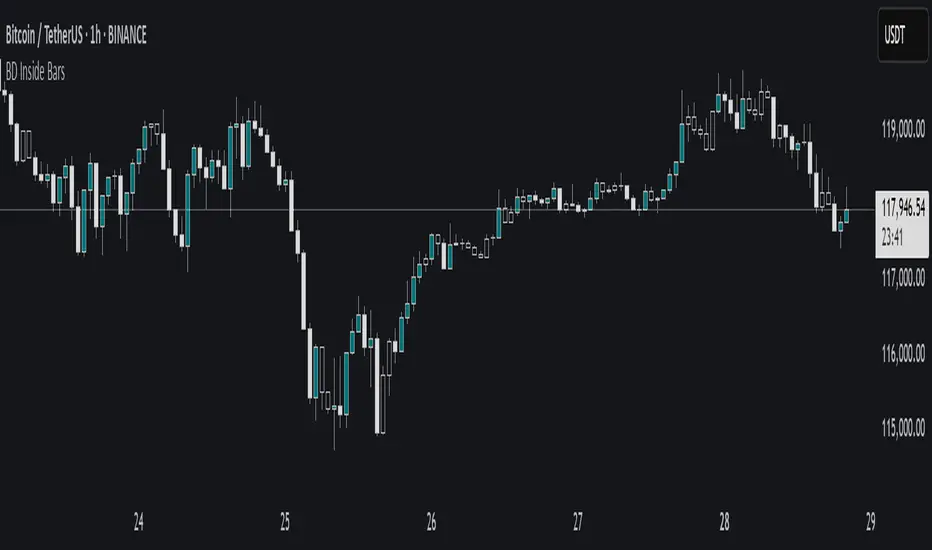
Smart Inside Bar Zones by Dinkan🔹 How It Works
An Inside Bar is formed when a candle’s high and low are completely within the previous candle’s range.
The indicator detects this structure in real time, creates a visual box around it, and extends the zone until the pattern is broken.
Inside Bar candles can be optionally highlighted with a custom color to make them stand out clearly on the chart.
🔹 Features
✅ Automatic Inside Bar detection
✅ Dynamic Inside Bar zone boxes with custom fill & border color
✅ Inside candle body highlighting with user-defined color
✅ Adjustable transparency and border style
✅ Option to display only the latest Inside Bar zone for cleaner charts
🔹 Usage
Traders can use Inside Bar zones to:
Study price compression and breakout regions
Observe range behavior and trend continuation setups
Combine with other tools like volume or support/resistance analysis
🔹 Customization
Change box fill and border color
Adjust Inside Candle color for better visibility
Set transparency and choose whether to show all or only the latest box
⚠️ Disclaimer
This script is intended for market structure visualization and educational purposes only.
It does not generate trading signals or financial advice.
Always perform your own analysis and risk management before making trading decisions.

Strategy Myth-Busting #10 - InsideBar+EMA - [MYN]This is part of a new series we are calling "Strategy Myth-Busting" where we take open public manual trading strategies and automate them. The goal is to not only validate the authenticity of the claims but to provide an automated version for traders who wish to trade autonomously.
Our 10th one we are automating is the " 75% Win Rate High Profit Inside Bar Trading Strategy - What If You ... " strategy from " Trade Pro " who claims to have backtested this manually and achieved 11,063% profit with a 75% winrate over 100 trades. I was unable to emulate these results consistently accommodating for slippage and commission but even so, the results look promising. I was only able to achieve this win-rate with some multiple take profit staggering. Even so the markdown is above where I would normally consider comfortable (>20%).
If you know of or have a strategy you want to see myth-busted or just have an idea for one, please feel free to message me.
This strategy uses a combination of 2 open-source public indicators:
Inside Bar Ind/Alert by CMA
EMA (built-in)
Trading Rules
4 hour candles
Stop Loss at EMA Line with TP Target 1.5x the risk
Long Entry when these conditions are true
inside bar and bullish
Bar close's above 50 ema
Price action rises above high of inside bar .
Short Entry when these conditions are true
inside bar and bearish
Bar close below 50 ema
Price action falls below low of inside bar

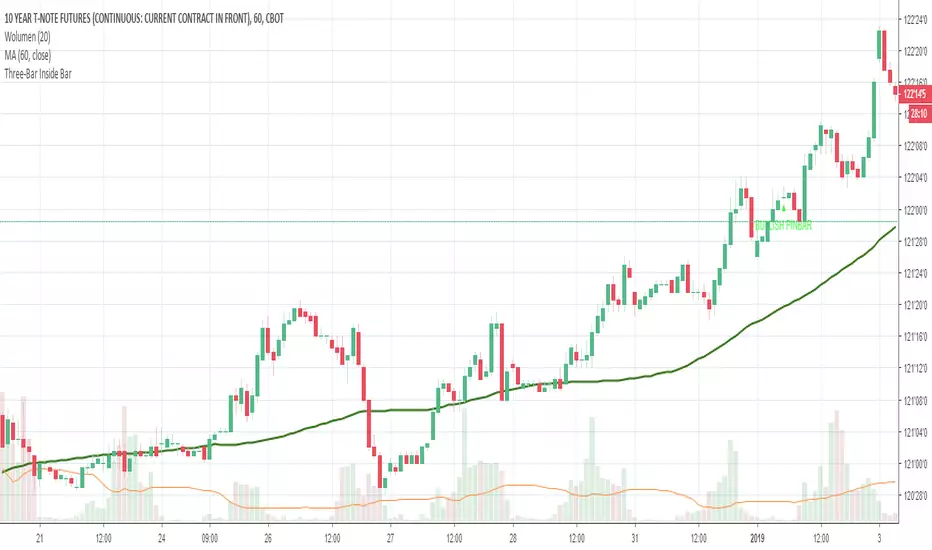
Three-Bar Inside Bar PaternAuthor: Johnan Prathap TASC March 2011
The typical inside bar two-bar view indicates minimal activity in a market. It is defined as a bar (or series of bars) that is completely within the range of the preceding bar; that is, it has a higher low and lower high than the bar immediately before it. Some traders consider a bar an inside bar if the high and low are equal to the previous bar or where there are several consecutive bars within the range of a previous bar.
Many analysts tend to view inside bars as an indication of declining market activity, or possibly a prelude to a large movement in either direction.
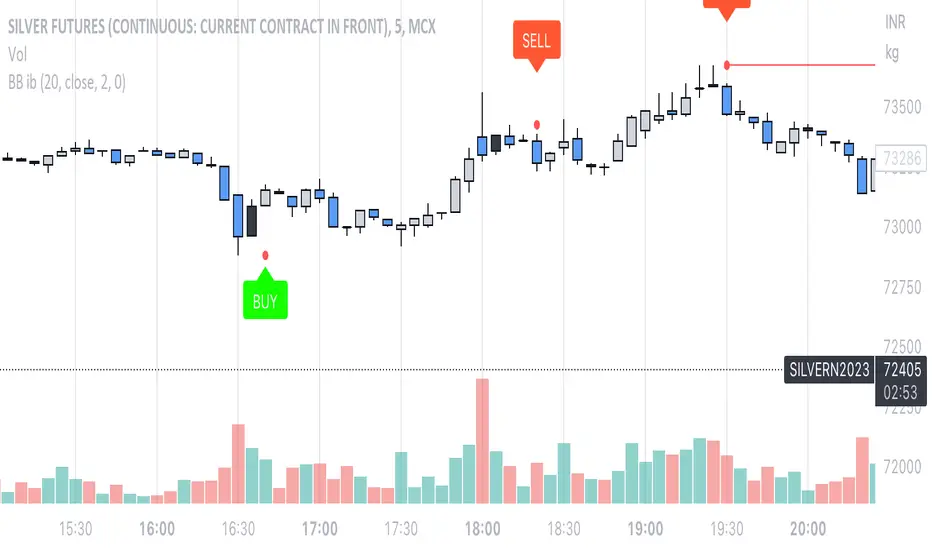
Bollinger Bands Inside barthe indicator name is Bollinger Band inside bar because it uses Bollinger Band and inside bar to take counter-trend positions in the market. whenever this pattern is formed then it can be used to take an entry into the market. the candlestick pattern recognizes 3 candle candlestick. first the mother bar i.e. the medium to the big size candle that intersects with the upper and the lower levels of the Bollinger band. the second candle should be an inside bar i.e. the high and low of the current bar should be less than the previous bar. finally, the last bar who's low should be less than the mother bar in case of the mother bar is at upper levels and if the mother bar is at lower levels then the candle's high should be more than the mother bar. the stop-loss should be high and low of the mother bar respectively. entry should be taken as soon as the low and high of the mother bar is taken out respectively. target should be 1:1 or 20 sma or lower Bollinger band in case the entry is taken from the top. works best if there is a trend and the market takes a pullback and this pattern is formed.
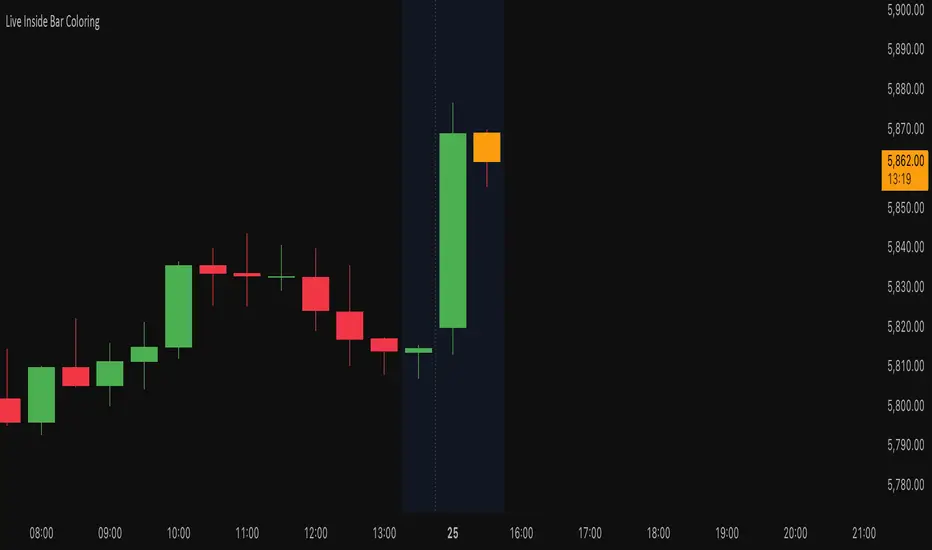
Live Inside Bar ColoringDescription
This script colors the current bar if it is inside the prior bar's high and low. Inside is defined as ≤ the high, and ≥ the low of the prior bar.
Utility
This gives a quick visual indication if the current bar is inside. This can indicate a choppier market. By definition, an inside bar is consolidating and not trending.
Function
Colors distinguish if the current price is above the opening price of the inside bar on a given timeframe. If you do not want to distinguish this, you can set both colors the same.
4 SMAs & Inside Bar (Colored)SMAs and Inside Bar strategy is very common as far as Technical analysis is concern. This script is a combination of 10-20-50-200 SMA and Inside Bar Candle Identification.
SMA Crossover:
4 SMAs (10, 20, 50 & 200) are combined here in one single indicator.
Crossover signal for Buy as "B" will be shown in the chart if SMA 10 is above 20 & 50 and SMA 20 is above 50.
Crossover signal for Sell as "S" will be shown in the chart if SMA 10 is below 20 & 50 and SMA 20 is below 50.
Inside Bar Identification:
This is to simply identify if there is a inside bar candle. The logic is very simple - High of the previous candle should be higher than current candle and low of the previous candle should be lower than the current candle.
If the previous candle is red, the following candle would be Yellow - which may give some bullish view in most of the cases but not always
If the previous candle is green, the following candle would be Black - which may give some bearish view in most of the cases but not always
Be Cautious when you see alternate yellow and black candle, it may give move on the both side
Please comment if you have any interesting ideas to improve this indicator.

7 Inside Bars with Full Range Box (15m)his indicator detects periods of extreme price compression by identifying 7 consecutive inside bars on the 15-minute timeframe. An inside bar is a candle that forms within the high and low of the previous candle. When 7 such bars occur in a row, it's a strong signal of market indecision and potential breakout.
What it does:
Detects if the last 7 candles are all inside the range of the 8th candle (the outer bar).
Highlights the consolidation zone by drawing a fuchsia-colored box from the high to low of the outer candle.
Marks the final candle in the sequence with a small "7IN" label below the bar.
This setup can help traders spot high-probability breakout zones and prepare for potential volatility after extended consolidation.
🔍 Best Used For:
Breakout trading
Volatility expansion strategies
Trade setups following tight consolidation
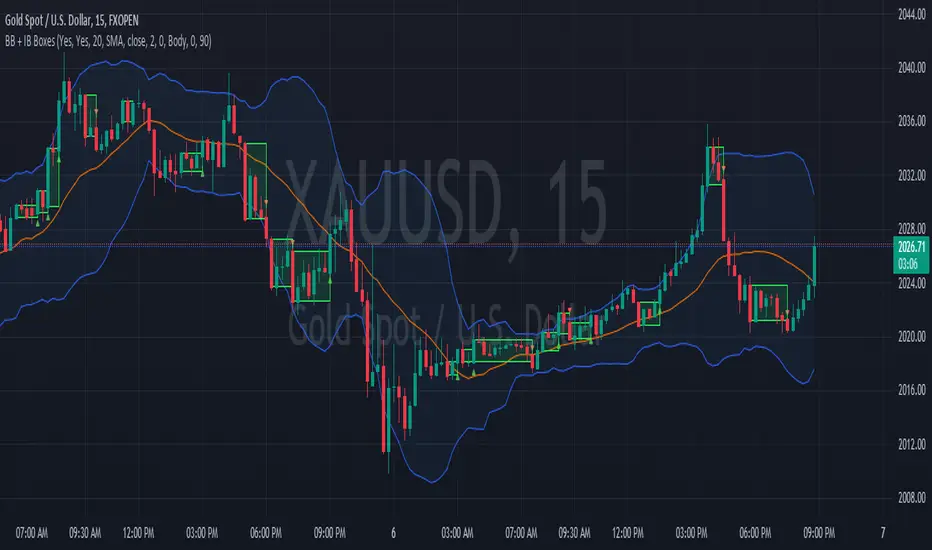
Bolingger Bands + Inside Bar BoxesBollinger Bands are a technical analysis tool consist of three bands—an upper, middle, and lower band—that are used to spotlight extreme short-term prices in a security. The upper band represents overbought territory, while the lower band can show you when a security is oversold. Most technicians will use Bollinger Bands® in conjunction with other analysis tools to get a better picture of the current state of a market or security.
An Inside Bar is a two-bar price action trading strategy in which the inside bar is smaller and within the high to low range of the prior bar. Inside bars show a period of consolidation in a market. They often form following a strong move in a market, as it ‘pauses’ to consolidate before making its next move. However, they can also form at market turning points and act as reversal signals from key support or resistance levels.
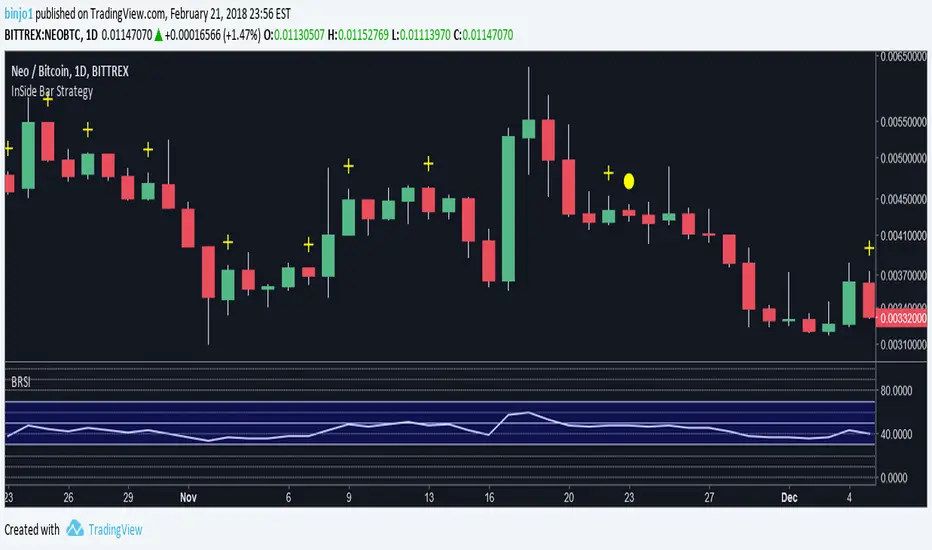
RSI Candle Bar with Inside BarThis Indicator is RSI convert into Candle Bar with Inside Bar Candle
How to use :
Do Some setting
RSI Overbought - 60 It will shows in Blue Candle Bar means Bullish Signal
RSI Oversold - 40 It will shows in Yellow Candle Bar means Bearish Signal
Inside Bar Candle -
Gray or Black Bar --- Which is Shows that Trend may be Reverse or Big Move may be come.
Colors you can be change according to your convenience.

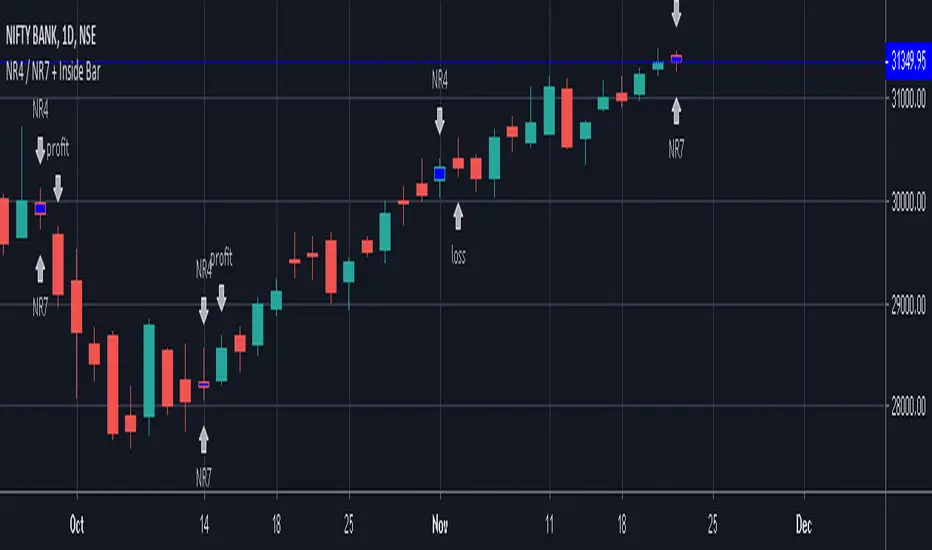
NR4 / NR7 + Inside BarIndicator Script for identifying Narrow Range 4 / 7 + Inside Bar
It also helps to check whether NR4 / NR7 breakout trading has been profitable or not in the past in a particular instrument.
It has helped me to select profitable scripts and avoid losing ones. Can be used for anytime frame.
SIGNAL
NR4 == Narrowest range of 4 periods + signal day is an inside bar
NR4 & NR7 == Narrowest range of 7 periods + signal day is an inside bar
SIGNAL "PROFIT" -
Prior day was NR4 / NR7 and next day price broke out of prior day range in 1 direction and closed in the direction of breakout away from breakout price, resulting in a profit trade.
SIGNAL "LOSS" -
Prior day was NR4 / NR7 and next day price broke out of prior day range and returned back to close inside the narrow zone OR went in opposite direction after the initial breakout, resulting in a loss trade.
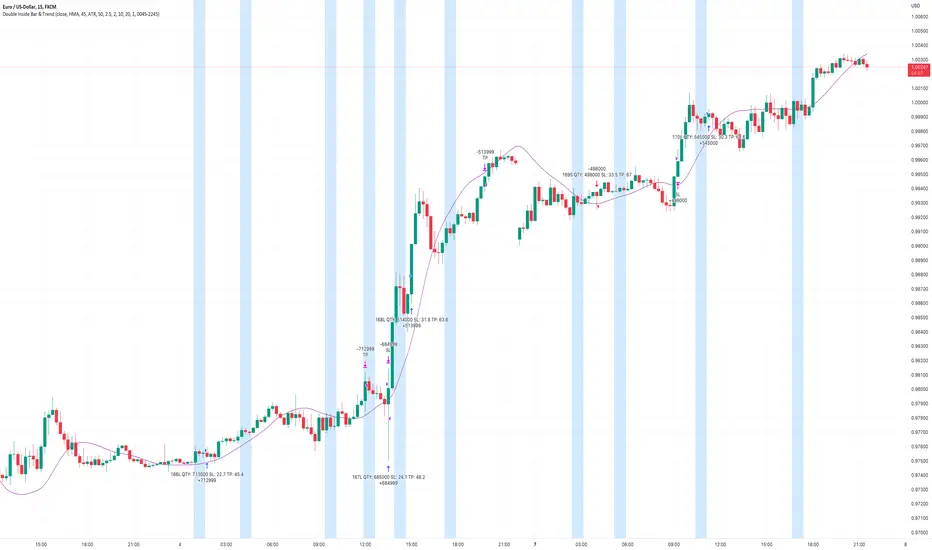
Double Inside Bar & Trend Strategy - KaspricciDouble Inside Bar & Trend Strategy - Kaspricci
This strategy combines the Double Inside Bar candlestick pattern with a trend filter. Once the second inside bar closes and price is above trend moving average, a buy stop order is placed at high of the candle. If price is below trend moving average, a sell stop order is placed at the low of the candle.
This strategy is for educational purposes only! It is not meant to be a financial advice.
Settings
Trend source, type of moving average and length for calculating trend
Stop Loss Type - default: ATR. You can switch between stop loss calculation based on Average True Range value or fixed value.
ATR Length / Factor / TP Ratio - default: 14 / 2.0 / 2.0. Used to calculate the Stop Loss as ATR * Factor and Take Profit as Stop Loss * TP Ratio.
FIX Stop Loss / Take Profit - default: 10 pips / 20 pips. In case you select Stop Loss Type = FIX, these value swill be used.
Risk in % - default: 1%, option to adjust the quantity of a trade based on a defined risk percentage. If enabled, it will overwrite the quantity parameter of the strategy settings.
On top you can filter trades by start and end date as well as time of the day.
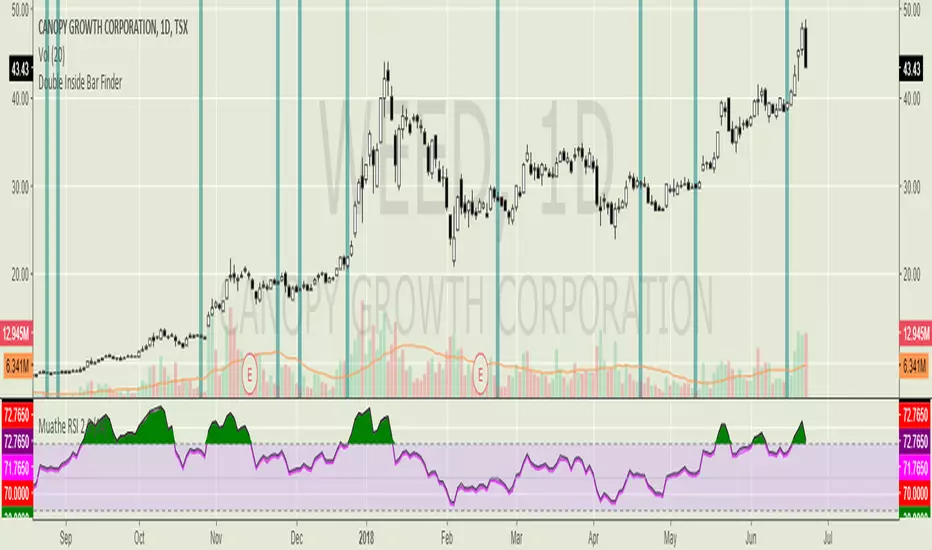
Double Inside Bar FinderHighlights in blue when an inside bar follows an inside bar. Double inside bars (when used on the daily timeframe) are a way of easily finding equilibrium patterns (i.e. pennant shaped price action) on lower time frames. There is usually a strong move in whatever direction these patterns break, so good to have alerts set up for your favourite markets.
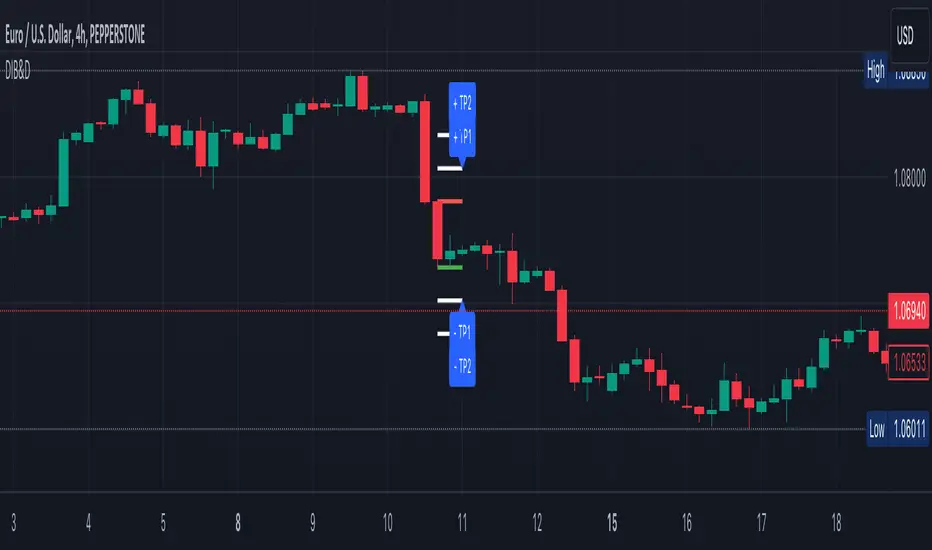
Double Inside bar with drift - by Yasser Mahmoud (YWMAAAWORLD)This is a new indicator that detects double inside bars with the condition that their base bar is either shifted above or below (i.e. both base bar's high and low are higher or lower than the mother bar's high and low respectively)
it plots lines at the top and bottom of the mother bar and 2 TPs above and 2 TPs below.
Double Inside Bar Scanner [Daily]Double Inside Bar Scanner . Captures Double Inside based on last 2 daily Bars
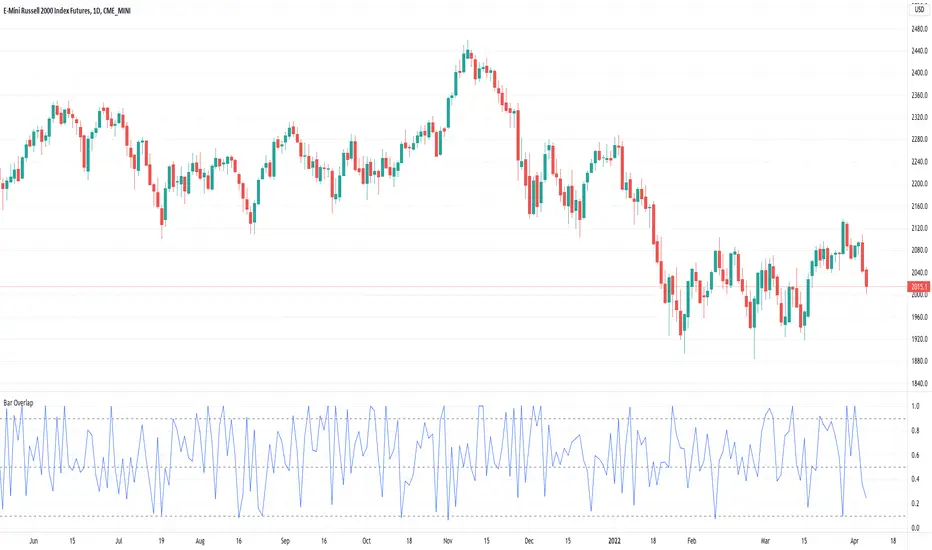
Bar Overlap - Sort of inside barsCalculates the amount the current bar overlaps with the previous bar as a percentage. 1 = totally overlapping (inside bar) , 0 = no overlap at all
EMA Cross 9,21,50,80,200 + Inside barEste script faz o seguinte:
1. Plota 5 EMAs (9,21,50,80,200)
2. Faz crossover da 9x21 e 21x50
3. Colore inside bar em amarelo (é possível ainda colorir diferentemente bullish e bearish inside bar)

MACD (Moving Average Convergence/Divergence) + Inside BarMACD (Moving Average Convergence/Divergence) + Inside Bar so that free users can have two things in same indicator.
Script is open for everyone.
Check and test the code of Inside Bar and let me know if it is correct.
Feel feel to share.

Better Inside BarsIndicates a single inside bar with a yellow plus symbol and two inside bars in a row with a yellow circle.
Trading margin, inside bars and outside barsThe indicator shows the trading range and the average trading range over a freely selectable period. Inside bars and outside bars are color-coded in the chart.
Der Indikator zeigt die Handelspanne und die durchschnittliche Handelspanne über eine frei wählbare Periode. Im Chart werden Innenstäbe und Außenstäbe farblich gekennzeichnet.

Price Action Awesome IndicatorThis indicator is everything you need to do Price Action Trading.
It provides signals about:
Inside Bars
Pin Bars
Fakey Pin Bars (background color red or green for bearish or bullish fakeys)

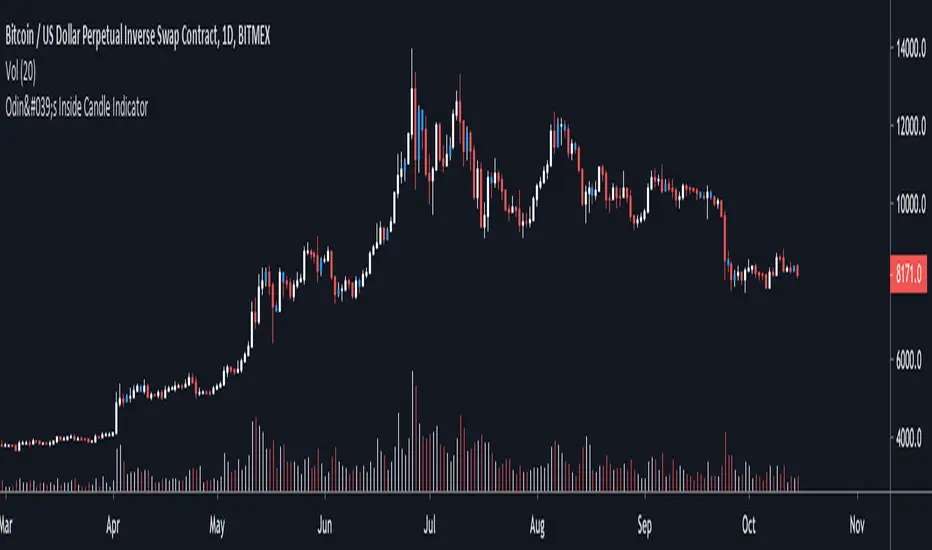
Odin's Inside Bar IndicatorA simple indicator that identifies "inside bars" by painting them blue.
An inside candle is a candle that has a lower high and higher low than the previous candle.
I like to use it on the daily chart to find areas of price compression that lead to a breakout.
The price then often trends in the direction of the breakout.
Especially powerful when combined with other market structure analysis.
Cheers.