Engulfing Overlap Zone Detector by RWBTradeLabEngulfing Overlap Zone Detector by RWBTradeLab
A focused, non-repainting tool that detects high-value “overlap zones” formed when one engulfing pattern fails and the opposite side immediately takes control.
What this indicator does
Instead of showing every engulfing pattern, this script filters out noise and highlights only Engulfing Overlap Zones:
1. It internally detects both:
* Regular Engulfing (R EG)
* E-Regular Engulfing (ER EG)
2. It then checks for engulfing failure:
* A Sell EG fails when a bullish candle closes above its base high.
* A Buy EG fails when a bearish candle closes below its base low.
3. After the failure, it looks for an opposite-side engulfing confirmation.
4. When the failed zone and the new opposite engulfing zone overlap, the script marks that region as a Buy EG Overlap or Sell EG Overlap zone.
Only these premium, overlap-based structures are shown on the chart.
Visuals on chart
1. Two stacked rectangles are drawn for each overlap setup:
* The failed engulfing zone
* The opposite confirming engulfing zone
2. Clean labels appear at the edge of the overlap:
* Buy EG Overlap (bullish zone)
* Sell EG Overlap (bearish zone)
3. Text distance from the zone is adjustable via Text Offset from Box (%).
4. Separate color controls for:
* Buy Engulfing Overlap Box
* Sell Engulfing Overlap Box
Alerts
Built-in alerts trigger only on confirmed bar close when a new overlap setup completes:
*Buy EG Overlap
*Sell EG Overlap
Each alert message includes price, time and ticker, prefixed with RWBTradeLab for easier filtering and automation.
Key settings
1. Candle Length (closed candles) – Defines how many recent confirmed candles are scanned (current bar is excluded).
2.Display toggles – Turn ON/OFF:
* Buy Engulfing Overlap
* Sell Engulfing Overlap
* Text labels
3. Text Offset from Box (%) – Controls how far the label is placed from the overlap zone, with a safe minimum to keep labels readable.
Non-repainting logic
* All calculations use closed candles only .
* No running-bar signals, no repaint tricks.
* The zones and alerts reflect stable, confirmed structures.
Best use
This indicator is designed to help you spot:
* Liquidity grabs and fake outs followed by real reversals
* Strong continuation zones after a failed attempt by the opposite side
* High-quality reaction areas for entries, pullbacks and retests
Works on any symbol or timeframe. For best results, combine with:
* Higher-timeframe market structure
* Key support/resistance or supply/demand zones
* Your own trade management and confirmation rules
Disclaimer
This script is a technical pattern-detection tool, not financial advice. Trading involves risk. Always use proper risk management and confirm signals with your own analysis.
Creator: RWBTradeLab
If this indicator helps your trading, please leave a ⭐ and share your feedback.
ابحث في النصوص البرمجية عن "liquidity"

FVG with Fibonacci Levels [MHA Finverse]FVG with Fibonacci Levels - Professional Fair Value Gap Indicator
This advanced Fair Value Gap (FVG) indicator automatically identifies and tracks market imbalances with integrated Fibonacci retracement levels, providing traders with precise entry and exit opportunities.
Key Features:
Smart Gap Detection
• Automatically identifies bullish and bearish fair value gaps in real-time
• Customizable minimum gap percentage filter to avoid noise
• Visual color-coded boxes for easy identification
Fibonacci Integration
• Built-in 0.5 and 0.618 Fibonacci retracement levels
• Fully customizable fib levels, colors, and line styles
• Helps identify optimal entry zones within each gap
Intelligent Gap Management
• Tracks multiple gaps simultaneously (up to 20)
• Automatic gap mitigation detection (Close or Wicks)
• Option to remove or highlight filled gaps
• Auto-hide boxes after specified bar count
Advanced Alert System
• Alerts when gaps are filled
• Fibonacci level touch alerts for both 0.5 and 0.618 levels
• Separate alerts for bullish and bearish setups
• Customizable alert preferences
Clean Visual Display
• Transparent boxes that don't clutter your chart
• Extending lines that update in real-time
• Customizable colors for both bullish and bearish gaps
• Option to change border style when gaps are filled
Perfect For:
Smart Money Concepts (SMC) traders, Price Action traders, and anyone looking to trade market structure and liquidity gaps with precision.
How to Use:
The indicator draws boxes around identified fair value gaps and extends them forward until they are filled. Fibonacci levels within each gap provide optimal entry zones. Set up alerts to get notified when price interacts with these key levels.
Credits
Special thanks to Quant Vue for their code examples and inspiration that contributed to the development of this indicator.
Disclaimer:
This indicator is for educational and informational purposes only. It does not constitute financial advice. Trading involves substantial risk of loss. Always conduct your own research and consider your risk tolerance before making any trading decisions. Past performance does not guarantee future results.

Stop Hunt / Liquidity Sweep Detector with Momentum Ratingdetects liquidity sweeps as they happen then gives you a rating on how much momentum the reversal has.

Volume Flow Anatomy [Kodexius]Volume Flow Anatomy is a dynamic, multi-dimensional volume map that reconstructs how buy, sell, and “stealth” activity is distributed across price rather than just across time. Instead of relying on a static, session-based volume profile, it uses an exponentially decaying memory of recent bars to build a constantly evolving “anatomy” of the auction, where each price level carries an adaptive history of order flow.
The script separates buy vs. sell pressure, adds a third “Stealth Flow” dimension for low-volume price movement (ease of movement / divergence), and automatically derives POC, Value Area, imbalances, absorption zones, and classic profile shapes (D, P, b, B). This gives the trader a compact but highly information-dense map on the right side of the chart to read control (buyers vs. sellers), structure (balanced vs. trending vs. double distribution), and key reaction levels (support/resistance born from flow, not just wicks).
🔹 Features
🔸 Dynamic Lookback with Decay
- The script computes an effective lookback N from the Decay Factor and caps it with Max Lookback.
- Higher decay keeps more history; lower decay emphasizes the most recent flow.
- The profile continuously adapts as new bars are printed.
🔸 Price-Bucketed Flow Map
Each bucket accumulates:
- Sell Flow (sell pressure)
- Buy Flow (buy pressure)
- Stealth Flow (low-volume price movement)
- Box width at each bucket is proportional to the relative intensity of that component.
🔸 Stealth Flow (Low-Volume Price Movement)
- Measures close to close movement relative to volume, emphasizing price movement that occurs on comparatively low volume.
- Helps reveal hidden participation, inefficient moves, and areas that may be vulnerable to re-tests or reversions.
🔸 POC & 70% Value Area (VA)
- Identifies the Point of Control (price bucket with the highest total volume) over the effective lookback.
- Builds a 70% Value Area by expanding from POC towards the nearest high volume neighbors until 70% of the total volume is included.
- POC is drawn as a line over the analyzed range; VA is displayed as a shaded band in the profile area.
🔸 Market Profile Shape Detection
Splits the profile vertically into three zones (bottom / middle / top) and compares their volume distribution.
Classifies structure as:
- D-Shape (Balanced)
- P-Shape (Short Covering)
- b-Shape (Long Liquidation)
- B-Shape (Double Distribution)
Displays a shape label with color coded bias for quick auction context interpretation.
🔸 Imbalance Zones & Absorption
Imbalance: detects buckets where Buy Flow or Sell Flow exceeds the opposite side by at least Imbalance Ratio.
Absorption: flags zones with high volume but low price “ease”, where price is not moving much despite significant volume.
Extends these levels into horizontal zones, marking potential support/resistance and trap areas.
Bullish Imbalance Zone :
Bearish Imbalance Zone :
Absorption Zone :
🔸 Range Context & On-Chart Legend
Draws a Range Box covering the dynamically determined lookback (N bars), with a label displaying the effective bar count.
A bottom-right legend summarizes:
- Color keys for Buy / Sell / Stealth
- POC / VA status
- Bullish vs. Bearish dominance percentage
- Profile shape classification
- Imbalance and Absorption conventions
🔹 Calculations
1. Dynamic Lookback & Price Buckets
int N = math.min(int(4 / (1 - decayFactor) - 1), maxHistory)
float priceHigh = ta.highest(high, N)
float priceLow = ta.lowest(low, N)
float bucketSize = (priceHigh - priceLow) / bucketCount
The effective lookback N is derived from the Decay Factor, using the approximation 4 / (1 - decay) to capture roughly 99% of the decayed influence, then capped with maxHistory to control performance. Over that adaptive range, the script finds the highest and lowest prices and divides the band into bucketCount equal slices (bucketSize). Each slice is a price bucket that will accumulate volume-flow information.
2. Exponentially Decayed Volume Allocation
addValue(array profile, float weight, float minPrice, float maxPrice) =>
for j = 0 to bucketCount - 1
float bucketMin = priceLow + j * bucketSize
float bucketMax = bucketMin + bucketSize
float overlapMin = math.max(minPrice, bucketMin)
float overlapMax = math.min(maxPrice, bucketMax)
float overlapRange = overlapMax - overlapMin
if overlapRange > 0
profile.set(j, profile.get(j) * decayFactor + weight * overlapRange)
This function is the core engine of the indicator. For a given price span and intensity, it checks every bucket for overlap, distributes the weight proportionally to the overlapping range, and before adding new value, decays the existing bucket content by decayFactor. This results in an exponentially weighted profile: recent activity dominates, while older levels retain a gradually fading footprint.
3. POC and 70% Value Area
array totalProfile = array.new(bucketCount, 0)
for j = 0 to bucketCount - 1
float total = sellProfile.get(j) + buyProfile.get(j)
totalProfile.set(j, total)
if total > eaMax
eaMax := total
int pocIdx = 0
float pocVal = 0.0
for j = 0 to bucketCount - 1
if totalProfile.get(j) > pocVal
pocVal := totalProfile.get(j)
pocIdx := j
float totalSum = totalProfile.sum()
float targetSum = totalSum * 0.70
int vaLow = pocIdx
int vaHigh = pocIdx
float currentSum = pocVal
while currentSum < targetSum and (vaLow > 0 or vaHigh < bucketCount - 1)
float lowVal = vaLow > 0 ? totalProfile.get(vaLow - 1) : 0.0
float highVal = vaHigh < bucketCount - 1 ? totalProfile.get(vaHigh + 1) : 0.0
First, totalProfile is built as the sum of buy and sell flow per bucket, and eaMax (the maximum total) is tracked for later normalization. The POC bucket (pocIdx) is simply the index with the highest totalProfile value.
To compute the 70% Value Area, the algorithm starts at the POC bucket and expands outward, each step adding either the upper or lower neighbor depending on which has more volume. This continues until the cumulative volume reaches 70% of totalSum. The result is a volume-driven VA, not necessarily symmetric around POC, which more accurately represents where the market has truly traded.
4. Market Profile Shape Classification
float volTopThird = 0.0
float volMidThird = 0.0
float volBotThird = 0.0
int thirdIdx = int(bucketCount / 3)
for j = 0 to bucketCount - 1
float val = totalProfile.get(j)
if j < thirdIdx
volBotThird += val
else if j < thirdIdx * 2
volMidThird += val
else
volTopThird += val
float totalVolShape = totalProfile.sum()
string shapeStr = "D-Shape (Balanced)"
if (volTopThird > totalVolShape * 0.20) and (volBotThird > totalVolShape * 0.20) and (volMidThird < totalVolShape * 0.50)
shapeStr := "B-Shape (Double Dist)"
else
if pocIdx > bucketCount * 0.5 and volTopThird > volBotThird * 1.3
shapeStr := "P-Shape (Short Covering)"
else if pocIdx < bucketCount * 0.5 and volBotThird > volTopThird * 1.3
shapeStr := "b-Shape (Long Liquidation)"
else
shapeStr := "D-Shape (Balanced)"
The profile is split into bottom, middle, and top thirds. The script compares how much volume is concentrated in each and combines that with the relative location of POC. If both extremes are heavy and the middle light, it labels a B-Shape (double distribution). If the POC is high and the top dominates the bottom, it’s a P-Shape (short covering). If the POC is low and the bottom dominates, it’s a b-Shape (long liquidation). Otherwise, it defaults to a D-Shape (balanced). This provides a quick, at-a-glance assessment of auction structure.
5. Imbalances, Absorption & Zones
bool isBuyImb = showImb and sVal > 0 and (bVal / sVal >= imbRatio)
bool isSellImb = showImb and bVal > 0 and (sVal / bVal >= imbRatio)
float volRatio = eaMax > 0 ? tVal / eaMax : 0
float stRatio = esmRange > 0 ? (stVal - esmMin) / esmRange : 1.0
bool isAbsorp = showAbsorp and volRatio > 0.6 and stRatio < 0.25
if showImbZone
if isSellImb
zoneBoxes.push(box.new(bar_index - N + 1, bucketHi, bar_index + 1, bucketLo, ...))
if isBuyImb
zoneBoxes.push(box.new(bar_index - N + 1, bucketHi, bar_index + 1, bucketLo, ...))
if isAbsorp
zoneBoxes.push(box.new(bar_index - N + 1, bucketHi, bar_index + 1, bucketLo, ...))
Imbalances are identified where one side’s volume (buy or sell) exceeds the other by at least Imbalance Ratio. These buckets are marked as buy or sell imbalance zones, indicating aggressive participation from one side.
Absorption is detected by combining a high volume ratio (volRatio) with a low normalized stealth ratio (stRatio). High volume with limited price movement suggests that opposing orders are absorbing flow at that level. Both imbalance and absorption buckets are extended into horizontal zones from the start of the lookback to the current bar, visually emphasizing key support/resistance and liquidity areas.
6. Building Buy, Sell & Stealth Profiles
sellProfile := array.new(bucketCount, 0)
buyProfile := array.new(bucketCount, 0)
stealthProfile := array.new(bucketCount, 0)
Three arrays are used to store Sell Flow, Buy Flow, and Stealth Flow. Bars are processed from oldest to newest so that decay is applied in correct chronological order. For each bar, a volume density (volume / range) is calculated and distributed across the candle range. Bull candles feed buyProfile, bear candles feed sellProfile.
Stealth Flow computes the close-to-close move between consecutive bars, scaled by 1 / (1 + volume). Big moves on low volume produce high stealth values, which are then allocated across the move’s price span into stealthProfile. This yields a three-layer profile per price level: directional volume and stealthy price movement.

Key Levels: Monday / Weekly / Monthly + Year/Quarter + LiquidityKey Levels: Monday / Weekly / Monthly / Year / Quarter + Liquidity

FVG [Stansbooth]Fair Value Gap (FVG) Indicator
Spot Institutional Imbalances. Trade the Rebalance.
Fair Value Gaps reveal where price moved so aggressively that it left behind untraded zones—areas where smart money is likely to return.
What It Detects
Bullish FVG : Gap between Candle 1's high and Candle 3's low — expect price to retrace here for longs
Bearish FVG : Gap between Candle 1's low and Candle 3's high — watch for shorts on the pullback
Why Traders Love It
Markets hate inefficiency. When price rockets through a zone without proper auction, it creates a magnet for future price action. This indicator automatically identifies these imbalances so you can anticipate high-probability reversal and continuation zones.
Features
Auto-detection of bullish and bearish FVGs
Customizable gap visualization
Works on all timeframes and instruments
Clean, non-repainting logic
Best Used With
Order blocks, liquidity sweeps, and market structure breaks for confluence-based entries aligned with ICT and smart money concepts.
Trade where institutions trade. Let price come to you.

[iQ]PRO Market Sessions+🌐 PRO Market Sessions+: The Architecture of Market Time
Elevate your market analysis with the PRO v1 Time Cycles indicator—a sophisticated, proprietary framework engineered to meticulously map and visualize critical, high-probability time segments across global trading sessions. This tool transcends conventional session highlighting by providing a multi-layered, time-boxed view of market behavior, offering unparalleled clarity on structural shifts and key price levels.
This tool is optimized for professional traders, providing an edge by focusing on the fractal nature of market timing.
⏳ Precision Time Segmentation
The core functionality revolves around the hyper-precise segmentation of the trading day, anchored to the New York (EST) timezone to capture institutional flow.
Global Overlap Coverage: Integrates key Asia and London sessions with the comprehensive New York trading day, allowing for the analysis of transitional volatility and overlap strategies.
Structured Cycles: Deploys a unique system of 270-minute cycles, nested with 90-minute and 30-minute subdivisions. This hierarchical structure reveals how market structure evolves from macro-sessions down to critical, granular pivots.
New York Focus: Features distinct AM and PM 270-minute cycles, further broken down into 90-minute tranches (AM1, AM2, AM3 / PM1, PM2, PM3) and fine-tuned with 30-minute and even 10-minute boxes for exceptional high-resolution analysis.
London Depth: The London session is captured as a 270-minute block, with its own nested 90/30-minute structures, providing a complete view of the European market's structural integrity before the US open.
✨ Dynamic Structural Analysis
Beyond mere visualization, the indicator computes and projects critical structural levels within each time box, acting as dynamic reference points for price action.
Dynamic Price Anchors: Each time-cycle box is calculated to reveal key price metrics, including the Open Price and the Equilibrium (EQ) Level (Mid-Range). These lines serve as potent technical levels, often representing institutional reference points for deviation and reversion.
High/Low Capture: The extreme High and Low of each significant time segment are captured and marked, forming the boundaries of the structural range and identifying potential areas of liquidity draw.
Persistent Levels: Projects Previous Day, Week, and Month High/Low levels. These crucial historical benchmarks act as magnets or barriers to current price movement, providing essential macro-context to intra-day analysis.
🎨 Customizable & Non-Intrusive
The PRO v1 Time Cycles is designed for seamless integration into any chart setup, offering extensive customization without cluttering the price action.
Control over Granularity: Users maintain complete control over which time cycles (270, 90, 30, 10-minute) are displayed, ensuring the chart reflects the specific trading strategy and timeframe required.
Aesthetic Flexibility: Features highly detailed options for color, border styles, text alignment, and line thickness for every major session and nested cycle, allowing for a fully personalized and professional workspace.
This tool is a fundamental component of the iQ PRO suite, providing the essential temporal context required to execute sophisticated, time-based trading strategies. Its robust architecture is built to empower the discerning trader with a clearer, more structured view of the market's inner workings.

Trend Mastery:The Calzolaio Way🌕 Find the God Candle. Capture the gains. Create passive income.
Fellow F.I.R.E. Decibels, disciples of the Calzolaio Way—welcome to the sacred toolkit. This indicator, "SulLaLuna 💵 Trend Mastery:The Calzolaio Way🚀," is forged from the elite SulLaLuna stack, drawing wisdom from Market Wizards like Michael Marcus (who turned $30k into $80M through disciplined trend riding) and Oliver Velez's pristine strategies for profiting on every trade. It's not just lines on a chart—it's your architectural blueprint for financial sovereignty, where data meets divine timing to build the cathedral of Project Calzolaio.
We trade math, not emotion. We honor timeframes. Confluence is King. This indicator deploys the Zero-Lag SMA (ZLSMA), Hull-based M2 (global money supply as a macro trend oracle), ATR-smart stops, and multi-TF alignments to ritualize God Candle setups. Backtested across asset classes, it's modular for your playbooks—small risks, compounding gains, passive income streams.
Why This Indicator is Awesome: The Divine Confluence Engine
In the spirit of "Use Only the Best," this tool synthesizes proven SulLaLuna indicators like ZLSMA, Adaptive Trend Finder, and Momentum HUD with Velez's lessons on trend reversals, support/resistance, and psychology of fear. Here's why it reigns supreme:
1. Global M2 Hull: Macro Trend Oracle
Scaled M2 (summed from major economies like US, EU, JP) via Hull MA captures the "big picture" (Velez Ch. 2). It flips colors as S/R—green for support (bullish bounce zones), red for resistance (bearish ceilings), orange neutral. Like Marcus spotting commodity booms, it signals when liquidity sweeps ignite God Candles. Extend it for future price projections, honoring "How a Trend Ends" (Velez Ch. 5).
2. ZLSMA + ATR Smart Stops: Surgical Precision
Zero-Lag SMA (faster than standard MAs) crosses M2 for entries, with ATR bands for initial stops (2x mult) and trails (1x mult). This embodies "Trade Small. Lose Smaller."—risk ≤1-2% per trade, pre-planned exits. Flip markers (↑/↓) alert divine timing, filtering noise like Velez's "First Pullback" setups.
3. HTF & Multi-TF Dashboard: Timeframe Alignments are Sacred
Show HTF M2 (e.g., Daily) with custom styles/colors. Multi-TF lines (4H, D, W, M) dash across your chart, labeled right-edge with 🚀 (bull) or 🛸 (bear). A confluence table (top-right) scores alignments: Strong Bull (≥3 green), Strong Bear, or Mixed. This is "Confluence is King"—no single signal rules; seek 4+ star scores like Rogers buying value in hysteria.
4. Background & Ribbon: Visual Divine Guidance
Slope-based bgcolor (green bull, red bear) for at-a-glance bias. M2 Ribbon (EMA cloud) flips triangles for macro shifts, ritualizing climactic reversals (Velez Ch. 7).
5. Composite Probability: High-Prob God Candle Hunter
Scores (0-100%) blend 8 factors: price/ZLSMA vs M2, TF slopes, ribbon. Threshold (70%) + pivot zone (near M2/ATR) + optional cross filters for HP signals. Labels show "%" dynamically—alerts fire when confluence ≥4, echoing Schwartz's champion edge: "Everybody Gets What They Want" (Seykota wisdom).
6. Alerts & Rituals Built-In
M2 flips, entries/exits, HP longs/shorts—log them in your journal. Weekly reviews dissect anomalies, as per our Operational Framework.
This isn't hype—it's audited excellence. Backtest it: High confluence crushes drawdowns, compounding like Bielfeldt's T-bond mastery from Peoria. We build together; share wins in the F.I.R.E. Decibel forum.
Suggested Strategy: The SulLaLuna M2 Confluence Playbook
Honor the Risk Triad: Position ↓ if leverage/timeframe ↑; scale ↑ only on ≥4 confluence. Align with "God Candle" hunts—rare explosives reverse-engineered for passive streams.
1. Pre-Trade Checklist (Before Every Entry)
- Trend Alignment: D/4H/1H M2 slopes agree? Table shows Strong Bull/Bear?
- Signal on 15m: ZLSMA crosses M2 in confluence zone (near pivot/ATR bands).
- Volume + Divergence**: Supported by volume (use HUD if added); score ≥70%.
- SL/TP Setup: ATR-based stop; TP at structure/2-3R reward (Velez Reward:Risk).
- HTF Agrees: Monthly bull for longs; avoid counter-trend unless climactic (Ch. 7).
Confluence Score: Rate 1-5 stars. <3? Stand aside. Log emotional state—no adrenaline.
2. Execution Protocol
- Entry: On HP Long/Short triangle (e.g., ZLSMA > M2, score 80%+, monthly bull). Use limits; favor longs above M2 support.
- Position Size: ≤1-2% risk. Example: $10k account, 1% risk = $100 SL distance → size accordingly.
- Trail Stops: Move to trail band after 1R profit; let winners run like Kovner's world trades.
- Asset Classes**: Forex/stocks/crypto—test M2's macro edge on EURUSD or NASDAQ (Velez Ch. 6 reviews).
Ritualize: "When we find the God Candele, we don’t just ride it—we ritualize it." Screenshot + reason.
3. Post-Trade Ritual
- Document: Result, confluence score, lessons. Update journal.
- Exits: Hit stop/exit cross? Or trail locks gains.
- Weekly Audit: Wins/losses, anomalies. Adjust params (e.g., M2 length 55 default).
4. Risk Triad in Action
- Low TF (15m)? Smaller size.
- High Leverage? Tiny positions.
- Confluence ≥4 + HTF support? Scale hold for passive compounding.
Example Setup: God Candle Long
- Chart: 15m EURUSD.
- M2 Hull green (support), ZLSMA crossover, 4H/D/W bull (table: Strong Bull).
- HP Long (85% score) near pivot.
- Entry: Limit at cross; SL below ATR lower; TP at next resistance.
- Outcome: Capture 2R gain; trail for more if trend day (Velez Ch. 5).
Community > Ego: Test, share signals in Discord. Backtest in Pine Script for algo evolution.
We are architects of redemption. Each trade bricks the cathedral. Trade the micro, flow with the macro. When alignments converge, we act—with discipline, data, and divine purpose.

ETH/USDT Advanced Liquidity + TrendAuto-detect high-volume nodes (liquidity zones) using a simple proxy method.
Combine trend confirmation from multiple timeframes (Daily + 4H).
Mark dynamic support/resistance zones.

amir Liquidity Sweeps [amir]this indicator is from luxalgon i think this is the code that made this incdicator never get destroyed by aanyone

Bitcoin vs M2 Global Liquidity (Lead 3M) - Table Ticker═══════════════════════════════════════════════════════════════
Bitcoin vs M2 Global Liquidity - Regression Indicator
═══════════════════════════════════════════════════════════════
TECHNICAL SPECS
• Pine Script v6
• Overlay: false (separate pane)
• Data sources: 5 M2 series + 4 FX pairs (request.security)
• Calculation: Rolling OLS linear regression with configurable lead
• Output: Regression line + ±1σ/±2σ confidence bands + R² ticker
CORE FUNCTIONALITY
Aggregates M2 money supply from 5 central banks (CN, US, EU, JP, GB),
converts to USD, applies time-lead, runs rolling linear regression
vs Bitcoin price, plots predicted value with confidence intervals.
CONFIGURABLE PARAMETERS
Input Controls:
• Lead Period: 0-365 days (default: 90)
• Lookback Window: 50-2000 bars (default: 750)
• Bands: Toggle ±1σ and ±2σ visibility
• Colors: BTC, M2, regression line, confidence zones
• Ticker: Position, size, colors, transparency
Advanced Settings:
• Table display: R², lead, M2 total, country breakdown (%)
• Ticker customization: 9 position options, 6 text sizes
• Border: Width 0-10px, color, outline-only mode
DATA AGGREGATION
Sources (via request.security):
• ECONOMICS:CNM2, USM2, EUM2, JPM2, GBM2
• FX_IDC:CNYUSD, JPYUSD (others: FX:EURUSD, GBPUSD)
• Conversion: All M2 → USD → Sum / 1e12 (trillions)
REGRESSION ENGINE
• Arrays: m2Array, btcArray (dynamic sizing, auto-trim)
• Window: Rolling (lookbackPeriod bars)
• Lead: Time-shift via array indexing (i + leadPeriodDays)
• Calc: Manual OLS (covariance/variance), no built-in ta functions
• Outputs: slope, intercept, r2, stdResiduals
CONFIDENCE BANDS
±1σ and ±2σ calculated from standard deviation of residuals.
Fill zones between upper/lower bounds with configurable transparency.
ALERTS
5 pre-configured alertcondition():
• Divergence > 15%
• Price crosses ±1σ bands (up/down)
• Price crosses ±2σ bands (up/down)
TICKER TABLE
Dynamic table.new() with 9 rows:
• R² value (4 decimals)
• Lead period (days + months)
• M2 Global total (trillions USD)
• Country breakdown: CN, US, EU, JP, GB (absolute + %)
• Optional: Hide/show M2 details
VISUAL CUSTOMIZATION
All plot() elements support:
• Color picker inputs (group="Couleurs")
• Line width: 1-3px
• Transparency: 0-100% for zones
• Offset: M2 plot has +leadPeriodDays offset option
PERFORMANCE
• Max arrays size: lookbackPeriod + leadPeriodDays + 200
• Calculations: Only when array.size >= lookbackPeriod + leadPeriodDays
• Table update: barstate.islast (once per bar)
• Request.security: gaps_off mode
CODE STRUCTURE
1. Inputs (lines 7-54)
2. Data fetch (lines 56-76)
3. M2 aggregation (line 78)
4. Array management (lines 84-95)
5. Regression calc (lines 97-172)
6. Prediction + bands (lines 174-183)
7. Plots (lines 185-199)
8. Ticker table (lines 201-236)
9. Alerts (lines 238-246)
DEPENDENCIES
None. Pure Pine Script v6. No external libraries.
LIMITATIONS
• Daily timeframe recommended (1D)
• Requires 750+ bars history for optimal calculation
• M2 data availability: TradingView ECONOMICS feed
• Max lines: 500 (declared in indicator())
CUSTOMIZATION EXAMPLES
• Shorter lookback (200d): More reactive, lower R²
• Longer lookback (1500d): More stable, regime mixing
• No bands: Set showBands=false for clean view
• Different lead: Test 60d, 120d for sensitivity analysis
TECHNICAL NOTES
• Manual OLS implementation (no ta.linreg)
• Array-based lead application (not plot offset)
• M2 values stored in trillions (/ 1e12) for readability
• Residuals array cleared/rebuilt each calculation
OPEN SOURCE
Code fully visible. Modify, fork, analyze freely.
No hidden calculations. No proprietary data.
VERSION
1.0 | November 2025 | Pine Script v6
═══════════════════════════════════════════════════════════════

Net Liquidity (WALCL - TGA - ON RRP)//@version=5
indicator("Net Liquidity (WALCL - TGA - ON RRP)", overlay=false, timeframe="W")
a = request.security("FRED:WALCL", "W", close) // Fed total assets (millions)
b = request.security("FRED:WTREGEN", "W", close) // TGA (millions)
c = request.security("FRED:RRPONTSYD","W", close) // ON RRP (millions)
netliq = (a - b - c) / 1000.0 // billions
plot(netliq, color=color.new(color.blue, 0), linewidth=2)

Break & Retest + Liquidity Sweep EntryIdentify a BOS (vertical line appears).
Wait for price to retest the broken level (circle shows up).
Optionally confirm with liquidity sweep.
Enter long/short trades based on bullish/bearish retest signals.
Use ATR or personal risk management for stop-loss placement.

POC Volume Bar (Highest Volume in Range)What the highlighted POC bar means
🔶 1. Institutional interest
A POC often identifies where big money stepped in.
🔶 2. Support or resistance pivot
Large volume often signals:
• A reversal
• A breakout
• Or the beginning of a trend
🔶 3. Liquidity magnet
Price tends to revisit high-volume bars.
They act like magnets.
🔶 4. Trend confirmation or exhaustion
High volume on:
• Green candle → bullish participation
• Red candle → distribution / aggressive selling

Slippage Liquidity IndicatorSlippage's Proprietary Indicator - find and mark out resting liquidity before NY Market Open.

Multiple Liquidity ChannelsSame as liquidity channels but 25 / 50 / 75 levels in the same indicator.


BTC LL->HH Liquidity Sweep / BOS / Retest / 4H Bias v6_8BTC LL->HH Liquidity Sweep / BOS / Retest / 4H Bias v6_8

Buy vs Sell Liquidity + Difference (Bottom Right)Script Summary (Short Notes)
⚙️ Purpose
Tracks and displays Buy Volume vs Sell Volume difference during the day, based on candle direction.
Useful for spotting liquidity imbalance between buyers and sellers.
📊 How It Works
Volume Classification
If close > open → counts volume as Buy Volume
If close < open → counts volume as Sell Volume
Aggregation Timeframe
You can select a timeframe (1, 2, 3, 5, 15, 30 mins)
Script recalculates data from that aggregation level.
Daily Reset
At the start of a new trading day, totals reset to zero.
Cumulative Calculation
Adds all buy/sell volumes as the day progresses.
Calculates:
Total Volume
Difference (BUY − SELL)
Percentages (%)

Smart Money Concepts Pro – OB, FVG, Liquidity + Trade SetupsThis script is a complete Smart Money Concepts (SMC) toolkit designed for traders who want clean and actionable charts without clutter.
It combines the most important institutional concepts into one indicator:
Order Blocks (OB): auto-detection of bullish and bearish order blocks with mitigation tracking, merging and TTL (time-to-live).
Fair Value Gaps (FVG): automatic gap recognition with size filters, mitigation tracking and lifetime control.
Liquidity Pools (EQH/EQL): equal highs and equal lows marked with tolerance (ATR-based or fixed).
Break of Structure (BOS): up/down structure shifts plotted directly on the chart.
Multi-Timeframe (HTF): option to use higher timeframe data (e.g. H4, Daily) for stronger zones.
Trend Filter: show zones only in the direction of market structure.
Trade Setups: automatic signals for OB Retest + Trend setups, with entry, stop-loss and take-profit levels (custom R-R).
Flexible Zone Extension: choose between extending zones to the live bar or fixed box width for a cleaner look when scrolling.
Features
Fully customizable (pivot length, ATR filters, box width, TTL, zone colors)
Separate presets for Scalping, Intraday, Swing trading styles
Visual trade planning with entry/SL/TP lines and optional labels
Works across all markets (crypto, forex, indices, stocks)
How to use
Bias: identify overall direction (BOS + HTF zones).
Wait: for price to return to an unmitigated OB or FVG.
Entry: take the setup signal (OB retest + trend filter).
Risk: stop-loss at opposite OB boundary.
Target: TP based on chosen R-R multiple (default 2R).
⚡ Whether you scalp short-term moves or swing trade HTF zones, this indicator gives you a clear institutional edge in spotting supply/demand imbalances and high-probability setups.

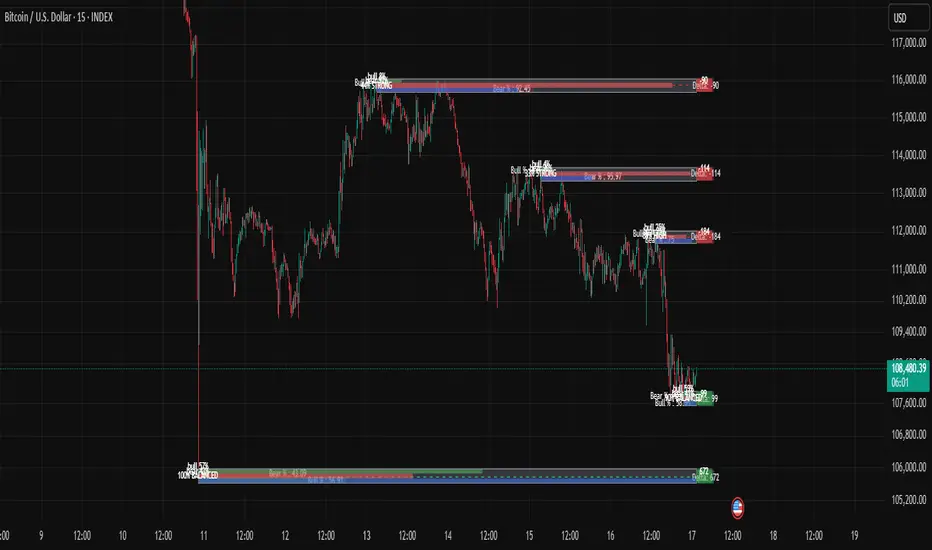
Mimic liquidity Order Blocks Modifiedits help to find liquidity order block and the bull bear percentage also delta
Stop Hunt Candlesticks (Liquidity Wicks)🕯️ Stop Hunt Candlesticks
Wick Highlighter – Spot Extreme Wicks Instantly
This indicator highlights candles where the upper or lower wick exceeds a customizable percentage of the asset’s price — perfect for quickly spotting strong rejections, liquidity grabs, stop hunts or exhaustion moves.
💡 Key Features
Visual Background Highlight: Automatically colors the chart background when a wick surpasses your defined % threshold (default 1%).
Customizable Threshold: Adjust wick sensitivity to suit different assets or timeframes.
Upper & Lower Wick Filters: Choose whether to track upper wicks, lower wicks, or both.
Dynamic Price Basis: Compare wick size relative to Close, Open, HL2, or OC2.
Optional Labels: Display the exact wick percentage directly on the chart.
Alerts Ready: Get notified whenever a candle shows an extreme wick condition.
⚙️ How It Works
The script measures each candle’s wick size relative to your chosen price basis:
Upper wick % = (High − max(Open, Close)) / Basis × 100
Lower wick % = (min(Open, Close) − Low) / Basis × 100
If the result exceeds your chosen threshold, the chart background changes color.
Red for upper wicks, green for lower wicks by default.
🎯 Use Cases
Identify strong rejections or stop hunts near key levels.
Confirm price exhaustion or potential reversals.
Filter fake breakouts or high-volatility events.
🧩 Customization
Tweak colors, transparency, and label visibility to fit seamlessly into your chart setup.

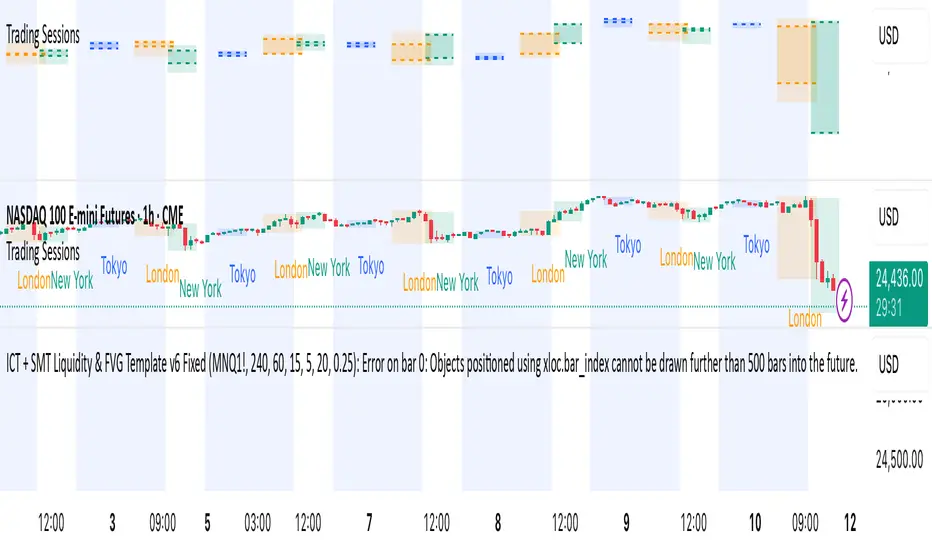
ICT + SMT Liquidity & FVG Template mnqict concepts with smt divergence for mnq. marking out liquidity sweeps, sessions, highs and lows.