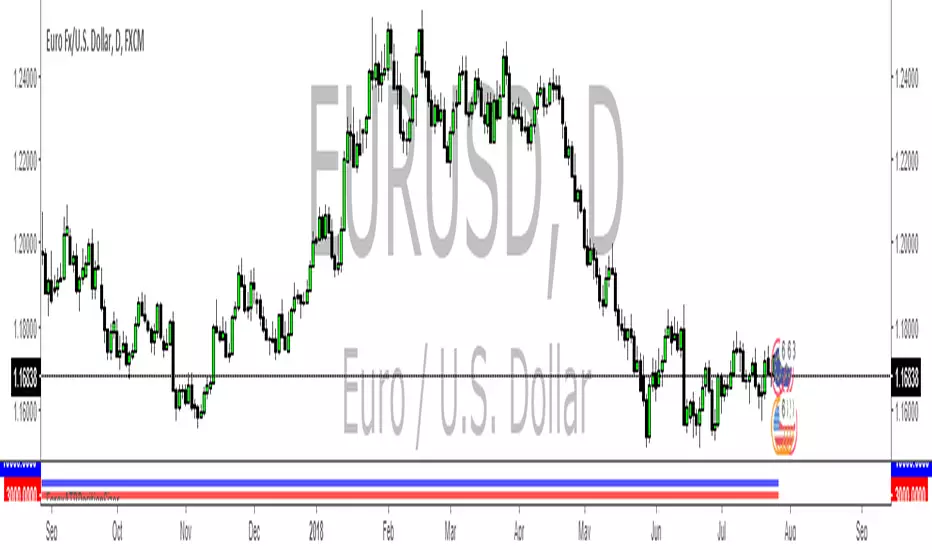
ATRPositionSizerThe ATR Position sizer allows the trader to size Forex and Equity positions based on how much % movement in equity is allowed within a predefined ATR range period.
Current default settings are:
The calculated trade size = N*ATR Movement = % Up/Down Movement in Equity = 1 Unit
N is an ATR multpile.
ATR time frame is defaulted to weekly and can be changed.
% Unit Risk is set to 0.5 and can be changed.
The ATR position sizer plots the recommended trade size (green) and equity line (blue).
A maximum allowed capital allotment to any given trade can also be specified in terms of %. If trade size exceeds max capital allocation, the trade size line turns red.
This type of sizing approach is useful when managing a portfolio of assets.
ابحث في النصوص البرمجية عن "liquidity"

ForexATRPositionSizerThis script allows me to size up my trades based on account size and ATR. Default is Weekly ATR.
Inputs:
1) Account Size
2) % Unit of Risk
3) ATR Time Frame
4) ATR Period
5) ATR Multiple
The indicator will calculate a trade size for you (1000 = 0.01 lots) across all pairs adjusted by ATR.
1 Unit of Risk (%) is equivalent to ATR Multiple * ATR Weekly of movement.
For example:
Assume you have a 10000 dollar account.
You equate 1% of Equity to N*ATR of movement on weekly chart.
Suppose N*ATR = 100 pips.
Therefore, your trade size will equate to 0.1 lots.
This allows the trader to equalize the effect of equity fluctuations relative to any one given pair.

rb-vwapDeveloper: Andrew Palladino + Rob Booker.
Description: Allows to plot multiple volume weighted moving average lines that start a specified day/time. Currently supports a weekly and monthly VWAP.
1) The Weekly VWAP starts the calculation at a specific time of the week. Default is set to Monday.
2) The Monthly VWAP starts the calculation at a specific time of the month. Default is set to 1.

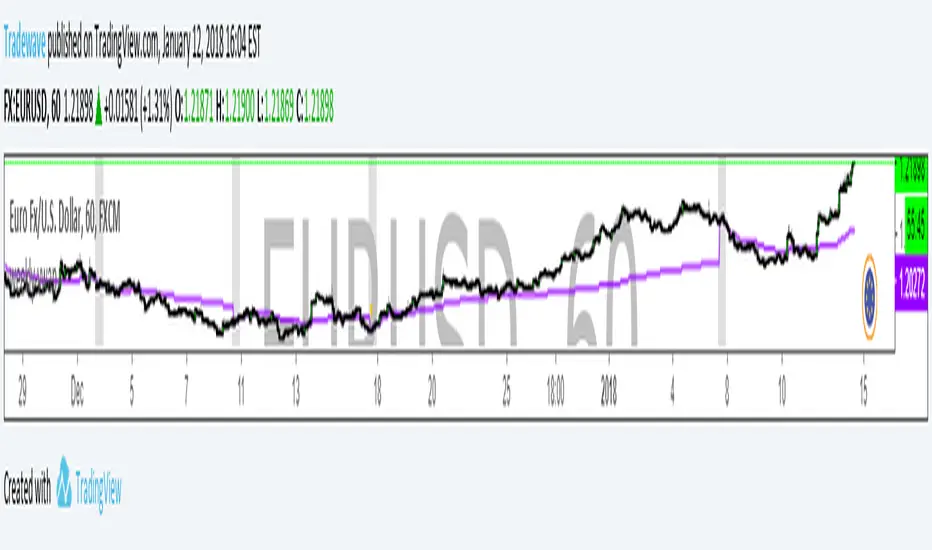
weekly-vwapAuthor: Andrew Palladino
Date: 1/12/2016
Description: Volume Weighted Moving Average calculated weekly on the start of a specified week day. Default is set to Sunday.
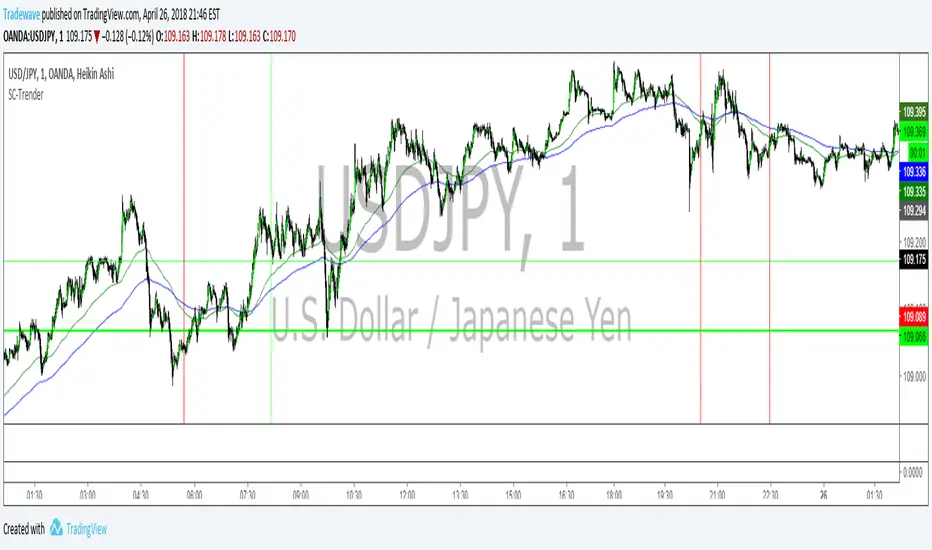
3XLTTrendSignalTriple Long Term Trend Signal
Author: Andrew Palladino
Date: 1/12/2018
Description: The indicator identifies the long term trend alignment on 3 user defined higher time frames.
The indicator will turn green when 3 higher time frames (4H, D, W) are perfectly aligned in an uptrend.
The indicator will turn red when 3 higher time frames (4H, D, W) are perfectly aligned in a downtrend.
The indicator will turn blue when there is not a perfect alighment acrooss 4H, D, W.
The 3 time frames can be changed and customized via the input dialog box.
The transitions between the three states will not change when moving to lower time frames. This enables a lower time frame trader to always know what the higher time frame charts are doing regardless of what time frame the indicator is painting on.

Sharky Reversal IndicatorAuthor: Tradewave
Date: 12/16/2017
Description:
Identifies key reversal area on any time frame. The indicator is based on pure price action and an oscillator.

DayOfWeekAuthor: Andrew Palladino
Date: 12/16/2017
This indicator will shade the background to a specified color based on a chosen day of the week.
1 = Sunday
2 = Monday
3 = Tuesday
4 = Wednesday
5 = Thursday
6 = Friday

SQZMIA modified version of Squeeze Momentum Indicator by Lazy Bear. This one has an alert for Squeeze On Alert Condition.

SwingHighLowPointsAndrew Palladino
12/15/2017
Easily identify swing high and low points on a chart by control the number of bars on the left and on the right of a high/low candle.

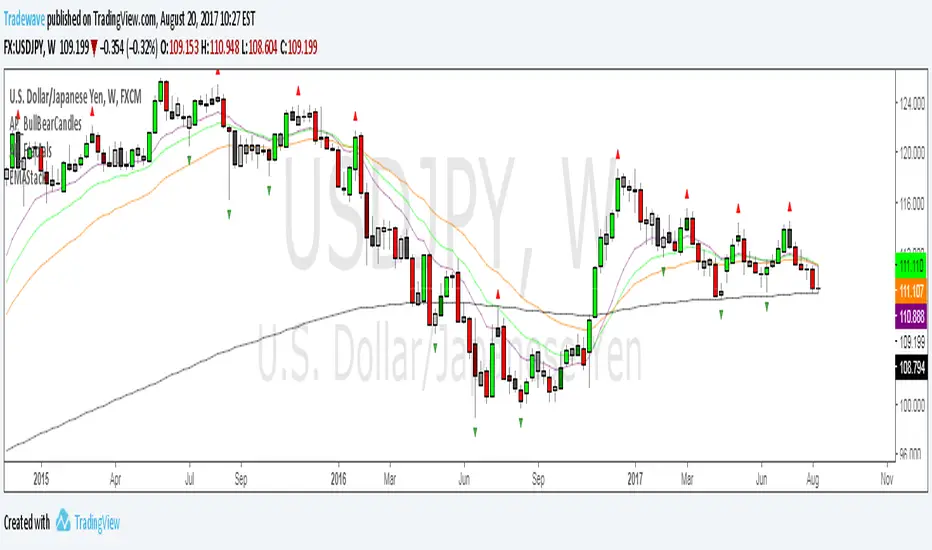
AP_BigLevelTrackerAuthor: Andrew Palladino
Date: 11/3/2017
Description:
Automatically alerts the trader when price is nearing a big level on a higher time frame. Default is set to Weekly and can be changed to any other time frame of choice.
For example: USDJPY 11/3/2017
Current timeframe is m15.
The indicator will add text "BL" above or below the candles when nearing a big level on a weekly time frame. BL = Big Level
This indicator will be soon available under the RobBooker Indicator package.

BigThree//Owner: Indicator Owner: Ben Losier
//Implemented by: Andrew Palladino
//Date Modified: 6/30/2017

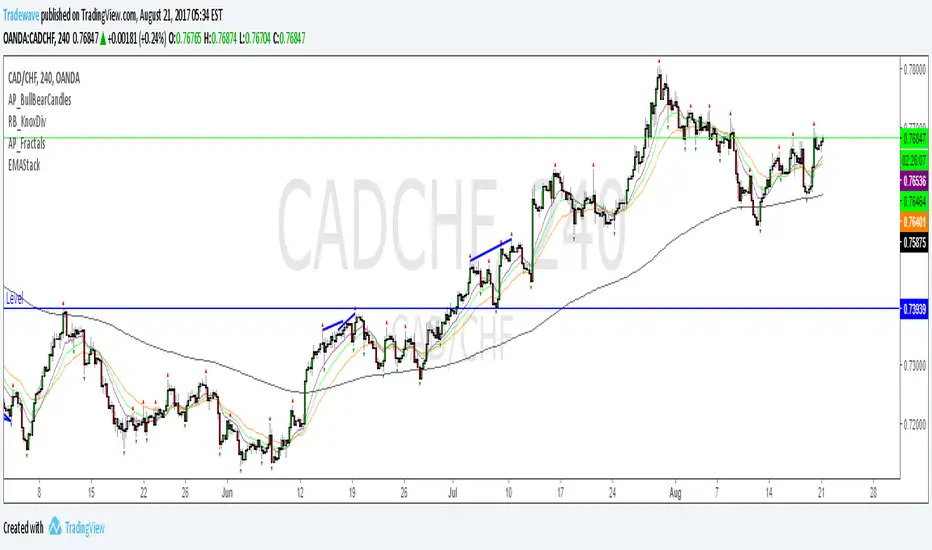
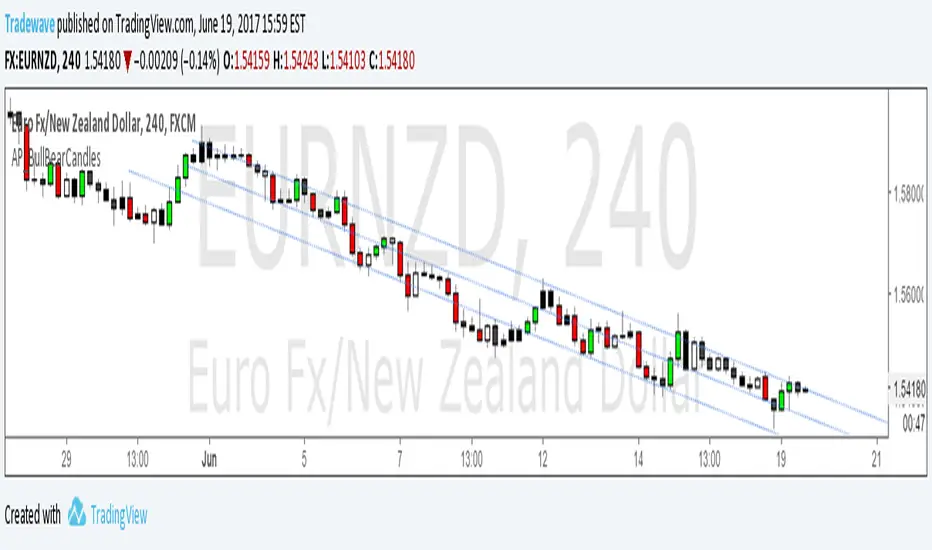
AP_BullBearCandles//Creator: Andrew Palladino
//Modified: 6/19/2017
//Description:
//Colors bar based on Bullish/Bearish Strength of each candlestick.
//Bullish candles are green and occur when the candle closes in the top range of the current candle and above the highest high of the last n bars.
//Bearish candles are red and occur when the candle closes in the bottom range of the current candle and below the lowest low of the last n bars.
//Any candles that are not bullish or bearish are colored white for up candles and black for down candles.
//The user has the ability to change the look back period of the High Low range.
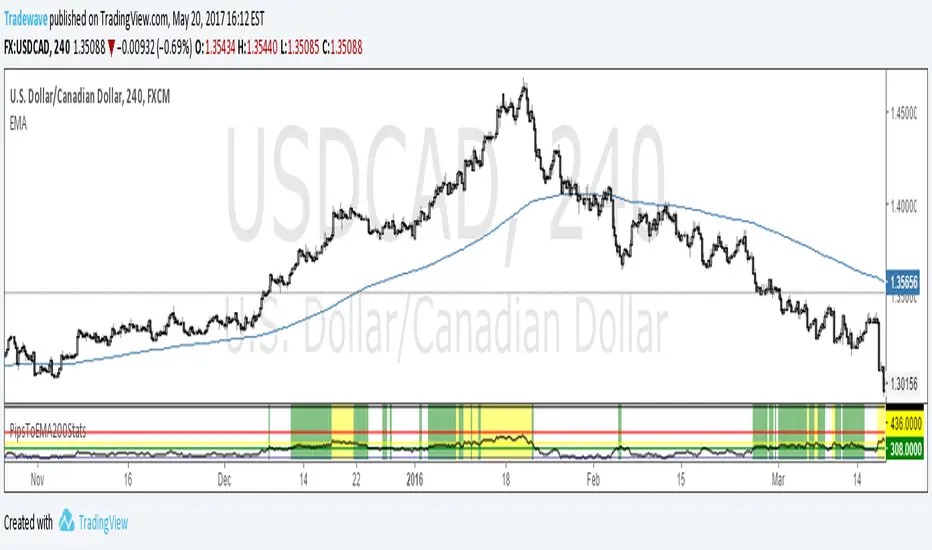
PipsToEMA200StatsV1.0Creator: Andrew Palladino
Date: 5/20/2017
Description:
Plots distance in pips to 200 EMA .
Displays thresholds for vertical pip distance to 200 EMA calculated from 10 years worth of historical data.
Currently only working the following pairs:
"AUDCAD", "AUDCHF", "AUDJPY", "AUDNZD", "AUDSGD", "CADCHF", "CADJPY", "CHFJPY", "CHFSGD", "EURAUD", "EURCAD", "EURGBP", "EURJPY", "EURMXN", "EURNOK", "EURNZD", "EURUSD", "GBPAUD", "GBPCAD", "GBPCHF", "GBPJPY", "GBPNZD", "GBPNZD", "GBPUSD","NZDCAD", "NZDCHF", "NZDJPY", "NZDUSD", "USDCAD", "USDCHF", "USDJPY", "USDMXN"
Currently only working for the following time frames: m5, m15, h1, h4.
Current thresholds are set to:
90th percentile (green line)
95th percentile (yellow line)
99th percentile (orange line)
100th percentile (black line)
The oscillator measures vertical pip distance to 200 EMA . (BLACK LINE)
The trader has the ability to turn on/off the 4 thresholds in input properties.
The indicator background will turn green when pip distance is above green threshold and below yellow threshold.
The indicator background will turn yellow when pip distance is above yellow threshold and below red threshold.
The indicator background will turn red when pip distance is above red threshold
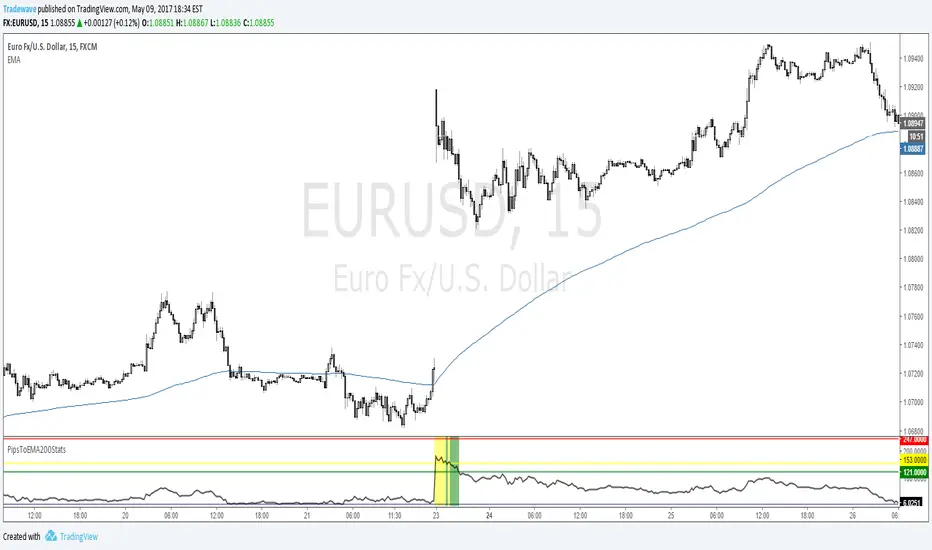
PipsToEMA200StatsTest Script:
Creator: Andrew Palladino
Date: 5/9/2017
Description:
Plots distance in pips to 200 EMA .
Displays thresholds for vertical pip distance to 200 EMA calculated from 10 years worth of historical data.
Currently only working ONLY with EURUSD 0.11% and AUDNZD 0.03% m15 time frames.
Will expand to all other pairs and time frames.
Current thresholds are set to:
90th percentile (green line)
95th percentile (yellow line)
99th percentile (orange line)
100th percentile (black line)
The oscillator measures vertical pip distance to 200 EMA . (BLACK LINE)
The trader has the ability to turn on/off the 4 thresholds in input properties.
The indicator background will turn green when pip distance is above green threshold and below yellow threshold.
The indicator background will turn yellow when pip distance is above yellow threshold and below red threshold.
The indicator background will turn red when pip distance is above red threshold
THIS INDICATOR IS IN TEST MODE.
RSI5 Multiple Time Frame Overbought Oversold Indicator
Created by Andrew Palladino.
Modified: 04/01/2017
Checks overbought or oversold conditions across 5 time frames.
If Time frame 1, 2 and 3 are all overbought then bar color changes to red
If Time frame 1, 2 and 3 are all oversold then bar color changes to green
If Time frame 1, 2, 3, 4 and 5 are all overbought then a vertical red line is added to the plot
If Time frame 1, 2, 3, 4 and 5 are all oversold then a vertical green line is added to the plot
The user has the ability to change:
1) Any of the 5 time frames (Set in minutes: m5 = 5, m15 = 15, h1 = 60, h4 = 240, D = 1440...)
2) RSI overbought threshold Level
3) RSI oversold threshold Level
4) RSI Period
The user has the ability to set alerts.

EMABarCountCreator: Andrew Palladino
Date: 4/13/2017
Description:
The indicator counts the total number of bars since a price touch of a target exponential moving average.
The background will change color when 3 different bar count thresholds are exceeded.
1) Green = 200 <= bar count < 300
2) Yellow = 300 <= bar count < 400
3) Red = bar count >= 400
Thresholds and target EMA can be changed by user under indicator properties.
Tradingview Alerts are available for all three thresholds.

Pip Distance to EMA TargetCreator: Andrew Palladino
Modified: 3/31/2017
This script calculates the total number of pips between current close and a target EMA . There are three thresholds that can be specified to determine when that total number of pip spread exceeds a standard deviation multiple set by user. Current standard deviation thresholds on pip spread are set to 2, 2.5 and 3. A pip spread that goes above 3 standard deviations is considered very extreme. The standard deviation is calculated across a predetermined set of bars. Currently look back period for standard deviation count is set to 3000.
New Updates:
3/31/2017: The trader has now the ability to set Tradingview Alerts which trigger when any of the thresholds are exceeded.

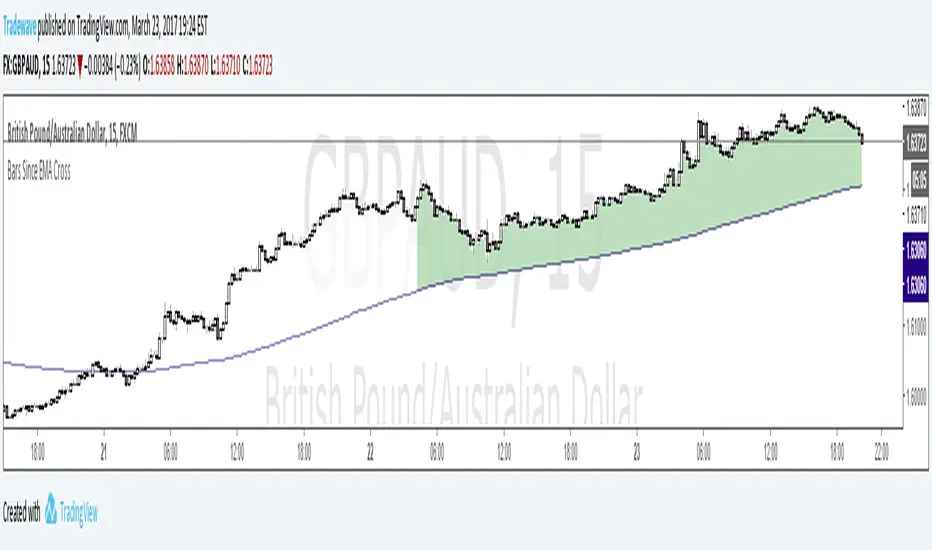
Bars Since EMA CrossCreator: Andrew Palladino
Date Modified: 3/23/2017
The indicator is used to alert the trader when the bar count since an EMA touch exceeds three different thresholds.
The default EMA period is set to 200.
The thresholds are currently set to: 100 bars, 300 bars and 400 bars.
When the specified limits are exceeded, the shading between price and the EMA will change color.
The trader has the ability to set TradingView alerts when the threshold limits are exceeded.
An additional TradingView alert can be set when price touches the EMA.
AP_NthPivot_v2Creator: Andrew Palladino
Date: 3/17/2017
Description:
The following indicator will show the most recent unhit pivot. A threshold can be set so the unhit pivot is displayed only if its the nth consecutive one.
