DailyDeviationLibrary "DailyDeviation"
Helps in determining the relative deviation from the open of the day compared to the high or low values.
hlcDeltaArrays(daysPrior, maxDeviation, spec, res) Retuns a set of arrays representing the daily deviation of price for a given number of days.
Parameters:
daysPrior : Number of days back to get the close from.
maxDeviation : Maximum deviation before a value is considered an outlier. A value of 0 will not filter results.
spec : session.regular (default), session.extended or other time spec.
res : The resolution (default = '1440').
Returns: Where OH = Open vs High, OL = Open vs Low, and OC = Open vs Close
fromOpen(daysPrior, maxDeviation, comparison, spec, res) Retuns a value representing the deviation from the open (to the high or low) of the current day given number of days to measure from.
Parameters:
daysPrior : Number of days back to get the close from.
maxDeviation : Maximum deviation before a value is considered an outlier. A value of 0 will not filter results.
comparison : The value use in comparison to the current open for the day.
spec : session.regular (default), session.extended or other time spec.
res : The resolution (default = '1440').
ابحث في النصوص البرمجية عن "low"
Pivot TrackerThis script finds swing lows and swing highs based on input criteria for lookback and lookforward periods, and plots letters accordingly.
Helps identify trend or lacktherof
HH = higher high
LH = lower high
HL = higher low
LL = lower low

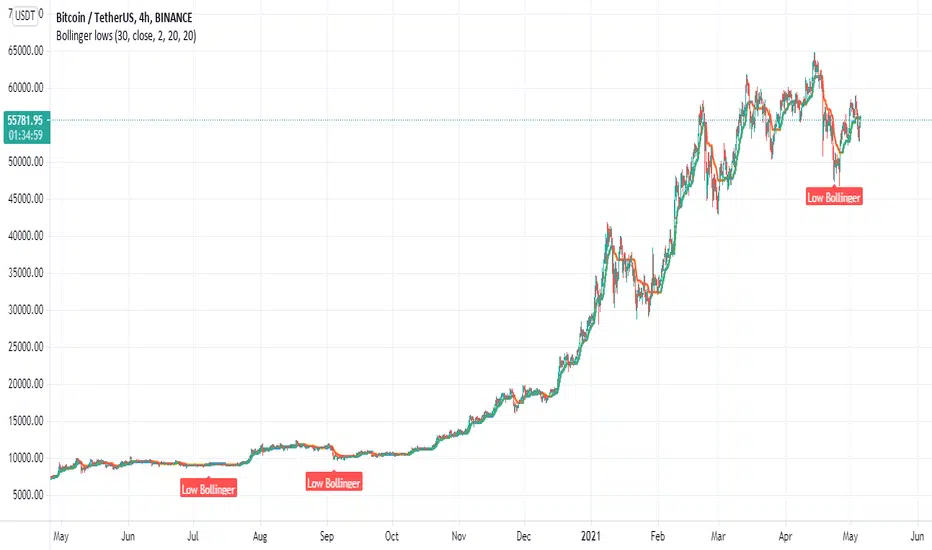
Bollinger lowsThe aim of this indicator is to find lows using a modified bollinger system
very simple system
first we have to bollinger levels with its modification
next is a trend line (green is up,orange is down)
once it cross the low bollinger levels it show signal of low bollinger which is our entry signal
try to play with settings to see best results
ALL TIME HIGH/LOW AND 52 WEEKS HIGH/LOWThis script show:
1. All time high/low line shown in maroon color
2. 52weeks high/low line shown in red color
3. 25% below 52wh and 30% upper 52wl as per Mark Minervini suggset in his book "Trade Like a Stock Market Wizard: How to Achieve Super Performance in Stocks in Any
Market"
Thats all, hope benefit tou you all.
Thank you.

High timeframe Highs, Lows, Opens, Closes. HTF Candles displayPosting previously requested indicator.
Overlays higher timeframe high and low over the current bars - pictured is daily high and low overlayed on lower timeframe chart.
Can be set to fill between the open and close to show higher timeframe candles by color, with bullish or bearish fills
Very versatile and can be used to display weekly or monthly opens, or used to display previous weekly highs and lows for charting out possible liquidity points, etc.
Originally converted from Chris Moody's HLOC pine version 2 indicator.

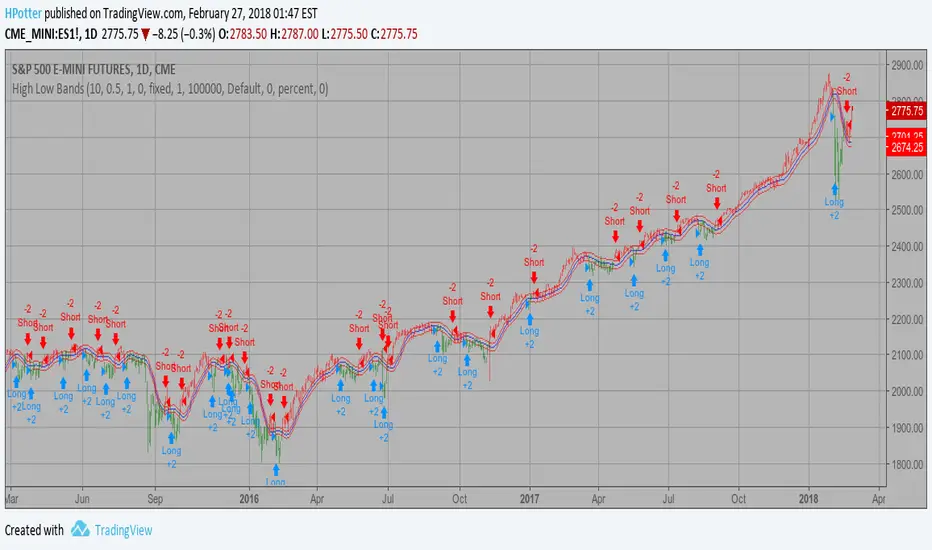
Combo Backtest 123 Reversal & High Low Bands This is combo strategies for get a cumulative signal.
First strategy
This System was created from the Book "How I Tripled My Money In The
Futures Market" by Ulf Jensen, Page 183. This is reverse type of strategies.
The strategy buys at market, if close price is higher than the previous close
during 2 days and the meaning of 9-days Stochastic Slow Oscillator is lower than 50.
The strategy sells at market, if close price is lower than the previous close price
during 2 days and the meaning of 9-days Stochastic Fast Oscillator is higher than 50.
Second strategy
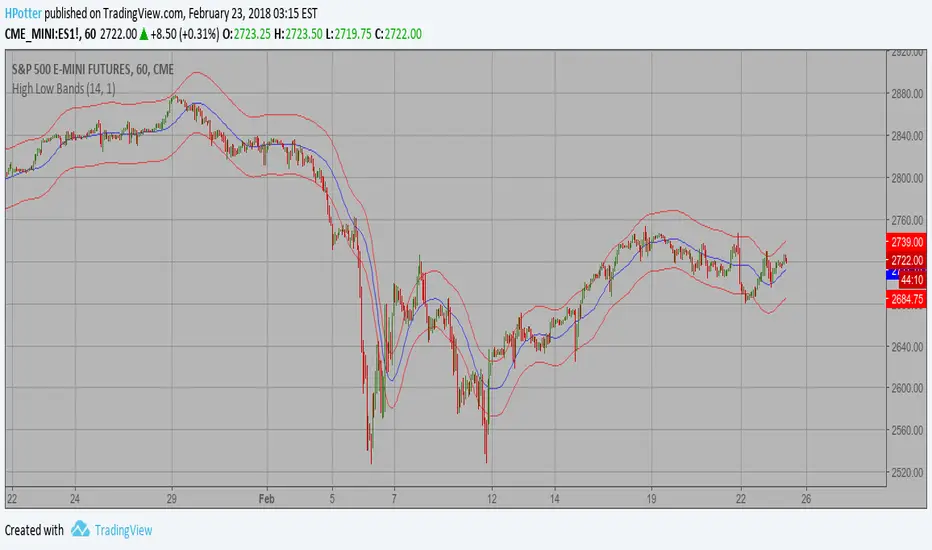
As the name suggests, High low bands are two bands surrounding the underlying’s
price. These bands are generated from the triangular moving averages calculated
from the underlying’s price. The triangular moving average is, in turn, shifted
up and down by a fixed percentage. The bands, thus formed, are termed as High
low bands. The main theme and concept of High low bands is based upon the triangular
moving average.
WARNING:
- For purpose educate only
- This script to change bars colors.

Cumulative High Low IndexThis indicator tells how many days it is making new HighLowPeriod highs or lows in Lookback period.
If bar makes new HighLowPeriod high, HighLow index for that bar is +1
If bar makes new HighLowPeriod low, HighLow index for that bar is -1
Cumulative high low index is sum of HighLow index for Lookback periods.
Optional moving average can also be applied on this index

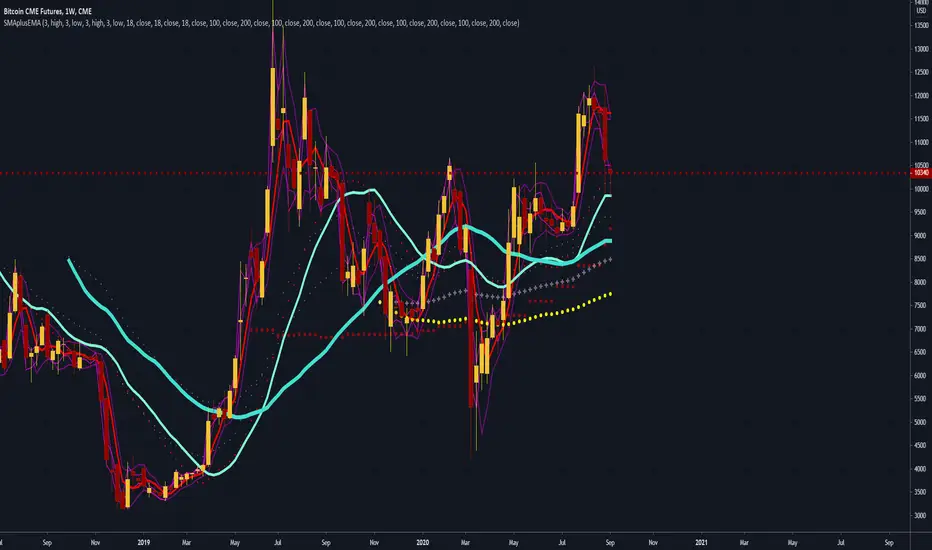
SMA Simple, EMA Exponential Moving Averages with high lowThis is a rewrite of my previous moving average script.
In this version, I have added the 3 day high and low as these are often used as short term trend following entry points
Traders often try to buy the 3 day average of lows in an uptrend and sell the 3 day average of highs in a downtrend
In the same fashion, I have added the 3 week high and low averages for longer term trend following for swing trading
I have added the 18 day, week, month simple moving averages ( SMA ) as I follow these from Ira Epsteins free you tube trading videos).
His 50 years of experience has taught him these are best
I have also added some longer term SMA , 100 day, 200 day, 100w, and 200w
Exponential EMA averages for longer term charts are included 100d, 200d, 100w, 100m, 200m
You can configure the script in the options to remove the ones you don't want to follow
I have removed the micro averages from my previous script since they are for short term scalping day trading hyper-trading which I don't do
Exponential averages are shown as crosses
some of the longer term averages are circles just to set them apart
High - Low Trend TunnelHigh - Low Trend Tunnel Experiment.
Using latest pinescript Array support!
Plotting Highest highs and Lowest lows for specific length (can be defined in settings).
The blue line is whom determinate the direction.
Blue line is the average of the highest highs and lowest lows smoothed by EMA.
Green - Up Trending.
Red - Down Trending.
Yellow - Squeeze, a reversal might be coming.
Any suggestions/comments are welcome as this is an experiment.

High & Low Of Custom Session - OpeningRange Breakout (Expo)High & Low Of Custom Session - OpeningRange Breakout (Expo) prints the high and the low of a custom session.
I use the indicator to trade the re-test of opening range (high/low) as well as breakouts from the opening range. The same logic can be applied to the session you have chosen.
HOW TO USE
1. Use the indicator to trade the re-tests of the session range.
2. Use the indicator to trade breakouts of session range.
INDICATOR IN ACTION
1-min chart
I hope you find this indicator useful , and please comment or contact me if you like the script or have any questions/suggestions for future improvements. Thanks!
I will continually work on this indicator, so please share your experience and feedback as it will enable me to make even better improvements. Thanks to everyone that has already contacted me regarding my scripts. Your feedback is valuable for future developments!
-----------------
Disclaimer
Copyright by Zeiierman.
The information contained in my scripts/indicators/ideas does not constitute financial advice or a solicitation to buy or sell any securities of any type. I will not accept liability for any loss or damage, including without limitation any loss of profit, which may arise directly or indirectly from the use of or reliance on such information.
All investments involve risk, and the past performance of a security, industry, sector, market, financial product, trading strategy, or individual’s trading does not guarantee future results or returns. Investors are fully responsible for any investment decisions they make. Such decisions should be based solely on an evaluation of their financial circumstances, investment objectives, risk tolerance, and liquidity needs.
My scripts/indicators/ideas are only for educational purposes!

[KY]New High New Low Ratio(1) What is New High/New Low ratio?
New High/New Low ratio is a ratio based on new 52-week high issues and new 52-week low issues.
This indicator is best for identifying a bottom if you use this with other breadth indicators.
However, this is not so useful to know the timing for short because bull momentum tends to continue.
(Market top period is long, market bottom period is short.)
Reference: Stochcharts.com
school.stockcharts.com
(2) How to use?
- Add this indicator to your chart.
- Overbought >85 tends to continue, so don't short too early. You rather want to hold long until bull momentum deteriorates.
Dark green = bullish momentum zone.
- Oversold < 30 and if rolls over at the bottom, you can pile up long position.

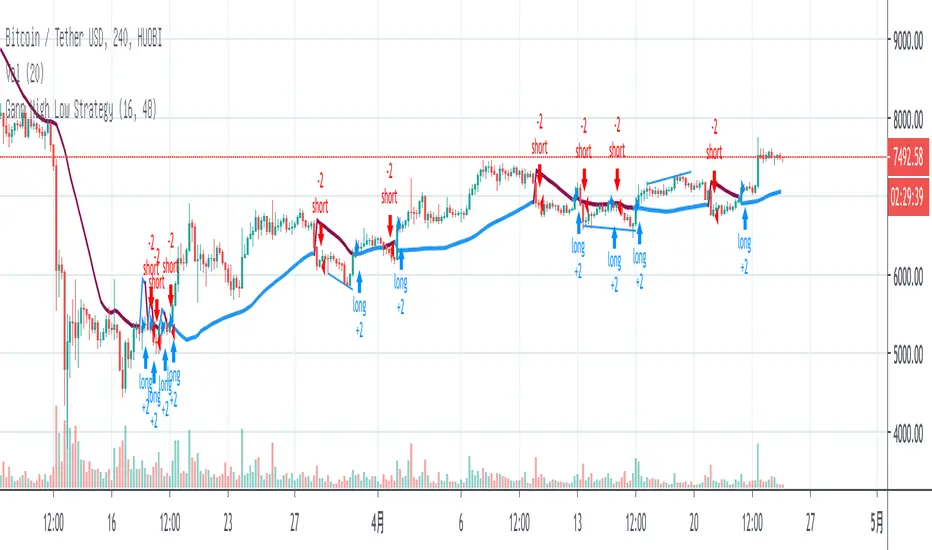
Gann High Low StrategyGann High Low is a moving average based trend indicator consisting of two different simple moving averages.
The Gann High Low Activator Indicator was described by Robert Krausz in a 1998 issue of Stocks & Commodities Magazine. It is a simple moving average SMA of the previous n period's highs or lows.
The indicator tracks both curves (of the highs and the lows). The close of the bar defines which of the two gets plotted.
volume low standard deviation stystemOn the basis of moving average, add moving average and standard deviation line of volume to filter the entry and exit time.
Filter entries and/or exits based on low volume
options = 1, no not enter on low volume
options = 2, exit on low volume
options = 3, both 1 and 2
For others, please refer to the code and notes。

Bull/Bear Engulf High Low LookupAllows to specify the high and low look-back period for both Bullish and Bearish engulfing candles. In essence, it is an extension of the classical engulf pattern. By default lookback period is set to 3.
Can be used on any time-frame and any instrument. Previous candle is irrelevent.
An engulfing candle is defined as follows:
Bullish: Must trade BELOW prior candle LOW and close ABOVE prior candle HIGH
Bullish: Must trade ABOVE prior candle HIGH and close BELOW prior candle LOW

High Low Cloud Strategy BacktestingHigh Low Cloud Strategy Backtesting: this is a breakout and reversal previous trend strategy
A. Indicator: row 6 to row 17
1. Fast Cloud
Upper line = ema of High with 60 periods
Lower line = ema of Low with 60 periods
1. Slow Cloud
Upper line = ema of High with 240 periods
Lower line = ema of Low with 240 periods
B. Strategy Backtesting
1. Chart IDC, Time frame: M30
2. Long condition: row 20 to row 34
a. Entry =
* Upper line of Fast Cloud below Lower line of Slow Cloud
* Price crossover Upper line of Slow Cloud
b. Stoploss =
* Price crossunder bottom of 240 periods (~ bottom of 5 days)
c. Takeprofit =
* Lower line of Fast Cloud above Upper line of Slow Cloud
* Price crossunder Lower line of Fast Cloud
3. Short condition: row 37 to row 49
a. Entry =
* Lower line of Fast Cloud above Upper line of Slow Cloud
* Price crossunder Lower line of Slow Cloud
b. Stoploss =
* Price crossover peak of 240 periods (~ bottom of 5 days)
c. Takeprofit =
* Upper line of Fast Cloud below Lower line of Slow Cloud
* Price crossover Upper line of Fast Cloud

High/Low Weekly TimeframeI'm testing a simple but useful indicator that plots the high and low for the current week. The time-frame can be selected by the user.
It's useful when you're trading in a smaller time-frame (example: 1H or 4H) to know exactly the weekly low and high, and whether the price breaks above or below this price lines.
This indicator allows you:
- To select the desired time-frame to get the Low and High.
- To print an optional EMA for the same time-frame.
- To optionally change the bar-color when the close price crosses above the weekly high or crosses below the weekly low.
Hope this helps you to visually identify price movements.
If you like this script please give me a like and comment below.
Thanks,
Rodrigo
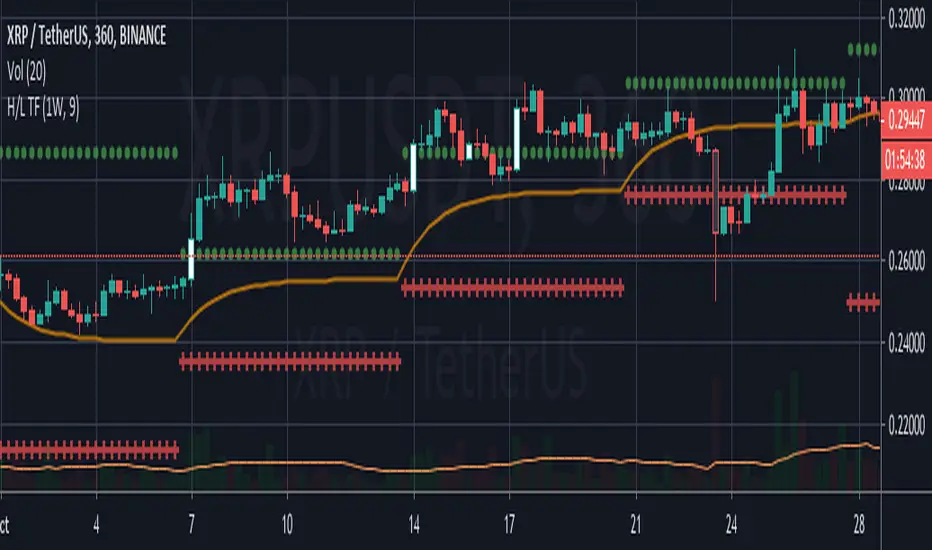
X Period High/Low/MidToday we have a simple, but endlessly versatile, indicator that plots the X Period High/Low/Mid of your chosen market.
Traditionally the 52 week High/Low is used as a breakout signal. However, by changing to an X period, and adding a midway line, we create a more versatile indicator that can be tailored to various markets.
By default it's set at 250 periods (because I like the 250 period moving average), and I generally trade H4 and Daily time frames. But tweak it to your liking, you just have to modify the length periods by your desired time frame and lookback length. E.g. to create a 52 week indicator on the daily time frame, enter a length of 260 in the indicator (5 days per week * 52 weeks = 260).
For the above reason, I haven't made this indicator MTF, as there's no real need. However, if users find it easier I can look at adding it later.
Also, the mid point between an X period high/low is often a good trend-follower, as well as acting as support/resistance . I encourage you to experiment with different ways of using this indicator. Entire systems (if your risk management is correct) can be built and traded from this one indicator.
Good luck.
DD

Triple Coppock CurveThe Coppock Curve is a zero-centered momentum oscillator that relies primarily on rate of change calculations. The Coppock Curve in its most basic form is already a great indicator, especially for spotting shifts in momentum. But, we wanted to see how we could modify it to get some better performance out of it.
As the ‘cop’ function demonstrates, the Coppock Curve has a pretty simple calculation. The first step is to calculate the rate of change at a longer and shorter window length. Next, the sum of the two rate of change values is calculated and finally a weighted moving average of a user defined length is calculated(this is the Coppock Curve).
The ‘cop()’ function set the foundation to allow us to implement our modifications. As you can see in the graph, there are 3 different lines (2 histogram and 1 normal line) comprising the Coppock values based on the rate of change of high, low, and closing prices. We liked this layout because it allows traders to easily identify the curve’s pivots and the balance of negative vs. positive momentum.
The Coppock Curve based on high prices is plotted as the teal histogram, wile the pink histogram represents the Coppock Curve of low prices. The curve based on closing prices is the red and green alternating line plotted on top of the two histograms.
We included some notes on the chart to help with interpreting the three curves.
There are two common approaches traders can take when trading with the indicator:
1. Trade based on closing price curve: Go long when line changes from bearish(red) to bullish(green). Then, go short when same line changes from bullish to bearish.
2. Trade based on crossings of the zero-line. This could be based on the high, low, or closing price curves, but closing price is the safest bet. So, go long when it crosses from negative into positive territory and short when it crosses under the zero line from positive into negative territory.

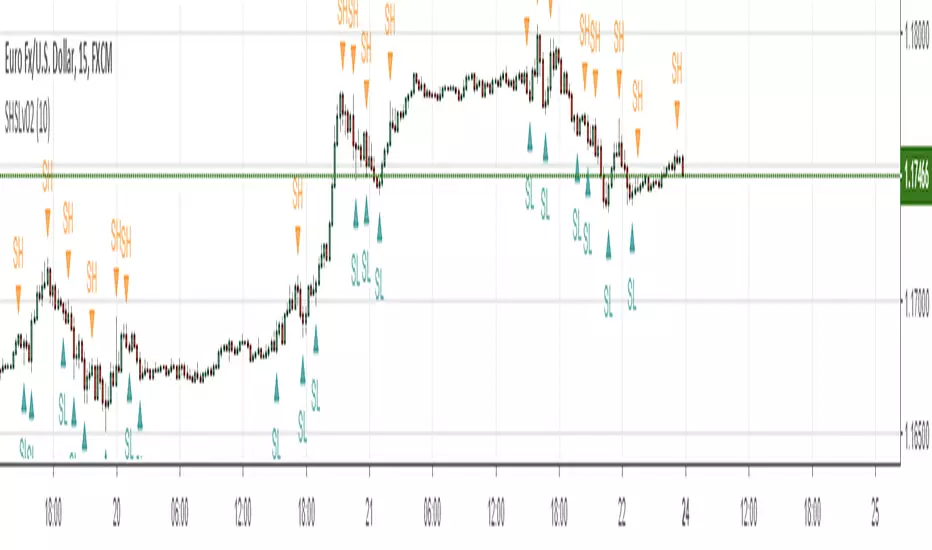
Swing Highs and Lows (version 2)My second version of plotting Swing Highs and Swing Lows
A Swing High (SH): a price bar high preceed by two lower highs (LH) and followed by two lower highs (LH)
This version enables you to ignores swing highs and lows when the market volatility is small and not suitable for trading.
Thus it will depict fewer number of SH and SL markers, making the chart a bit cleaner and easier for us to read.
Volatility is measured simply by the amount of pips moved within five consecutive bars: the default is set at 10 pips, meaning that when you take five consecutive bars and the gap of the highest high and the lowest low is less than or equal to 10 pips, it will not depict SH or SL markers.
To use this function, check "set volatility threshold?" box under the Format icon and set a threshold in pips.
(I typically trade EURUSD so the pips input is customized for that)
YTC - Swing Highs & Lows v.2.0This Indicator Plots Swing Highs & Swing Lows based on Lance Beggs of (Your Trading Coach) definition:
A Swing High (SH) is a price bar high preceed by two lower highs (LH) and followed by two lower highs (LH)
In the event of multiple candles forming equal highs, this will still be defined as a swing high, provided that there are two candles with lower highs both preceding and following the multiple candle formation.
Added the verification of all the possible casuistry:
If there are two, three or four bars followed with the same highs or lows and surrounded with tiny bars
Or two or three bars with equal highs or lows alternating with tiny bars.
New parameter to activate repaint (NOT repaints by default)

High Low Bands Backtest As the name suggests, High low bands are two bands surrounding the underlying’s
price. These bands are generated from the triangular moving averages calculated
from the underlying’s price. The triangular moving average is, in turn, shifted
up and down by a fixed percentage. The bands, thus formed, are termed as High
low bands. The main theme and concept of High low bands is based upon the triangular
moving average.
You can change long to short in the Input Settings
WARNING:
- For purpose educate only
- This script to change bars colors.
High Low Bands Strategy As the name suggests, High low bands are two bands surrounding the underlying’s
price. These bands are generated from the triangular moving averages calculated
from the underlying’s price. The triangular moving average is, in turn, shifted
up and down by a fixed percentage. The bands, thus formed, are termed as High
low bands. The main theme and concept of High low bands is based upon the triangular
moving average.
WARNING:
- This script to change bars colors.

High Low Bands As the name suggests, High low bands are two bands surrounding the underlying’s
price. These bands are generated from the triangular moving averages calculated
from the underlying’s price. The triangular moving average is, in turn, shifted
up and down by a fixed percentage. The bands, thus formed, are termed as High
low bands. The main theme and concept of High low bands is based upon the triangular
moving average.