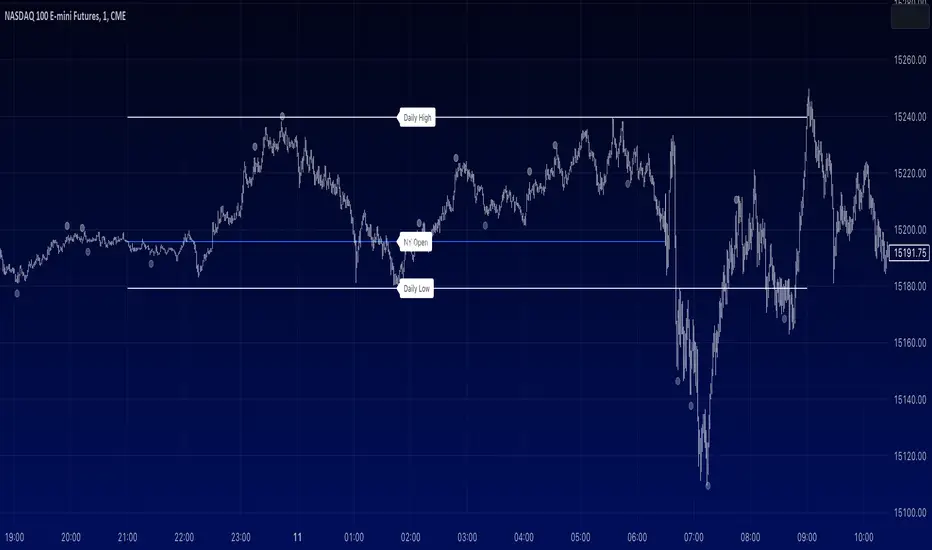
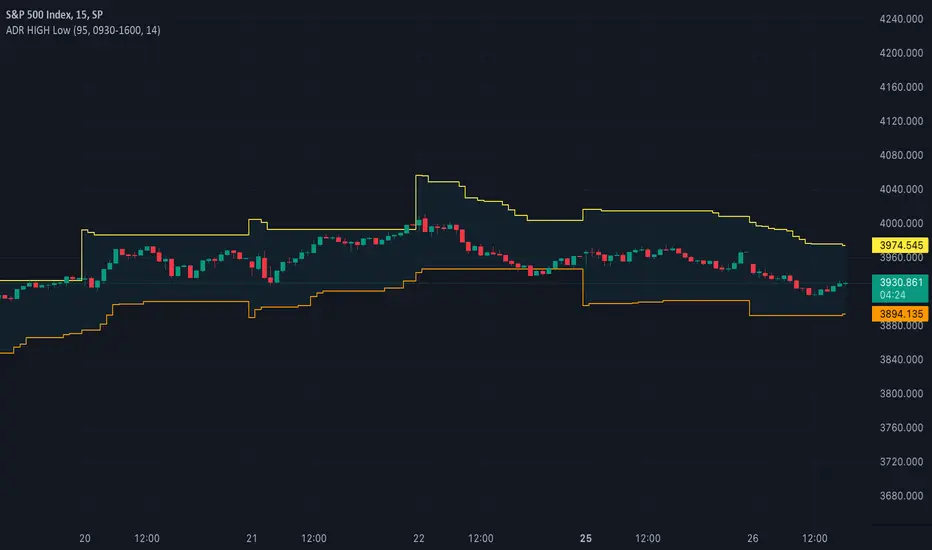
ICT - NY Session Open + Daily High/Low Markers [1m Chart]For ICT lovers, this marks the swing low, swing high of NY opening so you can scalp the open.
ابحث في النصوص البرمجية عن "low"
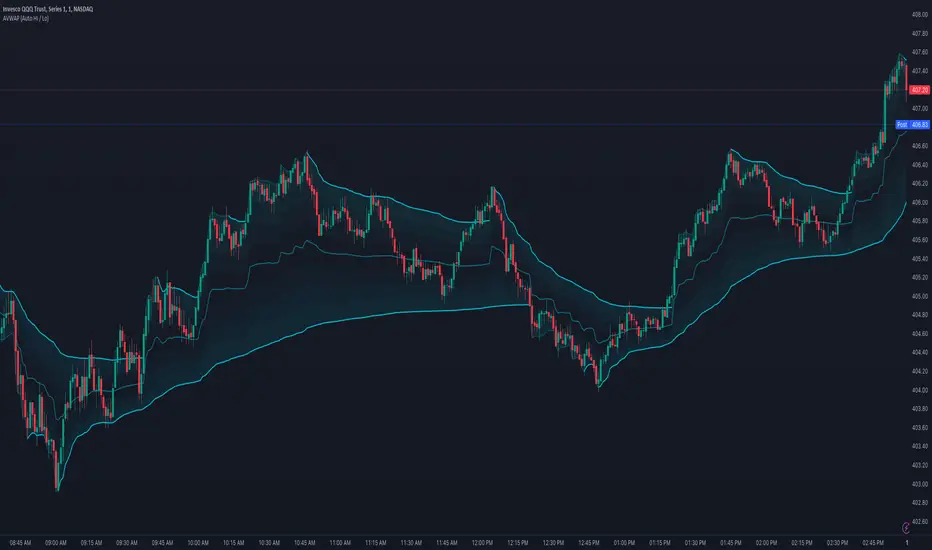
Anchored VWAP (Auto High & Low)OVERVIEW
This script plots, and auto-updates, 3 separate VWAPs: a traditional VWAP, a VWAP anchored to a trends high, and another anchored to a trends low.
VWAP and Anchored VWAPs are commonly used by institutions responsible for the majority of market volume on a given day. Citadel Trading, for example, accounts for approximately 35% of all U.S. listed retail volume , largely executed through program trades over the course of a day, week, or month.
Because VWAP is a prominent market maker tool for executing large trades, day traders can use it to better anticipate trends, mean reversion, and breakouts.
This is most useful on charts with intraday time frames (1 minute, 5 minute etc.) commonly used for day trading. This is not ideal for larger time frames (1 hour or greater) commonly used for swing trading or identifying larger trends.
INPUTS
You can configure:
The size, color, and visibility of 6 different plots (VWAP, High Anchor, Low Anchor, Average of Anchors, Quarter Values, Interim Bands)
How smooth the average displays
INSPIRATION
1. "How To Measure Anything" by Douglas W. Hubbard
2. "Maximum Trading Gains With Anchored VWAP" by Brian Shannon
Better understanding probability and how to analyze risk (first book), as well as the tools market makers use (second book), has completely reframed how I approach day trading.
Hobbiecode - Five Day Low RSI StrategyThis is a simple strategy that is working well on SPY but also well performing on Mini Futures SP500. The strategy is composed by the followin rules:
1. If today’s close is below yesterday’s five-day low, go long at the close.
2. Sell at the close when the two-day RSI closes above 50.
3. There is a time stop of five days if the sell criterium is not triggered.
If you backtest it on Mini Futures SP500 you will be able to track data from 1993. It is important to select D1 as timeframe.
Please share any comment or idea below.
Have a good trading,
Ramón.

NSDT Custom High and Low LinesFirst, the credit for the original script to plot a High and Low between a certain time goes to developer paaax.
I took that idea, converted it to Pinescript V5, cleaned up the code, and added a few more lines so you can plot different levels based on time of day.
Published open source like the original.
The example shown has:
Blue - plotting from the start of the Futures Asian session to the start of the Futures USA Session. (6:00PM - 9:30AM Eastern)
Yellow - plotting from the start of the Futures Europe session to the start of the Futures USA Session. (3:00AM - 9:30AM Eastern)
Green - plotting from the start of the Futures US Premarket session to the start of the Futures USA Session. (8:00AM - 9:30AM Eastern)
These are great levels to use for breakouts and/or support and resistance.
Combine these levels with the 5 min Open Range levels, as you have some good trades.
Each of the three sessions have individual start and end times that can be modified by the trader, so you can easily mark off important areas for your style of trading.

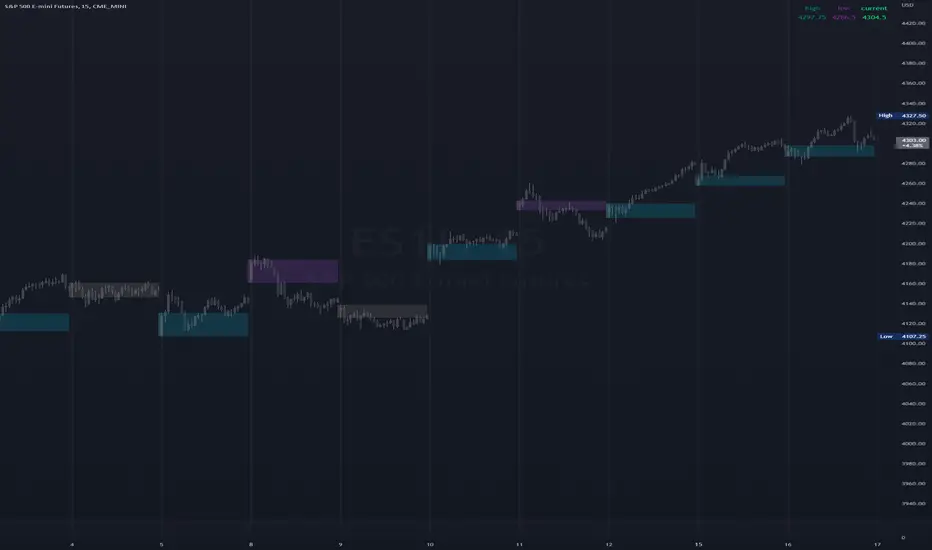
Pre-market Highs & Lows on regular trading hours (RTH) chartShows pre-market highs and lows on RTH or ETH chart
-Pre-market duration user input (default is 16 'bar hours'; covering the time from S&P RTH close at 4pm >> 9:30am RTH open next day
-Displays on both RTH and ETH charts
-Written for ES (ES1! or e.g ESM2023), but tested and working on SPY, SPX
-Works across timeframes
Example usage on Electronic trading hours (ETH) chart; showing the 'bar hours' user input lookback duration visually

Higher High & Higher Low (Live) ━ [whvntr]This indicator is based on the trading formation Higher high and Higher low. It dynamically displays the current price above the bar on a label.
Features:
• If the current price is lower than the previous high the label color will dim.
• If the current price is lower than the previous low the price figure will turn red.
• Completely customizable
• Inspired by the Price label written by Westy_ , I have written different functions (coding) to make this indicator what it is.
These are not buy and sell signs, it's based on the HH & HL trading formation.

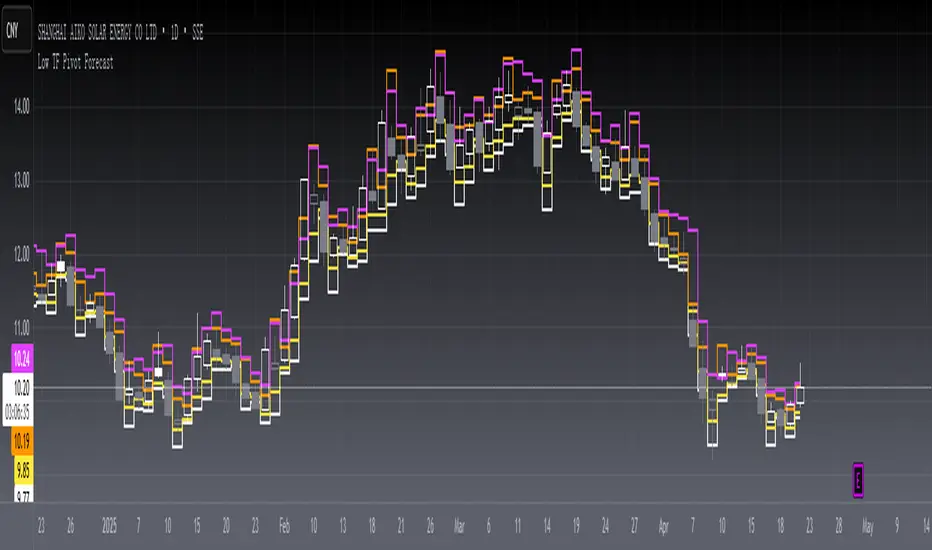
[blackcat] L2 Low TF Pivot Forecast Level 2
Background
A algo for pivot points forecast for each bar and its low tf data.
Function
In financial markets, a pivot point is a price level that is used by traders as an indicator of market movement. Pivot points are averaged from important prices (highest, lowest, closing) based on the market performance of the previous time period. There are many ways to calculate the pivot point. The pivot point is calculated using the highest price (H), the lowest price (L) and the closing price (C) of the previous time period, and sometimes the opening price of the current time period Valence (O) was added to it.
S1 yellow
S2 white
R1 Orange
R2 fuchsia
The smoothing parameter default to 55
The pivot point indicator can be used in two ways. First, the pivot point can be used as a price trend confirmation. It is generally believed that if the price is above the pivot point in the latter period of time, the market is considered to be in a bull market sentiment, otherwise it is considered to be in a bear market sentiment. Second, support and resistance levels are mainly used as exit positions. For example, R1 and R2 can be used as trade targets if the market price breaks above a pivot point. If the market effectively breaks R1 and R2, traders may consider adding to their long positions.
Remarks
Feedbacks are appreciated.
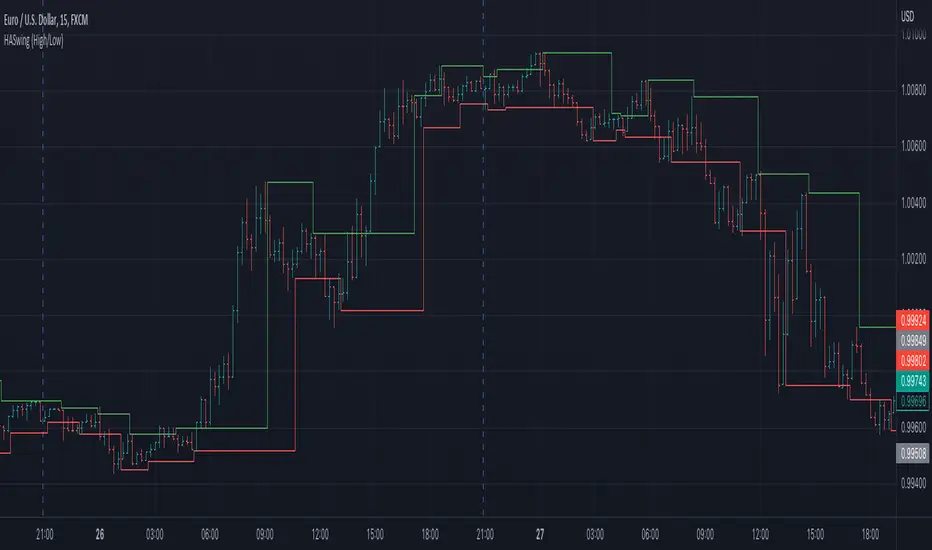
Heiken Ashi Swing High/LowIt uses Heiken Ashi candles to detect recent swing high and low.
It can be used as a stop-loss or support/resistance indicator.
inChart - LibLibrary "inChart"
determine if price value is between chart high + x% and low - x% on the visible chart.
inChart()

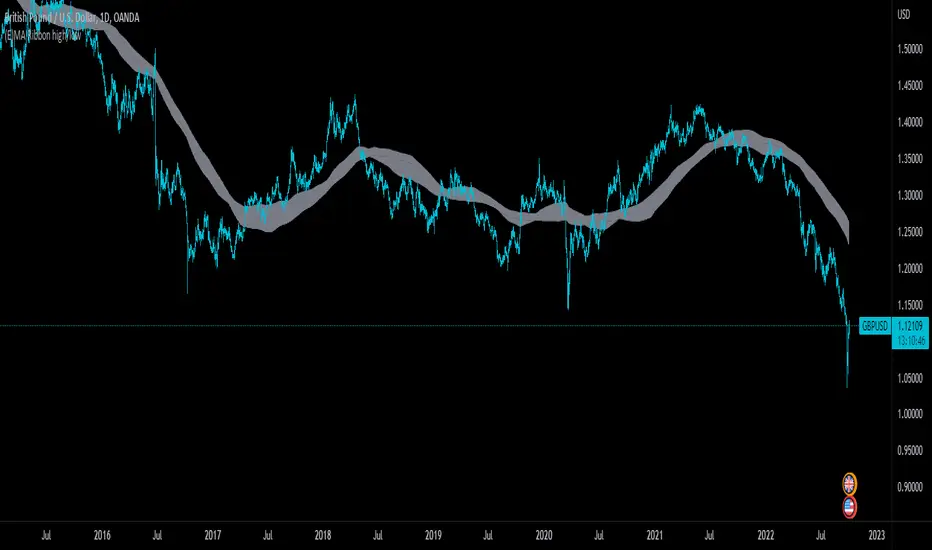
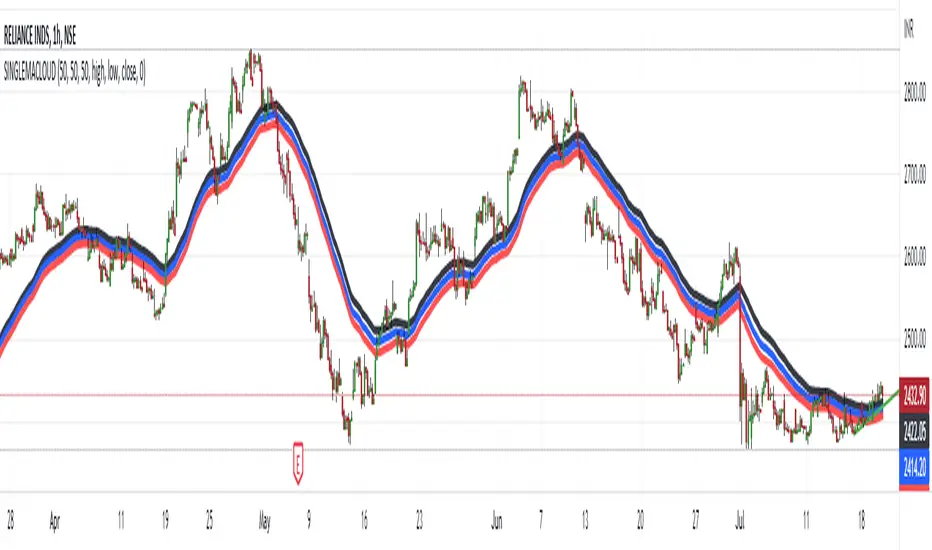
(E)Moving Average Ribbon High/LowThis is a slight modification of the standard Moving Average Ribbon. This script will take the 200 EMA and SMA with source the high and low, not the close.
This band will act as a support and resistance zone and should be used as a confluence with other indicators or support/resistance lines.
I got inspired to create this one, by the YT video "FINALLY! The 200 EMA Confluence Trading Strategy You’ve Been Waiting For" by The Secret Mindset.
In his video he takes only the 200EMA, but this script will take by default also the SMA into account.
In the settings you still can adapt as you wish ;-)
Happy trading!
Visible Range High Low [vnhilton]Inspired by TradingView's "Chart VWAP". Thank you PineCoder for the "VisibleChart" library.
This indicator plots labels for the highest high & lowest low for the visible bars on the chart. TradingView does by default have an indicator similar to this, however it plots labels on the y-axis & cannot be customized.

RSI Highs and LowsENG
RSI is usually used with closes but sometimes traders need to find out exact lows and highs while trading, therefore this script is written.
Green plot is the RSI value according to highs and red plot is the RSI value according to lows.
TR
RSI genellikle mum kapanışlarına göre kullanılıyor ama bazen alım satım yaparken en dip ve en tepeleri yakalamak istersek kapanışlara değil de bu en yüksek ve en düşük mum değerlerine ihtiyacımız oluyor. Bu nedenle bu kod yazılmıştır.
Yeşil grafik - en yükseklere göre
Kırmızı grafik - en düşüklere göre

Mark StructureMark Structure is building the market swing structure, minor and sub structure and marks all possible insignificant pivots
Building such structure is really complex task to do, that has a lot of obstacles and challenges. I'm doing my best to develop this indicator behaving in absolutely expectable and right way. Fill free to leave any comments or bug reports.
it supports:
- Marking all pivots with labels or join them continuously with trend lines.
- Marking minor and sub structured swings with labels or join them continuously with trend lines. Marking BOS or SMS BOS, which are mbos. Minor and substructure are structures inside swing structure and it can differ from the structure of lower timeframe
- Marking swings of swing structure with labels or join them continuously with trend lines. Marking BOS or SMS BOS of swing structure
- Changing bullish and bearish colors of each kind of structures
- Changing pivot labelings
- Changing colors of BOSs
Remarks:
- As I told you guys before, it has a lot of challenging cases. eg we have swing low and high on the same candle and in order to decide which pivot goes first I take lower time frame data to figure out what pivot is the first, but it happens that on lower time frame the same issue takes place, due to limitation of TradingView I can't go infinitely to lower timeframes to solve this issue, so I mark those cases with labels
- Another issue is very beginning of the trend its hard to detect swing structure there due to missing historical data. so skip a few waves in the very beginning
- Don't expect to have minor and sub structure in each swing waves, its totally fine when you don't have them at all
- Swing structure is the most significant structure and shows real price direction. Trend change is confirmed when for bull->bear the last HLbull LH>HH and HH-HL-HH are confirmed. You can change labelling for unconfirmed swing trend in the settings. By default its already done

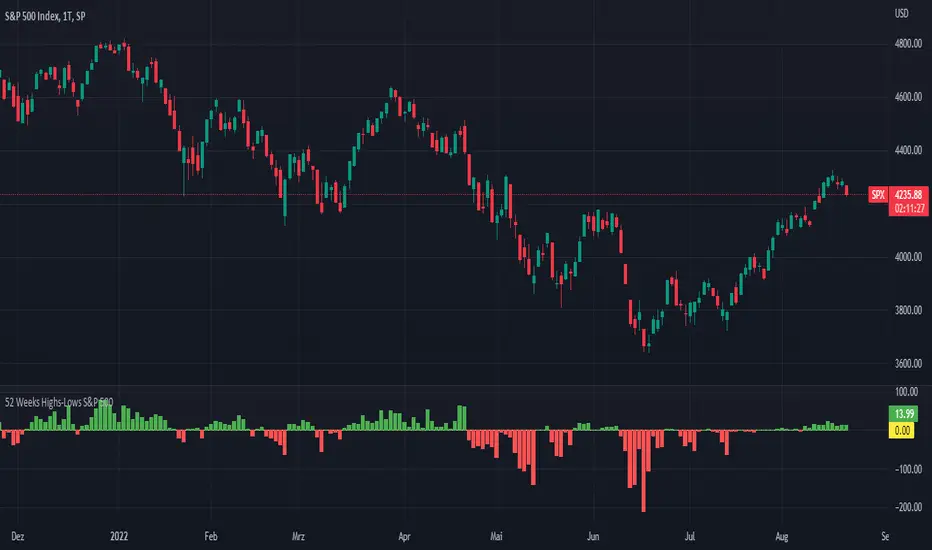
52 Weeks Highs-Lows S&P 500 - MugurThe script uses the MAHP and the MALP index and subtracts the second from the first. So you can see how many stocks in the S&P 500 make new highs or new lows on a 52 weeks basis and see the trend of the market.
5 Day Highs-Lows S&P 500 - MugurThe script uses the M5HP and the M5LP index and subtracts the second from the first. So you can see how many stocks in the S&P 500 make new highs or new lows on a 5 days basis and see the trend of the market.

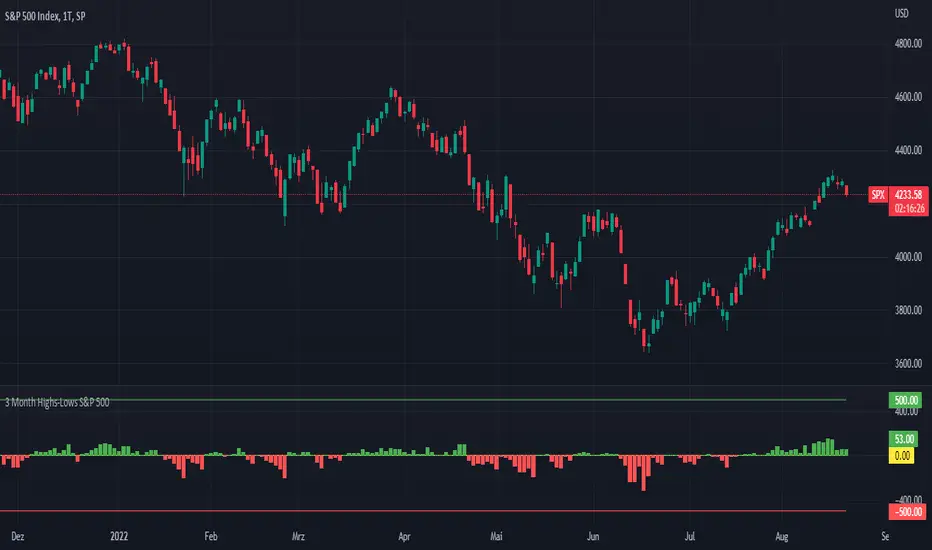
3 Month Highs-Lows S&P 500 - MugurThe script uses the M3HP and the M3LP index and subtracts the second from the first. So you can see how many stocks in the S&P 500 make new highs or new lows on a 3 month basis and see the trend of the market.
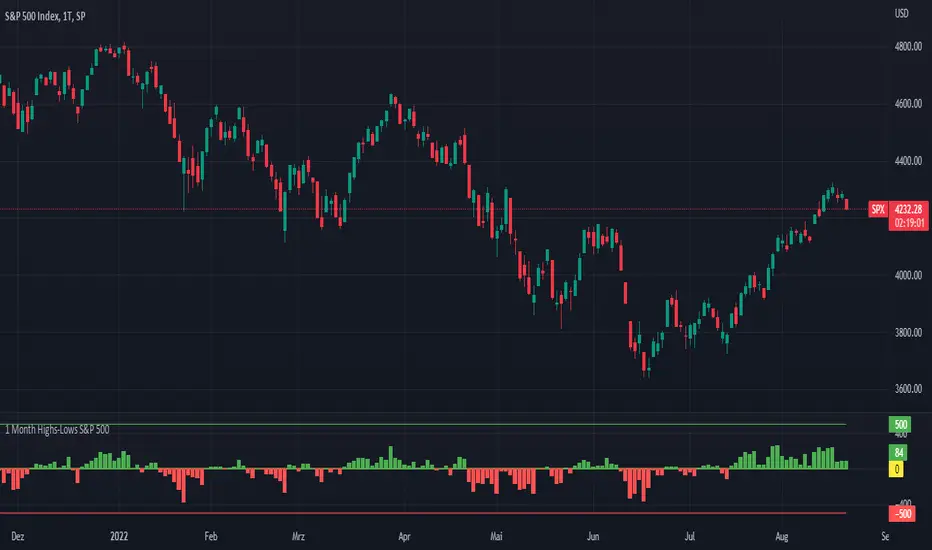
1 Month Highs-Lows S&P 500 - MugurThe script uses the M1HP and the M1LP index and subtracts the second from the first. So you can see how many stocks in the S&P 500 make new highs or new lows on a 1 month basis and see the trend of the market.
High & Low Of Custom SessionThis script boxes a custom session and sets the box at the high and low of the session and draws that box to the next session.
Box color is determined by price in relation to the box position. Box color is set at the start of the next session. This allows
user to lookback at multiple box sets to see how each day closed in relation to the session highlighted.
I have written this for backtesting purposes and intend to expand it to use with volume analysis and gradient color to change the box color based on how many times price tests
the box.
HIGH LOW CLOSE Moving Average ExponentialThe Script is prepared for testing purpose the Added single indicator for getting high low and close.
HLM Trend Line (High-Low-Midpoint / Ichimoku Line)Ichimoku style trend line .
Some strategies call for a custom Ichimoku style line (midpoint of range's high/low).
This allows you to use or replace a single line without having to customize a full Ichimoku setup.

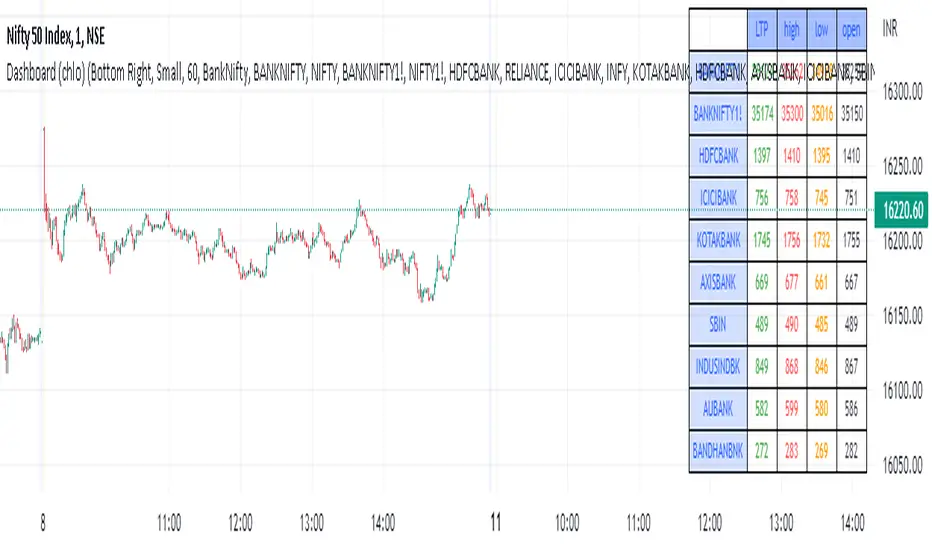
Dashboard (chlo) - v1I am an aircraft maintenance technician who is trying to get into software development in the financial sector.
This is a project in which a dashboard of other security(stocks) with open, close, high, and low will appear.
I could compile this after a detailed study of different dashboards and pine script for several hours
hope you like this.
EMA 50 HIGH LOW BANDHi
This indicator displays a band of EMA 50 having high and low of the same ema.
This script works well on 5 min chart or lower time frames in intraday.
When any price is above this band, you may consider a buy position and whenever any price is below this band, you may consider a sell position.
You may also take help of EMA 200, which is shown in red color. Whenever price is above EMA200, it is considered bullish and when ever it is below EMA 200, it is considered bearish.
This will remove a lot of noise from your chart.
I hope it helps.
Thanks
