High/low crypto strategy with MACD/PSAR/ATR/EWaveToday I am glad to bring you another great creation of mine, this time suited for crypto markets.
MARKET
Its a high and low strategy, designed for crypto markets( btcusd , btcusdt and so on), and suited for for higher time charts : like 1hour, 4hours, 1 day and so on.
Preferably to use 1h time charts.
COMPONENTS
Higher high and lower low between different candle points
MACD with simple moving average
PSAR for uptrend and downtrend
Trenddirection made of a modified moving average and ATR
And lastly elliot wave oscillator to have an even better precision for entries and exits.
ENTRY DESCRIPTION
For entries we have : when the first condition is meet(we have a succession on higher high or lower lows), then we check the macd histogram level, then we pair that with psar for the direction of the trend, then we check the trend direction based on atr levels with MA applied on it and lastly to confirm the direction we check the level of elliot wave oscillator. If they are all on the same page we have a short or a long entry.
STATS
Its a low win percentage , we usually have between 10-20% win rate, but at the same time we use a 1:30 risk reward ratio .
By this we achieve an avg profit factor between 1.5- 2.5 between different currencies.
RISK MANAGEMENT
In this example, the stop loss is 0.5% of the price fluctuation ( 10.000 -> 9950 our sl), and tp is 15% (10.000 - > 11500).
In this example also we use a 100.000 capital account, risking 5% on each trade, but since its underleveraged, we only use 5000 of that ammount on every trade. With leveraged it can be achieved better profits and of course at the same time we will encounter bigger losses.
The comission applied is 5$ and a slippage of 5 points aswell added.
For any questions or suggestions regarding the script , please let me know.
ابحث في النصوص البرمجية عن "macd"

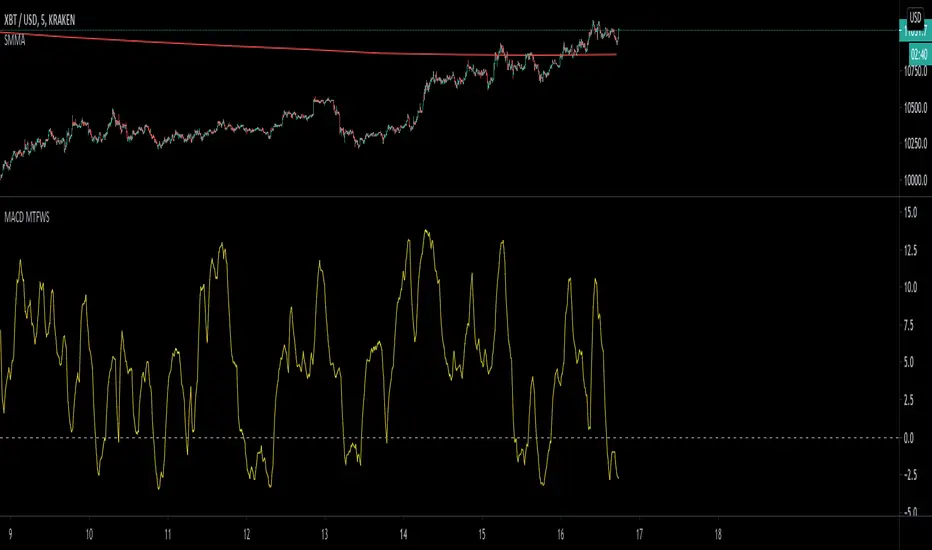
MACD Multiple Time Frames Weighted Momentum Score OscillatorThis script looks at the current momentum direction (up or down) for the 5 minute, 30 minute, 1 hour, 4 hour and daily and allows you to set scores of importance to these.
These scores are then added up to create an oscillator matching your preferences. Tune the indicator to match what you believe is the most important time frames that people use and score it accordingly. The values I put by default are just for demonstration.
For example, (and if you want to test to verify it's working), set the scores to 0 for everything except for the daily). Look at the daily macD by adding it as an indicator and set a score. Whenever the macD is trending up it will add the appropriate value to the score and likewise remove it when it's not.
Enjoy!
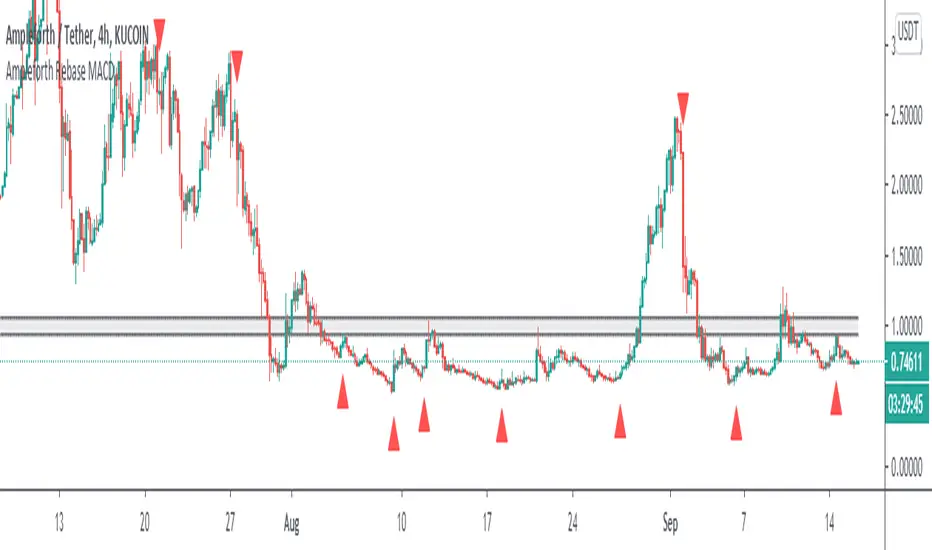
Ampleforth Rebase MACDThis script reveals Ampleforth rebase levels which are going to always work. In addition to that is MACD crossovers serving as potential buy/sell entries. You can set alerts for MACD crossovers and price entering balanced value area (0.96 - 1.06).
MACD signals can be used to automatically open a position and entering a balanced value area can be used as take-profit. Since the price will always move to this level, using this strategy without leverage should be profitable.
Ampleforth seems like a nice asset to trade since it is unlikely to correlate with anything else. At least not when it gets to the extreme levels.
WMA + MACD strategy with trailing stopHi!
That's my first strategy. I already learn pine, so i will work on it more. Now i search how to make trailing stop working.
"WMA + MACD strategy with traiing stop" is very simple strategy which is designated for stocks market. It is created only to take long positions.
Buy signal is when WMA(120) is below price and macd(10,20,10) histogram is higher than 0.
Position should be automaticly closed when price hits stoploss level.
One transaction should be max 20% of our capital and stoploss is set 3% lower than last closing price.

[fikira] MACD & RSI+Stoch + DivergencesThis is a new version of my "Divergences"
Compared to my "Divergences (Pivots)", this is calculated totally different
There are 3 options:
- MACD
- RSI
- Stoch RSI
Since this script is very heavy in calculation it is limited in time (= inspired from a script of "Che_Trader")
Also it uses "max_bars_back" (=1000)
For MACD and Stoch RSI there is a "custom Divergences Period", which compares more then 7 Pivot Points,
the higher the number, the less reliable, it is not necessary to use this, but it is there,
also you can change the "leftbars" and "rightbars", again, it is not necessary to change, but you can...
Linewidth and style of the Divergences lines can be changed
Thank you!

ANN BTC MTF Golden Cross Period MACDHi, this is the MACD version of the ANN BTC Multi Timeframe Script.
The MACD Periods were approximated to the Golden Cross values.
MACD Lengths :
Signal Length = 25
Fast Length = 50
Slow Length = 200
Regards.

Bollinger Bands on MacdOnly longs when Macd line is above Bollinger Band and shorts when Macd line is above Bollinger Band, this will avoid many problems.
thumbs up!!!

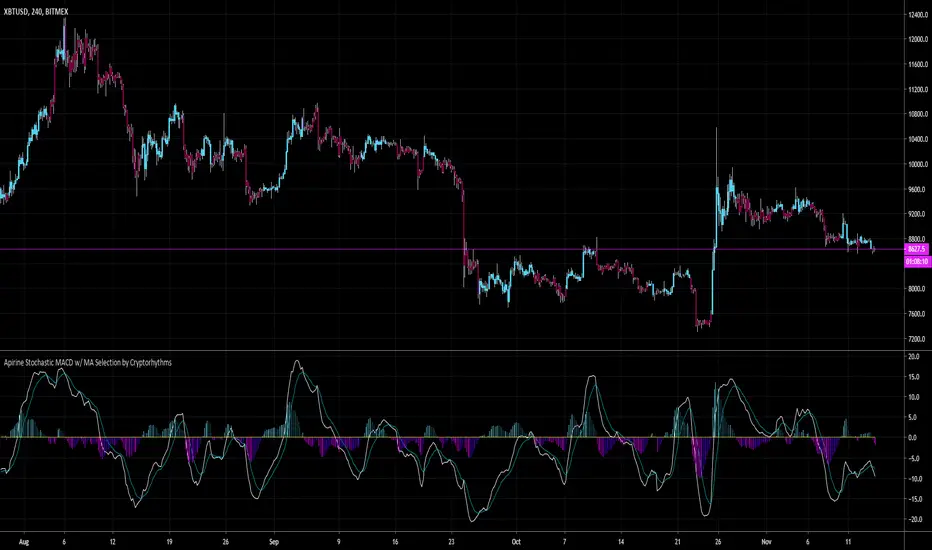
Apirine Stochastic MACD w/ MA Selection by Cryptorhythms📊 Apirine Stochastic MACD w/ MA Selection by Cryptorhythms
Intro
Had to re-release due to moderation.
This happens to be my first open source indicator, hope you all enjoy it!
Description
This indicated is ported from November 2019 issue of TASC. “The Stochastic MACD Oscillator” in this issue, author Vitali Apirine introduces a new indicator created by combining the stochastic oscillator and the MACD . He describes the new indicator as a momentum oscillator and explains that it allows the trader to define overbought and oversold levels similar to the classic stochastic but based on the MACD .
Options
-You can enable bar coloration for trade state (signal conditions setup in the "long" and "short" variables).
-You can choose histogram or columns for the convergence/divergence display.
-You can turn on/off and adjust the overbought / oversold zones.
-You can choose what type of moving average to use in the calculation from a small selection of options. This gives you more flexibility to adapt the indicator to your needs.
👍 We hope you enjoyed this indicator and find it useful! We post free crypto analysis, strategies and indicators regularly. This is our 70th script on Tradingview!
🤐Check my Signature for other information
Double MACD Buy and SellIndicator for strategy that was used in a Forex competition and was a winner. Use double MACD with custom settings, search video on YouTube:
Learn Five Powerful MACD Trading Strategies
Add some tools to analyze the market context a little more:
- Detector of regular and hidden divergences.
- Atlas Zone (detects consolidation that is about to generate a movement)
- Choppines zone configurable (detects if the market is stable or not)
Visualization of entries in trend and counter-trend according to the rules described in the video.
Buy and sell alerts.
Note: I do not recommend using only this indicator as an investment strategy, it is another tool that must be complemented with a market study by the trader.
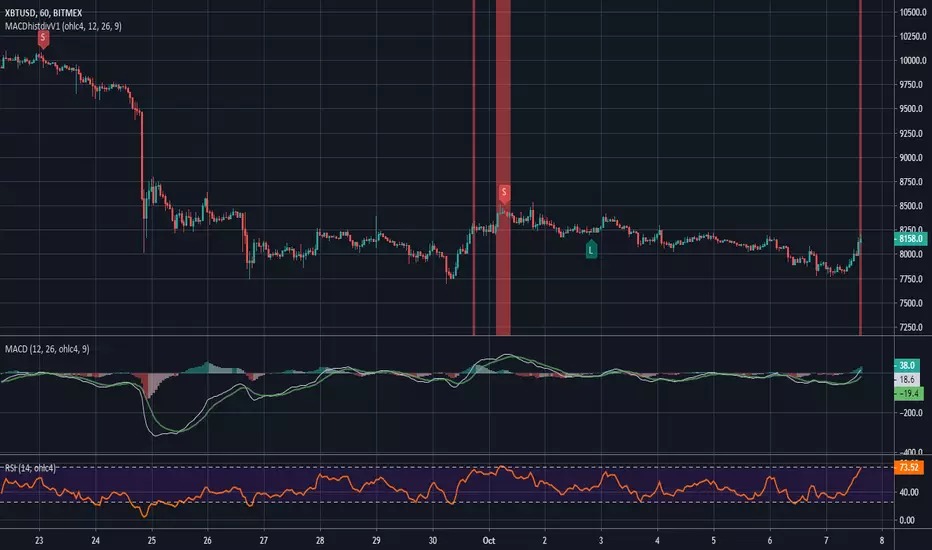
MACD and RSI divergence by Rexio v2Hi everyone!
I wrote this indicator for intraday trading and it cannot be use only by itself you need to at least draw some S/R lines to make it useful. It is based at MACD histogram and gives signal when it sees divergence on MACD/RSI/MACD's Histogram (or all at once - settings) when macd's histogram switchs trend. Im using it to playing with a trend most of the time looking for hidden divergence at higher time frame and after that looking for regular divergence at lower time frame.
Im not a computer programist nor professional trader so it is only for educational purposes only.

MACD histogram divergence by Rexio v1Hi everyone!
I wrote this indicator for intraday trading and it cannot be use only by itself you need to at least draw some S/R lines to make it useful. It is based at MACD histogram and gives signal when it sees divergence on MACD's Histogram when macd's histogram switchs trend. Im using it to playing with a trend most of the time looking. It highlights candles which can give good singnals to play with a trend (its based on ema200 and RSI overbought and oversold zones).
Im not a computer programist nor professional trader so it is only for educational purposes only.
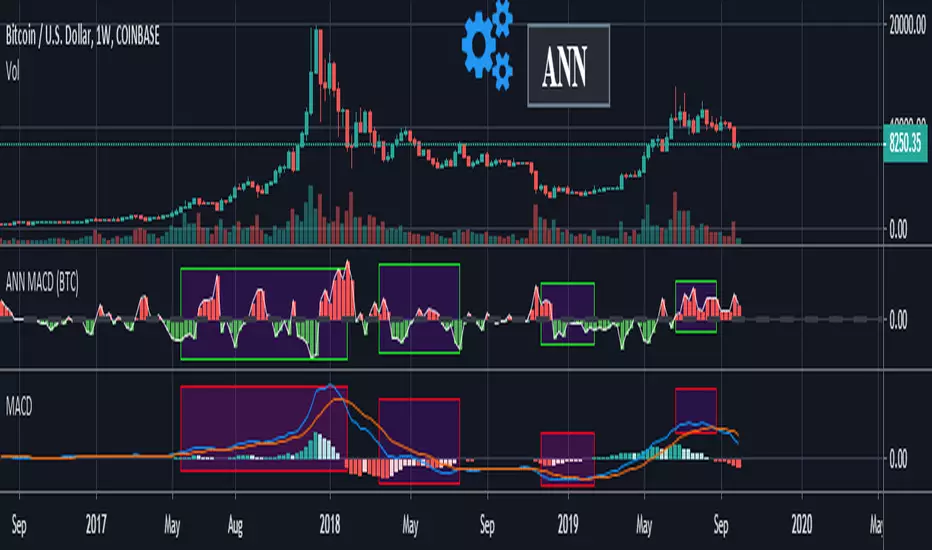
ANN MACD (BTC)
Logic is correct.
But I prefer to say experimental because the sample set is narrow. (300 columns)
Let's start:
6 inputs : Volume Change , Bollinger Low Band chg. , Bollinger Mid Band chg., Bollinger Up Band chg. , RSI change , MACD histogram change.
1 output : Future bar change (Historical)
Training timeframe : 15 mins (Analysis TF > 4 hours (My opinion))
Learning cycles : 337
Training error: 0.009999
Input columns: 6
Output columns: 1
Excluded columns: 0
Grid
Training example rows: 301
Validating example rows: 0
Querying example rows: 0
Excluded example rows: 0
Duplicated example rows: 0
Network
Input nodes connected: 6
Hidden layer 1 nodes: 8
Hidden layer 2 nodes: 0
Hidden layer 3 nodes: 0
Output nodes: 1
Learning rate : 0.6 Momentum : 0.8
More info :
EDIT : This code is open source under the MIT License. If you have any improvements or corrections to suggest, please send me a pull request via the github repository github.com
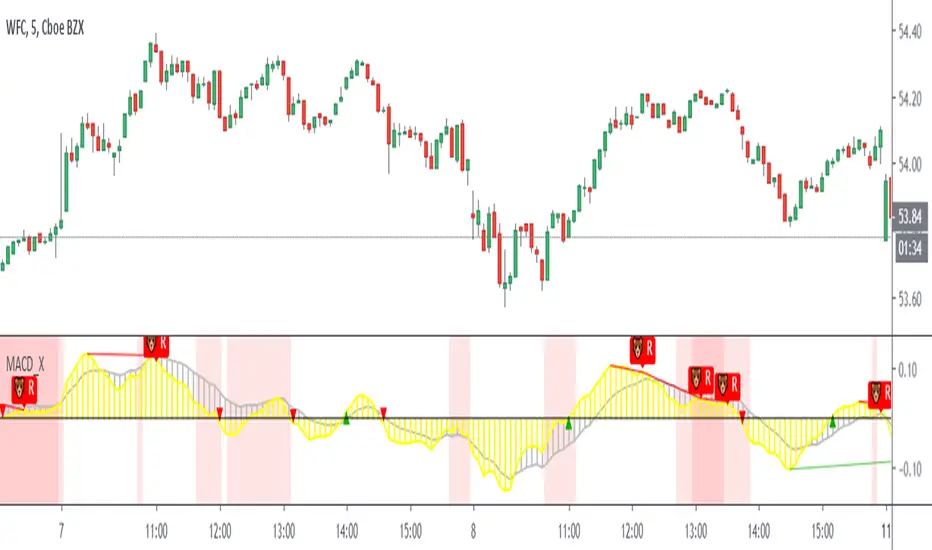
MACD with RSI WarningI like using both MACD and RSI for my strategies to confirm patterns, but I really only check RSI to see if it is outside of the normal range. So I rewrote the MACD indicator to color bars that are above or below the set RSI boundaries in a different color (yellow by default) so I can quickly check that parameter without needing both indicators up.
This is my first indicator, so please feel free to let me know how I might clean it up!
Koby's ZLEMA MACD and KAMA signalUsing zero lag ema for MACD line, and using KAMA for MACD's signal line.
Test version.
This has MACD and signal cross alert, and 0 line alert.
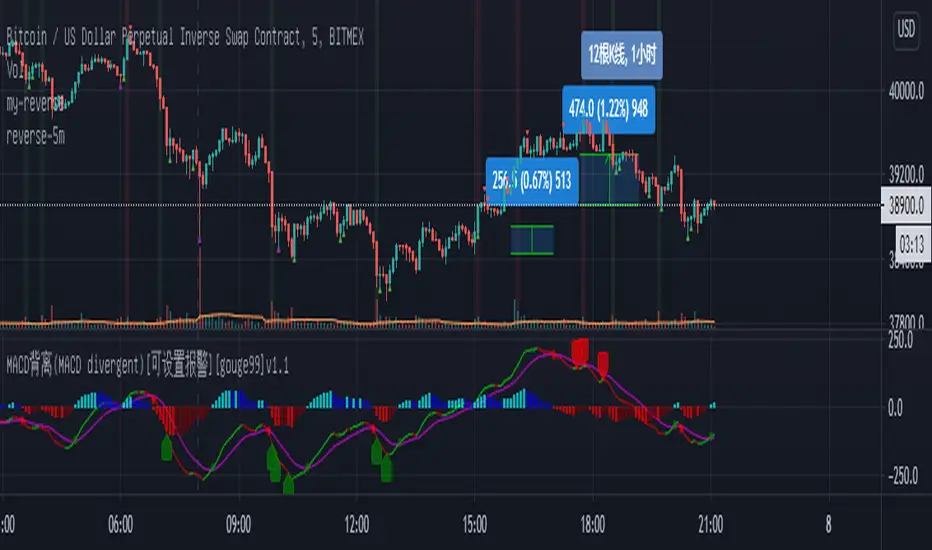
MACD背离(MACD divergent)[公开版][gouge99]注意:背离意味着做反转交易,所以入场要求很高,但是背离一般的收益风险比很大
MACD背离:收盘价创造新高或者新低,但是macd却没有出新高或者新低
计算原理:根据历史K线长度(默认90根K线)来判断收盘价的高低极值和macd的高低极值来进行比较判断
建议使用:
1.在震荡调整行情中,在支撑和压力位附近出现的突然的趋势K线,一般是假突破
2.在趋势末端,一般还会有一次缓慢的测试趋势极点的行情,一般这是趋势反转进入震荡的开始
3.结合其他形态如双顶,头肩,pin bar
4.结合其他指标如stoch随机指标做反转
5.推荐在1h, 30m, 15m级别中使用,5m也可以使用,但是最好背离计算长度设置大一点 比如150
Awesome Oscillator and MACD Histogram by SierraPilot (Lemrin)This is an indicator I stole from Lemrin. I added the plots for the MACD line and the Signal line and also changed the AO and MACD histo to an area plot. MACD = red and green. AO = blue and yellow. Green over top of Blue = possible reversal. Green overlaid over blue = uptrend. Yellow over top of Red = downside reversal possible. Yellow overlaid over Red = downtrend in progress. MACD and Signal line behave normally. Thanks to Lemrin for the majority of the code.

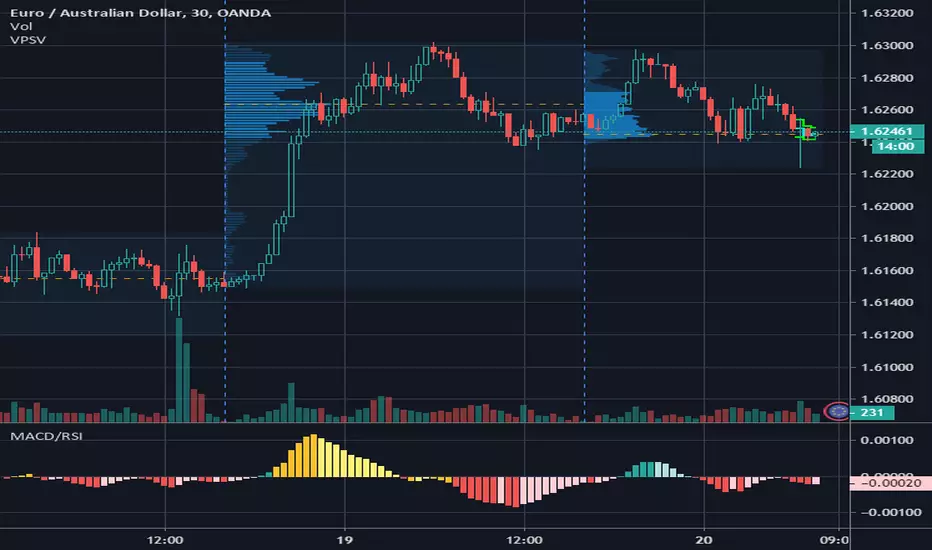
Multi-indicador MACD/RSI/volumen en ventanaComplemento para el otro indicador que ya publiqué.
En esta caso añado las gráficas de MACD, RSI y volumen en una sola ventana.
El problema para esto es el escalado de las gráficas del MACD y el volumen para que entren en una escala de 1 a 100 para lo que tomo los máximos y mínimos de 500 velas (este valor se puede cambiar).
Adicionalmente, coloreo el macd de verde cuando sobrepasa a la señal o de rojo cuando va por debajo y lo mismo con el rsi.
Añado el volumen a todo esto, también escalado.

GBPJPY MACD 1min Long OnlyThis MACD indicator uses two lines for long and sell long. It also uses a MACD indicator line with a historian. When the MACD historian crosses over the buy line, a long signal is executed. When the MACD historian crosses over the sell line, a close entry is signal is executed. There is a also a built in stop loss and you can adjust the buy and sell lines accordingly.
This does not repaint and I use it for autoview with an alert to autotrade this strategy.

GBPUSD MACD 1min Long OnlyThis MACD indicator uses two lines for long and sell long. It also uses a MACD indicator line with a historian. When the MACD historian crosses over the buy line, a long signal is executed. When the MACD historian crosses over the sell line, a close entry is signal is executed. There is a also a built in stop loss and you can adjust the buy and sell lines accordingly.
This does not repaint and I use it for autoview with an alert to autotrade this strategy.

EURUSD MACD 1 min Long OnlyThis MACD indicator uses two lines for long and sell long. It also uses a MACD indicator line with a historian. When the MACD historian crosses over the buy line, a long signal is executed. When the MACD historian crosses over the sell line, a close entry is signal is executed. There is a also a built in stop loss and you can adjust the buy and sell lines accordingly.
This does not repaint and I use it for autoview with an alert to autotrade this strategy.

Simple Alt Coin Strategy - EMA and MACD w/Profit and StopThis script prints BUY and SELL signals based on settings you input. I use it to save time while scrolling through charts deciding what alts I want to look at.
BUY SIGNALS
Positive EMA Crossover
Positive MACD Crossover
Single Candle Gains
SELL SIGNALS
Profit Capture
Stop Loss
I don't trade based just on the BUY or SELL from this strategy, but I have found that these indicators do very well well looking at the large cap alt coins. It backtests well.
Default Settings EMA 5/12/50, MACD 9/12/26, Single Candle Gain 10%, Stop 10%, Profit Capture 45%

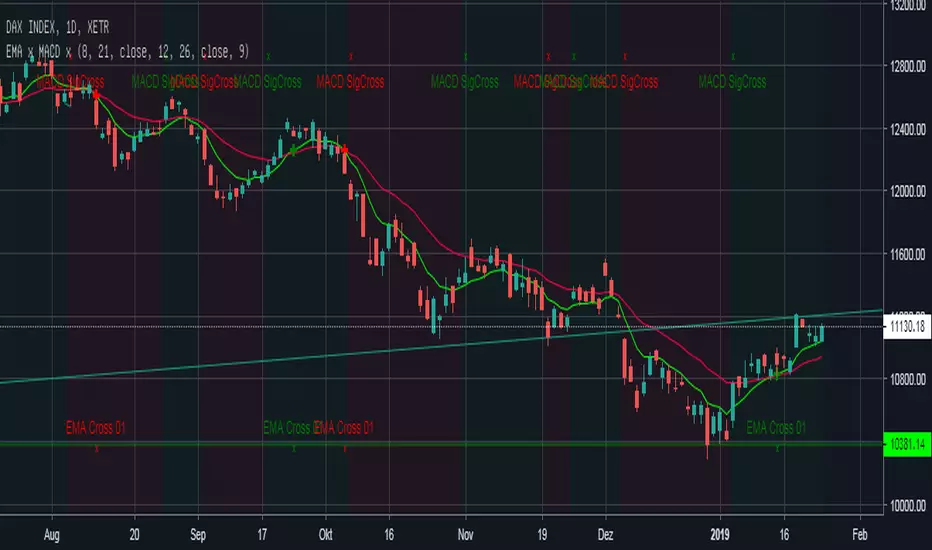
EMA Cross + MACD Signal Cross overlay Einfacher EMA-Cross Indikator mit Indikation der Crosses auf EMA-Linie und am Chart-Bottom +
MACD-Cross wird default an: location.top angezeigt zusätzlich zeigt die Hintergrundfarbe an ob der MACD über (grün) oder unter (rot) seinem Signal liegt.