MACD+RSI+BBDESCRIPTION
The MACD + RSI + Bollinger Bands Indicator is a comprehensive technical analysis tool designed for traders and investors to identify potential market trends and reversals. This script combines three indicators: the Moving Average Convergence Divergence (MACD), the Relative Strength Index (RSI), and Bollinger Bands. Each of these indicators provides unique insights into market behavior.
FEATURES
MACD (Moving Average Convergence Divergence)
The MACD is a trend-following momentum indicator that shows the relationship between two moving averages of a security’s price.
The script calculates the MACD line, the signal line, and the histogram, which visually represents the difference between the MACD line and the signal line.
RSI (Relative Strength Index)
The RSI is a momentum oscillator that measures the speed and change of price movements. It ranges from 0 to 100 and is typically used to identify overbought or oversold conditions.
The script allows users to set custom upper and lower thresholds for the RSI, with default values of 70 and 30, respectively.
Bollinger Bands
Bollinger Bands consist of a middle band (EMA) and two outer bands (standard deviations away from the EMA). They help traders identify volatility and potential price reversals.
The script allows users to customize the length of the Bollinger Bands and the multiplier for the standard deviation.
Color-Coding Logic
The histogram color changes based on the following conditions:
Black: If the RSI is above the upper threshold and the closing price is above the upper Bollinger Band, or if the RSI is below the lower threshold and the closing price is below the lower Bollinger Band.
Green (#4caf50): If the RSI is above the upper threshold but the closing price is not above the upper Bollinger Band.
Light Green (#a5d6a7): If the histogram is positive and the RSI is not above the upper threshold.
Red (#f23645): If the RSI is below the lower threshold but the closing price is not below the lower Bollinger Band.
Light Red (#faa1a4): If the histogram is negative and the RSI is not below the lower threshold.
Inputs
Bollinger Bands Settings
Length: The number of periods for the moving average.
Basis MA Type: The type of moving average (SMA, EMA, SMMA, WMA, VWMA).
Source: The price source for the Bollinger Bands calculation.
StdDev: The multiplier for the standard deviation.
RSI Settings
RSI Length: The number of periods for the RSI calculation.
RSI Upper: The upper threshold for the RSI.
RSI Lower: The lower threshold for the RSI.
Source: The price source for the RSI calculation.
MACD Settings
Fast Length: The length for the fast moving average.
Slow Length: The length for the slow moving average.
Signal Smoothing: The length for the signal line smoothing.
Oscillator MA Type: The type of moving average for the MACD calculation.
Signal Line MA Type: The type of moving average for the signal line.
Usage
This indicator is suitable for various trading strategies, including day trading, swing trading, and long-term investing.
Traders can use the MACD histogram to identify potential buy and sell signals, while the RSI can help confirm overbought or oversold conditions.
The Bollinger Bands provide context for price volatility and potential breakout or reversal points.
Example:
From the example, it can clearly see that the Selling Climax and Buying Climax, marked as orange circle when a black histogram occurs.
Conclusion
The MACD + RSI + Bollinger Bands Indicator is a versatile tool that combines multiple technical analysis methods to provide traders with a comprehensive view of market conditions. By utilizing this script, traders can enhance their analysis and improve their decision-making process.
ابحث في النصوص البرمجية عن "macd"

MACD Histogram Fibonacci Retracement LevelsMACD Histogram Fibonacci Retracement Level s.
MACD Histogram Fibonacci Retracement Levels indicator considers the highest and lowest histogram bar levels from Intraday Day Open.
Fibonacci retracement levels 23.6%, 38.2%, 50%, 61.8%, and 78.6% are displayed for the Highest and Lowest histogram bar .As the day progress revised Fibonacci Retracement Levels are set in based on change in Highest and Lowest histogram bar levels.
Histogram bars positions are monitored vis a vis the Fibonacci Retracement Levels to plan the trade entry or exit as per MACD indicator.
MACD and Signal levels are opted out to get clear histogram bar image on chart. Input check in box is available to display MACD and signal lines at Users option.
A Histogram intraday average line (Histo Intra Avg) indicate the intraday average movement of histogram bars.
MACD Histogram Fibonacci Retracement Levels is very useful to know the level of upward and downward Histogram bar movements vis a vis Fibonacci Retracement Levels compared to general MACD Indicator Histogram levels.
DISCLAIMER: For educational and entertainment purpose only .Nothing in this content should be interpreted as financial advice or a recommendation to buy or sell any sort of security/ies or investment/s.

Adaptive MA Scalping StrategyAdaptive MA Scalping Strategy
The Adaptive MA Scalping Strategy is an innovative trading approach that merges the strengths of the Kaufman's Adaptive Moving Average (KAMA) with the Moving Average Convergence Divergence (MACD) histogram. This combination results in a momentum-adaptive moving average that dynamically adjusts to market conditions, providing traders with timely and reliable signals.
How It Works
Kaufman's Adaptive Moving Average (KAMA): Unlike traditional moving averages, KAMA adjusts its sensitivity based on market volatility. It becomes more responsive during trending markets and less sensitive during periods of consolidation, effectively filtering out market noise.
MACD Histogram Integration: The strategy incorporates the MACD histogram, a momentum indicator that measures the difference between a fast and a slow exponential moving average (EMA). By adding the MACD histogram values to the KAMA, the strategy creates a new line—the momentum-adaptive moving average (MOMA)—which captures both trend direction and momentum.
Signal Generation:
Long Entry: The strategy enters a long position when the closing price crosses above the MOMA. This indicates a potential upward momentum shift.
Exit Position: The position is closed when the closing price crosses below the MOMA, signaling a potential decline in momentum.
Cloud Calculation Detail
The MOMA is calculated by adding the MACD histogram value to the KAMA of the price. This addition effectively adjusts the KAMA based on the momentum indicated by the MACD histogram. When momentum is strong, the MACD histogram will have higher values, causing the MOMA to adjust accordingly and provide earlier entry or exit signals.
Performance on Stocks
This strategy has demonstrated excellent performance on stocks when applied to the 1-hour timeframe. Its adaptive nature allows it to respond swiftly to market changes, capturing profitable trends while minimizing the impact of false signals caused by market noise. The combination of KAMA's adaptability and MACD's momentum detection makes it particularly effective in volatile market conditions commonly seen in stock trading.
Key Parameters
KAMA Length (malen): Determines the sensitivity of the KAMA. A length of 100 is used to balance responsiveness with noise reduction.
MACD Fast Length (fast): Sets the period for the fast EMA in the MACD calculation. A value of 24 helps in capturing short-term momentum changes.
MACD Slow Length (slow): Sets the period for the slow EMA in the MACD calculation. A value of 52 smooths out longer-term trends.
MACD Signal Length (signal): Determines the period for the signal line in the MACD calculation. An 18-period signal line is used for timely crossovers.
Advantages of the Strategy
Adaptive to Market Conditions: By adjusting to both volatility and momentum, the strategy remains effective across different market phases.
Enhanced Signal Accuracy: The fusion of KAMA and MACD reduces false signals, improving the accuracy of trade entries and exits.
Simplicity in Execution: With straightforward entry and exit rules based on price crossovers, the strategy is user-friendly for traders at all experience levels

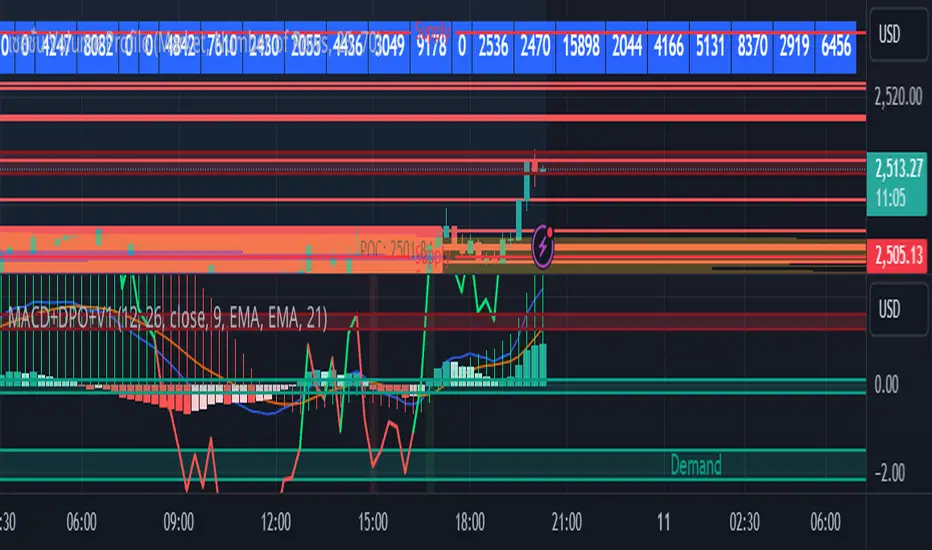
MACD with DPO Strategy by NGExplanation of the MACD with DPO Strategy:
MACD (Moving Average Convergence Divergence):
The MACD is a trend-following indicator that shows the relationship between two moving averages of a price.
In this script:
We calculate the MACD line by subtracting the slow moving average (typically 26-period EMA) from the fast moving average (typically 12-period EMA).
The Signal line is calculated as a 9-period EMA of the MACD line.
The Histogram is the difference between the MACD line and the Signal line, indicating the momentum of the price trend.
Buy Condition: The script generates a buy signal when the MACD histogram crosses from negative to positive (indicating a bullish momentum) and DPO is also positive.
Sell Condition: The script generates a sell signal when the MACD histogram crosses from positive to negative (indicating a bearish momentum) and DPO is also negative.
DPO (Detrended Price Oscillator):
The DPO removes long-term trends from prices, making it easier to identify shorter-term cycles or oscillations.
In this script:
We calculate the DPO by subtracting a shifted simple moving average (SMA) from the close price. The shifting period depends on half the specified period.
We also calculate the DPO SMA as a 30-period EMA of the DPO values.
DPO Color: The DPO line is colored green when the DPO is above zero (indicating upward momentum) and red when it is below zero (indicating downward momentum). The histogram is also colored based on whether the DPO is positive or negative.
Plotting and Alerts:
The script plots the MACD, Signal, and Histogram on the chart.
Additionally, it plots the DPO and its SMA with different colors depending on whether the DPO is above or below zero.
Buy Signal: A green arrow labeled "BUY" is plotted below the bar when both MACD and DPO indicate a bullish condition.
Sell Signal: A red arrow labeled "SELL" is plotted above the bar when both MACD and DPO indicate a bearish condition.
Background colors are used to highlight the chart whenever a buy or sell condition occurs.
The script also includes alerts for both buy and sell signals, allowing users to set notifications when conditions are met.
How to Use:
Identify Buy and Sell Signals:
The script generates a Buy signal when:
The MACD histogram crosses from negative to positive (bullish momentum), and
The DPO is above zero (indicating upward momentum).
The script generates a Sell signal when:
The MACD histogram crosses from positive to negative (bearish momentum), and
The DPO is below zero (indicating downward momentum).
Chart Visualization:
The MACD histogram and Signal line help visualize the momentum and potential trend reversal.
The DPO and DPO SMA help visualize the shorter-term price cycles.
The signals (Buy and Sell) will be plotted on the chart with arrows indicating entry points.
Customization:
You can adjust the MACD and DPO parameters (such as fast_length, slow_length, period_) to fit your trading style or market conditions.
The script can be used in any timeframe depending on your strategy (e.g., intraday trading or longer-term trading).
Example Scenario:
If you're looking for potential buy opportunities, wait for the script to generate a buy signal (green arrow) where the MACD histogram has shifted to positive, and DPO is also in the green (above zero). This signals that both momentum and cycle direction are aligned for a potential upward movement.
Conversely, for sell opportunities, wait for the red arrow where MACD momentum is turning negative and DPO is also negative (below zero), indicating a bearish condition.
This combination of MACD and DPO allows traders to identify stronger and more reliable entry/exit points by confirming the trend with the MACD and detecting shorter-term price cycles with the DPO.
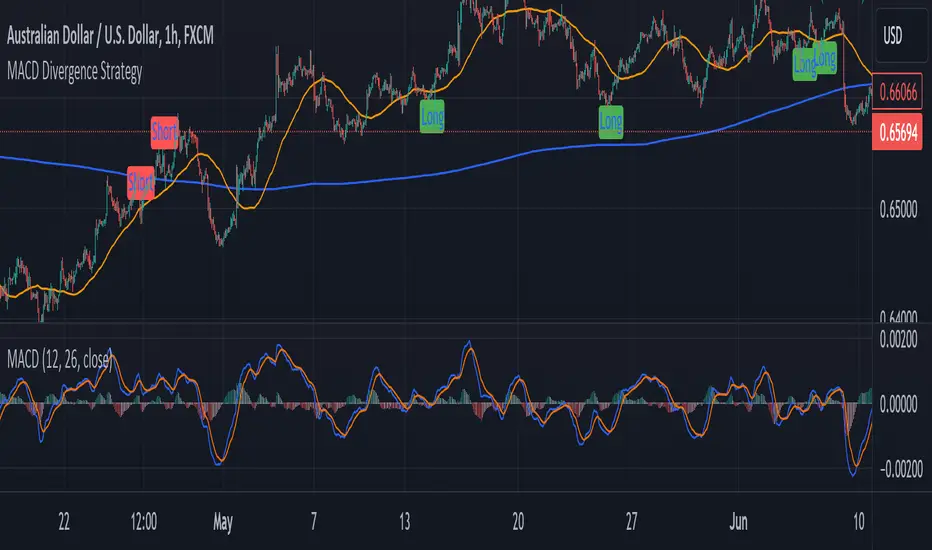
MACD Divergence StrategyStrategy Description: MACD Divergence with SMA Crossover Strategy
Overview:
The MACD Divergence with SMA Crossover Strategy is designed to identify high-probability trading opportunities based on the interaction of the MACD (Moving Average Convergence Divergence) indicator and key moving averages. This strategy focuses on detecting divergences between the MACD line and the signal line, combined with specific conditions related to the 50-period and 800-period SMAs. It ensures that the MACD and signal lines do not cross the zero line between the current and previous divergence points, thereby filtering out weaker signals and enhancing the accuracy of trade entries.
Key Components:
Simple Moving Averages (SMAs):
50-period SMA: A short-term trend indicator that helps identify the prevailing market direction.
800-period SMA: A long-term trend indicator used to gauge the overall market trend.
MACD Indicator:
MACD Line: Represents the difference between the 12-period EMA and the 26-period EMA.
Signal Line: A 9-period EMA of the MACD line.
Histogram: The difference between the MACD line and the signal line, used to visualize the strength of the signal.
Trade Conditions:
Long Position (Buy):
The 50 SMA is above the 800 SMA, indicating a bullish market trend.
The MACD line and signal line are both below zero, signifying a potential bullish reversal.
A bullish divergence is detected when the MACD line crosses above the signal line below zero, without either line crossing the zero level between the current and previous cross.
Short Position (Sell):
The 50 SMA is below the 800 SMA, indicating a bearish market trend.
The MACD line and signal line are both above zero, signaling a potential bearish reversal.
A bearish divergence is detected when the MACD line crosses below the signal line above zero, without either line crossing the zero level between the current and previous cross.
Signal Plotting:
Long Signals: Displayed when the conditions for a bullish divergence and SMA alignment are met, marked with a green upward arrow on the chart.
Short Signals: Displayed when the conditions for a bearish divergence and SMA alignment are met, marked with a red downward arrow on the chart.
MACD Trail | Flux Charts💎 GENERAL OVERVIEW
Introducing our new MACD Trail indicator! Moving average convergence/divergence (MACD) is a well-known indicator among traders. It's a trend-following indicator that uses the relationship between two exponential moving averages (EMAs). This indicator aims to use MACD to generate a trail that follows the current price of the ticker, which can act as a support / resistance zone. More info about the process in the "How Does It Work" section.
Features of the new MACD Trail Indicator :
A Trail Generated Using MACD Calculation
Customizable Algorithm
Customizable Styling
📌 HOW DOES IT WORK ?
First of all, this indicator calculates the current MACD of the ticker using the user's input as settings. Let X = MACD Length setting ;
MACD ~= X Period EMA - (X * 2) Period EMA
Then, two MACD Trails are generated, one being bullish and other being bearish. Let ATR = 30 period ATR (Average True Range)
Bullish MACD Trail = Current Price + MACD - (ATR * 1.75)
Bearish MACD Trail = Current Price + MACD + (ATR * 1.75)
The indicator starts by rendering only the Bullish MACD Trail. Then if it's invalidated (candlestick closes below the trail) it switches to Bearish MACD Trail. The MACD trail switches between bullish & bearish as they get invalidated.
The trail type may give a hint about the current trend of the price action. The trail itself also can act as a support / resistance zone, here is an example :
🚩 UNIQUENESS
While MACD is one of the most used indicators among traders, this indicator aims to add another functionality to it by rendering a trail based on it. This trail may act as a support / resistance zone as described above, and gives a glimpse about the current trend. The indicator also has custom MACD Length and smoothing options, as well as various style options.
⚙️ SETTINGS
1. General Configuration
MACD Length -> This setting adjusts the EMA periods used in MACD calculation. Increasing this setting will make MACD more responseive to longer trends, while decreasing it may help with detection of shorter trends.
Smoothing -> The smoothing of the MACD Trail. Increasing this setting will help smoothen out the MACD Trail line, but it can also make it less responsive to the latest changes.

Moving Average Crossover Swing StrategyMoving Average Crossover Swing Strategy
**Overview:**
The basic concept of this strategy is to generate a signal when a faster/shorter length moving average crosses over (for Longs) or crosses under (for Shorts) a medium/longer length moving average. All of which are customizable. This strategy can work on any timeframe, however the daily is the timeframe used for the default settings and screenshots, as it was designed to be a multi-day swing strategy. Once a signal has been confirmed with a candle close, based on user options, the strategy will enter the trade on the open of the next candle.
The crossover strategy is nothing new to trading, but what can make this strategy unique and helpful, is the addition of further confirmation points, ATR based stop loss and take profit targets, optional early exit criteria, customizable to your needs and style, and just about everything visual can be toggled on/off. This strategy is based on a Trend (MA) indicator and a Momentum (MACD) indicator. While a Volume-based indicator is not shown here, one could consider using their favorite from that category to further compliment the signal idea.
It should be noted that depending on the time frame, direction(s) chosen, the signal options, confirmation options, and exit options selected, that a ticker may not produce more than 100 trades on the back test. Depending on your style and frequency, one could consider adjusting options and/or testing multiple tickers. It should also be noted that this strategy simply tests the underlying stock prices, not options contracts. And of course, testing this strategy against historical data does not assume that the same results will occur in future price action.
Shoutout given to Ripster's Clouds Indicator as pieces of that code were taken and modified to create both the Cloud visualization effects, and the Moving Average Pair Plots that are implemented in this strategy.
BASIC DEFAULTS
All can be changed as normal
Initial capital = 10,000
Order Sizing = 25% of equity (use the "Inputs" tab to modify this)
Pyramiding = 0
Commission = 0.65 USD per order
Price Verification = 1 tick
Slippage = 1 tick
RISK MANAGMENT
You will notice two different percentage options and ATR multipliers. This strategy will adjust position sizing by not exceeding either one of those % values based on the ATR (Average True Range) of the symbol and the multipliers selected, should the stock hit the stop loss price.
For Example, lets assume these values are true:
Account size = $10,000,
Max Risk = 1% of account size
Max Position Size = 25% of the account size
Stock Price = 23.45
ATR = 3.5
ATR Stop Loss Multiplier = 1.4
Then the formulas would be:
ACCT_SIZE * MaxRisk_% = 10000 * .01 = $100 (MaxCashRisk)
-----
MaxCashRisk / (ATR * ATR_SL_MULTIPLIER) = 100 / (3.5 * 1.4) = 20.4 Shares based on Max Cash Risk
-----
(ACCT_SIZE * MaxEquity_%) / STOCK_PRICE = (10000 * .25) / 23.45 = 106.61 Shares based on Max Equity Allocation
The minimum value of each of those options is then used, which in this case would be to purchase 20 shares so as not to exceed the max dollar risk should the stock reach the stop loss target. Likewise, if the ATR were to be much lower, say 0.48 cents, and all else the same, then the strategy would purchase the 106 shares based on Max Equity Allocation because the Max Cash Risk would require 149.25 shares.
MOVING AVERAGE OPTIONS
Select between and change the length & type of up to 5 pairs (10 total) of moving averages
The "Show Cloud-x" option will display a fill color between the "a" and "b" pairs
All moving averages lines can be toggled on/off in the "Style" tab, as well as adjusting their colors.
Visualization features do not affect calculations, meaning you could have all or nothing on the chart and the strategy will still produce results
SIGNAL CHOICES
Choose the fast/shorter length MA and the medium/longer length MA to determine the entry signal
CONFIRMATION OPTIONS
Both of these have customizable values and can be toggled on/off
A candle close over a slower/much longer length moving average
An additional cross-over (cross-under for Shorts) on the MACD indicator using default MACD values. While the MACD indicator is not necessary to have on the chart, it can help to add that for visualization. The calculations will perform whether the indicator is on the chart or not.
EARLY EXIT CRITERIA
Both can be toggled on/off with customizable values
MA Cross Exit will exit the trade early if the select moving averages cross-under (for longs) or cross-over (for shorts), indicating a potential reversal.
Max Bars in Trades will act as a last-resort exit by simply calculating the amount of full bars the trade has been open, and exiting on the opening of the next bar. For example: the default value is 8 bars, so after 8 full bars in the trade, if no other exit has been triggered (Stop Loss, Take Profit, or MA Cross(if enabled)), then the trade will exit at the opening of the 9th bar.
Finally, there is a table displaying the amount of trades taken for each side, and the amount & percent of both early exits. This table can be turned off in the "Style" tab
ADDITIONAL PLOTS
MACD (Moving Average Convergence/Divergence):
- The MACD is an optional confirmation indicator for this strategy.
- Plotting the indicator is not necessary for the strategy to work, but it can be helpful to visually see the status and position of the MACD if this feature is enabled in the strategy
- This helps to identify if there is also momentum behind the entry signal

2 MA Cross Cvg Dvg Slope Overview
This indicator combines the Moving Average Convergence Divergence (MACD) and two Moving Averages (MAs) to assess market momentum and trend direction. It aims to provide insights into the strength and direction of price movements by analyzing the MACD line, MAs slopes, and MA crossovers. Instead of eyeballing the exact MA crossovers and MAs slope steepness on the chart and MACD line changes on separate panes, this indicator pixelate the overloaded information or multiple indicators interpretation into a KISS "boolean" decision making.
Key Components
MACD Line
This line represents the difference between the fast MA and slow MA. It reflects short-term price momentum relative to the long-term trend.
Moving Averages (MAs)
Two types of MAs are utilized in this indicator:
Fast MA (short-term): Often a 9-period MA or similar, which reacts quickly to price changes.
Slow MA (long-term): Typically a 21-period MA or similar, which smooths out price fluctuations and identifies the longer-term trend.
Indicator Logic
MA Crossover: The crossover of the fast MA above the slow MA suggests a bullish trend, while a crossover below indicates a bearish trend.
MA Slope Analysis: The indicator also considers the slopes of both the fast and slow MAs to determine the direction:
Both MA Positive Slope: Indicates upward momentum or bullish trend.
Both MA Negative Slope: Indicates downward momentum or bearish trend.
One MA Positive Slope, the other Negative Slope: Indicates indecision.
MACD Line: MACD Line consecutively increase means increasing positive momentum, vice versa.
Interpretation
Uptrend: When fast MA cross over slow MA. Indicator show "+" symbol at top zone with value 0.5.
Additional Uptrend Confirmation: When both MAs have positive slope. Indicator show only green bar.
Uptrend Upward Momentum: MACD Line increase when fast MA above slow MA. Indicator show "." symbol value 0.75.
Uptrend Downward Momentum: MACD Line decrease when fast MA above slow MA. Indicator show "." symbol value 0.25.
Indecision: When one of the MA has positive slope, but another MA has negative slope. Indicator showing both red and green bar.
Downtrend: When fast MA cross under slow MA. Indicator show "+" symbol at bottom zone with value 0.5.
Additional Downtrend Confirmation: When both MAs have negative slope. Indicator show only red bar.
Downtrend Upward Momentum: MACD Line increase when fast MA below slow MA. Indicator show "." symbol value -0.25.
Uptrend Downward Momentum: MACD Line decrease when fast MA below slow MA. Indicator show "." symbol value -0.75.
Combination of above multiple interpretation can further derive different signal for Trend Starts, Trend Continuous, and Trend Reversals.
Usage
This indicator is valuable for traders seeking to:
Identify entry and exit points based on single or multiple combination of MAs and MACD Line signals.
Confirm trend direction using MAs cross over or cross under spotted easily with the "+" symbol above 0 or below 0.
Double confirm the trend based on two MAs align slope direction.
Understand momentum shifts and potential trend reversals with an easy 4 different dots at -0.75, -0.25, 0.25, and 0.75.
Conclusion
By combining MACD Line analysis with Moving Average slopes and crossovers, this indicator offers a comprehensive approach to assessing market momentum and trend direction. It provides clear signals for traders to make informed decisions on when to enter or exit positions, enhancing overall trading strategy effectiveness without the need of referring to multiple chart or zoom in and out of the price chart to identify the crossover and slope direction.

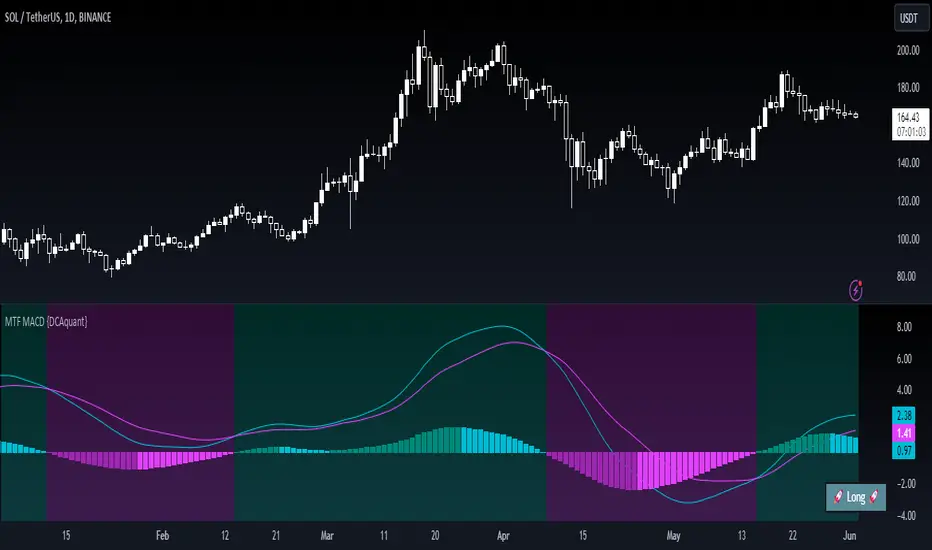
Multi Timeframe Moving Average Convergence Divergence {DCAquant}Overview
The MTF MACD indicator provides a unique view of MACD (Moving Average Convergence Divergence) and Signal Line dynamics across various timeframes. It calculates the MACD and Signal Line for each selected timeframe and aggregates them for analysis.
Key Features
MACD Calculation
Utilizes standard MACD calculations based on user-defined parameters like fast length, slow length, and signal smoothing.
Determines the difference between the MACD and Signal Line to identify convergence or divergence.
Multiple Timeframe Analysis
Allows users to select up to six different timeframes for analysis, ranging from minutes to days, providing a holistic view of market trends.
Calculates MACD and Signal Line for each timeframe independently.
Aggregated Analysis
Combines MACD and Signal Line values from multiple timeframes to derive a consolidated view.
Optionally applies moving average smoothing to aggregated MACD and Signal Line values for better clarity.
Position Identification
Determines the trading position (Long, Short, or Neutral) based on the relationship between MACD and Signal Line.
Considers the proximity of MACD and Signal Line to identify potential trading opportunities.
Visual Representation
Plots MACD and Signal Line on the price chart for visual analysis.
Utilizes color-coded backgrounds to indicate trading conditions (Long, Short, or Neutral) for quick interpretation.
Dynamic Table Display
Displays trading position alongside graphical indicators (rocket for Long, snowflake for Short, and star for Neutral) in a customizable table.
Offers flexibility in table placement and size for user preference.
How to Use
Parameter Configuration
Adjust parameters like fast length, slow length, and signal smoothing to fine-tune MACD calculations.
Select desired timeframes for analysis based on trading preferences and market conditions.
Interpretation
Monitor the relationship between MACD and Signal Line on the price chart.
Pay attention to color-coded backgrounds and graphical indicators in the table for actionable insights.
Decision Making
Consider entering Long positions when MACD is above the Signal Line and vice versa for Short positions.
Exercise caution during Neutral conditions, as there may be uncertainty in market direction.
Risk Management
Combine MTF MACD analysis with risk management strategies to optimize trade entries and exits.
Set stop-loss and take-profit levels based on individual risk tolerance and market conditions.
Conclusion
The Multi Timeframe Moving Average Convergence Divergence (MTF MACD) indicator offers a robust framework for traders to analyze market trends across multiple timeframes efficiently. By combining MACD insights from various time horizons and presenting them in a clear and actionable format, it empowers traders to make informed decisions and enhance their trading strategies.
Disclaimer
The Multi Timeframe Moving Average Convergence Divergence (MTF MACD) indicator provided here is intended for educational and informational purposes only. Trading in financial markets involves risk, and past performance is not indicative of future results. The use of this indicator does not guarantee profits or prevent losses.
Please be aware that trading decisions should be made based on your own analysis, risk tolerance, and financial situation. It is essential to conduct thorough research and seek advice from qualified financial professionals before engaging in any trading activity.
The MTF MACD indicator is a tool designed to assist traders in analyzing market trends and identifying potential trading opportunities. However, it is not a substitute for sound judgment and prudent risk management.
By using this indicator, you acknowledge that you are solely responsible for your trading decisions, and you agree to indemnify and hold harmless the developer and distributor of this indicator from any losses, damages, or liabilities arising from its use.
Trading in financial markets carries inherent risks, and you should only trade with capital that you can afford to lose. Exercise caution and discretion when implementing trading strategies, and consider seeking independent financial advice if necessary.
CAPACE MARKETThis custom indicator combines the Moving Average Convergence Divergence (MACD) and the Relative Strength Index (RSI) into a single trading tool. It calculates the MACD and RSI values, then averages these two indicators to create a composite line. This average line is intended to capture the momentum and relative strength of the market simultaneously, potentially offering a more nuanced view of market conditions.
Key features of the indicator include:
Visualization of MACD and RSI Lines: It plots the MACD and RSI values as separate lines on the chart, allowing traders to see the behavior of each indicator clearly.
Average Line: A line representing the average of the MACD and RSI indicators is plotted, providing a synthesized view of both momentum and strength.
Entry Points Indication: The indicator uses red dots to mark the points where the average line crosses over or under the MACD or RSI lines. These intersections are meant to signal potential entry points for traders.
Market Condition Highlighting: The background color changes based on whether the average line is above or below zero. A green background suggests a positive market condition (bullish), while a red background indicates a negative market condition (bearish).
This tool aims to offer traders an integrated perspective by combining the insights of both MACD and RSI, potentially aiding in the identification of entry and exit points as well as the overall market sentiment.

MACD_RSI_trend_followingINFO:
This indicator can be used to build-up a strategy for trading of assets which are currently in trending phase.
My preference is to use it on slowly moving assets like GOLD and on higher timeframes, but practice may show that we find more usefull cases.
This script uses two indicators - MACD and RSI, as the timeframe that those are extracted for is configurable (defaults with the Chart TF, but can be any other selected by the user).
The strategy has the following simple idea - buy if any if the conditions below is true:
The selected TF MACD line crosses above the signal line and the TF RSI is above the user selected trigger value
The selected TF MACD line is above the signal line and the TF RSI crosses above the user selected trigger value
Once we're in position we wait for the selected TF MACD line to cross below the signal line, and then we set a SL at the low of that bar
DETAILS and USAGE:
In the current implementation I find two possible use cases for the indicator:
as a stand-alone indicator on the chart which can also fire alerts that can help to determine if we want to manually enter/exit trades based on them
can be used to connect to the Signal input of the TTS (TempalteTradingStrategy) by jason5480 in order to backtest it, thus effectively turning it into a strategy (instructions below in TTS CONNECTIVITY section)
In the example below we see a position opened at the bar after the buy indicator from the script has been triggered, and then later after the SL indicator from the script has been triggered a SL has been set on the lower wick of the closing candle, and the position eventually got closed once the price hit that level. Note that most of the drawing on the example snapshot below are from the TTS indicator following the buy/sell/SL conditions themseves:
Trading period can be selected from the indicator itself to limit to more interesting periods.
Arrow indications are drawn on the chart to indicate the trading conditions met in the script - green arrow for a buy signal indication and orange for LTF crossunder to indicate setting of SL.
SETTINGS:
Leaving all of the settings as in vanilla use case, as both the MACD and RSI indicator's settings follow the default ones for the stand-alone indicators themselves.
The start-end date is a time filter that can be extermely usefull when backtesting different time periods.
Pesonal preference is using the script on a D/W timeframe, while the indicator is configured to use Monthly chart.
The default value of the RSI filter is left to 50, which can be changed. I.e. if the RSI is above 50 we have a regime filter based on the MACD criteria.
EXTERNAL LIBRARIES:
The script uses a couple of external libraries:
HeWhoMustNotBeNamed/enhanced_ta/14 - collection of TA indicators
jason5480/tts_convention/3 - more details about the Template Trading Strategy below
I would like to highly appreciate and credit the work of both HeWhoMustNotBeNamed and jason5480 for providing them to the community.
TTS SETTINGS (NEEDED IF USED TO BACKTEST WITH TTS):
The TempalteTradingStrategy is a strategy script developed in Pine by jason5480, which I recommend for quick turn-around of testing different ideas on a proven and tested framework
I cannot give enough credit to the developer for the efforts put in building of the infrastructure, so I advice everyone that wants to use it first to get familiar with the concept and by checking
by checking jason5480's profile www.tradingview.com
The TTS itself is extremely functional and have a lot of properties, so its functionality is beyond the scope of the current script -
Again, I strongly recommend to be thoroughly epxlored by everyone that plans on using it.
In the nutshell it is a script that can be feed with buy/sell signals from an external indicator script and based on many configuration options it can determine how to execute the trades.
The TTS has many settings that can be applied, so below I will cover only the ones that differ from the default ones, at least according to my testing - do your own research, you may find something even better :)
The current/latest version that I've been using as of writing and testing this script is TTSv48
Settings which differ from the default ones:
from - False (time filter is from the indicator script itself)
Deal Conditions Mode - External (take enter/exit conditions from an external script)
🔌Signal 🛈➡ - MACD_RSI_trend_following: 🔌Signal to TTSv48 (this is the output from the indicator script, according to the TTS convention)
Sat/Sun - true (for crypto, in order to trade 24/7)
Order Type - STOP (perform stop order)
Distance Method - HHLL (HigherHighLowerLow - in order to set the SL according to the strategy definition from above)
The next are just personal preferenes, you can feel free to experiment according to your trading style
Take Profit Targets - 0 (either 100% in or out, no incremental stepping in or out of positions)
Dist Mul|Len Long/Short- 10 (make sure that we don't close on profitable trades by any reason)
Quantity Method - EQUITY (personal backtesting preference is to consider each backtest as a separate portfolio, so determine the position size by 100% of the allocated equity size)
Equity % - 100 (note above)

Dual_MACD_trendingINFO:
This indicator is useful for trending assets, as my preference is for low-frequency trading, thus using BTCUSD on 1D/1W chart
In the current implementation I find two possible use cases for the indicator:
- as a stand-alone indicator on the chart which can also fire alerts that can help to determine if we want to manually enter/exit trades based on the signals from it (1D/1W is good for non-automated trading)
- can be used to connect to the Signal input of the TTS (TempalteTradingStrategy) by jason5480 in order to backtest it, thus effectively turning it into a strategy (instructions below in TTS CONNECTIVITY section)
Trading period can be selected from the indicator itself to limit to more interesting periods.
Arrow indications are drawn on the chart to indicate the trading conditions met in the script - light green for HTF crossover, dark green for LTF crossover and orange for LTF crossunder.
Note that the indicator performs best in trending assets and markets, and it is advisable to use additional indicators to filter the trading conditions when market/asset is expected to move sideways.
DETAILS:
It uses a couple of MACD indicators - one from the current timeframe and one from a higher timeframe, as the crossover/crossunder cases of the MACD line and the signal line indicate the potential entry/exit points.
The strategy has the following flow:
- If the weekly MACD is positive (MACD line is over the signal line) we have a trading window.
- If we have a trading window, we buy when the daily macd line crosses AND closes above the signal line.
- If we are in a position, we await the daily MACD to cross AND close under the signal line, and only then place a stop loss under the wick of that closing candle.
The user can select both the higher (HTF) and lower (LTF) timeframes. Preferably the lower timeframe should be the one that the Chart is on for better visualization.
If one to decide to use the indicator as a strategy, it implements the following buy and sell criterias, which are feed to the TTS, but can be also manually managed via adding alerts from this indicator.
Since usually the LTF is preceeding the crossover compared to the HTF, then my interpretation of the strategy and flow that it follows is allowing two different ways to enter a trade:
- crossover (and bar close) of the macd over the signal line in the HIGH TIMEFRAME (no need to look at the LOWER TIMEFRMAE)
- crossover (and bar close) of the macd over the signal line in the LOW TIMEFRAME, as in this case we need to check also that the macd line is over the signal line for the HIGH TIMEFRAME as well (like a regime filter)
The exit of the trade is based on the lower timeframe MACD only, as we create a stop loss equal to the lower wick of the bar, once the macd line crosses below the signal line on that timeframe
SETTINGS:
All of the indicator's settings are for the vanilla/general case.
User can set all of the MACD parameters for both the higher and lower (current) timeframes, currently left to default of the MACD stand-alone indicator itself.
The start-end date is a time filter that can be extermely usefull when backtesting different time periods.
TTS SETTINGS (NEEDED IF USED TO BACKTEST WITH TTS)
The TempalteTradingStrategy is a strategy script developed in Pine by jason5480, which I recommend for quick turn-around of testing different ideas on a proven and tested framework
I cannot give enough credit to the developer for the efforts put in building of the infrastructure, so I advice everyone that wants to use it first to get familiar with the concept and by checking
by checking jason5480's profile www.tradingview.com
The TTS itself is extremely functional and have a lot of properties, so its functionality is beyond the scope of the current script -
Again, I strongly recommend to be thoroughly epxlored by everyone that plans on using it.
In the nutshell it is a script that can be feed with buy/sell signals from an external indicator script and based on many configuration options it can determine how to execute the trades.
The TTS has many settings that can be applied, so below I will cover only the ones that differ from the default ones, at least according to my testing - do your own research, you may find something even better :)
The current/latest version that I've been using as of writing and testing this script is TTSv48
Settings which differ from the default ones:
- from - False (time filter is from the indicator script itself)
- Deal Conditions Mode - External (take enter/exit conditions from an external script)
- 🔌Signal 🛈➡ - Dual_MACD: 🔌Signal to TTSv48 (this is the output from the indicator script, according to the TTS convention)
- Sat/Sun - true (for crypto, in order to trade 24/7)
- Order Type - STOP (perform stop order)
- Distance Method - HHLL (HigherHighLowerLow - in order to set the SL according to the strategy definition from above)
The next are just personal preferenes, you can feel free to experiment according to your trading style
- Take Profit Targets - 0 (either 100% in or out, no incremental stepping in or out of positions)
- Dist Mul|Len Long/Short- 10 (make sure that we don't close on profitable trades by any reason)
- Quantity Method - EQUITY (personal backtesting preference is to consider each backtest as a separate portfolio, so determine the position size by 100% of the allocated equity size)
- Equity % - 100 (note above)
EXAMPLES:
If used as a stand-alone indicator, the green arrows on the bottom will represent:
- light green - MACD line crossover signal line in the HTF
- darker green - MACD line crossover signal line in the LTF
- orange - MACD line crossunder signal line in the LTF
I recommend enabling the alerts from the script to cover those cases.
If used as an input to the TTS, we'll get more decorations on the chart from the TTS itself.
In the example below we open a trade on the next day of LTF crossover, then a few days later a crossunder in the LTF occurs, so we set a SL at the low of the wick of this day. Few days later the price doesn't recover and hits that SL, so the position is closed.

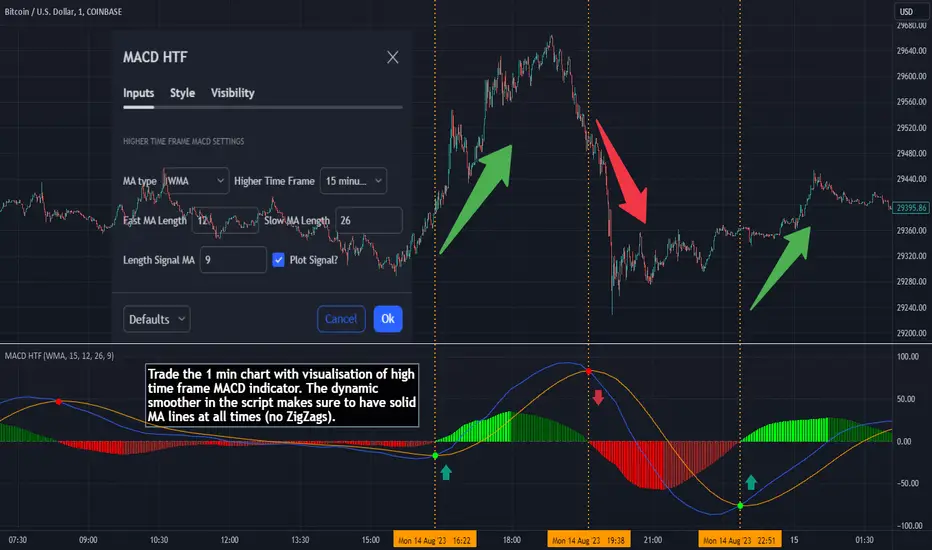
MACD HTF - Dynamic SmoothingEnhancing Your 1-Minute Trades with Dynamic HTF MACD Smoothing
Ever found yourself glued to a 1-minute chart, trying to catch every minor price movement, yet feeling like you're missing the bigger picture? Picture this: a solid MACD line on that chart, dynamically smoothed from a higher timeframe (HTF). This tool offers two significant benefits over other existing HTF MACD indicators:
User-Friendly Interface: No need to manually adjust input parameters every time you switch to a different timeframe.
Smooth Charting: Say goodbye to the zigzag lines that often result from plotting higher time frame resolutions on a lower time frame.
Understanding the MACD
The Moving Average Convergence Divergence (MACD) is one of the most widely used and trusted technical indicators in the trading community. Invented by Gerald Appel in the late 1970s, the MACD helps traders understand the relationship between two moving averages of a security's price. It consists of the MACD line (difference between a 12-period and 26-period Exponential Moving Average) and the Signal line (9-period EMA of the MACD line). When the MACD line crosses above the Signal line, it's viewed as a bullish signal, and vice versa. The difference between the two lines is represented as a histogram, providing insights into potential buy or sell opportunities.
Features of the Dynamic HTF MACD Smoothing Script
Time Frame Flexibility: Choose a higher timeframe to derive MACD values and apply dynamic smoothing to your current timeframe.
Multiple Moving Averages: The script supports various MA types like EMA, SMA, DEMA, TEMA, WMA and HMA.
Alerts: Get real-time alerts for MACD crossover and crossunder.
Customizability: From the type of moving average to its length, customize as per your strategy.
Visual Indicators: Clearly plots signals when MACD crossover or crossunder occurs for potential entries.
At last
A massive shoutout to all the wizards and generous contributors in the community! You inspire innovations and new tools, paving the path forward. Here's to a community where we learn and build together. Cheers to collective growth!
TARVIS Labs - Bitcoin Macro Bottom/Top SignalsSCRIPT DESCRIPTION
This is a script specifically written to help provide indicators from a macro view. This script is best run on the 1 day interval on Bitstamp's $BTCUSD chart. It helps indicate when to accumulate bitcoin, and when its in a bull run when there are local tops, strong top warnings, and a signal to exit a bull run. This is described further below.
If you don't have interest in trading on the way to the top I suggest turning off the following indicators in the settings of the indicator:
- Opportunity To Buy Back In Indicator
- Local Top Near Bull Run Top Indicator
ACCUMULATION ZONE INDICATOR - LIGHT GREEN
Description
When we look at the history of Bitcoin every bottom has crossed below the 100 week EMA. Once it does its accompanied by hash ribbon cross with miner capitulation. After that is the prime time to accumulate as theres a clearer signal the bottom is in. Specifically, a signal to look for is the 14 day MACD/signal cross and the 14 day MACD continuing to stay above the signal until the price returns above the 100 week EMA. This is prime accumulation territory.
Strategy for Usage
A good strategy to use when accumulating the bottom is dollar-cost averaging over a 30 day period. The accumulation zone can last longer than 30 days but 30 days is a good range of time to DCA.
STRONG BUY IN ACCUMULATION ZONE INDICATOR - DARK GREEN
Description
We can add to the bottoming signal by looking for post-downtrend reversals inside the bottoming signal. We do this by using a 9/19 daily cross.
Strategy for Usage
These post-downtrend reversals can potentially provide better targeted days for accumulation than the broader bottoming signal and can be used to add more on that day than on an average day for the dollar cost average strategy. Say for example, use 1/3 of funds on these days rather than 1/30th.
OPPORTUNITY TO BUY BACK IN INDICATOR - BLUE
Description
When the 1d 18 EMA > 1d 63 EMA and the 12/52 1d crosses. These together provide good buy opportunities to buy bitcoin.
Strategy for Usage
If you happen to find yourself out of the market from your own TA or a trade, this signal can provide a buy opportunity to reenter the market if you're out of it.
BULL RUN LOCAL TOP INDICATOR - ORANGE
Description
We will similarly use the 100 week EMA to determine trend reversal into a bull run. When we see the 100 week EMA uptrending, we can begin to look for local tops using the 9/19 daily MACD/signal bearish cross along with the 12 EMA having a negative slope, which could be the beginning signal for a local top.
Strategy for Usage
This is a rather light indicator, but can be used in tandem with your own technical analysis to determine if you want to reenter after you exit from its signal.
LOCAL TOP NEAR BULL RUN TOP INDICATOR - RED
Description
When the 100 week EMA is in an uptrend we can look for significant loss of momentum in order to determine if a local top is in near a bull run top. Similar to the Bull Run Local Top Indicator, this strategy uses a MACD/signal cross but instead uses the 30/65 day EMAs.
Strategy for Usage
Ideally the right strategy to use here is to exit the market when this indicator starts. When the indicator ends if the "End of Bull Run Indicator" is not showing on the chart you can buy back into the market.
TOP IS LIKELY IN INDICATOR
Description
When the 100 week EMA is in a very strong uptrend and the 9/19 weekly MACD/signal bearish cross occurs, and the 63 EMA begins to downtrend.
Strategy for Usage
This signal typically accompanies the "Local Top Near Bull Run Top Indicator" therefore if you're following the strategy you would likely already be out of the market, but if you're not and this signal fires its a strong signal the top is in and we're likely going to start seeing a strong retrace. This is typically right before we see the "End of Bull Run Indicator". There is only one occurrence where it wasn't followed by a large drop & the "End of Bull Run Indicator" and that was in the 2017 bull run where there were many strong retracements post local top. The likelihood we see that again is low, but if it were to happen you can buy back into the market when the "Top is Likely In Indicator" and the "Local Top Near Bull Run Top Indicator" are not firing.
TOP IS LIKELY IN INDICATOR
Description
When the 100 week EMA is in a strong uptrend and the 9/19 weekly MACD/signal bearish cross occurs, and the 63 EMA begins to downtrend.
Strategy for Usage
This signal typically accompanies the "Local Top Near Bull Run Top Indicator" therefore if you're following the strategy you would likely already be out of the market, but if you're not and this signal fires its a strong signal the top is in and we're likely going to start seeing a strong retrace. This is typically right before we see the "End of Bull Run Indicator". There is only one occurrence where it wasn't followed by a large drop & the "End of Bull Run Indicator" and that was in the 2017 bull run where there were many strong retracements post local top. The likelihood we see that again is low, but if it were to happen you can buy back into the market when the "Top is Likely In Indicator" and the "Local Top Near Bull Run Top Indicator" are not firing.
END OF BULL RUN INDICATOR
Description
When the 100 week EMA is in an uptrend and the 1d 18 EMA crosses the 1d 63 EMA.
Strategy for Usage
When the 100 week EMA is a strong uptrend and the 18/63 cross occurs the top is very likely in. It has occurred in every bull run top leading to the bear market.

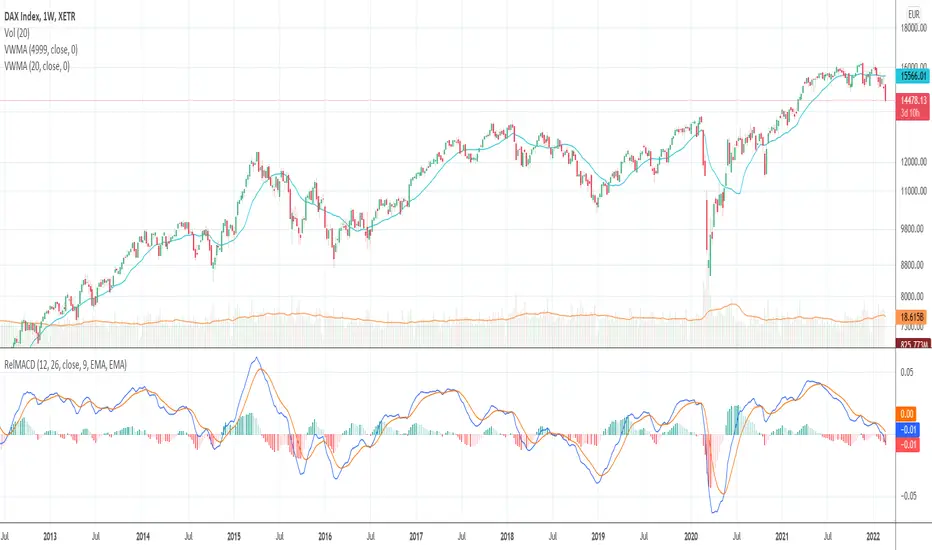
Relative Moving Average Convergence DivergenceThe normal MACD is formed by the difference of two moving averages. In contrast, the relative MACD is formed by the quotient of two moving averages.
In my opinion, it is only with the Relaticen MACD possible to compare values at different prices.
Der normale MACD wird durch die Differenz zweier gleitender Durchschnitte gebildet. Im Gegensatz dazu wird der Relative MACD duch den Quotienten zweier gleitender Durchscnitte gebildet.
Meiner Meinung nach, ist es erst mit dem Relaticen MACD möglich Werte zu unterschiedlichen Kursen zu vergleichen.
La MACD normale est formée par la différence entre deux moyennes mobiles. En revanche, la MACD relative est calculée à partir du quotient de deux moyennes mobiles.
À mon avis, ce n'est qu'avec la MACD relative qu'il est possible de comparer des valeurs à des prix différents.
El MACD normal está formado por la diferencia entre dos medias móviles. En cambio, el MACD relativo está formado por el cociente de dos medias móviles.
En mi opinión, sólo con el MACD Relativo es posible comparar valores a diferentes precios.
Обычный MACD формируется разницей между двумя скользящими средними. В отличие от этого, относительный MACD формируется из коэффициента двух скользящих средних.
На мой взгляд, только с помощью относительного MACD можно сравнивать значения по разным ценам.
正常的MACD是由两条移动平均线之差形成的。相反,相对MACD是由两条移动平均线的商数形成的。
在我看来,只有相对MACD才有可能比较不同价格下的价值。
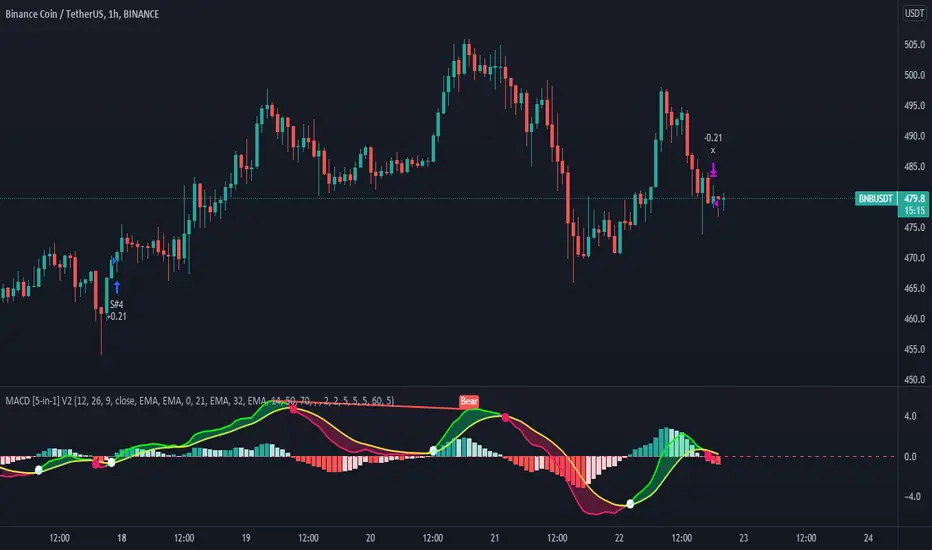
MACD 5 iN 1 [Pro-Tool]introducing MACD Which has different indicators inside,
And not only that, five different strategies have also been included in this indicator.
Strategy №1:👉 MACD Crossover Signal Line
Strategy №2:👉 MACD Crossover + MACD Overbought Section (for ignore false Crossover signals)
Strategy №3:👉 MACD Crossover + Market Close should b greater tha MOVING AVERAGE
Strategy №4:👉 MACD Crossover + Market Close should b greater tha MOVING AVERAGE ZONE
Strategy №5:👉 MACD Crossover + RSI Close should b greater tha 50 Level (or whatever level you choose)
also 5 types of MOVING AVERAGE you can choose
1: Simple Moving Average ( SMA )
2: Exponential Moving Average ( EMA )
3: Weighted Moving Average ( WMA )
4: Volume Weighted Moving Average ( VWMA )
5: Relative Moving Average (RMA)
and you can customize MACD Colors + Widths + Signals and MACD lines, and also can Hide or Unhide Histogram / Cross Sign / MACD Zone Color
hope so you like it, 🥰
Investing and trading in cryptocurrencies is very risky, as anything can happen at any time.
***NOT FINANCIAL, LEGAL, OR TAX ADVICE! JUST OPINION! I AM NOT AN EXPERT! I DO NOT GUARANTEE A PARTICULAR OUTCOME I HAVE NO INSIDE KNOWLEDGE! YOU NEED TO DO YOUR OWN RESEARCH AND MAKE YOUR OWN DECISIONS! THIS IS JUST EDUCATION & ENTERTAINMENT! USE ALTCOIN DAILY AS A STARTING OFF POINT!
[fareid] Quick Backtest Framework█ OVERVIEW
This Framework allows Pine Coders to quickly code Study() based signal/strategy and validate its viability before proceed to code with more advance/complex customized rules for entry, exit, trailstop, risk management etc..
This is somewhat an upgraded version of my earlier personal template with different strategy used, cleaner code
and additional features.
█ USE CASES
- You have an idea for trade signal and need a quick way to verify its potential before writing lengthy/complicated code
- You found a study script for trading signal in public library and want to validate it profitability with minimum effort before including it in your trading playbook
█ FEATURES
- Alert: Ready to use alert function based on signals from your custom indicator.
- Visual Backtest: Auto-plot entry, stop-loss and take profit for simple strategy performance analysis
- Backtest Statistic: Provide basic key metrics based on backtest strategy
- BTE External Signal Protocol: Ready to use code that will supply required state to PineCoders Backtesting & Trading Engine if you wish to have more advance and sophisticated backtesting engine
Notes: All of the above features have On/Off toggle
█ Description & How To Use
This Framework consist of 5 Modules but you only need to edit the first 2 Modules:
Module1: Indicator
Module2: Framework Input Protocol
Module3: Alert
Module4: Backtest
Module5: Backtest & Trading Engine
Tips: The source-code includes collapsible block by module for easy navigating
Module1: Indicator:
-----------------------------------------------------------------------------------
Main Module. Place custom indicator input parameter/calculation/indicator plotting here
Sample Strategy: Double MACD Crossover
MACD Signal: 1st MACD Cross above signal line indicate Buy Signal
1st MACD Cross below signal line indicate Sell Signal
MACD Filter: 2nd MACD is above 0 line indicate Uptrend
2nd MACD is below 0 line indicate Downtrend
Module2: Framework Input Protocol:
-----------------------------------------------------------------------------------
Use this module to connect main indicator/signal calculated in Module1 to the rest of the framework's module
4 variables needed to be defined here:
1. Uptrend
2. Dntrend
3. BuySignal
4. SellSignal
i'm not sure how to place a code snippet here to show you example so in the source code i already put a comment in Module2 on which part u need to edit. I hope its pretty simple to use.
Module3: Alert Module Description:
-----------------------------------------------------------------------------------
As long as the variables in Module2 properly defined, the alert module is ready to use without any further modification.
Input:
Enable Alert --> Enable TV's alert and plot signal to chart
Alert Type --> Set to take Buy only, Sell only or Both alert
Module4: Backtest Module Description:
-----------------------------------------------------------------------------------
As long as the variables in Module2 properly defined, the backtest module is ready to use without any further modification.
Input:
Backtest Stat --> Enable Backtest Statistic Label
Backtest Visual --> Enable Backtest visual simulation
Backtest Type --> Set to take Buy only or Sell only or both
SL Type -->
ATR : Set SL in ATR times Multiplier below entry price
Fixed : Set SL in fixed point below entry point (in 'Dollar'). e.g. for Stocks -> 0.5 equals to 50cent while for EURUSD currency -> 0.005 equal to 50 pips
HiLo Bar: Set SL at highest/lowest wick of previous bar plus/minus Fixed point. e.g. EURUSD HiLo=3 and Fixed Point = 0.0005, buy trade will place SL 5 Pips below lowest of previous 3 bar
SL ATR Multi --> Set Lookback Period used for SL's ATR calculation
SL ATR Multi --> Set ATR Multiplier for SL
SL Fixed --> Set Fixed Level for SL
SL Bar --> Set Number of previous bar to check for SL placement
TP RR Ratio --> Set TP based on RR multiplier. e.g. 2 means TP level will be twice further from entry point compared to Entry-SL distance.
Notes: The point is for preliminary testing, so it only supports 1 trade at a time and no Trailing Stop
Module5: Backtest & Trading Engine Description:
-----------------------------------------------------------------------------------
As long as the variables in Module2 properly defined, the Pinecoders BTE module is ready to use without any further modification.
Input:
External Signal Protocol --> Set ESP State to send to "Backtesting & Trading Engine "
Signal With Filter --> Use this to send entry signal that already filtered by this study indicator (without stoploss level)
Signal Without Filter --> Use this to send raw entry signal that are NOT YET FILTERED by this study indicator (without stoploss level)
Signal and Stop With Filter --> Use this to send entry signal WITH StopLoss that already filtered by this study indicator (with stoploss level)
Signal and Stop Without Filter --> Use this to send raw entry signal WITH StopLoss that are NOT YET FILTERED by this study indicator (with stoploss level)
Notes: Backtesting & Trading Engine already have built-in Filter, Entries and Stop Level. e.g. Unselect all their filter state if only want to use custom filter and make sure send Signal with Filter (with or without SL level)
█ DISCLAIMER:
This framework main objective is to create my personal indicator template so that i just have to modify the indicator module for preliminary testing in future.
The sample strategy included are for educational purpose only. Use at your own risk
credit: LucF/PineCoders for a lot of his scripts that i use as a guide to complete this

macd xoverThe MACD XOver indicator was developed by John Bruns to predict the price point at which MACD Histogram will reverse the direction of its slope.
The indicator is plotted one day ahead into the future, allowing, if your strategy depends on MACD Histogram, to predict its reversal point for tomorrow (or the next bar in any timeframe). If the closing price tomorrow is above the value of this indicator, then MACD Histogram will tick up. If the closing price tomorrow is below the value of this indicator, then MACD Histogram will tick down. This is especially useful on the charts of the longer timeframes and when using the Impulse system whose color depends in part on the slope of MACD Histogram.
Use the same values as the MACD Combo which you want to anticipate. If you use the default values, then accept the values below.
Parameters:
MACD_Short_Period(12) – The short EMA for the MACD calculation;
MACD_Long_Period (26) – The long EMA for the MACD calculation;
MACD_Smoothing_Period (9) – The smoothing value for the Signal line;
Time_Ratio (1) – The default here is set to 5 (weekly)

MACD-V Multi-Timeframe Confluence DashboardThis indicator identifies high-probability trade entries by analyzing momentum alignment across multiple timeframes using the MACD-V (Volatility Normalized MACD) formula. It features a fully customizable signal engine that allows traders to specify exactly which timeframes must agree before a trade signal is generated.
Optimized Defaults
By default, the indicator is tuned to the 5-minute, 15-minute, and 1-hour timeframes. We have found this specific combination performs best for identifying robust trends while filtering out noise. However, the strategy is fully flexible—users can easily adjust these settings to fit scalping (1m/5m) or swing trading (4H/Daily) styles.
Indicator Features
Dynamic Confluence: A Buy or Sell signal (displayed as a large + on the chart) is generated only when all selected timeframes are in agreement. This ensures you are trading with the dominant trend across multiple time scales.
Alternating Signal Filter: To prevent repetitive alerts during strong trends, the script uses a smart filter: a new Buy signal will only trigger if the last confirmed signal was a Sell (and vice versa).
Live Dashboard: An on-screen table displays the real-time status of every timeframe (Trend, Curl, and MACD Value). Timeframes currently active in your strategy are highlighted in yellow.
Local Entry Arrows (Optional): The script includes smaller red/green arrows that indicate simple MACD line crosses on the current chart's timeframe. These can be useful for precise timing but can be noisy in choppy markets. These are turned off by default to keep the chart clean, but can be enabled in the "Visuals" settings if you require granular entry signals.
How to Use
Check the Dashboard: Look for the yellow-highlighted rows in the table to see which timeframes are currently driving your signals.
Wait for the Cross (+): A green + indicates bullish momentum is aligned across all your chosen timeframes.
Refine (Optional): Turn on "Show Local Arrows" if you want to see the specific moment the MACD crosses on your current timeframe to fine-tune your entry.

MACD X SignalsThis is a fundamental signal indicator based on MACD crossovers. It enhances the standard MACD by adding visual labels that classify signals based on their location relative to the Zero Line. This helps identify whether a trend is reversing, continuing, or potentially overextended.
Signal Legend:
B (Reversal): Bullish crossover in the Negative Zone .
B+ (Neutral): Bullish crossover in the Middle Zone .
B- (Trend): Bullish crossover in the Positive Zone
S : MACD crossing down (Bearish signal).

**MACD + RSI + MFI by IspatialResources – Multi-Tool Indicator**
This indicator is a **multi-functional technical analysis tool** that combines the following professional oscillators into a single panel:
* ✅ **Customizable MACD**
* ✅ **Advanced RSI with Moving Average and Bollinger Bands**
* ✅ **Money Flow Index (MFI)**
* ✅ **Module-based enable/disable system**
* ✅ **Fully configurable alerts**
It is designed to help identify **overbought and oversold conditions, trend strength, and momentum shifts**, improving market reading across multiple assets.
---
### 🔹 INCLUDED MODULES
**1️⃣ MACD**
* Fast and slow moving average settings
* Selectable MA type (SMA / EMA)
* Dynamic histogram
* Momentum change alerts
**2️⃣ Advanced RSI**
* Classic RSI with dynamic levels
* Moving average applied to RSI
* Optional **Bollinger Bands on RSI**
* Visual overbought and oversold signals
* Extreme condition alerts
**3️⃣ MFI (Money Flow Index)**
* Buying and selling pressure detection
* Overbought and oversold zones
* Ideal for volume and strength analysis
---
### 🔹 SUPPORTED MARKETS
This indicator can be used on:
* 📈 Cryptocurrencies
* 📊 Stock Indices
* 💱 Forex
* 📉 Stocks
It works on **all timeframes**: intraday, swing trading, and long-term analysis.
---
### 🔹 HOW TO USE IT
* Enable or disable each module from the settings panel.
* Use the **RSI with bands** to detect extreme zones.
* Confirm potential entries with the **MACD**.
* Filter false signals with the **MFI**.
* Combine it with market structure, support, and resistance.
---
### ⚠️ RISK DISCLAIMER
This indicator is **for educational and technical analysis purposes only**.
**It does not constitute financial advice and does not guarantee results.**
Trading involves risk, and each user is responsible for their own decisions.
---
### 👤 AUTHOR
Created by **Ismael** as a personal tool for market analysis and study.
---
🚀 If you find this indicator useful, feel free to support it with a “like” for future updates.

MACD Zero-Line Dominance (no ta.sum)Description Option 1 (Simple & Clear)
“This indicator compares how many recent bars have the MACD line above the zero line versus below it.
It plots the resulting strength as a green/red histogram showing whether bullish or bearish momentum is dominating.”
“MACD Zero-Line Dominance measures the strength balance between bullish and bearish momentum by counting how many candles in a lookback period have MACD above or below the zero line.
The histogram turns green when bullish pressure dominates and red when bearish momentum takes control.
Useful for trend confirmation, regime detection, and higher-timeframe alignment.”

Multi-Confluence Signal System📊 OPTIMIZED MULTI-CONFLUENCE SIGNAL SYSTEM
A professional-grade trading indicator that combines multiple technical analysis methods to generate high-probability buy and sell signals. Designed for daily timeframe Bitcoin/crypto trading with optimized parameters based on real market backtesting.
🎯 KEY FEATURES:
- Multi-Confluence Scoring (8 components) - Each signal shows strength rating
- Smart Top & Bottom Detection - Catches reversals using price action patterns
- Ichimoku Cloud Integration - Dynamic support/resistance visualization
- Dual EMA System (20/50) - Clear trend identification
- RSI + MACD + Volume Confirmation - Multi-indicator validation
- Signal Alternation - Only shows directional changes (no repeated signals)
- Minimal Bar Spacing - Prevents signal clustering and overtrading
✅ OPTIMIZED FOR:
- Catching parabolic tops with rejection wicks
- Identifying capitulation bottoms in downtrends
- Avoiding false signals during consolidation
- 4-8 quality signals per 4-month period on daily charts
- Works in both trending and volatile markets
🔧 TECHNICAL COMPONENTS:
- EMA 20/50 trend system
- RSI (14) with adjusted overbought/oversold levels (68/32)
- MACD for momentum confirmation
- Ichimoku Cloud for trend context
- Volume analysis (1.3x threshold)
- Candlestick pattern recognition (engulfing, hammers, shooting stars)
- Capitulation detection for extreme moves
- Price extension filters (±5-10% from EMAs)
⚠️ BEST PRACTICES:
- Optimized for Daily timeframe
- Combine with your own risk management
- Higher scores = higher probability trades
- Wait for signal confirmation on candle close
- Use in conjunction with key support/resistance levels
💡 SIGNAL LOGIC:
BUY signals trigger on: Capitulation candles, extreme oversold + reversal patterns, MACD turnarounds in downtrends, or high confluence scores with bullish patterns
SELL signals trigger on: Rejection wicks at tops, bearish engulfings with overbought RSI, parabolic extensions, MACD reversals, or high confluence scores with bearish patterns
📈 Created through iterative backtesting and optimization on Bitcoin price action from 2024-2025.
⭐ Free to use • Leave feedback • Happy trading!
