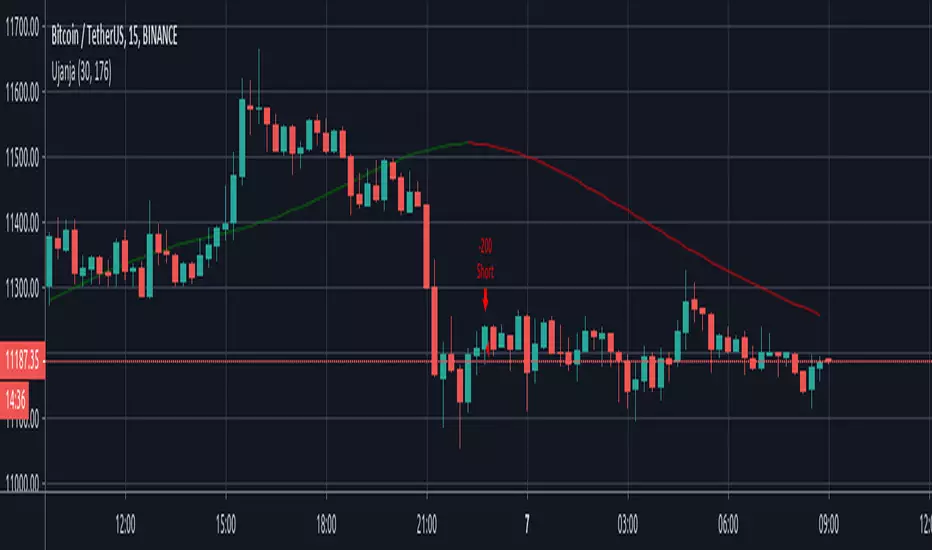
UjanjaUjanja uses Zero Lag EMA combined with Hull Moving Average for smoothing purposes. It is a less aggressive. It is only to be used with huge volume , huge momentum and high volatility to get trend analysis... It doesn't repaint at all.
Advised use :
Trades highly volatile Crypto currencies, stocks as well as Gold .
It is only to be used with huge momentum and high volatility to get trend analysis... It doesn't repaint at all.
ابحث في النصوص البرمجية عن "momentum"
RSI-RENKO Divine Strategy (Backtesting)Live, non-repainting strategy using RENKO and RSI mixed together to multiple types of long and short positions.
- Features -
Live entry direction with trade warnings and alerts
Live trade building buy and sell limits (for buy/sell limits)
Entry location icons as well as pyramid entries (to add to existing position)
Swing trades that keep you in the trade for the maximum possible profit
1 scalp target based on the RSI settings and entry location
Dynamic trailing stop for swings and scalps
Alert conditions for every update and condition change of the strategy (Provided by indicator study)
4 pre-built color themes, including candlestick coloring
This strategy is best used with the companion indicators: Renko RSI and Renko Trend Momentum using the identical RSI and Trend settings.
The linked script is identical and used solely for alerts, because Trading View still after 3 years of requesting does not provide the ability to use alert conditions inside a strategy script, only an indicator script. This strategy should be used to backtest your settings.
The approach to this strategy uses several parallel trades of different types. In order to generate multiple trade types the "pyramid trades" setting of the strategy (second tab of the settings that lets you adjust the number of pyramid contracts) should be used.
- Trade Types -
Swing: This trade is entered on the solid arrows after the RSI has become oversold or overbought. It is key that all trades wait for some degree of pullback before entering, even after the trend flips between positive and negative. This trade is held until stopped out or an opposite trade is triggered that reverses the position.
Scalp: These trades have a limit buy/sell entry and a target. The initial target is the opposing RSI overbought or oversold level and changes in real time.
Turning on/off the different trade types (strategy only) is simple done by decreasing the number of contracts used for that trade type to zero. When the quantity is set to zero, that trade is not considered.
- Session -
The session filter is used to narrow trade executions by only allowing trades that are inside the session boundaries. This can be used to isolate the London or New York session for example. The default is 24 x 7 which filters no trades (Trading View has a bug when resetting this, so simply reset the indicator to get it back to 24x7).
Please see the following 3 videos introducing the concept of this strategy.
All feature requests or bug reports are welcome either by direct messaging or comments on this page or the linked indicator page.
Please PM for access. Cheers.

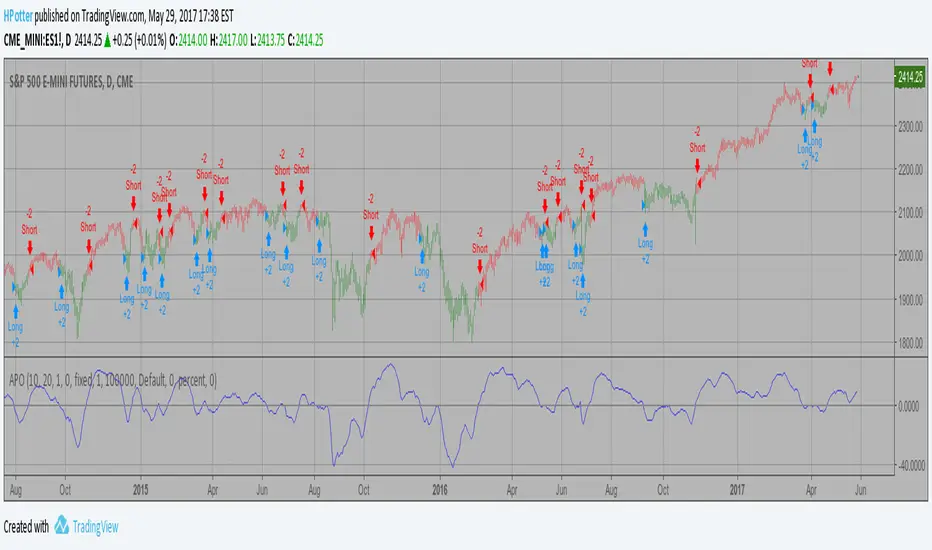
Combo Backtest 123 Reversal and Absolute Price Oscillator (APO) This is combo strategies for get
a cumulative signal. Result signal will return 1 if two strategies
is long, -1 if all strategies is short and 0 if signals of strategies is not equal.
First strategy
This System was created from the Book "How I Tripled My Money In The
Futures Market" by Ulf Jensen, Page 183. This is reverse type of strategies.
The strategy buys at market, if close price is higher than the previous close
during 2 days and the meaning of 9-days Stochastic Slow Oscillator is lower than 50.
The strategy sells at market, if close price is lower than the previous close price
during 2 days and the meaning of 9-days Stochastic Fast Oscillator is higher than 50.
Secon strategy
The Absolute Price Oscillator displays the difference between two exponential
moving averages of a security's price and is expressed as an absolute value.
How this indicator works
APO crossing above zero is considered bullish, while crossing below zero is bearish.
A positive indicator value indicates an upward movement, while negative readings
signal a downward trend.
Divergences form when a new high or low in price is not confirmed by the Absolute Price
Oscillator (APO). A bullish divergence forms when price make a lower low, but the APO
forms a higher low. This indicates less downward momentum that could foreshadow a bullish
reversal. A bearish divergence forms when price makes a higher high, but the APO forms a
lower high. This shows less upward momentum that could foreshadow a bearish reversal.
WARNING:
- For purpose educate only
- This script to change bars colors.

Bone Scalp StrategyThis is how I scalp trades. Very simple to use
There are 0-4 Numbered rows of squares, each row has the following definition
4 - Rigor Row - Describes how much rigor is the movement
3 - Momentum Row - Describes how much momentum there is in the movement
2 - Energy Row - Describes how much Gas is in the movement
1 - Vector Row - Describes which direction it is going
0 - Go/No Go Row - Turns Green when all are Green
Turns Red when Rigor is red with the combination of any of the other are red (ie Rigor Red and (Momentum Red and Vector Red)

Bill Williams Awesome strategy(lirshah)The Awesome Oscillator is an indicator used to measure market momentum. AO calculates the difference of a slow period and a fast period Simple Moving Averages. The Simple Moving Averages that are used are not calculated using closing price but rather each bar's midpoints.
AO is generally used to affirm trends or to anticipate possible reversals.
this strategy has been written according to BWA and has the best results on M15 chart.
the strategy is compatible with Most markets such as Forex, crypto, CFD and indexes

Absolute Price Oscillator (APO) Backtest 2.0 The Absolute Price Oscillator displays the difference between two exponential
moving averages of a security's price and is expressed as an absolute value.
How this indicator works
APO crossing above zero is considered bullish, while crossing below zero is bearish.
A positive indicator value indicates an upward movement, while negative readings
signal a downward trend.
Divergences form when a new high or low in price is not confirmed by the Absolute Price
Oscillator (APO). A bullish divergence forms when price make a lower low, but the APO
forms a higher low. This indicates less downward momentum that could foreshadow a bullish
reversal. A bearish divergence forms when price makes a higher high, but the APO forms a
lower high. This shows less upward momentum that could foreshadow a bearish reversal.
You can change long to short in the Input Settings
WARNING:
- For purpose educate only
- This script to change bars colors.

Inverse Fisher - BK
This chart has S/R levels, derived from an oscillator, overlaid on price action for easy identification of clusters and turning points. It also marks bars (up / down triangles above/below) with reducing momentum to show potential upcoming bounce levels. This S/R level is derived from %B, while you can do the same from other metrics like volume , momentum etc.
Best time setting 30min
I want these results to be correct. Because it's incredible

Ergodic CSI Backtest This is one of the techniques described by William Blau in his book
"Momentum, Direction and Divergence" (1995). If you like to learn more,
we advise you to read this book. His book focuses on three key aspects
of trading: momentum, direction and divergence. Blau, who was an electrical
engineer before becoming a trader, thoroughly examines the relationship between
price and momentum in step-by-step examples. From this grounding, he then looks
at the deficiencies in other oscillators and introduces some innovative techniques,
including a fresh twist on Stochastics. On directional issues, he analyzes the
intricacies of ADX and offers a unique approach to help define trending and
non-trending periods.
This indicator plots Ergotic CSI and smoothed Ergotic CSI to filter out noise.
You can change long to short in the Input Settings
WARNING:
- For purpose educate only
- This script to change bars colors.

theMegalodon_Strategy_TestThis is the strategy tester for theMegalodon!
--------------------------------------
THEMEGALODON
theMegalodon looks for the institutional finger prints, the whales or the big boys.
theMegalodon is really simple to use.
theMegalodon combines the 8 different unique indicators, that each have almost perfect success rate.
theMegalodon works with any kind of market state, any kind of trading, and any kind of asset.
theMegalodon has more features than any other indicator in the market: Out of 9 working indicators, we have 3 momentum, 3 price and 3 volume indicators showing you the best signals.
--------------------------------------
theMegalodon is designed for us, the small fishes in the ocean, the millennials, the college students. This will basically makes us the new Megalodons(whale hunters).
All you have to do is:
1- Look for green or red arrows.
2- Look for orange or red candles.
3- Repeat
--------------------------------------
TECHNICAL DETAILS
Some boring info that you don't necessarily need to know.
1- Draws fibonacci retracement (s)' levels depending on your preferred look back period (Default: 365 and 120)
i) Can draw 2 fibs on the same chart. Can reverse the fib levels. Even, add an additional fib level to look for.
ii) Automatic fill function for a Reload Zone inside of a Reload Zone. *61.8% levels to 100% levels or 0% levels
2- Changes the color of the candle when strong buy(orange) or strong sell(red). Draws arrows on the chart for long and short positions.
i) Analyses and Combines
a) Price
b) Momentum
c) Volume
3- Prints out the indicators that are either giving Short or Long signs on the right corner.
4- The closer the unclebo indicator(click enable UncleBo) gets to the All time high, the better buy it is.
i) Same with the other way around. The closer it gets to the 0, the better sell it is.
5- Draws Bollinger Bands on the chart and shows where to buy or sell
6-The indicator is designed to be used in Daily time frame for the best calls to short or long.
--------------------------------------------------
iPyra◬
Enlighten others

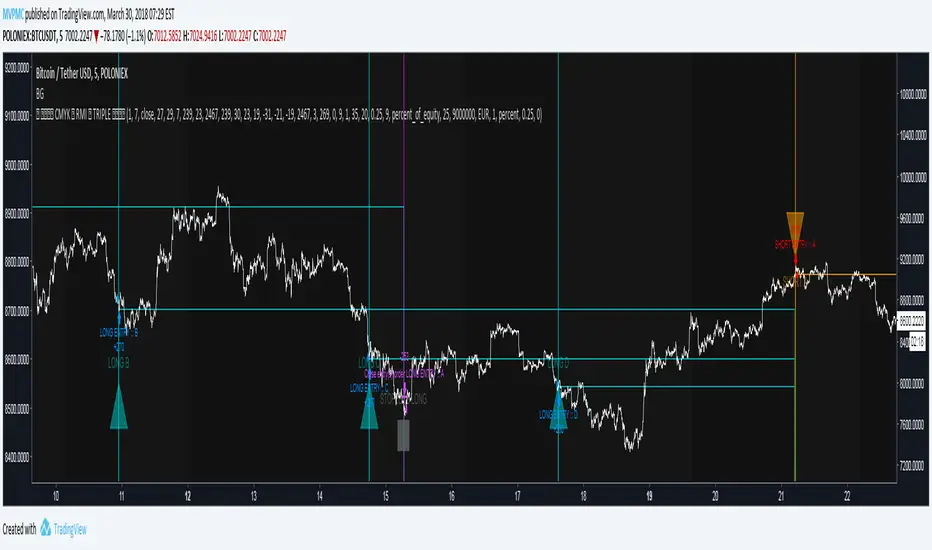
CMYK RMI TRIPLE Automated strategy▼ This is the strategy version of the script.
◊ Introduction
This script makes use of three RMI 's, that indicate Overbought/Oversold on different timescales that correspond with Frequency’s that move the market.
◊ Origin
The Relative Momentum Index was developed by Roger Altman and was introduced in his article in the February, 1993 issue of Technical Analysis of Stocks & Commodities magazine.
While RSI counts up and down ticks from close to close, the Relative Momentum Index counts up and down ticks from the close relative to a close x number of days ago.
This results in an RSI that is smoother, and has another setting for fine tuning results.
This bot originated out of Project XIAM , an investigative script that outlined my approach towards Automated Trading Strategies.
Are you interested in writing bots yourself ? check out the beta version of this script.
It has many bugs, but also most of the Skeleton.
◊ Usage
This script is intended for Automated Trading with AUTOVIEW or TVAUTOTRADER , on the 1 minute chart.
◊ Features Summary
Overlay Mode
Indicator Mode
Three RMI's
Trend adjustment
Pyramiding
Ignore first entries
Take Profit
Stop Loss
Interval between Entries
Multiring Fix
Alert signal Seperation
◊ Community
Wanna try this script out ? need help resolving a problem ?
CMYK :: discord.gg
AUTOVIEW :: discordapp.com
TRADINGVIEW UNOFFICIAL :: discord.gg
◊ Setting up Autoview Alerts
Use the study version of this script, To set up The Alerts Autoview Picks up on.
The Signals to work with are :
Open 1 Long
Use this to open one Long Position.
With quantity being : /
Once per bar
Being larger than 0
Comment example : e=exchange b=long q=amount t=market
Open 1 Short
Use this to open one Short Position.
With quantity being : /
Once per bar
Being larger than 0
Comment example : e=exchange b=short q=amount t=market
Close1 Position
Use this to Close The amount of one Open Position.
With quantity* being : /
Once per bar
Being larger than 0
Comment example : e=exchange c=position q=amount t=market
*Beware when using a percental % quantity, instead of an absolute quantity.
Percental Quantities are based on the , Not
And will change in absolute value relative to the amount of open trades.
Close All positions
Use this to Close All Open Positions.
With quantity being :
Once per bar
Being larger than 0
Comment example : e=exchange c=position t=market
For the specific Syntax used in the comment of the alert, visit Autoview .
◊ Setting up TVAutotrader
Use the strategy version of this script, And load it into TVAT .
◊ Backtesting
Use the strategy version of this script for backtesting.
◊ Contact
Wanna try this script out ? need help resolving a problem ?
CMYK :: discord.gg
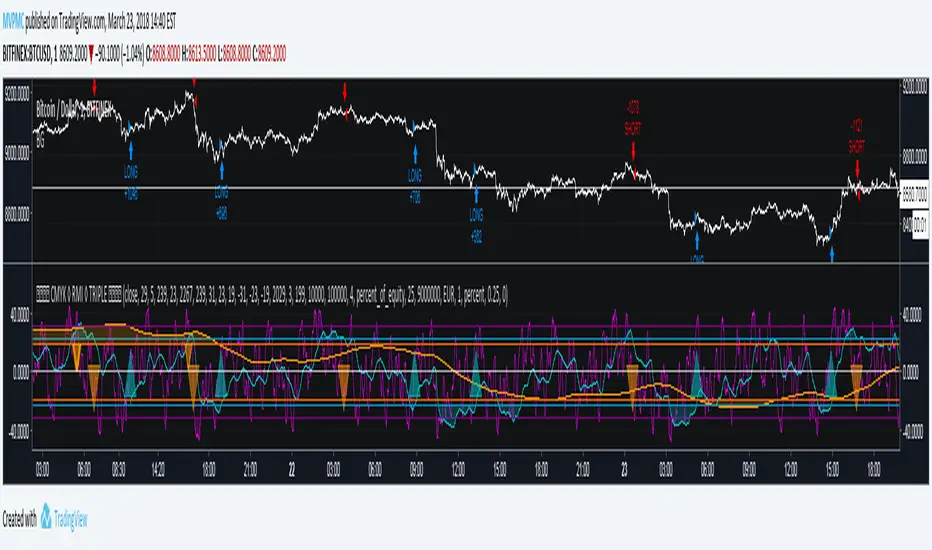
CMYK RMI TRIPLE◊ Introduction
This script makes use of three RMI's, to indicate Overbought/Oversold.
Adjustments can easily be made, through its settings or script.
◊ Origin
The Relative Momentum Index was developed by Roger Altman and was introduced in his article in the February, 1993 issue of Technical Analysis of Stocks & Commodities magazine.
While RSI counts up and down days from close to close, the Relative Momentum Index counts up and down days from the close relative to a close x number of days ago.
This results in an RSI that is smoother.
This is a part of Project XIAM.
◊ Theoretical Approach
Philosophy γ :: consequential
◊ Usage
You can use this as an indicator for manual trading, or apply AUTOTVIEW to automate your trading.
My advice is to combine this with another indicator before you do this.
The script is written in an organized and flexible manner to do this.
◊ Features
3 RMI's with seperately adjustable HIGH / LOW levels.
Trend adjustment on the SLOW RMI.
Adjustable Interval between entries / Once per dip-top entry.
Take Profit & Stop loss
◊ Community
Wanna share your findings ? or need help resolving a problem ?
CMYK :: discord.gg
AUTOVIEW :: discordapp.com
TRADINGVIEW UNOFFICIAL :: discord.gg
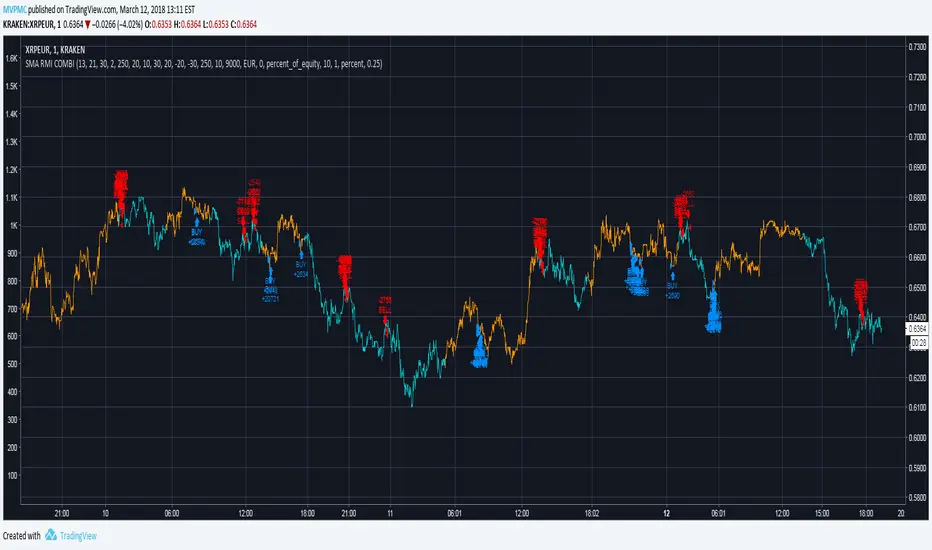
CMYK XIAM◊ Introduction
This is project XIAM, a trading bot based on SMA and RMI
◊ Origin
Based on 'The Relative Momentum Index' by Roger Altman : February, 1993 issue of Technical Analysis of Stocks & Commodities magazine.
While RSI counts up and down days from close to close, the Relative Momentum Index counts up and down days from the close relative to a close x number of days ago.
This results in an RSI that is smoother. The input has been changed to the change of a smoothed close multiplied by a smoothed volume .
In addition SMA is used to detect an up/downwards phase.
◊ Adjustments
CMYK color theme applied.
◊ Usage
Automatic trading strategy
◊ Future Prospects
Remove jitter.
Take Variance into account
Auto adjusting settings evaluated on previous placements.
Proper asset management.
Slickwater Strategy [frac]This indicator is the culmination of various other indicators and attempts to help traders assess the actual current trend and filter out all the noise.
In reality, this indicator is extremely similar to the Traders Dynamic Index in concept and the overall results of the indicator across any time frame. The differences though are that while TDI uses just RSI, this uses RSI, CCI, MFI, and TSI, and also includes an assessment of the momentum associated with the move, to better enable traders to detect divergence.
The default settings generate the best returns across any time frame, however can be ultra sensitive and generate too many trade signals on high resolution time frames (i.e., the 15M or 30M). If one desires less sensitive results, one can use (14,12,9) for the first 3 inputs. This generates consistent signals, but is not as sensitive as the default.
In general:
GO LONG:
- Scalp: Wt1 crosses over Wt2
- Short Term: Wt1 crosses over Wt2 and the middle band. Wt2 is above the middle band as well
- Medium Term: Same as short term, but there are extended oversold trading signals (yellow dots)
- Long term: Same as medium term, but there is divergence in the momentum as well (i.e. it is increasing while price decreases)
GO SHORT:
- Scalp: Wt1 crosses under Wt2
- Short Term: Wt1 crosses under Wt2 and the middle band. Wt2 is below the middle band as well.
- Medium Term: Same as short term, but there are extended overbought trading signals (yellow dots)
- Long term: Same as medium term, but there is divergence in the momentum as well (i.e., it is decreasing while price increases)

True Strength Indicator BTCUSD 2HScript based on True Strength Index (TSI) and RSI
A technical momentum indicator that helps traders determine overbought and oversold conditions of a security by incorporating the short-term purchasing momentum of the market with the lagging benefits of moving averages. Generally a 25-day exponential moving average (EMA) is applied to the difference between two share prices, and then a 13-day EMA is applied to the result, making the indicator more sensitive to prevailing market conditions.
!!! IMPORTANT IN ORDER TO AVOID REPAITING ISSUES
!!! USE Chart resolution >= resCustom parameter, suggestion 2H
Yellow zones indicates that you can claim position for better profits even before a claim confirmation.
Dark zones indicates areas where RSI shows overbought and oversold conditions.
BTCUSD

Absolute Price Oscillator (APO) Backtest The Absolute Price Oscillator displays the difference between two exponential
moving averages of a security's price and is expressed as an absolute value.
How this indicator works
APO crossing above zero is considered bullish, while crossing below zero is bearish.
A positive indicator value indicates an upward movement, while negative readings
signal a downward trend.
Divergences form when a new high or low in price is not confirmed by the Absolute Price
Oscillator (APO). A bullish divergence forms when price make a lower low, but the APO
forms a higher low. This indicates less downward momentum that could foreshadow a bullish
reversal. A bearish divergence forms when price makes a higher high, but the APO forms a
lower high. This shows less upward momentum that could foreshadow a bearish reversal.
You can change long to short in the Input Settings
Please, use it only for learning or paper trading. Do not for real trading.
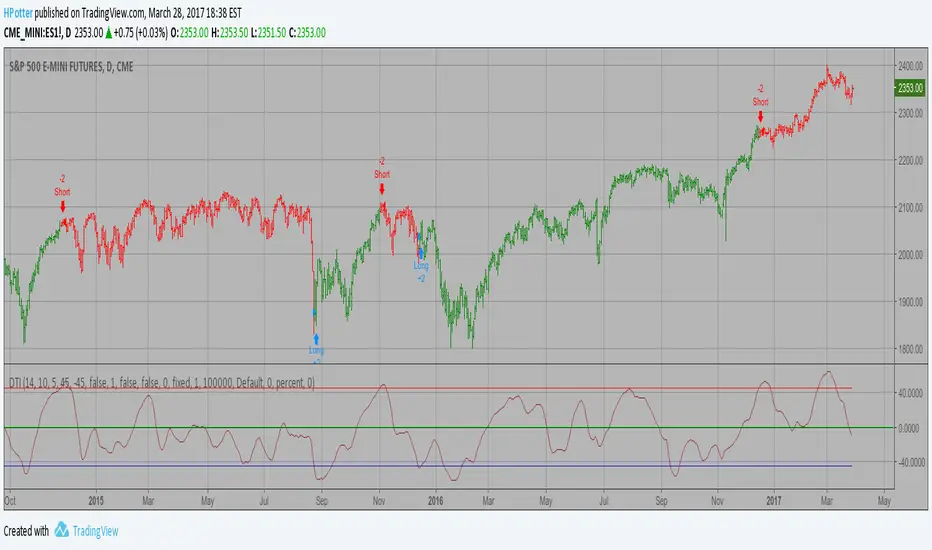
Directional Trend Index (DTI) This technique was described by William Blau in his book "Momentum,
Direction and Divergence" (1995). His book focuses on three key aspects
of trading: momentum, direction and divergence. Blau, who was an electrical
engineer before becoming a trader, thoroughly examines the relationship between
price and momentum in step-by-step examples. From this grounding, he then looks
at the deficiencies in other oscillators and introduces some innovative techniques,
including a fresh twist on Stochastics. On directional issues, he analyzes the
intricacies of ADX and offers a unique approach to help define trending and
non-trending periods.
Directional Trend Index is an indicator similar to DM+ developed by Welles Wilder.
The DM+ (a part of Directional Movement System which includes both DM+ and
DM- indicators) indicator helps determine if a security is "trending." William
Blau added to it a zeroline, relative to which the indicator is deemed positive or
negative. A stable uptrend is a period when the DTI value is positive and rising, a
downtrend when it is negative and falling.
You can change long to short in the Input Settings
Please, use it only for learning or paper trading. Do not for real trading
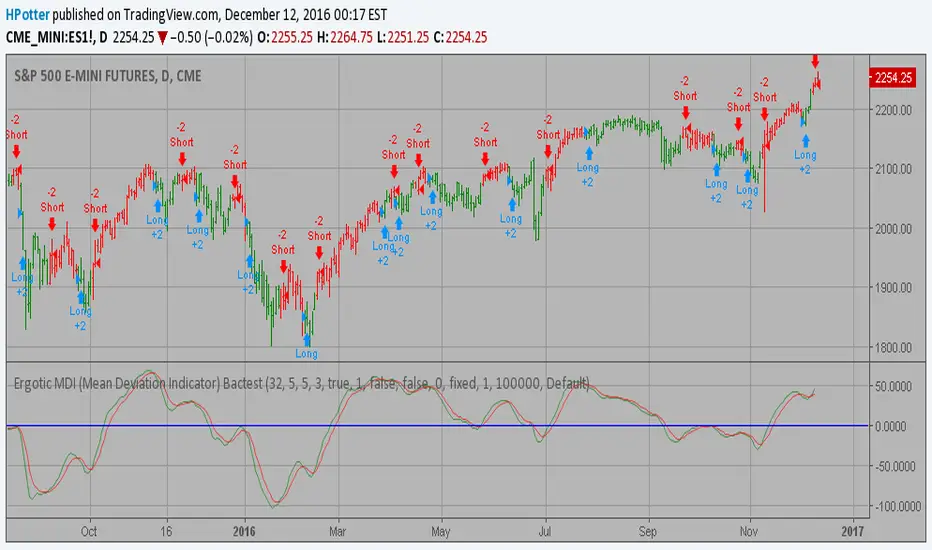
Ergotic MDI (Mean Deviation Indicator) Bactest This is one of the techniques described by William Blau in his book "Momentum,
Direction and Divergence" (1995). If you like to learn more, we advise you to
read this book. His book focuses on three key aspects of trading: momentum,
direction and divergence. Blau, who was an electrical engineer before becoming
a trader, thoroughly examines the relationship between price and momentum in
step-by-step examples. From this grounding, he then looks at the deficiencies
in other oscillators and introduces some innovative techniques, including a
fresh twist on Stochastics. On directional issues, he analyzes the intricacies
of ADX and offers a unique approach to help define trending and non-trending periods.
You can change long to short in the Input Settings
Please, use it only for learning or paper trading. Do not for real trading.
Ergotic MACD Strategy Backtest This is one of the techniques described by William Blau in his book
"Momentum, Direction and Divergence" (1995). If you like to learn more,
we advise you to read this book. His book focuses on three key aspects
of trading: momentum, direction and divergence. Blau, who was an electrical
engineer before becoming a trader, thoroughly examines the relationship
between price and momentum in step-by-step examples. From this grounding,
he then looks at the deficiencies in other oscillators and introduces some
innovative techniques, including a fresh twist on Stochastics. On directional
issues, he analyzes the intricacies of ADX and offers a unique approach to help
define trending and non-trending periods.
Blau`s indicator is like usual MACD, but it plots opposite of meaningof
stndard MACD indicator.
You can change long to short in the Input Settings
Please, use it only for learning or paper trading. Do not for real trading.

ECO Strategy Backtest We call this one the ECO for short, but it will be listed on the indicator list
at W. Blau’s Ergodic Candlestick Oscillator. The ECO is a momentum indicator.
It is based on candlestick bars, and takes into account the size and direction
of the candlestick "body". We have found it to be a very good momentum indicator,
and especially smooth, because it is unaffected by gaps in price, unlike many other
momentum indicators.
We like to use this indicator as an additional trend confirmation tool, or as an
alternate trend definition tool, in place of a weekly indicator. The simplest way
of using the indicator is simply to define the trend based on which side of the "0"
line the indicator is located on. If the indicator is above "0", then the trend is up.
If the indicator is below "0" then the trend is down. You can add an additional
qualifier by noting the "slope" of the indicator, and the crossing points of the slow
and fast lines. Some like to use the slope alone to define trend direction. If the
lines are sloping upward, the trend is up. Alternately, if the lines are sloping
downward, the trend is down. In this view, the point where the lines "cross" is the
point where the trend changes.
When the ECO is below the "0" line, the trend is down, and we are qualified only to
sell on new short signals from the Hi-Lo Activator. In other words, when the ECO is
above 0, we are not allowed to take short signals, and when the ECO is below 0, we
are not allowed to take long signals.
You can change long to short in the Input Settings
Please, use it only for learning or paper trading. Do not for real trading.

Liquidity Maxing [JOAT]Liquidity Maxing - Institutional Liquidity Matrix
Introduction
Liquidity Maxing is an open-source strategy for TradingView built around institutional market structure concepts. It identifies structural shifts, evaluates trades through multi-factor confluence, and implements layered risk controls.
The strategy is designed for swing trading on 4-hour timeframes, focusing on how institutional order flow manifests in price action through structure breaks, inducements, and liquidity sweeps.
Core Functionality
Liquidity Maxing performs three primary functions:
Tracks market structure to identify when control shifts between buyers and sellers
Scores potential trades using an eight-factor confluence system
Manages position sizing and risk exposure dynamically based on volatility and user-defined limits
The goal is selective trading when multiple conditions align, rather than frequent entries.
Market Structure Engine
The structure engine tracks three key events:
Break of Structure (BOS): Price pushes beyond a prior pivot in the direction of trend
Change of Character (CHoCH): Control flips from bullish to bearish or vice versa
Inducement Sweeps (IDM): Market briefly runs stops against trend before moving in the real direction
The structure module continuously updates strong highs and lows, labeling structural shifts visually. IDM markers are optional and disabled by default to maintain chart clarity.
The trade engine requires valid structure alignment before considering entries. No structure, no trade.
Eight-Factor Confluence System
Instead of relying on a single indicator, Liquidity Maxing uses an eight-factor scoring system:
Structure alignment with current trend
RSI within healthy bands (different ranges for up and down trends)
MACD momentum agreement with direction
Volume above adaptive baseline
Price relative to main trend EMA
Session and weekend filter (configurable)
Volatility expansion/contraction via ATR shifts
Higher-timeframe EMA confirmation
Each factor contributes one point to the confluence score. The default minimum confluence threshold is 6 out of 8, but you can adjust this from 1-8 based on your preference for trade frequency versus selectivity.
Only when structure and confluence agree does the strategy proceed to risk evaluation.
Dynamic Risk Management
Risk controls are implemented in multiple layers:
ATR-based stops and targets with configurable risk-to-reward ratio (default 2:1)
Volatility-adjusted position sizing to maintain consistent risk per trade as ranges expand or compress
Daily and weekly risk budgets that halt new entries once thresholds are reached
Correlation cooldown to prevent clustered trades in the same direction
Global circuit breaker with maximum drawdown limit and emergency kill switch
If any guardrail is breached, the strategy will not open new positions. The dashboard clearly displays risk state for transparency.
Market Presets
The strategy includes configuration presets optimized for different market types:
Crypto (BTC/ETH): RSI bands 70/30, volume multiplier 1.2, enhanced ATR scaling
Forex Majors: RSI bands 75/25, volume multiplier 1.5
Indices (SPY/QQQ): RSI bands 70/30, volume multiplier 1.3
Custom: Default values for user customization
For crypto assets, the strategy automatically applies ATR volatility scaling to account for higher volatility characteristics.
Monitoring and Dashboards
The strategy includes optional monitoring layers:
Risk Operations Dashboard (top-right):
Trend state
Confluence score
ATR value
Current position size percentage
Global drawdown
Daily and weekly risk consumption
Correlation guard state
Alert mode status
Performance Console (top-left):
Net profit
Current equity
Win rate percentage
Average trade value
Sharpe-style ratio (rolling 50-bar window)
Profit factor
Open trade count
Optional risk tint on chart background provides visual indication of "safe to trade" versus "halted" state.
All visualization elements can be toggled on/off from the inputs for clean chart viewing or full telemetry during parameter tuning.
Alerts and Automation
The strategy supports alert integration with two formats:
Standard alerts: Human-readable messages for long, short, and risk-halt conditions
Webhook format: JSON-formatted payloads ready for external execution systems (optional)
Alert messages are predictable and unambiguous, suitable for manual review or automated forwarding to execution engines.
Built-in Validation Suite
The strategy includes an optional validation layer that can be enabled from inputs. It checks:
Internal consistency of structure and confluence metrics
Sanity and ordering of risk parameters
Position sizing compliance with user-defined floors and caps
This validation is optional and not required for trading, but provides transparency into system operation during development or troubleshooting.
Strategy Parameters
Market Presets:
Configuration Preset: Choose between Crypto (BTC/ETH), Forex Majors, Indices (SPY/QQQ), or Custom
Market Structure Architecture:
Pivot Length: Default 5 bars
Filter by Inducement (IDM): Default enabled
Visualize Structure: Default enabled
Structure Lookback: Default 50 bars
Risk & Capital Preservation:
Risk:Reward Ratio: Default 2.0
ATR Period: Default 14
ATR Multiplier (Stop): Default 2.0
Max Drawdown Circuit Breaker: Default 10%
Risk per Trade (% Equity): Default 1.5%
Daily Risk Limit: Default 6%
Weekly Risk Limit: Default 12%
Min Position Size (% Equity): Default 0.25%
Max Position Size (% Equity): Default 5%
Correlation Cooldown (bars): Default 3
Emergency Kill Switch: Default disabled
Signal Confluence:
RSI Length: Default 14
Trend EMA: Default 200
HTF Confirmation TF: Default Daily
Allow Weekend Trading: Default enabled
Minimum Confluence Score (0-8): Default 6
Backtesting Considerations
When backtesting this strategy, consider the following:
Commission: Default 0.05% (adjustable in strategy settings)
Initial Capital: Default $100,000 (adjustable)
Position Sizing: Uses percentage of equity (default 2% per trade)
Timeframe: Optimized for 4-hour charts, though can be tested on other timeframes
Results will vary significantly based on:
Market conditions and volatility regimes
Parameter settings, especially confluence threshold
Risk limit configuration
Symbol characteristics (crypto vs forex vs equities)
Past performance does not guarantee future results. Win rate, profit factor, and other metrics should be evaluated in context of drawdown periods, trade frequency, and market conditions.
How to Use This Strategy
This is a framework that requires understanding and parameter tuning, not a one-size-fits-all solution.
Recommended workflow:
Start on 4-hour timeframe with default parameters and appropriate market preset
Run backtests and study performance console metrics: focus on drawdown behavior, win rate, profit factor, and trade frequency
Adjust confluence threshold to match your risk appetite—higher thresholds mean fewer but more selective trades
Set realistic daily and weekly risk budgets appropriate for your account size and risk tolerance
Consider ATR multiplier adjustments based on market volatility characteristics
Only connect alerts or automation after thorough testing and parameter validation
Treat this as a risk framework with an integrated entry engine, not merely an entry signal generator. The risk controls are as important as the trade signals.
Strategy Limitations
Designed for swing trading timeframes; may not perform optimally on very short timeframes
Requires sufficient market structure to identify pivots; may struggle in choppy or low-volatility environments
Crypto markets require different parameter tuning than traditional markets
Risk limits may prevent entries during favorable setups if daily/weekly budgets are exhausted
Correlation cooldown may delay entries that would otherwise be valid
Backtesting results depend on data quality and may not reflect live trading with slippage
Design Philosophy
Many indicators tell you when price crossed a moving average or RSI left oversold. This strategy addresses questions institutional traders ask:
Who is in control of the market right now?
Is this move structurally significant or just noise?
Do I want to add more risk given what I've already done today/week?
If I'm wrong, exactly how painful can this be?
The strategy provides disciplined, repeatable answers to these questions through systematic structure analysis, confluence filtering, and multi-layer risk management.
Technical Implementation
The strategy uses Pine Script v6 with:
Custom types for structure, confluence, and risk state management
Functional programming approach for reusable calculations
State management through persistent variables
Optional visual elements that can be toggled independently
The code is open-source and can be modified to suit individual needs. All important logic is visible in the source code.
Disclaimer
This script is provided for educational and informational purposes only. It is not intended as financial, investment, trading, or any other type of advice or recommendation. Trading involves substantial risk of loss and is not suitable for all investors. Past performance, whether real or indicated by historical tests of strategies, is not indicative of future results.
No representation is being made that any account will or is likely to achieve profits or losses similar to those shown. In fact, there are frequently sharp differences between backtested results and actual results subsequently achieved by any particular trading strategy.
The user should be aware of the risks involved in trading and should trade only with risk capital. The authors and publishers of this script are not responsible for any losses or damages, including without limitation, any loss of profit, which may arise directly or indirectly from use of or reliance on this script.
This strategy uses technical analysis methods and indicators that are not guaranteed to be accurate or profitable. Market conditions change, and strategies that worked in the past may not work in the future. Users should thoroughly test any strategy in a paper trading environment before risking real capital.
Commission and slippage settings in backtests may not accurately reflect live trading conditions. Real trading results will vary based on execution quality, market liquidity, and other factors not captured in backtesting.
The user assumes full responsibility for all trading decisions made using this script. Always consult with a qualified financial advisor before making investment decisions.
Enjoy - officialjackofalltrades

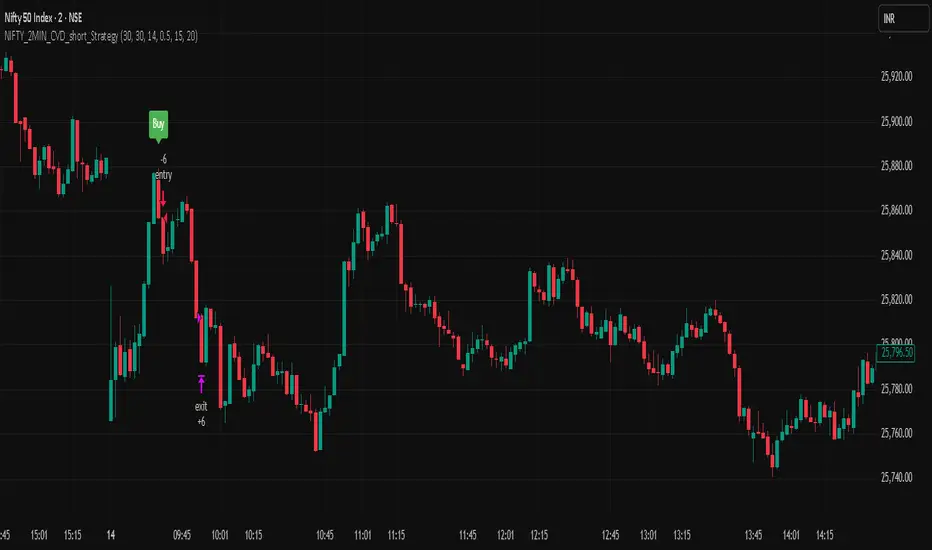
NIFTY_2MIN_CVD_short_StrategySummary
This strategy is an intraday system designed for the Nifty index on a 2-minute timeframe, focusing exclusively on identifying high-probability short (sell) entries. It utilizes a combination of rapid price action and Cumulative Volume Delta (CVD) to detect "Buying Absorption" at local peaks.
Concept & Core Logic
The strategy is engineered to identify "Inverted V-shaped" reversals where aggressive buying pressure is exhausted and absorbed by large-scale limit orders from sellers.
Price Action Trigger: The strategy looks for a specific two-part sequence:
Sudden Bullish Movement: A rapid upward move that often traps late buyers or triggers short-covering.
Sudden Reversal: Immediately followed by a strong, high-momentum bearish (red) candle, signaling a swift rejection of the higher prices.
CVD Absorption Filter: To confirm the validity of the reversal, the strategy analyzes the Cumulative Volume Delta (CVD). It identifies instances where the relative movement of the CVD is significantly higher than the corresponding price movement. This specific divergence highlights "Buying Absorption"—a market condition where aggressive market buy orders are being filled by passive limit sell orders, preventing further price appreciation and creating a heavy ceiling for the reversal.
Risk Management
To maintain a disciplined approach, the strategy employs fixed exit parameters based on the underlying Nifty price:
Take Profit: 25 points.
Stop Loss: 30 points.
Intended Use
This tool is intended for traders who study mechanical, rule-based systems and order flow dynamics. It provides a structured framework for observing how volume delta divergence (CVD) and rapid price rejections interact at potential market turning points.
Disclaimer: This script is for educational and informational purposes only. It is not financial advice. All trading involves risk, and past performance is not indicative of future results. Please conduct your own research and backtesting before making any trading decisions.
NIFTY_2MIN_CVD_Absorption_long_StrategySummary
This strategy is an intraday system designed for the Nifty index on a 2-minute timeframe, focusing on high-probability reversal entries. It utilizes price action patterns and Cumulative Volume Delta (CVD) to identify market turning points.
Long Strategy: Concept & Core Logic
The long strategy is engineered to identify "V-shaped" recoveries where selling pressure is exhausted and absorbed by aggressive buyers.
Price Action Trigger: The strategy looks for a specific two-part sequence:
Sudden Bearish Movement: A rapid downward move representing a final flush of sellers.
Sudden Reversal: Immediately followed by a strong, high-momentum bullish (green) candle, indicating a swift change in market sentiment.
CVD Absorption Filter: To confirm the validity of the reversal, the strategy analyzes the Cumulative Volume Delta (CVD). It specifically looks for instances where the relative movement of CVD is significantly higher than the corresponding price movement. This divergence suggests "selling absorption"—where large buy orders are soaking up sell-side liquidity, creating a floor for the reversal.
Risk Management (Long)
The strategy utilizes fixed exit parameters based on the underlying Nifty price points:
Take Profit: 25 points.
Stop Loss: 30 points.
Intended Use
This tool is intended for traders who study mechanical, rule-based systems. It demonstrates how price action, volume delta divergence (CVD), and trend filters can be combined to time entries in both trending and reversal market conditions.
Disclaimer: This script is for educational and informational purposes only. It is not financial advice. All trading involves risk, and past performance is not indicative of future results. Please conduct your own research and backtesting before making any trading decisions.

Signal Algo - Elephant Edge Strategy🔶 Strategy Overview:
This strategy is designed for intraday trading and focuses on taking trades near important price reference areas instead of random market locations.
This strategy is designed to:
Take trades only near important price levels
Avoid random mid-market entries
Validate every trade using multiple confirmation filters
It combines the following core concepts:
Elephant Edge zones based on previous session volatility
Index & F&O strike price levels (psychological and liquidity-based levels)
Previous Day OHLC levels (important institutional reference prices)
The goal of this strategy is to allow trades only when price behavior is meaningful and occurs near key market reference areas, while filtering out low-quality signals. All filters are optional, allowing traders to customize the strategy according to their trading style, risk preference, and market conditions.
🔶 How to Use: Elephant Edge Support–Resistance
This strategy is based on the Elephant Edge Support–Resistance concept, where trades are taken only near important price zones instead of random market areas.
The image above shows how the strategy identifies Support Zones, Resistance Zones, and how trade entries and exits are generated.
🟩 Support Zones:
Shown as green areas. These are considered potential Buy zones.
A positive price reaction from these zones is required before a Buy entry is generated.
🟥 Resistance Zones:
Shown as red areas. These are considered potential Sell zones.
Price rejection from these zones is required before a Sell entry is generated.
Important:
The strategy does not blindly buy or sell at the zone. Entries are generated only after additional confirmation, such as: Candle structure validation, Directional filters, Optional, volume and time filters (if enabled)
Trade entries are generated only when price touches a Support or Resistance zone.
These zones represent areas where price is more likely to react, helping to avoid low-quality trades during sideways or random market movement.
Final Understanding:
This strategy is not about predicting the market. It is about reacting to price behavior at important levels and trading only when conditions are meaningful.
🔶 How to Use: Index Strike Price Support–Resistance
This concept is based on *Index & F&O Strike Price levels*, where trades are taken near important *round-number strike prices* (for example: every 50 or 100 points), instead of random price locations.
The image above shows how *strike prices act as natural Support and Resistance levels** in index trading.
🟩 Strike Price Support:
Strike levels below the current price act as potential Support zones. Price reaction from these levels is required before a Buy entry is generated.
🟥 Strike Price Resistance:
Strike levels above the current price act as potential Resistance zones. Price rejection from these levels is required before a Sell entry is generated.
Trade entries are generated only when price touches or reacts near a strike price level.
These levels represent *psychological and liquidity-based areas*, where price is more likely to pause, reverse, or react.
🔶 How to Use: Previous Day OHLC Levels
This concept is based on *Previous Day Open, High, Low, and Close (OHLC)* levels, which are widely used as *important market reference prices* by traders and institutions.
The image above shows how price reacts around Previous Day OHLC levels and how they act as natural *Support and Resistance areas** during intraday trading.
🟩 Previous Day Support Levels:
Previous Day Open, Low, or Close levels below the current price act as potential Support zones.
A positive price reaction from these levels is required before a Buy entry is generated.
🟥 Previous Day Resistance Levels:
Previous Day Open, High, or Close levels above the current price act as potential Resistance zones. Price rejection from these levels is required before a Sell entry is generated.
Trade entries are generated only when price touches or reacts near a Previous Day OHLC level.
These levels represent *high-interest price areas* where price is more likely to pause, reverse, or show strong reactions.
🔵 Strategy Setting Features Overview :
Trade Direction Controls : -
Buy Only When enabled: The strategy will generate only Buy trades All Sell signals are ignored Sell Only When enabled: The strategy will generate only Sell trades All Buy signals are ignored
Important Note If both Buy Only and Sell Only are enabled: The strategy can generate both Buy and Sell trades
Candle Direction & Color Filter : -
Available Options:
Both - Candle color is ignored Trades depend only on strategy logic
Trend - Buy → Green candles only. Sell → Red candles only
O-Trend - Buy → Red candles only. Sell → Green candles only
Continuous Buy / Sell Check : -
When enabled: Prevents repeated trades in the same direction Reduces over-trading during sideways markets Example: After a Buy trade, another Buy trade will not be taken immediately unless conditions reset.
Elephant Edge Percentile Levels : -
When enabled: Buy trades are allowed only near lower percentile levels Sell trades are allowed only near upper percentile levels
Why this matters: Percentile levels act as dynamic intraday support and resistance based on historical price movement.
Strike Price Level Filters : -
When enabled: Buy trades require price to touch lower strike zones Sell trades require price to touch upper strike zones
Why strike levels are important: Strike prices often act as psychological and liquidity zones, especially in index trading.
Previous Day OHLC Levels : -
When enabled: Draws Previous Day Open, High, Low, and Close on the chart Trades are allowed only when price touches any of these levels
Why Previous Day levels matter: These levels are widely watched by traders and institutions Price often reacts strongly near them Helps filter out low-probability trades
Stoploss Settings : -
Candle Touch: Stoploss triggers immediately when price touches the level
Candle Close: Stoploss triggers only after candle closes beyond the level
Stoploss Type Choose how stoploss distance is calculated:
Candle High / Low
Fixed Points
Percentage based
Trailing Stoploss : -
Trailing stoploss helps protect profits as price moves favorably. Trailing Mode
Points
Percentage
Trailing Activation Defines how much profit is required before trailing starts.
Candle Structure Filters : -
Candle Size : Filter Avoids trades on: Very small candles (low momentum) Extremely large candles (high risk)
Candle Body : Filter Ensures trades are taken only on candles with sufficient body strength.
Wick Filter : Filters out candles with unusually long wicks, which often indicate fake breakouts.
Hammer Candle Detection : -
Enable Hammer Pattern Detects hammer-type candles using wick-to-body ratios.
Useful for: Reversal-based setups near key levels
Entry & Stop Buffers : -
Buffers add small offsets to: Entry price Stoploss price
Purpose: Helps avoid false triggers caused by small price spikes or noise.
Volume-Based Validation : -
Use Volume Alert Validity Trades are allowed only after a high-volume candle appears.
Why volume matters: High volume confirms participation and interest.
Time & Trade Limits : -
Entry / Exit Time Restricts trades to specific market hours. Trade Count Limits Controls the maximum number of trades per session to avoid over-trading.
Quantity Calculation: -
Investment Amount Automatically calculates trade quantity based on capital amount.
Benefit: Helps maintain consistent risk across different instruments.
JSON Alert Output: -
Used for: Automation Broker integration This does not affect strategy logic.
⚠️ Disclaimer This strategy is provided for educational and research purposes only. Past performance does not guarantee future results. Users should test and manage risk independently.
