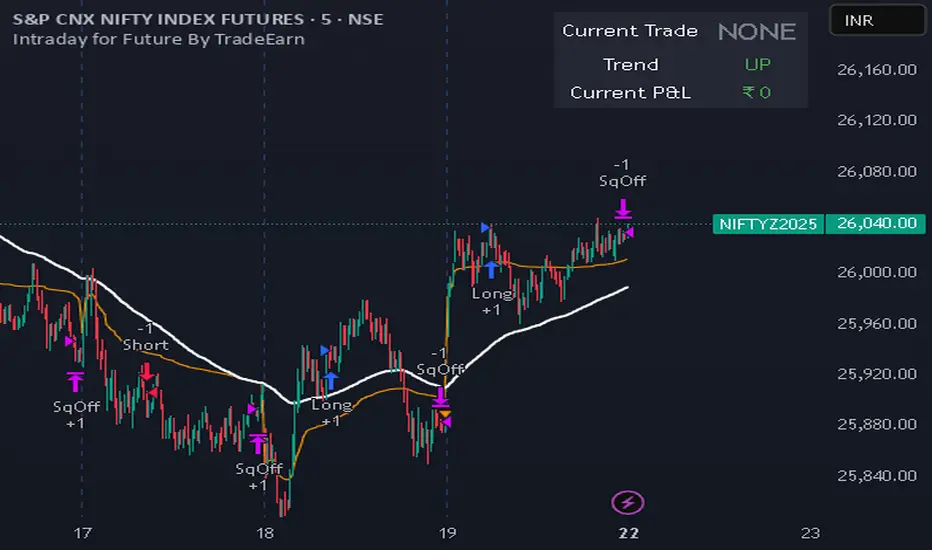
Intraday for Future By TradeEarnIntraday Strategy (StochRSI + VWAP + EMA)
Overview The Intraday Pullback Scalper is a specialized trend-following strategy designed for futures and equity traders who prefer to enter existing trends on pullbacks rather than chasing breakouts. By combining volume-weighted data (VWAP) with exponential moving averages (EMA) and momentum oscillators (Stochastic RSI), this script identifies high-probability entry points during intraday sessions. It includes built-in automation hooks (Alerts) compatible with bridge services for seamless execution.
How It Works
The strategy relies on a three-step confirmation process to filter noise and precision-time entries:
Trend Definition (The Filter):
VWAP (Volume Weighted Average Price): Acts as the primary regime filter. Longs are only permitted if price > VWAP; Shorts only if price < VWAP.
EMA (Exponential Moving Average): A secondary trend filter (default 100 periods) ensures alignment with the broader trend.
Time Range Breakout (Optional): Users can enable an "Initial Balance" filter where trades are only taken if the price breaks out of a specific time range (e.g., first hour High/Low).
Entry Trigger (The Signal):
Long Entry: The market must be in an Uptrend (Price > VWAP & EMA). The script waits for a "dip" where the Stochastic RSI drops below the Oversold level (default 20) and then crosses back up.
Short Entry: The market must be in a Downtrend (Price < VWAP & EMA). The script waits for a "rally" where the Stochastic RSI rises above the Overbought level (default 80) and then crosses back down.
Risk Management:
The strategy uses fixed Target Profit and Stop Loss values defined in currency (₹) relative to the trade quantity.
It features visual SL and TP lines on the chart for the duration of the trade to assist with manual monitoring.
Key Features
Universal Compatibility: Works on the "Current Chart" (Nifty, Bank Nifty, Stocks, Commodities) without needing complex dropdown selection.
Visual Dashboard: An on-screen table displays the Current Trade Status (Long/Short), Trend Direction, and Running P&L in real-time.
Algobaba Bridge Ready: Pre-formatted alert messages are included for users utilizing the Algobaba bridge for automation (supports MIS/NRML product types).
Customizable Trend Filters: Users can toggle the Time Range filter or adjust the VWAP Anchor (Session, Week, Month).
Settings & Configuration
Trade Quantity: Set your default lot size (e.g., 50 for Nifty).
Risk Settings: Define Target and Stop Loss in Rupees (₹) per trade setup.
Indicators: Adjustable lengths for EMA, RSI, and Stochastic.
Trading Window: Restrict entries to specific session hours (e.g., 09:15 - 15:10).
⚠️ IMPORTANT DISCLAIMER & RISK WARNING ⚠️
1. Educational Purpose Only This strategy script is provided solely for educational, informational, and research purposes. It does not constitute financial advice, investment recommendations, or a solicitation to buy or sell any securities, futures, or derivatives. The author is not a SEBI registered Research Analyst or Investment Advisor.
2. No Guarantee of Profit The "P&L" and performance metrics displayed on the chart are hypothetical and based on historical data. Past performance is not indicative of future results. Market conditions change, and a strategy that worked in the past may fail in the future.
3. Limitations of Backtesting
Slippage & Commission: The script results may not fully account for real-world execution costs such as broker commissions, taxes (STT/GST), slippage, or liquidity issues.
Repainting/Data Lag: While every effort is made to ensure code stability, real-time data feeds may vary from historical data due to internet latency or data provider differences.
4. High Risk in Derivatives Trading Futures and Options (F&O) involves a substantial risk of loss and is not suitable for every investor. You can lose more than your initial capital. Please assess your risk tolerance and financial situation before trading.
5. Automation & Third-Party Tools This script includes alert messages formatted for third-party bridge services (e.g., Algobaba). The author assumes no responsibility for:
Technical failures, API errors, or connectivity issues with your broker or bridge provider.
Incorrect order execution resulting from automation.
Users are solely responsible for monitoring their trades and verifying order execution.
Usage Agreement By using this script, you acknowledge that you are trading at your own risk and hold the author harmless from any losses incurred. Always test on a paper trading account before deploying real capital.
ابحث في النصوص البرمجية عن "momentum"
Panic Spike Reversal Strategy | KR3000Panic Spike Reversal Strategy | KR3000
This is a highly attractive yet dangerous trading tool, designed for traders who understand risk and are willing to face it.
The core idea is simple but powerful:
when the market experiences an abnormal surge or collapse within a higher timeframe, this strategy identifies those panic-driven spikes and enters against the move, aiming to capture the natural price mean reversion that often follows extreme emotional behavior.
This strategy is not designed for comfort.
It is designed for discipline, execution, and courage.
🔍 What This Strategy Does
Monitors a higher timeframe (e.g. 1H) in real time
Detects sharp upward or downward price spikes based on user-defined percentage thresholds
Automatically enters contrarian positions:
Spike up → Short
Spike down → Long
Optionally allows both directions within the same monitoring bar, selecting the stronger extreme when both occur
Executes all entries only after bar close, ensuring non-repainting behavior
Uses fixed percentage-based take profit and stop loss, fully adjustable by the user
Limits signals to one trigger per monitoring timeframe bar (optional), preventing overtrading
⚙️ Core Logic & Principles
Markets do not move in straight lines.
Extreme moves are often driven by fear, greed, and forced liquidity, not balanced price discovery.
This strategy is built on the assumption that:
Violent price expansions are statistically unstable
Panic moves frequently overextend, creating short-term opportunities in the opposite direction
However, mean reversion is not guaranteed.
This is why strict stop loss control is essential and fully configurable.
⚠️ Risk Warning
This is a contrarian strategy by nature.
It intentionally trades against strong momentum
Losses can occur quickly if the trend continues
It is not suitable for beginners
Best used by experienced traders who understand:
market structure
volatility behavior
and emotional discipline
If you are looking for safety, this strategy is not for you.
If you are looking for controlled danger with defined risk, this tool may be worth your attention.
🧠 Who This Strategy Is For
Traders who specialize in mean reversion or fade setups
Instruments with high liquidity and volatility (e.g. indices, gold, FX majors)
Users who value transparent logic, non-repainting signals, and full parameter control
Traders who accept that high reward potential comes with high psychological pressure

Supertrend Strategy PRO FiltersSupertrend Strategy — PRO Filters is an extended trend-following strategy based on the classic SuperTrend indicator, enhanced with 7 independent professional entry-quality filters, a Stop Loss / Take Profit system, and higher timeframe support.
The strategy is designed for intraday and swing trading on liquid instruments (stocks, futures, cryptocurrencies).
The core logic of the strategy
The strategy is built around the SuperTrend indicator calculated using ATR:
Long — when the trend changes from bearish to bullish
Short — when the trend changes from bullish to bearish
The trend reversal is determined by a breakout of the dynamic SuperTrend lines (up / down), which adapt to market volatility.
Filter system (7 levels)
Each filter can be enabled or disabled independently, allowing the strategy to be adapted to any market and trading style.
ATR Regime Filter
Purpose: trading only during active market phases
An entry is allowed when the current ATR is above its average value
Filters out flat and low-volatility periods
Higher Timeframe Trend Filter
Purpose: trading only in the direction of the higher timeframe trend
Uses SuperTrend on the higher timeframe
Long — only when the HTF trend is bullish
Short — only when the HTF trend is bearish
RSI Impulse Filter
Purpose: filtering out weak and late impulses
Long: RSI above a specified level
Short: RSI below a specified level
Candle Quality Filter
Purpose: excluding entries on “noisy” candles
Entries are allowed only when the candle body is significantly larger than the wicks
Helps avoid false breakouts
SuperTrend Slope Filter
Purpose: confirming trend strength
The slope of the SuperTrend lines is analyzed
Entries are allowed only when sufficient momentum is present
Volume Filter
Purpose: confirming price movement with volume
Volume must exceed the SMA of volume by a multiplier
Filters out moves without participation from large players
EMA Trend Filter
Purpose: additional direction filter
Long — price above EMA
Short — price below EMA
Final entry conditions
A trade is opened only when all of the following are met:
A SuperTrend trend-change signal
All enabled filters
This significantly reduces the number of trades while improving their quality.
Risk management (SL / TP)
An optional fixed-risk system:
Take Profit — as a percentage of the entry price
Stop Loss — as a percentage of the entry price
Works identically for both Long and Short positions
Usage recommendations
Best results are typically achieved on 15m–1h timeframes
It is recommended to optimize filters for each specific instrument
Especially effective in markets with strong, well-defined trends
Disclaimer
This strategy is intended for analysis and educational purposes only.
Before using it in live trading, be sure to conduct your own testing and optimization.
Supertrend Strategy — PRO Filters — это расширенная трендовая стратегия на базе классического SuperTrend, дополненная 7 независимыми профессиональными фильтрами качества входа, системой Stop Loss / Take Profit и поддержкой старшего таймфрейма.
Стратегия предназначена для интрадей- и свинг-торговли на ликвидных инструментах (акции, фьючерсы, криптовалюты).
Базовая логика стратегии
В основе стратегии лежит индикатор SuperTrend, построенный на ATR:
Long — при смене тренда с нисходящего на восходящий
Short — при смене тренда с восходящего на нисходящий
Смена направления определяется пробоем динамических линий SuperTrend (up / down), адаптирующихся к волатильности рынка.
Система фильтров (7 уровней)
Каждый фильтр можно включать или отключать независимо, что позволяет адаптировать стратегию под любой рынок и стиль торговли.
ATR Regime Filter
Назначение: торговля только в активной фазе рынка
Вход разрешён, если текущий ATR выше своего среднего значения
Отсекает флэт и низковолатильные периоды
Higher Timeframe Trend Filter
Назначение: торговля только в сторону тренда старшего таймфрейма
Используется SuperTrend на HTF
Long — только при восходящем тренде HTF
Short — только при нисходящем
RSI Impulse Filter
Назначение: фильтрация слабых и запаздывающих импульсов
Long: RSI выше заданного уровня
Short: RSI ниже заданного уровня
Candle Quality Filter
Назначение: исключение входов по «шумным» свечам
Вход только если тело свечи существенно больше фитилей
Помогает избежать ложных пробоев
SuperTrend Slope Filter
Назначение: подтверждение силы тренда
Анализируется наклон линий SuperTrend
Вход разрешён только при достаточной динамике
Volume Filter
Назначение: подтверждение движения объёмом
Объём должен превышать SMA объёма с коэффициентом
Исключает входы без участия крупных игроков
EMA Trend Filter
Назначение: дополнительный фильтр направления
Long — цена выше EMA
Short — цена ниже EMA
Итоговые условия входа
Сделка открывается только при одновременном выполнении:
Сигнала смены тренда SuperTrend
Всех активированных фильтров
Это значительно снижает количество сделок, но повышает их качество.
Управление рисками (SL / TP)
Опциональная система фиксированного риска:
Take Profit — в процентах от цены входа
Stop Loss — в процентах от цены входа
Работает одинаково для Long и Short
Рекомендации по использованию
Лучшие результаты показывает на 15m–1h таймфреймах
Рекомендуется оптимизация фильтров под конкретный инструмент
Особенно эффективна на рынках с выраженными трендами
Дисклеймер
Стратегия предназначена для анализа и обучения.
Перед использованием в реальной торговле обязательно проведите собственное тестирование и оптимизацию.
Переведи на английский. Не форматироу просто перевод

Advanced ORB Strategy v6 (Time-Based Fix)/Once the window closes, the market has drawn its first meaningful line in the sand. A break above the opening range high signals that early sellers are trapped and buyers are pressing. A break below the opening range low signals the opposite. Trades are only considered after price leaves the range and shows acceptance, not on the first tick outside.
Risk is defined and limited by the range itself. Stops are placed back inside the opening range, which keeps losses small and predefined. Targets are based on objective market references such as overnight highs and lows, VWAP extensions, or prior session levels—not arbitrary profit goals.
This strategy is not predictive. It does not try to forecast direction or call tops and bottoms. It responds to real order flow and liquidity behavior as it unfolds. When the market is trending, the strategy captures momentum early. When conditions are choppy or volatility is compressed, trades are filtered out or avoided entirely.
The strength of this approach is its simplicity, repeatability, and risk control. One defined window. One defined range. Clear entry criteria. Clear exits. No overtrading.

Hosoda ZHosoda’s Clouds is a trend-following strategy designed to trade only long positions in traditionally trending markets with a strong bullish bias: SPY(D); DJI (D); NDX (D); XAUUSD (D); Tesla (D, H4, H1); AAPL (D, H4, H1); GOOG (D, H4); META (D, H4); NVDA (D, H4); AMZN(D, H4).
Strategy Parameters
Initial Capital: $10,000 USD.
Position Size: Risks 10% of your equity per trade.
Commission: 0.1%
Indicators
The strategy combines two main technical tools:
A. Ichimoku Cloud This is the core of the strategy. It calculates the classic lines:
• Tenkan-sen (Fast Line): Average of the highest high and lowest low of the last 9 periods.
• Kijun-sen (Base Line): Average of the last 26 periods.
• Cloud (Senkou Span A and B): Projects future support/resistance.
B. EMA 500 (Trend Filter)
• A 500-period Exponential Moving Average is calculated.
• Function: Serves as a very long-term trend filter. If the price is above the EMA 500, the market is considered bullish in the long term.
Entry Rules
• Bullish Cross (Bull Cross): The fast line (Tenkan) crosses above the base line (Kijun). This is the classic Ichimoku entry signal.
• Trend Filter (Optional):
•If you check the "Enable EMA Filter" box in the options, the system will only buy if the closing price is above the EMA 500.
•If the box is unchecked, it will ignore the EMA and buy based solely on the Ichimoku cross.
Exit Rules
A. Stop Loss (Loss Protection) It is a dynamic Stop Loss based on market structure, not a fixed percentage.
• At the moment of entry, the code looks back 12 bars (configurable in sl_bars_back) and finds the lowest price (low).
• It places the Stop Loss at that minimum level.
• Visual: Draws a dotted red line on the chart showing where your Stop Loss is.
B. Technical Take Profit (Exit due to Weakness) Lets profits run until the trend shows weakness.
• Condition: Closes the trade if the Tenkan line crosses below the bottom of the Cloud .
• This means short-term momentum has been lost and the price has entered or crossed below the cloud.
Statistics Panel
In the top right corner, the code draws a table (Panel) that updates in real-time or at the end of Backtesting. It shows:
• Total P&L: Net profit or loss in dollars.
• Win Rate: Percentage of winning trades.
• Trades: Total number of trades executed.
Summary
1. The script waits for the blue line (Tenkan) to cross over the red line (Kijun).
2. It verifies if the price is above the orange line (EMA 500) (if the filter is active).
3. If so, it BUYS.
4. It immediately places a Stop Loss at the low of the last 12 candles (red dotted line).
5. It keeps the trade open until the Stop Loss is hit or until the Tenkan line drops below the Cloud.
Customizable Settings
• Whether to use the EMA filter or not.
• The EMA length (default is 500).
• The Ichimoku periods (9, 26, 52 are standard).
• How many bars to look back to set the Stop Loss.

Trend Core Strategy v1.0 - GUMROADLog Regression Channel Pro Strategy
This is a trend-following pullback strategy built for TradingView (Pine Script v6).
It uses logarithmic regression channels to define the market’s primary trend, and looks for low-risk pullback entries within strong trending conditions.
Momentum and trend strength filters are applied to avoid ranging or weak markets.
This strategy is designed to be used when the market is clearly trending, not during choppy or sideways price action.
Best Used When
Strong uptrend or downtrend is present
Price is pulling back toward the regression channel
Volatility is sufficient (ADX confirms trend strength)
Suitable for 1H / 4H timeframes
Commonly used on BTC, ETH, and major crypto pairs
Key Characteristics
Non-repainting logic
Volatility-based risk management (ATR)
Designed for realistic backtesting
No martingale, no grid, no over-optimization
Gumroad Disclaimer (3 Lines)
This strategy is provided for educational purposes only and is not financial advice.
Trading involves risk, and losses may occur.
You are fully responsible for your own trading decisions.

Estrategia Momentum Seguro (EMS) Entry and exit signals, this indicator helps or suggests where to enter, exit, or place a stop loss.

Hybrid Trend-Following Inside Bar BreakoutHybrid Trend-Following Inside Bar Breakout Strategy
The Hybrid Trend-Following Inside Bar Breakout Strategy is a rule-based trading system designed to capture strong directional moves while controlling risk during uncertain market conditions. It combines trend-following, price action, and volatility-based risk management into a single robust framework.
Core Concept
The strategy trades inside bar breakouts only in the direction of the dominant market trend. Inside bars represent periods of consolidation, and when price breaks out of this consolidation in a trending market, it often leads to impulsive moves with favorable risk–reward characteristics.
Key Components
1. Trend Filter
Uses 50 EMA and 200 EMA to define the market trend.
Bullish bias: 50 EMA above 200 EMA
Bearish bias: 50 EMA below 200 EMA
This filter prevents counter-trend trades and improves trade quality.
2. Volatility Filter
Compares fast ATR (14) with slow ATR (50).
Trades are taken only when volatility is expanding or above a minimum threshold.
This avoids low-volatility, choppy market conditions.
3. Inside Bar Breakout
An inside bar forms when the current candle’s high is lower than the previous candle’s high and the low is higher than the previous candle’s low.
A trade is triggered only when price breaks above or below the inside bar range in the direction of the trend.
4. Candle Quality Filter
Requires a minimum body-to-range ratio, ensuring that the breakout candle has strong momentum and is not driven by weak wicks.
Risk Management & Trade Management
Stop Loss (SL)
Placed using ATR-based dynamic stops, adapting to current market volatility.
Prevents tight stops in volatile conditions and wide stops in calm markets.
Partial Profit Taking
50% of the position is exited at 1.5R, locking in profits early.
This reduces psychological pressure and improves equity stability.
Trailing Stop
After partial profit is taken, the remaining position is managed with an ATR-based trailing stop.
Allows the strategy to capture large trend moves while protecting gains.
Cooldown Mechanism
After a losing trade, the system enters a cooldown period and skips a fixed number of bars.
This helps avoid revenge trading and overtrading during unfavorable market phases.
Why This Strategy Works
Trades only high-probability breakouts in trending markets
Adapts automatically to changing volatility
Combines price action precision with systematic risk control
Designed for consistent performance over long historical periods

Crypto LONG PYThis trading approach is a powerful combination of technical tools aimed at taking advantage of market fluctuations with precision and reliability. By integrating Bollinger Bands (BB), the Relative Strength Index (RSI), Exponential Moving Averages (EMA), and Fibonacci retracement levels (Fib), we create a strategy that captures key market moves and helps identify optimal entry and exit points, all within the context of the New York market conditions (NY).
Bollinger Bands provide insight into market volatility, offering signals about potential extreme price movements. The RSI is used to measure momentum and assess overbought or oversold conditions, indicating when the market might be nearing a reversal. Meanwhile, EMAs add a layer of smoothing, allowing us to observe short- and medium-term trends, helping filter out false signals and providing a clearer view of the overall market direction.
Additionally, Fibonacci retracements are integrated to identify key support and resistance levels, pinpointing potential areas of price retracement and continuation. When combined, these indicators offer a holistic approach to navigating the markets, enabling traders to make data-driven, informed decisions.
This approach is ideal for traders looking for a meticulous methodology for trading during the NY session, where liquidity and volatility tend to be at their highest. Leverage the synergy between these indicators to optimize your trading strategy and maximize your market performance.

Velocity SwingtraderThe intended objective of this indicator to gauge trend and momentum and find trades that are at the beginning of a trend change for longer periods of time (days, weeks, months).

AlphaGen ME V.15.12AlphaGen ME V.15.10 is an ATR-based trend-following strategy with dynamic trailing stops and EMA filter, designed for automated Crypto perpetual trading.
Core Logic:
• ATR Trailing Stops: Dynamically adjusts stop-loss using ATR(10) × 3.0 multiplier
• 200 EMA Trend Filter: Optional Only takes longs above EMA, shorts below EMA
• Reversal System: Flips positions when trend changes (filter-aware)
• MACD Acceleration Exit: Optional momentum-based profit taking
Position Sizing Modes:
• Simple % of Equity (default 90%) - Safe leverage control
• Risk % of Equity - Fixed risk per trade
• Fixed Contract Size - Consistent lot sizing
Webhook Integration:
Routes signals directly to AlphaGen-AI for execution on:
• Hyperliquid DEX
• AsterDEX
Requirements:
• AlphaGen-AI Pro subscription for webhook routing
• Hyperliquid or AsterDEX Wallets
• TradingView alerts configured with passphrase
Risk Disclosure: Trading involves substantial risk. Past performance does not guarantee future results. Only trade with capital you can afford to lose.

Cerber Strategy ETH/BTC Cerber Strategy: High-Precision Crypto Trend Follower
The Cerber Strategy is a low-frequency, high-conviction trend following system designed to capture massive quarterly crypto moves while
filtering out 90% of consolidation noise. It combines a momentum-based "Sniper Entry" (entering only on verified breakouts) with a
"Trend Confirmation" filter (Weekly DEMA) to ensure capital is only deployed during macro bull runs.
Usage:
* Timeframe: Daily (1D) mandatory.
* Assets: Optimized for BTC and ETH, works on high-volatility alts.
* Style: Position Trading (holding for weeks/months).
* Risk: Extremely high efficiency (high Profit Factor), very low drawdown compared to Buy & Hold. Perfect for a "Set and Forget"
portfolio allocation.

ORB Strategy: Extensions & Custom SL (EOD & Live Lines)That's a great request. Since you've now built a complex Pine Script Strategy with several user-configurable risk management, targeting, and exit options, the description should focus on the systematic rules used for entering, managing, and exiting trades.
Here is a clear, written description of the trading strategy you have built:
Trading Strategy Description: ORB Extension Breakout with Custom Stop, Live Tracking, and EOD Exit
This strategy is a systematic, momentum-based system designed for intraday trading. It operates on the principle of an Opening Range Breakout (ORB), utilizing the initial market consolidation to project high-probability targets, while offering multiple methods for managing risk and enforcing a mandatory end-of-day closure.
1. Market Identification (The Opening Range)
The strategy first defines the market's initial boundaries and volatility:
Session Window: The strategy calculates the Opening Range (OR) over a user-defined time period (default: 9:30 AM to 10:30 AM New York Time).
ORB Levels: Two key price levels are established and locked once the time window closes:
Wick High/Low: The absolute highest and lowest prices of the session. These serve as the entry trigger lines.
Body High/Low (Shaded Range): The highest and lowest open/close prices of the session. The height of this range is used as the basis for calculating all targets and stops.
2. Entry Rule (The Breakout)
The strategy waits passively for a breakout that confirms direction and ensures the move has not yet reached its immediate target.
Trigger Condition: A trade is signaled when a candle closes either:
Above the Wick High (for a Long entry).
Below the Wick Low (for a Short entry).
Constraint (Fresh Breakout): The entry is invalidated if the breakout candle's price action (High for Long, Low for Short) has already touched or surpassed the projected Take Profit (0.5 Extension) level before the candle closes.
Execution: The entry is a Market Order executed on the candle that meets the trigger conditions, subject to a user-defined Entry Delay (default 0 bars).
Direction Control: The user can select to trade Long Only, Short Only, or Both.
3. Exit and Risk Management
All trades are placed with simultaneous Take Profit and Stop Loss orders (a bracket order) upon entry.
A. Take Profit (TP)
The Take Profit is set at the 0.5 Extension of the Shaded Range (Body Range).
Calculation: The distance from the Body High/Low to the TP level is exactly 50% of the total height of the Shaded Range.
B. Stop Loss (SL)
The Stop Loss is dynamically calculated based on a user-selected method for risk control:
Range 0.5 (Body Range): The SL is placed an equal distance (0.5 times the Body Range height) outside the opposite side of the Body Range.
ATR Multiple: The Stop Loss distance is calculated as a user-defined Multiplier times the Average True Range (ATR).
Recent Swing Low/High: The Stop Loss is placed based on a structural low (for Long) or high (for Short) within a user-defined lookback period.
C. End-of-Day (EOD) Exit
Any open position is forced closed at the market price if it is still open when the user-defined closing time (default: 16:00 HHMM) is reached. This prevents carrying intraday risk overnight.
4. Visualization
The strategy includes comprehensive visual cues for analysis:
ORB Drawing: Displays the Wick High/Low and the shaded Body Range.
Breakout Signals: Highlights the specific bar where the validated entry signal occurs.
Closed Trades: Draws persistent lines for the Entry and Exit prices of the last few closed trades.
Live Open Trades: Draws persistent lines for the current Entry Price, active Take Profit Level, and active Stop Loss Level for any open position.

Strong Candle Probability Levels Tester [SYNC & TRADE]### Strategy Description: Strong Candle Probability Levels Tester
This strategy is a powerful tool for testing and visualizing probability levels based on strong candles, incorporating Volume Delta, Supertrend, and dynamic Fibonacci grids. Designed as a tester/trainer for traders analyzing price behavior around key support/resistance levels formed by strong impulse candles. It combines indicator elements for signal visualization with backtesting of trading scenarios, allowing evaluation of entry and exit effectiveness in real market conditions.
The main goal is to help traders understand how strong candles (with high volume and delta) influence subsequent price movement and test strategies based on Fibonacci extensions. It's not just an indicator but a full tester that simulates orders, stop-losses, take-profits, and advanced position management rules. Useful for beginners and experienced traders: enables practicing risk management, analyzing historical data, and optimizing approaches without real losses. Ultimately, you get visual feedback on level achievement probabilities, PNL statistics, and insights into market manipulations.
#### How the Strategy Works
The strategy identifies "strong candles" — impulse bars with elevated volume and significant delta (difference between buys and sells). Based on them, it builds a Fibonacci grid for potential entries (retracements) and exits (extensions). Additionally integrated are ATR filters for candle strength confirmation and Supertrend for trend context. The tester simulates pyramiding (adding positions), trailing stops, partial closes, and other rules to model real trading.
- **Volume Delta Analysis**: Visualizes volume deltas across timeframes to detect manipulations and impulse strength. Helpful for spotting when a candle is "strong" (high delta in the direction of movement) or "manipulative" (delta opposite to candle color).
- **Supertrend Filter**: Adds a trend indicator with an adaptive multiplier considering delta. Helps filter signals in trends, avoiding false entries.
- **Fibonacci Grid**: Automatically plots entry levels (retracements from 0% to 78.6%) and take-profits (extensions from 127.2% to 462%). The grid is "smart" — with advanced rules for profit protection and market adaptation.
The strategy does not reveal internal algorithms for strong candle detection but focuses on practical application: the tester shows how price reacts to these levels, aiding in assessing goal achievement probabilities.
#### How to Use
1. **Add to Chart**: In TradingView, select the tool, specify symbol (stocks, crypto, forex), and timeframe (recommended M5 to D1 for Volume Delta accuracy).
2. **Configure Settings**:
- **Volume Delta Section**: Enable strong candles and manipulations display. Set ATR period for filter (default 3) and minimum body size (ATR multiplier, default 0.5). This ignores weak impulses.
*(Add photo here: example chart with strong candle marked by circle and delta as colored layers on bar.)*
- **Supertrend Section**: Enable for trend filtering. Set ATR length (default 5) and multiplier (default 2.62). Delta or strong candle filter options enhance signals.
*(Photo: chart with Supertrend line colored by z-score strength and trend background.)*
- **Fibonacci Basics**: Choose direction (long/short/both), stop-loss mode (crossover or body close). Specify lot per level (default 0.1) and max active grids (default 7).
*(Photo: grid with entry and TP levels on real chart, with orders.)*
- **Advanced Rules**: Activate options like protection at 161.8%/261.8%, grid lock after 127.2%, trailing after TP1, partial close on pullback, pyramiding, time/momentum exits, or "news". This simulates complex scenarios.
- **Risk Management**: Enable exposure limit (max entry amount in USD) for safe testing.
*(Photo: PNL and risk stats in strategy table.)*
- **Entry/TP Levels**: Enable desired Fibonacci levels (retracements for entries, extensions for TP).
*(Photo: full grid with filled orders and partial TP.)*
- **Visualization**: Enable grid level display for clarity.
*(Photo: multiple grids on chart with base price and SL lines.)*
3. **Interpret Signals**:
- **Strong Candle**: Marked by circle (blue for long, red for short). Z-label in circle shows strength (2+ for significant).
- **Manipulation**: Cross (X) indicates potential trap (delta opposite to candle).
- **Grid**: Forms on strong candle. Entries — limit orders on retracements, TP on extensions. Monitor fills and closes in strategy report.
- **Supertrend**: Trend line with color gradation by strength (darker = stronger). Background highlights direction.
4. **Testing**:
- Run backtest in TradingView (select period, capital). Analyze metrics: PNL, drawdown, win-rate.
- Train: Change settings, observe rule impacts (e.g., trailing reduces risks but may miss profits).
- For live chart: Use as indicator for manual entries, ignoring orders.
#### Purpose and Benefits
This strategy is an ideal trainer for mastering probability trading based on strong candles and Fibonacci. It provides:
- **Probability Visualization**: Shows how often price hits levels (127.2%, 161.8%, etc.), helping assess risk/reward.
- **Risk Management Training**: Simulates real scenarios with pyramiding, trailing, partial closes, and exposure limits, reducing emotional errors.
- **Manipulation Analysis**: Volume Delta reveals hidden signals (weak/strong delta), useful for avoiding traps in volatile markets.
- **Trend Filter**: Supertrend with delta adaptation improves entry accuracy in trends.
- **Stats and Insights**: Report includes unrealized/realized PNL, average entry price, risk to SL. Aids in optimizing strategies for different assets.
Useful for: idea testing without risk, beginner education (visually intuitive), pro discipline improvement. Recommended to combine with other tools for signal confirmation. Remember: this is a tester, not financial advice — always demo test!

DR/IDR Break .5 TPDR/IDR Extension Breakout with Custom Stop
This strategy is a systematic, counter-trend, and momentum-based system designed for intraday trading. It operates on the principle of an Opening Range Breakout (ORB), utilizing the initial market consolidation to project high-probability targets, while offering multiple methods for managing risk.
1. Market Identification (The Opening Range)
The strategy begins by defining the market's initial boundaries and volatility:
Session Window: The strategy calculates the Opening Range (OR) over a user-defined time period (default: 9:30 AM to 10:30 AM New York Time).
ORB Levels: Two key price levels are established and locked once the time window closes:
Wick High/Low: The absolute highest and lowest prices of the session. These serve as the entry trigger lines.
Body High/Low (Shaded Range): The highest and lowest open/close prices of the session. The height of this range is used to calculate the Take Profit and Stop Loss levels.
2. Entry Rule (The Breakout)
The strategy is passive until the range is violated, looking for a strong move out of the consolidation area.
Trigger Condition: A trade is signaled when a candle closes either:
Above the Wick High (for a Long entry).
Below the Wick Low (for a Short entry).
Execution: The entry is a Market Order executed on the candle that meets the trigger condition, subject to a user-defined Entry Delay (default 0 bars, meaning the entry is taken immediately upon the breakout candle's close).
Direction Control: The user can select to trade Long Only, Short Only, or Both.
3. Exit and Risk Management
All trades are placed with simultaneous Take Profit and Stop Loss orders (a bracket order) once the entry is filled.
A. Take Profit (TP)
The Take Profit is set at the 0.5 Extension of the Shaded Range (Body Range).
Calculation: The distance from the Body High/Low to the TP level is exactly 50% of the total height of the Shaded Range.
B. Stop Loss (SL)
The Stop Loss is dynamically calculated based on a user-selected method for risk control:
Range 0.5 (Body Range): The Stop Loss is placed an equal distance (0.5 times the Body Range height) outside the opposite side of the Body Range.
Example (Long): If entry is above the Wick High, the SL is set 0.5 times the Body Range height below the Body Low.
ATR Multiple: The Stop Loss distance is determined by the asset's recent volatility.
Calculation: The distance is calculated as a user-defined Multiplier (default 2.0) times the Average True Range (ATR).
Recent Swing Low/High: The Stop Loss is placed based on a structural level defined by recent price action.
Long Entry: SL is placed at the Lowest Swing Low within a user-defined lookback period.
Short Entry: SL is placed at the Highest Swing High within a user-defined lookback period.
Summary of Workflow
The market sets the Wick and Body boundaries (e.g., 9:30–10:30 AM).
Price breaks and closes beyond a Wick boundary, triggering a signal.
The trade enters after the specified delay.
A bracket order is placed: TP is fixed at the 0.5 Extension, and SL is set based on the user's chosen risk method.
The trade is closed upon reaching either the TP or the SL level.

Mutanabby_AI | ONEUSDT_MR1
ONEUSDT Mean-Reversion Strategy | 74.68% Win Rate | 417% Net Profit
This is a long-only mean-reversion strategy designed specifically for ONEUSDT on the 1-hour timeframe. The core logic identifies oversold conditions following sharp declines and enters positions when selling pressure exhausts, capturing the subsequent recovery bounce.
Backtested Period: June 2019 – December 2025 (~6 years)
Performance Summary
| Metric | Value |
|--------|-------|
| Net Profit | +417.68% |
| Win Rate | 74.68% |
| Profit Factor | 4.019 |
| Total Trades | 237 |
| Sharpe Ratio | 0.364 |
| Sortino Ratio | 1.917 |
| Max Drawdown | 51.08% |
| Avg Win | +3.14% |
| Avg Loss | -2.30% |
| Buy & Hold Return | -80.44% |
Strategy Logic :
Entry Conditions (Long Only):
The strategy seeks confluence of three conditions that identify exhausted selling:
1. Prior Move Filter:*The price change from 5 bars ago to 3 bars ago must be ≥ -7% (ensures we're not entering during freefall)
2. Current Move Filter: The price change over the last 2 bars must be ≤ 0% (confirms momentum is stalling or reversing)
3. Three-Bar Decline: The price change from 5 bars ago to 3 bars ago must be ≤ -5% (confirms a significant recent drop occurred)
When all three conditions align, the strategy identifies a potential reversal point where sellers are exhausted.
Exit Conditions:
- Primary Exit: Close above the previous bar's high while the open of the previous bar is at or below the close from 9 bars ago (profit-taking on strength)
- Trailing Stop: 11x ATR trailing stop that locks in profits as price rises
Risk Management
- Position Sizing:Fixed position based on account equity divided by entry price
- Trailing Stop:11× ATR (14-period) provides wide enough room for crypto volatility while protecting gains
- Pyramiding:Up to 4 orders allowed (can scale into winning positions)
- **Commission:** 0.1% per trade (realistic exchange fees included)
Important Disclaimers
⚠️ This is NOT financial advice.
- Past performance does not guarantee future results
- Backtest results may contain look-ahead bias or curve-fitting
- Real trading involves slippage, liquidity issues, and execution delays
- This strategy is optimized for ONEUSDT specifically — results may differ on other pairs
- Always test before risking real capital
Recommended Usage
- Timeframe:*1H (as designed)
- Pair: ONEUSDT (Binance)
- Account Size: Ensure sufficient capital to survive max drawdown
Source Code
Feedback Welcome
I'm sharing this strategy freely for educational purposes. Please:
- Drop a comment with your backtesting results any you analysis
- Share any modifications that improve performance
- Let me know if you spot any issues in the logic
Happy trading
As a quant trader, do you think this strategy will survive in live trading?
Yes or No? And why?
I want to hear from you guys

SMC Pro [Stansbooth]
🔮 SMC × Fibonacci Confluence Engine — The Hidden Algorithm of the Markets
Welcome to a level of chart analysis where mathematics , market psychology , and institutional logic merge into one ultra-intelligent system.
This indicator decodes the true structure of price delivery by combining Smart Money Concepts with the timeless precision of Fibonacci ratios , revealing what retail traders can’t see — *the algorithmic heartbeat of the market*.
✨ What Makes This Indicator Different
Instead of drawing random lines or reacting to late signals, this tool **anticipates** market behavior by reading the footprints left behind by institutional algorithms. Every element is placed with purpose — every zone, every shift, every fib level — all forming a seamless narrative that explains *why* price moves the way it does.
🔥 Core Intelligence Features
Advanced BOS/CHOCH Auto-Detection — Spot structure shifts before momentum even forms.
Institutional Liquidity Mapping
— Identify liquidity pools, engineered sweeps, equal highs/lows, and trap zones designed by smart money.
Fibonacci-Aligned Precision Zones
— Auto-generated fib grids synced with SMC levels for pinpoint reversal and continuation setups.
Imbalance Engine
— FVGs, displacement, inefficiencies, and mitigation blocks displayed with crystal clarity.
Premium/Discount Algorithm
— Understand instantly whether price is in a zone of accumulation or distribution.
🚀 Designed for Traders Who Want an Edge
Whether you're scalping fast moves, capturing intraday swings, or holding higher-timeframe plays, this indicator provides a professional lens into the market. It turns complex price action into a structured, predictable system where every move has logic and every entry has confluence.
You don’t just see the chart —
you see the intention behind every push, pull, manipulation, and reversal.
💎 Why It Feels Like a Cheat Code
Because it mirrors the way institutions analyze the market:
— Identify liquidity
— Seek equilibrium
— Deliver price
— Create inefficiency
— Mitigate
— Continue the narrative
Using SMC and Fibonacci together unlocks the “algorithmic geometry” behind price movement, giving you clarity where others see chaos.
⚡ Trade With Confidence, Confluence & Control
This indicator isn’t just a tool.
It’s a complete trading framework — structured, intelligent, and deadly accurate.
Master the markets.
Decode the algorithm.
Trade like smart money .

StrategyScript77 Is a rule-based strategy built on top of an Ichimoku based engine.
Ichimoku concepts are used as the backbone for trend and momentum filtering, so the strategy tends to stay on the side of the dominant move instead of fighting it.
The name “Super77” comes from the behavior I consistently observed in testing because the win rate tends to hover around the 70–80% range, often clustering around ~77% when used as intended.
It’s not a promise or guarantee, but it reflects the core design philosophy: frequent, relatively small but steady wins, with controlled and manageable losses.
Trading Style – Built for Conservative Traders
Super77 is intentionally designed for traders who prefer a conservative and calm approach:
Entries only at bar close
The strategy waits for bar close confirmation before entering a position. No intrabar guessing, no chasing half-formed signals. If the signal is still valid at close, only then will it enter.
Exits automated on bar close
Exits are also managed on bar close, which makes the logic transparent, easy to review on the chart, and more robust in backtesting compared to tick-based or intrabar hacks.
Semi-auto friendly
If you like to keep some discretion, you can treat it as semi-automatic:
Let the strategy generate entry signals
Manually cancel or skip certain trades if market context changes (news, extreme volatility, etc.)
This combination makes Super77 suitable for traders who don’t want to stare at the screen all day but still want structure and automation.
How to Use
Works best with bar-close execution (avoid trying to simulate intrabar fills if you want consistent behavior).
Designed for conservative, trend-aligned trading, not for hyper-scalping or news gambling.
Can be used as:
Fully automated (let all entries/exits trigger on bar close), or
Semi-automated (use alerts/signals but manually cancel some entries).
Step-by-Step: Automation with Cornix (Webhook Setup)
You can automate Super77 using Cornix by connecting TradingView alerts to your Cornix group via webhook.
Note: Exact button names may differ slightly depending on Cornix / TradingView updates, but the flow is always the same:
Cornix group → get webhook URL & mapping → TradingView alerts → signals sent to Cornix.
(Optional) Map specific pairs / directions
If you use UUID / signal mapping per symbol and per side (long/short), set them up in Cornix according to your own template.
Super77 can be used either:
On a single pair (simple setup), or
On multiple pairs if your alert / webhook structure supports that. So you can pick many pairs with 1 script.
Final Notes & Disclaimer
Super77 is an educational and experimental trading tool, not financial advice.
Past performance in back tests does not guarantee future results.
Always:
Test on demo or paper first
Adjust risk to match your own profile
Accept that losses and drawdowns are a natural part of any strategy
If you’re looking for a strategy that reflects a conservative, confirmation-based trading style with a focus on steady win rate and smoother equity behavior, Super77 was built exactly with that mindset in mind.

ALT Risk Metric StrategyHere's a professional write-up for your ALT Risk Strategy script:
ALT/BTC Risk Strategy - Multi-Crypto DCA with Bitcoin Correlation Analysis
Overview
This strategy uses Bitcoin correlation as a risk indicator to time entries and exits for altcoins. By analyzing how your chosen altcoin performs relative to Bitcoin, the strategy identifies optimal accumulation periods (when alt/BTC is oversold) and profit-taking opportunities (when alt/BTC is overbought). Perfect for traders who want to outperform Bitcoin by strategically timing altcoin positions.
Key Innovation: Why Alt/BTC Matters
Most traders focus solely on USD price, but Alt/BTC ratios reveal true altcoin strength:
When Alt/BTC is low → Altcoin is undervalued relative to Bitcoin (buy opportunity)
When Alt/BTC is high → Altcoin has outperformed Bitcoin (take profits)
This approach captures the rotation between BTC and alts that drives crypto cycles
Key Features
📊 Advanced Technical Analysis
RSI (60% weight): Primary momentum indicator on weekly timeframe
Long-term MA Deviation (35% weight): Measures distance from 150-period baseline
MACD (5% weight): Minor confirmation signal
EMA Smoothing: Filters noise while maintaining responsiveness
All calculations performed on Alt/BTC pairs for superior market timing
💰 3-Tier DCA System
Level 1 (Risk ≤ 70): Conservative entry, base allocation
Level 2 (Risk ≤ 50): Increased allocation, strong opportunity
Level 3 (Risk ≤ 30): Maximum allocation, extreme undervaluation
Continuous buying: Executes every bar while below threshold for true DCA behavior
Cumulative sizing: L3 triggers = L1 + L2 + L3 amounts combined
📈 Smart Profit Management
Sequential selling: Must complete L1 before L2, L2 before L3
Percentage-based exits: Sell portions of position, not fixed amounts
Auto-reset on re-entry: New buy signals reset sell progression
Prevents premature full exits during volatile conditions
🤖 3Commas Automation
Pre-configured JSON webhooks for Custom Signal Bots
Multi-exchange support: Binance, Coinbase, Kraken, Bitfinex, Bybit
Flexible quote currency: USD, USDT, or BUSD
Dynamic order sizing: Automatically adjusts to your tier thresholds
Full webhook documentation compliance
🎨 Multi-Asset Support
Pre-configured for popular altcoins:
ETH (Ethereum)
SOL (Solana)
ADA (Cardano)
LINK (Chainlink)
UNI (Uniswap)
XRP (Ripple)
DOGE
RENDER
Custom option for any other crypto
How It Works
Risk Metric Calculation (0-100 scale):
Fetches weekly Alt/BTC price data for stability
Calculates RSI, MACD, and deviation from 150-period MA
Normalizes MACD to 0-100 range using 500-bar lookback
Combines weighted components: (MACD × 0.05) + (RSI × 0.60) + (Deviation × 0.35)
Applies 5-period EMA smoothing for cleaner signals
Color-Coded Risk Zones:
Green (0-30): Extreme buying opportunity - Alt heavily oversold vs BTC
Lime/Yellow (30-70): Accumulation range - favorable risk/reward
Orange (70-85): Caution zone - consider taking initial profits
Red/Maroon (85-100+): Euphoria zone - aggressive profit-taking
Entry Logic:
Buys execute every candle when risk is below threshold
As risk decreases, position sizing automatically scales up
Example: If risk drops from 60→25, you'll be buying at L1 rate until it hits 50, then L2 rate, then L3 rate
Exit Logic:
Sells only trigger when in profit AND risk exceeds thresholds
Sequential execution ensures partial profit-taking
If new buy signal occurs before all sells complete, sell levels reset to L1
Configuration Guide
Choosing Your Altcoin:
Select crypto from dropdown (or use CUSTOM for unlisted coins)
Pick your exchange
Choose quote currency (USD, USDT, BUSD)
Risk Metric Tuning:
Long Term MA (default 150): Higher = more extreme signals, Lower = more frequent
RSI Length (default 10): Lower = more volatile, Higher = smoother
Smoothing (default 5): Increase for less noise, decrease for faster reaction
Buy Settings (Aggressive DCA Example):
L1 Threshold: 70 | Amount: $5
L2 Threshold: 50 | Amount: $6
L3 Threshold: 30 | Amount: $7
Total L3 buy = $18 per candle when deeply oversold
Sell Settings (Balanced Exit Example):
L1: 70 threshold, 25% position
L2: 85 threshold, 35% position
L3: 100 threshold, 40% position (final exit)
3Commas Setup
Bot Configuration:
Create Custom Signal Bot in 3Commas
Set trading pair to your altcoin/USD (e.g., ETH/USD, SOL/USDT)
Order size: Select "Send in webhook, quote" to use strategy's dollar amounts
Copy Bot UUID and Secret Token
Script Configuration:
Paste credentials into 3Commas section inputs
Check "Enable 3Commas Alerts"
Save and apply to chart
TradingView Alert:
Create Alert → Condition: "alert() function calls only"
Webhook URL: api.3commas.io
Enable "Webhook URL" checkbox
Expiration: Open-ended
Strategy Advantages
✅ Outperform Bitcoin: Designed specifically to beat BTC by timing alt rotations
✅ Capture Alt Seasons: Automatically accumulates when alts lag, sells when they pump
✅ Risk-Adjusted Sizing: Buys more when cheaper (better risk/reward)
✅ Emotional Discipline: Systematic approach removes fear and FOMO
✅ Multi-Asset: Run same strategy across multiple altcoins simultaneously
✅ Proven Indicators: Combines RSI, MACD, and MA deviation - battle-tested tools
Backtesting Insights
Optimal Timeframes:
Daily chart: Best for backtesting and signal generation
Weekly data is fetched internally regardless of display timeframe
Historical Performance Characteristics:
Accumulates heavily during bear markets and BTC dominance periods
Captures explosive altcoin rallies when BTC stagnates
Sequential selling preserves capital during extended downtrends
Works best on established altcoins with multi-year history
Risk Considerations:
Requires capital reserves for extended accumulation periods
Some altcoins may never recover if fundamentals deteriorate
Past correlation patterns may not predict future performance
Always size positions according to personal risk tolerance
Visual Interface
Indicator Panel Displays:
Dynamic color line: Green→Lime→Yellow→Orange→Red as risk increases
Horizontal threshold lines: Dashed lines mark your buy/sell levels
Entry/Exit labels: Green labels for buys, Orange/Red/Maroon for sells
Real-time risk value: Numerical display on price scale
Customization:
All threshold lines are adjustable via inputs
Color scheme clearly differentiates buy zones (green spectrum) from sell zones (red spectrum)
Line weights emphasize most extreme thresholds (L3 buy and L3 sell)
Strategy Philosophy
This strategy is built on the principle that altcoins move in cycles relative to Bitcoin. During Bitcoin rallies, alts often bleed against BTC (high sell, accumulate). When Bitcoin consolidates, alts pump (take profits). By measuring risk on the Alt/BTC chart instead of USD price, we time these rotations with precision.
The 3-tier system ensures you're always averaging in at better prices and scaling out at better prices, maximizing your Bitcoin-denominated returns.
Advanced Tips
Multi-Bot Strategy:
Run this on 5-10 different altcoins simultaneously to:
Diversify correlation risk
Capture whichever alt is pumping
Smooth equity curve through rotation
Pairing with BTC Strategy:
Use alongside the BTC DCA Risk Strategy for complete portfolio coverage:
BTC strategy for core holdings
ALT strategies for alpha generation
Rebalance between them based on BTC dominance
Threshold Calibration:
Check 2-3 years of historical data for your chosen alt
Note where risk metric sat during major bottoms (set buy thresholds)
Note where it peaked during euphoria (set sell thresholds)
Adjust for your risk tolerance and holding period
Credits
Strategy Development & 3Commas Integration: Claude AI (Anthropic)
Technical Analysis Framework: RSI, MACD, Moving Average theory
Implementation: pommesUNDwurst
Disclaimer
This strategy is for educational purposes only. Cryptocurrency trading involves substantial risk of loss. Altcoins are especially volatile and many fail completely. The strategy assumes liquid markets and reliable Alt/BTC price data. Always do your own research, understand the fundamentals of any asset you trade, and never risk more than you can afford to lose. Past performance does not guarantee future results. The authors are not financial advisors and assume no liability for trading decisions.
Additional Warning: Using leverage or trading illiquid altcoins amplifies risk significantly. This strategy is designed for spot trading of established cryptocurrencies with deep liquidity.
Tags: Altcoin, Alt/BTC, DCA, Risk Metric, Dollar Cost Averaging, 3Commas, ETH, SOL, Crypto Rotation, Bitcoin Correlation, Automated Trading, Alt Season
Feel free to modify any sections to better match your style or add specific backtesting results you've observed! 🚀Claude is AI and can make mistakes. Please double-check responses. Sonnet 4.5

BTC DCA Risk Metric StrategyBTC DCA Risk Strategy - Automated Dollar Cost Averaging with 3Commas Integration
Overview
This strategy combines the proven Oakley Wood Risk Metric with an intelligent tiered Dollar Cost Averaging (DCA) system, designed to help traders systematically accumulate Bitcoin during periods of low risk and take profits during high-risk conditions.
Key Features
📊 Multi-Component Risk Assessment
4-Year SMA Deviation: Measures Bitcoin's distance from its long-term mean
20-Week MA Analysis: Tracks medium-term momentum shifts
50-Day/50-Week MA Ratio: Captures short-to-medium term trend strength
All metrics are normalized by time to account for Bitcoin's maturing market dynamics
💰 3-Tier DCA Buy System
Level 1 (Low Risk): Conservative entry with base allocation
Level 2 (Lower Risk): Increased allocation as opportunity improves
Level 3 (Extreme Low Risk): Maximum allocation during rare buying opportunities
Buys execute every bar while risk remains below thresholds, enabling true DCA accumulation
📈 Progressive Profit Taking
Sell Level 1: Take initial profits as risk increases
Sell Level 2: Scale out further positions during elevated risk
Sell Level 3: Final exit during extreme market conditions
Sell levels automatically reset when new buy signals occur, allowing flexible re-entry
🤖 3Commas Integration
Fully automated webhook alerts for Custom Signal Bots
JSON payloads formatted per 3Commas API specifications
Supports multiple exchanges (Binance, Coinbase, Kraken, Gemini, Bybit)
Configurable quote currency (USD, USDT, BUSD)
How It Works
The strategy calculates a composite risk metric (0-1 scale):
0.0-0.2: Extreme buying opportunity (green zone)
0.2-0.5: Favorable accumulation range (yellow zone)
0.5-0.8: Neutral to cautious territory (orange zone)
0.8-1.0+: High risk, profit-taking zone (red zone)
Buy Logic: As risk decreases, position sizes increase automatically. If risk drops from L1 to L3 threshold, the strategy combines all three tier allocations for maximum exposure.
Sell Logic: Sequential profit-taking ensures you capture gains progressively. The system won't advance to Sell L2 until L1 completes, preventing premature full exits.
Configuration
Risk Metric Parameters:
All calculations use Bitcoin price data (any BTC chart works)
Time-normalized formulas adapt to market maturity
No manual parameter tuning required
Buy Settings:
Set risk thresholds for each tier (default: 0.20, 0.10, 0.00)
Define dollar amounts per tier (default: $10, $15, $20)
Fully customizable to your risk tolerance and capital
Sell Settings:
Configure risk thresholds for profit-taking (default: 1.00, 1.50, 2.00)
Set percentage of position to sell at each level (default: 25%, 35%, 40%)
3Commas Setup:
Create a Custom Signal Bot in 3Commas
Copy Bot UUID and Secret Token into strategy inputs
Enable 3Commas Alerts checkbox
Create TradingView alert: Condition → "alert() function calls only", Webhook → api.3commas.io
Backtesting Results
Strengths:
Systematically buys dips without emotion
Averages down during extended bear markets
Captures explosive bull run profits through tiered exits
Pyramiding (1000 max orders) allows true DCA behavior
Considerations:
Requires sufficient capital for multiple buys during prolonged downtrends
Backtest on Daily timeframe for most reliable signals
Past performance does not guarantee future results
Visual Design
The indicator pane displays:
Color-coded risk metric line: Changes from white→red→orange→yellow→green as risk decreases
Background zones: Green (buy), yellow (hold), red (sell) areas
Dashed threshold lines: Clear visual markers for each buy/sell level
Entry/Exit labels: Green buy labels and orange/red sell labels mark all trades
Credits
Original Risk Metric: Oakley Wood
Strategy Development & 3Commas Integration: Claude AI (Anthropic)
Modifications: pommesUNDwurst
Disclaimer
This strategy is for educational and informational purposes only. Cryptocurrency trading carries substantial risk of loss. Always conduct your own research and never invest more than you can afford to lose. The authors are not financial advisors and assume no responsibility for trading decisions made using this tool.

VWolf – Hulk StrikeOVERVIEW
VWolf – Hullk Strike is a dynamic trend-following strategy designed to capture pullbacks within established moves. It combines a configurable Moving Average (HULL, EMA, SMA, or DEMA) trend filter with DMI/ADX confirmation and a Stochastic RSI timing trigger. Risk is managed through ATR- or Supertrend-based stops, optional partial profit-taking, and automatic stop adjustments. The strategy aims to rejoin momentum after controlled retracements while maintaining consistent, quantified risk
RECOMMENDED USE
Markets: Liquid indices, major FX pairs, large-cap equities, high-liquidity crypto pairs.
Timeframes: M15 to D1 (stricter filters for lower timeframes, looser for higher).
Profiles: Traders seeking structured trend participation with systematic timing.
Strengths
Highly flexible trend engine adaptable to multiple markets.
Dual confirmation reduces false signals during pullbacks.
Risk-first design with multiple stop models and partial exits.
Precautions
Over-filtering may reduce trade frequency and miss fast continuations.
Under-filtering may increase whipsaw risk in choppy markets.
Backtest vs forward-test differences if date/session filters are inconsistent.
CONCLUSION
VWolf – Hullk Strike is designed to capture the “second leg” of a trend after a controlled retracement. With configurable MA strictness, DMI/ADX strength filters, and precise Stoch RSI timing, it enhances selectivity while keeping responsiveness. Its stop/target framework—anchored stops, proportional targets, partial exits, and dynamic stop moves—offers disciplined risk control and upside preservation.
FOR MORE INFORMATION VISIT vwolftrading.com

VWolf – EquinoxOVERVIEW
The VWolf – Equinox strategy integrates multiple technical filters, skew deviation logic, and advanced momentum indicators to identify high-probability trend continuation and reversal setups. Built upon the Vumanchu framework, this strategy applies filters such as EMA, DEMA, Supertrend, QQE, ADX/DMI, and customized skew thresholds. It combines these with divergence detection, volatility conditions, and risk-managed trade execution for dynamic adaptability across market conditions.
Its architecture is designed to provide flexibility for both backtesting and forward testing periods, while allowing traders to fine-tune entry confirmations and risk management tools based on their preferred market or timeframe.
RECOMMENDED USE
Markets: Forex, equities, and potentially crypto markets due to skew/volatility adaptability.
Timeframes: Works best on intraday (15m–1H) and swing-trading (4H–1D) horizons.
Trader Profile: Suited for intermediate to advanced traders who value multiple confirmation layers and dynamic risk management.
Strengths:
Robust filter system reduces false signals.
Flexible exit strategies with dynamic profit-taking.
Adaptability across different assets and timeframes.
Precautions:
Complexity may overwhelm beginners; careful parameter tuning is recommended.
Too many active filters can reduce signal frequency, potentially missing opportunities.
Divergence and skew thresholds require calibration to each market’s volatility regime.
CONCLUSION
The VWolf – Equinox stands out as one of the most comprehensive strategies in the VWolf library, combining skew deviation with a wide array of technical filters. Its layered confirmation system reduces noise and improves reliability across volatile markets. While powerful, its effectiveness depends on thoughtful parameter selection and disciplined risk management. This makes it a strong candidate for experienced traders seeking depth, adaptability, and dynamic trade control.
FOR MORE INFORMATION VISIT vwolftrading.com

specific breakout FiFTOStrategy Description: 10:14 Breakout Only
Overview This is a time-based intraday trading strategy designed to capture momentum bursts that occur specifically after the 10:14 AM candle closes. It operates on the logic that if price breaks the high of this specific candle within a short window, a trend continuation is likely.
Core Logic & Rules
The Setup Candle (10:14 AM)
The strategy waits specifically for the minute candle at 10:14 to complete.
Once this candle closes, the strategy records its High price.
Defining the Entry Level
It calculates a trigger price by taking the 10:14 High and adding a user-defined Buffer (e.g., +1 point).
Formula: Entry Level = 10:14 High + Buffer
The "Active Window" (Expiry)
The trade setup does not remain open all day. It has a strict time limit.
By default, the setup is valid from 10:15 to 10:20.
If the price does not break the Entry Level by the expiry time (default 10:20), the setup is cancelled and no trade is taken for the day.
Entry Trigger
If a candle closes above the Entry Level while the window is open, a Long (Buy) position is opened immediately.
Exits (Risk Management)
Stop Loss: A fixed number of points below the entry price.
Target: A fixed number of points above the entry price.
Visual & Automation Features
Visual Boxes: Upon entry, the strategy draws a "Long Position" style visual on the chart. A green box highlights the profit zone, and a red box highlights the loss zone. These boxes extend automatically until the trade closes.
JSON Alerts: The strategy is pre-configured to send data-rich alerts for automation (e.g., Telegram bots).
Entry Alert: Includes Symbol, Entry Price, SL, and TP.
Exit Alerts: Specific messages for "Target Hit" or "SL Hit".
Summary of User Inputs
Entry Buffer: Extra points added to the high to filter false breaks.
Fixed Stop Loss: Risk per trade in points.
Fixed Target: Reward per trade in points.
Expiry Minute: The minute (10:xx) at which the setup becomes invalid if not triggered.
