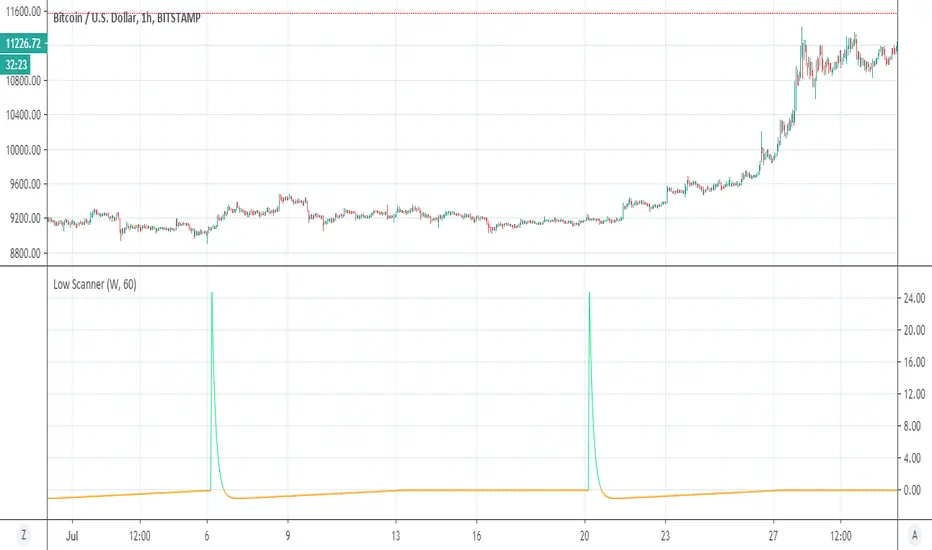
Low ScannerThis is example of how to detect low using special volume rsi
i use the idea invented by Duyck
how to use MTF without using security
when ever it cross zero it a low or buy signal
I think it nice system to detect lows
not always perfect but it accurate most of the times I am still searching system for high:)
so green is act as buy sign as well
the nice thing here is no security:)
forex
ابحث في النصوص البرمجية عن "mtf"
Bar Balance [LucF]Bar Balance extracts the number of up, down and neutral intrabars contained in each chart bar, revealing information on the strength of price movement. It can display stacked columns representing raw up/down/neutral intrabar counts, or an up/down balance line which can be calculated and visualized in many different ways.
WARNING: This is an analysis tool that works on historical bars only. It does not show any realtime information, and thus cannot be used to issue alerts or for automated trading. When realtime bars elapse, the indicator will require a browser refresh, a change to its Inputs or to the chart's timeframe/symbol to recalculate and display information on those elapsed bars. Once a trader understands this, the indicator can be used advantageously to make discretionary trading decisions.
Traders used to work with my Delta Volume Columns Pro will feel right at home in this indicator's Inputs . It has lots of options, allowing it to be used in many different ways. If you value the bar balance information this indicator mines, I hope you will find the time required to master the use of Bar Balance well worth the investment.
█ OVERVIEW
The indicator has two modes: Columns and Line .
Columns
• In Columns mode you can display stacked Up/Down/Neutral columns.
• The "Up" section represents the count of intrabars where `close > open`, "Down" where `close < open` and "Neutral" where `close = open`.
• The Up section always appears above the centerline, the Down section below. The Neutral section overlaps the centerline, split halfway above and below it.
The Up and Down sections start where the Neutral section ends, when there is one.
• The Up and Down sections can be colored independently using 7 different methods.
• The signal line plotted in Line mode can also be displayed in Columns mode.
Line
• Displays a single balance line using a zero centerline.
• A variable number of independent methods can be used to calculate the line (6), determine its color (5), and color the fill (5).
You can thus evaluate the state of 3 different components with this single line.
• A "Divergence Levels" feature will use the line to automatically draw expanding levels on divergence events.
Features available in both modes
• The color of all components can be selected from 15 base colors, with 16 gradient levels used for each base color in the indicator's gradients.
• A zero line can show a 6-state aggregate value of the three main volume balance modes.
• The background can be colored using any of 5 different methods.
• Chart bars can be colored using 5 different methods.
• Divergence and large neutral count ratio events can be shown in either Columns or Line mode, calculated in one of 4 different methods.
• Markers on 6 different conditions can be displayed.
█ CONCEPTS
Intrabar inspection
Intrabar inspection means the indicator looks at lower timeframe bars ( intrabars ) making up a given chart bar to gather its information. If your chart is on a 1-hour timeframe and the intrabar resolution determined by the indicator is 5 minutes, then 12 intrabars will be analyzed for each chart bar and the count of up/down/neutral intrabars among those will be tallied.
Bar Balances and calculation methods
The indicator uses a variety of methods to evaluate bar balance and to derive other calculations from them:
1. Balance on Bar : Uses the relative importance of instant Up and Down counts on the bar.
2. Balance Averages : Uses the difference between the EMAs of Up and Down counts.
3. Balance Momentum : Starts by calculating, separately for both Up and Down counts, the difference between the same EMAs used in Balance Averages and an SMA of double the period used for the EMAs. These differences are then aggregated and finally, a bounded momentum of that aggregate is calculated using RSI.
4. Markers Bias : It sums the bull/bear occurrences of the four previous markers over a user-defined period (the default is 14).
5. Combined Balances : This is the aggregate of the instant bull/bear bias of the three main bar balances.
6. Dual Up/Down Averages : This is a display mode showing the EMA calculated for each of the Up and Down counts.
Interpretation of neutral intrabars
What do neutral intrabars mean? When price does not change during a bar, it can be because there is simply no interest in the market, or because of a perfect balance between buyers and sellers. The latter being more improbable, Bar Balance assumes that neutral bars reveal a lack of interest, which entails uncertainty. That is the reason why the option is provided to interpret ratios of neutral intrabars greater than 50% as divergences. It is also the rationale behind the option to dampen signal lines on the inverse ratio of neutral intrabars, so that zero intrabars do not affect the signal, and progressively larger proportions of neutral intrabars will reduce the signal's amplitude, as the balance calcs using the up/down counts lose significance. The impact of the dampening will vary with markets. Weaker markets such as cryptos will often contain greater numbers of neutral intrabars, so dampening the Line in that sector will have a greater impact than in more liquid markets.
█ FEATURES
1 — Columns
• While the size of the Up/Down columns always represents their respective importance on the bar, their coloring mode is independent. The default setup uses a standard coloring mode where the Up/Down columns over/under the zero line are always in the bull/bear color with a higher intensity for the winning side. Six other coloring modes allow you to pack more information in the columns. When choosing to color the top columns using a bull/bear gradient on Balance Averages, for example, you will end up with bull/bear colored tops. In order for the color of the bottom columns to continue to show the instant bar balance, you can then choose the "Up/Down Ratio on Bar — Dual Solid Colors" coloring mode to make those bars the color of the winning side for that bar.
• Line mode shows only the line, but Columns mode allows displaying the line along with it. If the scale of the line is different than that of the scale of the columns, the line will often appear flat. Traders may find even a flat line useful as its bull/bear colors will be easily distinguishable.
2 — Line
• The default setup for Line mode uses a calculation on "Balance Momentum", with a fill on the longer-term "Balance Averages" and a line color based on the "Markers Bias". With the background set on "Line vs Divergence Levels" and the zero line on the hard-coded "Combined Bar Balances", you have access to five distinct sources of information at a glance, to which you can add divergences, divergences levels and chart bar coloring. This provides powerful potential in displaying bar balance information.
• When no columns are displayed, Line mode can show the full scale of whichever line you choose to calculate because the columns' scale no longer interferes with the line's scale.
• Note that when "Balance on Bar" is selected, the Neutral count is also displayed as a ratio of the balance line. This is the only instance where the Neutral count is displayed in Line mode.
• The "Dual Up/Down Averages" is an exception as it displays two lines: one average for the Up counts and another for the Down counts. This mode will be most useful when Columns are also displayed, as it provides a reference for the top and bottom columns.
3 — Zero Line
The zero line can be colored using two methods, both based on the Combined Balances, i.e., the aggregate of the instant bull/bear bias of the three main bar balances.
• In "Six-state Dual Color Gradient" mode, a dot appears on every bar. Its color reflects the bull/bear state of the Combined Balances, and the dot's brightness reflects the tally of balance biases.
• In "Dual Solid Colors (All Bull/All Bear Only)" a dot only appears when all three balances are either bullish or bearish. The resulting pattern is identical to that of Marker 1.
4 — Divergences
• Divergences are displayed as a small circle at the top of the scale. Four different types of divergence events can be detected. Divergences occur whenever the bull/bear bias of the method used diverges with the bar's price direction.
• An option allows you to include in divergence events instances where the count of neutral intrabars exceeds 50% of the total intrabar count.
• The divergence levels are dynamic levels that automatically build from the line's values on divergence events. On consecutive divergences, the levels will expand, creating a channel. This implementation of the divergence levels corresponds to my view that divergences indicate anomalies, hesitations, points of uncertainty if you will. It excludes any association of a pre-determined bullish/bearish bias to divergences. Accordingly, the levels merely take note of divergence events and mark those points in time with levels. Traders then have a reference point from which they can evaluate further movement. The bull/bear/neutral colors used to plot the levels are also congruent with this view in that they are determined by price's position relative to the levels, which is how I think divergences can be put to the most effective use.
5 — Background
• The background can show a bull/bear gradient on four different calculations. You can adjust its brightness to make its visual importance proportional to how you use it in your analysis.
6 — Chart bars
• Chart bars can be colored using five different methods.
• You have the option of emptying the body of bars where volume does not increase, as does my TLD indicator, the idea behind this being that movement on bars where volume does not increase is less relevant.
7 — Intrabar Resolution
You can choose between three modes. Two of them are automatic and one is manual:
a) Fast, Longer history, Auto-Steps (~12 intrabars) : Optimized for speed and deeper history. Uses an average minimum of 12 intrabars.
b) More Precise, Shorter History Auto-Steps (~24 intrabars) : Uses finer intrabar resolution. It is slower and provides less history. Uses an average minimum of 24 intrabars.
c) Fixed : Uses the fixed resolution of your choice.
Auto-Steps calculations vary for 24/7 and conventional markets in order to achieve the proper target of minimum intrabars.
You can choose to view the intrabar resolution currently used to calculate delta volume. It is the default.
The proper selection of the intrabar resolution is important. It must achieve maximal granularity to produce precise results while not unduly slowing down calculations, or worse, causing runtime errors.
8 — Markers
Six markers are available:
1. Combined Balances Agreement : All three Bar Balances are either bullish or bearish.
2. Up or Down % Agrees With Bar : An up marker will appear when the percentage of up intrabars in an up chart bar is greater than the specified percentage. Conditions mirror to down bars.
3. Divergence confirmations By Price : One of the four types of balance calculations can be used to detect divergences with price. Confirmations occur when the bar following the divergence confirms the balance bias. Note that the divergence events used here do not include neutral intrabar events.
4. Balance Transitions : Bull/bear transitions of the selected balance.
5. Markers Bias Transitions : Bull/bear transitions of the Markers Bias.
6. Divergence Confirmations By Line : Marks points where the line first breaches a divergence level.
Markers appear when the condition is detected, without delay. Since nothing is plotted in realtime, markers do not appear on the realtime bar.
9 — Settings
• Two modes can be selected to dampen the line on the ratio of neutral intrabars.
• A distinct weight can be attributed to the count of the latter half of intrabars, on the assumption that later intrabars may be more important in determining the outcome of chart bars.
• Allows control over the periods of the different moving averages used in calculations.
• The default periods used for the various calculations define the following hierarchy from slow to fast:
Balance Averages: 50,
Balance Momentum: 20,
Dual Up/Down Averages: 20,
Marker Bias: 10.
█ LIMITATIONS
• This script uses a special characteristic of the `security()` function allowing the inspection of intrabars—which is not officially supported by TradingView.
• The method used does not work on the realtime bar—only on historical bars.
• The indicator only works on some chart resolutions: 3, 5, 10, 15 and 30 minutes, 1, 2, 4, 6, and 12 hours, 1 day, 1 week and 1 month. The script’s code can be modified to run on other resolutions, but chart resolutions must be divisible by the lower resolution used for intrabars and the stepping mechanism could require adaptation.
• When using the "Line vs Divergence Levels — Dual Color Gradient" color mode to fill the line, background or chart bars, keep in mind that a line calculation mode must be defined for it to work, as it determines gradients on the movement of the line relative to divergence levels. If the line is hidden, it will not work.
• When the difference between the chart’s resolution and the intrabar resolution is too great, runtime errors will occur. The Auto-Steps selection mechanisms should avoid this.
• Alerts do not work reliably when `security()` is used at intrabar resolutions. Accordingly, no alerts are configured in the indicator.
• The color model used in the indicator provides for fancy visuals that come at a price; when you change values in Inputs , it can take 20 seconds for the changes to materialize. Luckily, once your color setup is complete, the color model does not have a large performance impact, as in normal operation the `security()` calls will become the most important factor in determining response time. Also, once in a while a runtime error will occur when you change inputs. Just making another change will usually bring the indicator back up.
█ RAMBLINGS
Is this thing useful?
I'll let you decide. Bar Balance acts somewhat like an X-Ray on bars. The intrabars it analyzes are no secret; one can simply change the chart's resolution to see the same intrabars the indicator uses. What the indicator brings to traders is the precise count of up/down/neutral intrabars and, more importantly, the calculations it derives from them to present the information in a way that can make it easier to use in trading decisions.
How reliable is Bar Balance information?
By the same token that an up bar does not guarantee that more up bars will follow, future price movements cannot be inferred from the mere count of up/down/neutral intrabars. Price movement during any chart bar for which, let's say, 12 intrabars are analyzed, could be due to only one of those intrabars. One can thus easily see how only relying on bar balance information could be very misleading. The rationale behind Bar Balance is that when the information mined for multiple chart bars is aggregated, it can provide insight into the history behind chart bars, and thus some bias as to the strength of movements. An up chart bar where 11/12 intrabars are also up is assumed to be stronger than the same up bar where only 2/12 intrabars are up. This logic is not bulletproof, and sometimes Bar Balance will stray. Also, keep in mind that balance lines do not represent price momentum as RSI would. Bar Balance calculations have no idea where price is. Their perspective, like that of any historian, is very limited, constrained that it is to the narrow universe of up/down/neutral intrabar counts. You will thus see instances where price is moving up while Balance Momentum, for example, is moving down. When Bar Balance performs as intended, this indicates that the rally is weakening, which does necessarily imply that price will reverse. Occasionally, price will merrily continue to advance on weakening strength.
Divergences
Most of the divergence detection methods used here rely on a difference between the bias of a calculation involving a multi-bar average and a given bar's price direction. When using "Bar Balance on Bar" however, only the bar's balance and price movement are used. This is the default mode.
As usual, divergences are points of interest because they reveal imbalances, which may or may not become turning points. I do not share the overwhelming enthusiasm traders have for the purported ability of bullish/bearish divergences to indicate imminent reversals.
Superfluity
In "The Bed of Procrustes", Nassim Nicholas Taleb writes: To bankrupt a fool, give him information . Bar Balance can display lots of information. While learning to use a new indicator inevitably requires an adaptation period where we put it through its paces and try out all its options, once you have become used to Bar Balance and decide to adopt it, rigorously eliminate the components you don't use and configure the remaining ones so their visual prominence reflects their relative importance in your analysis. I tried to provide flexible options for traders to control this indicator's visuals for that exact reason—not for window dressing.
█ NOTES
For traders
• To avoid misleading traders who don't read script descriptions, the indicator shows nothing in the realtime bar.
• The Data Window shows key values for the indicator.
• All gradients used in this indicator determine their brightness intensities using advances/declines in the signal—not their relative position in a fixed scale.
• Note that because of the way gradients are optimized internally, changing their brightness will sometimes require bringing down the value a few steps before you see an impact.
• Because this indicator does not use volume, it will work on all markets.
For coders
• For those interested in gradients, this script uses an advanced version of the Advance/Decline gradient function from the PineCoders Color Gradient (16 colors) Framework . It allows more precise control over the range, steps and min/max values of the gradients.
• I use the PineCoders Coding Conventions for Pine to write my scripts.
• I used functions modified from the PineCoders MTF Selection Framework for the selection of timeframes.
█ THANKS TO:
— alexgrover who helped me think through the dampening method used to attenuate signal lines on high ratios of neutral intrabars.
— A guy called Kuan who commented on a Backtest Rookies presentation of their Volume Profile indicator . The technique I use to inspect intrabars is derived from Kuan's code.
— theheirophant , my partner in the exploration of the sometimes weird abysses of `security()`’s behavior at intrabar resolutions.
— midtownsk8rguy , my brilliant companion in mining the depths of Pine graphics. He is also the co-author of the PineCoders Color Gradient Frameworks .

Delta Volume Columns Pro [LucF]█ OVERVIEW
This indicator displays volume delta information calculated with intrabar inspection on historical bars, and feed updates when running in realtime. It is designed to run in a pane and can display either stacked buy/sell volume columns or a signal line which can be calculated and displayed in many different ways.
Five different models are offered to reveal different characteristics of the calculated volume delta information. Many options are offered to visualize the calculations, giving you much leeway in morphing the indicator's visuals to suit your needs. If you value delta volume information, I hope you will find the time required to master Delta Volume Columns Pro well worth the investment. I am confident that if you combine a proper understanding of the indicator's information with an intimate knowledge of the volume idiosyncrasies on the markets you trade, you can extract useful market intelligence using this tool.
█ WARNINGS
1. The indicator only works on markets where volume information is available,
Please validate that your symbol's feed carries volume information before asking me why the indicator doesn't plot values.
2. When you refresh your chart or re-execute the script on the chart, the indicator will repaint because elapsed realtime bars will then recalculate as historical bars.
3. Because the indicator uses different modes of calculation on historical and realtime bars, it's critical that you understand the differences between them. Details are provided further down.
4. Calculations using intrabar inspection on historical bars can only be done from some chart timeframes. See further down for a list of supported timeframes.
If the chart's timeframe is not supported, no historical volume delta will display.
█ CONCEPTS
Chart bars
Three different types of bars are used in charts:
1. Historical bars are bars that have already closed when the script executes on them.
2. The realtime bar is the current, incomplete bar where a script is running on an open market. There is only one active realtime bar on your chart at any given time.
The realtime bar is where alerts trigger.
3. Elapsed realtime bars are bars that were calculated when they were realtime bars but have since closed.
When a script re-executes on a chart because the browser tab is refreshed or some of its inputs are changed, elapsed realtime bars are recalculated as historical bars.
Why does this indicator use two modes of calculation?
Historical bars on TradingView charts contain OHLCV data only, which is insufficient to calculate volume delta on them with any level of precision. To mine more detailed information from those bars we look at intrabars , i.e., bars from a smaller timeframe (we call it the intrabar timeframe ) that are contained in one chart bar. If your chart Is running at 1D on a 24x7 market for example, most 1D chart bars will contain 24 underlying 1H bars in their dilation. On historical bars, this indicator looks at those intrabars to amass volume delta information. If the intrabar is up, its volume goes in the Buy bin, and inversely for the Sell bin. When price does not move on an intrabar, the polarity of the last known movement is used to determine in which bin its volume goes.
In realtime, we have access to price and volume change for each update of the chart. Because a 1D chart bar can be updated tens of thousands of times during the day, volume delta calculations on those updates is much more precise. This precision, however, comes at a price:
— The script must be running on the chart for it to keep calculating in realtime.
— If you refresh your chart you will lose all accumulated realtime calculations on elapsed realtime bars, and the realtime bar.
Elapsed realtime bars will recalculate as historical bars, i.e., using intrabar inspection, and the realtime bar's calculations will reset.
When the script recalculates elapsed realtime bars as historical bars, the values on those bars will change, which means the script repaints in those conditions.
— When the indicator first calculates on a chart containing an incomplete realtime bar, it will count ALL the existing volume on the bar as Buy or Sell volume,
depending on the polarity of the bar at that point. This will skew calculations for that first bar. Scripts have no access to the history of a realtime bar's previous updates,
and intrabar inspection cannot be used on realtime bars, so this is the only to go about this.
— Even if alerts only trigger upon confirmation of their conditions after the realtime bar closes, they are repainting alerts
because they would perhaps not have calculated the same way using intrabar inspection.
— On markets like stocks that often have different EOD and intraday feeds and volume information,
the volume's scale may not be the same for the realtime bar if your chart is at 1D, for example,
and the indicator is using an intraday timeframe to calculate on historical bars.
— Any chart timeframe can be used in realtime mode, but plots that include moving averages in their calculations may require many elapsed realtime bars before they can calculate.
You might prefer drastically reducing the periods of the moving averages, or using the volume columns mode, which displays instant values, instead of the line.
Volume Delta Balances
This indicator uses a variety of methods to evaluate five volume delta balances and derive other values from those balances. The five balances are:
1 — On Bar Balance : This is the only balance using instant values; it is simply the subtraction of the Sell volume from the Buy volume on the bar.
2 — Average Balance : Calculates a distinct EMA for both the Buy and Sell volumes, and subtracts the Sell EMA from the Buy EMA.
3 — Momentum Balance : Starts by calculating, separately for both Buy and Sell volumes, the difference between the same EMAs used in "Average Balance" and
an SMA of double the period used for the "Average Balance" EMAs. The difference for the Sell side is subtracted from the difference for the Buy side,
and an RSI of that value is calculated and brought over the −50/+50 scale.
4 — Relative Balance : The reference values used in the calculation are the Buy and Sell EMAs used in the "Average Balance".
From those, we calculate two intermediate values using how much the instant Buy and Sell volumes on the bar exceed their respective EMA — but with a twist.
If the bar's Buy volume does not exceed the EMA of Buy volume, a zero value is used. The same goes for the Sell volume with the EMA of Sell volume.
Once we have our two intermediate values for the Buy and Sell volumes exceeding their respective MA, we subtract them. The final "Relative Balance" value is an ALMA of that subtraction.
The rationale behind using zero values when the bar's Buy/Sell volume does not exceed its EMA is to only take into account the more significant volume.
If both instant volume values exceed their MA, then the difference between the two is the signal's value.
The signal is called "relative" because the intermediate values are the difference between the instant Buy/Sell volumes and their respective MA.
This balance flatlines when the bar's Buy/Sell volumes do not exceed their EMAs, which makes it useful to spot areas where trader interest dwindles, such as consolidations.
The smaller the period of the final value's ALMA, the more easily you will see the balance flatline. These flat zones should be considered no-trade zones.
5 — Percent Balance : This balance is the ALMA of the ratio of the "On Bar Balance" value, i.e., the volume delta balance on the bar (which can be positive or negative),
over the total volume for that bar.
From the balances and marker conditions, two more values are calculated:
1 — Marker Bias : It sums the up/down (+1/‒1) occurrences of the markers 1 to 4 over a period you define, so it ranges from −4 to +4, times the period.
Its calculation will depend on the modes used to calculate markers 3 and 4.
2 — Combined Balances : This is the sum of the bull/bear (+1/−1) states of each of the five balances, so it ranges from −5 to +5.
█ FEATURES
The indicator has two main modes of operation: Columns and Line .
Columns
• In Columns mode you can display stacked Buy/Sell volume columns.
• The buy section always appears above the centerline, the sell section below.
• The top and bottom sections can be colored independently using eight different methods.
• The EMAs of the Buy/Sell values can be displayed (these are the same EMAs used to calculate the "Average Balance").
Line
• Displays one of seven signals: the five balances or one of two complementary values, i.e., the "Marker Bias" or the "Combined Balances".
• You can color the line and its fill using independent calculation modes to pack more information in the display.
You can thus appraise the state of 3 different values using the line itself, its color and the color of its fill.
• A "Divergence Levels" feature will use the line to automatically draw expanding levels on divergence events.
Default settings
Using the indicator's default settings, this is the information displayed:
• The line is calculated on the "Average Balance".
• The line's color is determined by the bull/bear state of the "Percent Balance".
• The line's fill gradient is determined by the advances/declines of the "Momentum Balance".
• The orange divergence dots are calculated using discrepancies between the polarity of the "On Bar Balance" and the chart's bar.
• The divergence levels are determined using the line's level when a divergence occurs.
• The background's fill gradient is calculated on advances/declines of the "Marker Bias".
• The chart bars are colored using advances/declines of the "Relative Balance". Divergences are shown in orange.
• The intrabar timeframe is automatically determined from the chart's timeframe so that a minimum of 50 intrabars are used to calculate volume delta on historical bars.
Alerts
The configuration of the marker conditions explained further is what determines the conditions that will trigger alerts created from this script. Note that simply selecting the display of markers does not create alerts. To create an alert on this script, you must use ALT-A from the chart. You can create multiple alerts triggering on different conditions from this same script; simply configure the markers so they define the trigger conditions for each alert before creating the alert. The configuration of the script's inputs is saved with the alert, so from then on you can change them without affecting the alert. Alert messages will mention the marker(s) that triggered the specific alert event. Keep in mind, when creating alerts on small chart timeframes, that discrepancies between alert triggers and markers displayed on your chart are to be expected. This is because the alert and your chart are running two distinct instances of the indicator on different servers and different feeds. Also keep in mind that while alerts only trigger on confirmed conditions, they are calculated using realtime calculation mode, which entails that if you refresh your chart and elapsed realtime bars recalculate as historical bars using intrabar inspection, markers will not appear in the same places they appeared in realtime. So it's important to understand that even though the alert conditions are confirmed when they trigger, these alerts will repaint.
Let's go through the sections of the script's inputs.
Columns
The size of the Buy/Sell columns always represents their respective importance on the bar, but the coloring mode for tops and bottoms is independent. The default setup uses a standard coloring mode where the Buy/Sell columns are always in the bull/bear color with a higher intensity for the winning side. Seven other coloring modes allow you to pack more information in the columns. When choosing to color the top columns using a bull/bear gradient on "Average Balance", for example, you will have bull/bear colored tops. In order for the color of the bottom columns to continue to show the instant bar balance, you can then choose the "On Bar Balance — Dual Solid Colors" coloring mode to make those bars the color of the winning side for that bar. You can display the averages of the Buy and Sell columns. If you do, its coloring is controlled through the "Line" and "Line fill" sections below.
Line and Line fill
You can select the calculation mode and the thickness of the line, and independent calculations to determine the line's color and fill.
Zero Line
The zero line can display dots when all five balances are bull/bear.
Divergences
You first select the detection mode. Divergences occur whenever the up/down direction of the signal does not match the up/down polarity of the bar. Divergences are used in three components of the indicator's visuals: the orange dot, colored chart bars, and to calculate the divergence levels on the line. The divergence levels are dynamic levels that automatically build from the line's values on divergence events. On consecutive divergences, the levels will expand, creating a channel. This implementation of the divergence levels corresponds to my view that divergences indicate anomalies, hesitations, points of uncertainty if you will. It precludes any attempt to identify a directional bias to divergences. Accordingly, the levels merely take note of divergence events and mark those points in time with levels. Traders then have a reference point from which they can evaluate further movement. The bull/bear/neutral colors used to plot the levels are also congruent with this view in that they are determined by the line's position relative to the levels, which is how I think divergences can be put to the most effective use. One of the coloring modes for the line's fill uses advances/declines in the line after divergence events.
Background
The background can show a bull/bear gradient on six different calculations. As with other gradients, you can adjust its brightness to make its importance proportional to how you use it in your analysis.
Chart bars
Chart bars can be colored using seven different methods. You have the option of emptying the body of bars where volume does not increase, as does my TLD indicator, and you can choose whether you want to show divergences.
Intrabar Timeframe
This is the intrabar timeframe that will be used to calculate volume delta using intrabar inspection on historical bars. You can choose between four modes. The three "Auto-steps" modes calculate, from the chart's timeframe, the intrabar timeframe where the said number of intrabars will make up the dilation of chart bars. Adjustments are made for non-24x7 markets. "Fixed" mode allows you to select the intrabar timeframe you want. Checking the "Show TF" box will display in the lower-right corner the intrabar timeframe used at any given moment. The proper selection of the intrabar timeframe is important. It must achieve maximal granularity to produce precise results while not unduly slowing down calculations, or worse, causing runtime errors. Note that historical depth will vary with the intrabar timeframe. The smaller the timeframe, the shallower historical plots you will be.
Markers
Markers appear when the required condition has been confirmed on a closed bar. The configuration of the markers when you create an alert is what determines when the alert will trigger. Five markers are available:
• Balances Agreement : All five balances are either bullish or bearish.
• Double Bumps : A double bump is two consecutive up/down bars with +/‒ volume delta, and rising Buy/Sell volume above its average.
• Divergence confirmations : A divergence is confirmed up/down when the chosen balance is up/down on the previous bar when that bar was down/up, and this bar is up/down.
• Balance Shifts : These are bull/bear transitions of the selected signal.
• Marker Bias Shifts : Marker bias shifts occur when it crosses into bull/bear territory.
Periods
Allows control over the periods of the different moving averages used to calculate the balances.
Volume Discrepancies
Stock exchanges do not report the same volume for intraday and daily (or higher) resolutions. Other variations in how volume information is reported can also occur in other markets, namely Forex, where volume irregularities can even occur between different intraday timeframes. This will cause discrepancies between the total volume on the bar at the chart's timeframe, and the total volume calculated by adding the volume of the intrabars in that bar's dilation. This does not necessarily invalidate the volume delta information calculated from intrabars, but it tells us that we are using partial volume data. A mechanism to detect chart vs intrabar timeframe volume discrepancies is provided. It allows you to define a threshold percentage above which the background will indicate a difference has been detected.
Other Settings
You can control here the display of the gray dot reminder on realtime bars, and the display of error messages if you are using a chart timeframe that is not greater than the fixed intrabar timeframe, when you use that mode. Disabling the message can be useful if you only use realtime mode at chart timeframes that do not support intrabar inspection.
█ RAMBLINGS
On Volume Delta
Volume is arguably the best complement to interpret price action, and I consider volume delta to be the most effective way of processing volume information. In periods of low-volatility price consolidations, volume will typically also be lower than normal, but slight imbalances in the trend of the buy/sell volume balance can sometimes help put early odds on the direction of the break from consolidation. Additionally, the progression of the volume imbalance can help determine the proximity of the breakout. I also find volume delta and the number of divergences very useful to evaluate the strength of trends. In trends, I am looking for "slow and steady", i.e., relatively low volatility and pauses where price action doesn't look like world affairs are being reassessed. In my personal mythology, this type of trend is often more resilient than high-volatility breakouts, especially when volume balance confirms the general agreement of traders signaled by the low-volatility usually accompanying this type of trend. The volume action on pauses will often help me decide between aggressively taking profits, tightening a stop or going for a longer-term movement. As for reversals, they generally occur in high-volatility areas where entering trades is more expensive and riskier. While the identification of counter-trend reversals fascinates many traders to no end, they represent poor opportunities in my view. Volume imbalances often precede reversals, but I prefer to use volume delta information to identify the areas following reversals where I can confirm them and make relatively low-cost entries with better odds.
On "Buy/Sell" Volume
Buying or selling volume are misnomers, as every unit of volume transacted is both bought and sold by two different traders. While this does not keep me from using the terms, there is no such thing as “buy only” or “sell only” volume. Trader lingo is riddled with peculiarities.
Divergences
The divergence detection method used here relies on a difference between the direction of a signal and the polarity (up/down) of a chart bar. When using the default "On Bar Balance" to detect divergences, however, only the bar's volume delta is used. You may wonder how there can be divergences between buying/selling volume information and price movement on one bar. This will sometimes be due to the calculation's shortcomings, but divergences may also occur in instances where because of order book structure, it takes less volume to increase the price of an asset than it takes to decrease it. As usual, divergences are points of interest because they reveal imbalances, which may or may not become turning points. To your pattern-hungry brain, the divergences displayed by this indicator will — as they do on other indicators — appear to often indicate turnarounds. My opinion is that reality is generally quite sobering and I have no reliable information that would tend to prove otherwise. Exercise caution when using them. Consequently, I do not share the overwhelming enthusiasm of traders in identifying bullish/bearish divergences. For me, the best course of action when a divergence occurs is to wait and see what happens from there. That is the rationale underlying how my divergence levels work; they take note of a signal's level when a divergence occurs, and it's the signal's behavior from that point on that determines if the post-divergence action is bullish/bearish.
Superfluity
In "The Bed of Procrustes", Nassim Nicholas Taleb writes: To bankrupt a fool, give him information . This indicator can display lots of information. While learning to use a new indicator inevitably requires an adaptation period where we put it through its paces and try out all its options, once you have become used to it and decide to adopt it, rigorously eliminate the components you don't use and configure the remaining ones so their visual prominence reflects their relative importance in your analysis. I tried to provide flexible options for traders to control this indicator's visuals for that exact reason — not for window dressing.
█ LIMITATIONS
• This script uses a special characteristic of the `security()` function allowing the inspection of intrabars — which is not officially supported by TradingView.
It has the advantage of permitting a more robust calculation of volume delta than other methods on historical bars, but also has its limits.
• Intrabar inspection only works on some chart timeframes: 3, 5, 10, 15 and 30 minutes, 1, 2, 3, 4, 6, and 12 hours, 1 day, 1 week and 1 month.
The script’s code can be modified to run on other resolutions.
• When the difference between the chart’s timeframe and the intrabar timeframe is too great, runtime errors will occur. The Auto-Steps selection mechanisms should avoid this.
• All volume is not created equally. Its source, components, quality and reliability will vary considerably with sectors and instruments.
The higher the quality, the more reliably volume delta information can be used to guide your decisions.
You should make it your responsibility to understand the volume information provided in the data feeds you use. It will help you make the most of volume delta.
█ NOTES
For traders
• The Data Window shows key values for the indicator.
• While this indicator displays some of the same information calculated in my Delta Volume Columns ,
I have elected to make it a separate publication so that traders continue to have a simpler alternative available to them. Both code bases will continue to evolve separately.
• All gradients used in this indicator determine their brightness intensities using advances/declines in the signal—not their relative position in a pre-determined scale.
• Volume delta being relative, by nature, it is particularly well-suited to Forex markets, as it filters out quite elegantly the cyclical volume data characterizing the sector.
If you are interested in volume delta, consider having a look at my other "Delta Volume" indicators:
• Delta Volume Realtime Action displays realtime volume delta and tick information on the chart.
• Delta Volume Candles builds volume delta candles on the chart.
• Delta Volume Columns is a simpler version of this indicator.
For coders
• I use the `f_c_gradientRelativePro()` from the PineCoders Color Gradient Framework to build my gradients.
This function has the advantage of allowing begin/end colors for both the bull and bear colors. It also allows us to define the number of steps allowed for each gradient.
I use this to modulate the gradients so they perform optimally on the combination of the signal used to calculate advances/declines,
but also the nature of the visual component the gradient applies to. I use fewer steps for choppy signals and when the gradient is used on discrete visual components
such as volume columns or chart bars.
• I use the PineCoders Coding Conventions for Pine to write my scripts.
• I used functions modified from the PineCoders MTF Selection Framework for the selection of timeframes.
█ THANKS TO:
— The devs from TradingView's Pine and other teams, and the PineCoders who collaborate with them. They are doing amazing work,
and much of what this indicator does could not be done without their recent improvements to Pine.
— A guy called Kuan who commented on a Backtest Rookies presentation of their Volume Profile indicator using a `for` loop.
This indicator started from the intrabar inspection technique illustrated in Kuan's snippet.
— theheirophant , my partner in the exploration of the sometimes weird abysses of `security()`’s behavior at intrabar timeframes.
— midtownsk8rguy , my brilliant companion in mining the depths of Pine graphics.

ATA v4 StrategyAta strategy is include 3 different time frame = MTF
2 different moving average =MA
Oversold/overbought for relative strength index =RSI
Strategy exit for trailing stop loss %2 =TSL
MTF like 1 day, 4h and 5 min, between 2 moving averages like fibo numbers 21 and 34. Also strategy test for oversold up to 60 and overbought under the 25 with RSI. Stratefy exit include trailing stop loss %2 persantage for max. gain. It was created by XMAXPRO. This system is open to development.

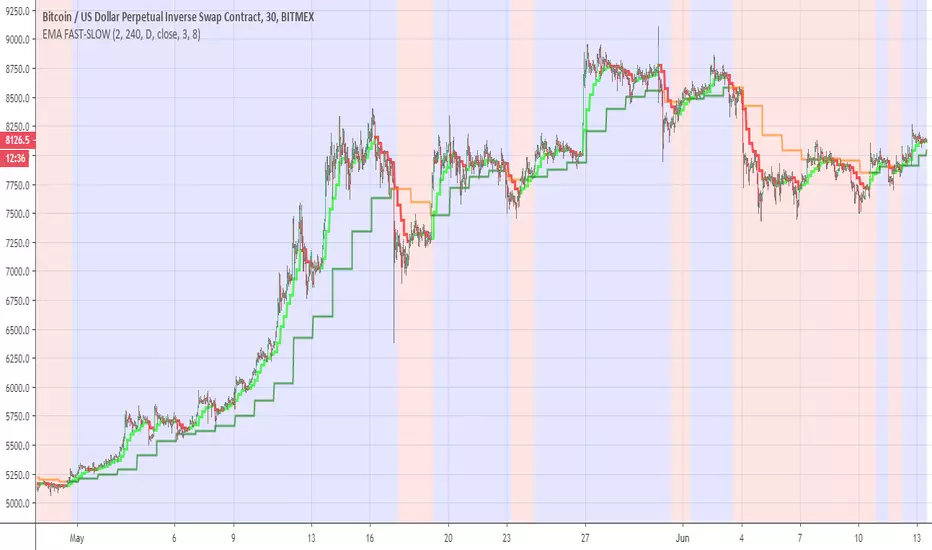
EMA FAST-SLOWThis indicator has the following
ema fast (length 3 and 8 ) based on 240 min
ema slow (length 3 and 8 ) based on daily MTF
The reason for the two length in each EMA is to give us the the insight of shorter trend in larger trend
so the large trend is when ema fast 240 min is above the daily ema slow this is shown in the bullish or bearish zones
the smaler trend for each MTF is shown in different color (lime:red) for ema fast 240 min , and (green:orange) for the slow daily EMA
when we this setting on smaller time frame so it more easy to see where the asset is going this the basic idea
you can change the setting as you wish in oreder to find the best one for your time frame
Crypto Indicators #u9tusA set of low timeframe (LTF), medium timeframe (MTF), and high timeframe (HTF) indicators for use in crypto currencies / bitcoin.
Traditionally the 10, 20, 50, 100, and 200 SMAs are used in TA. With cryptos, I've found that the 8 EMA, 21, 55, and 128 SMAs backtest better, while no change in length was necessary for the 200. I wanted to combine all these into one indicator to easily add them to a chart layout, hence this script.
You can customize the length of each MA to your liking in the settings, or accept the defaults.
LTF Indicators:
8 EMA in blue hues, medium line stroke.
MTF Indicators:
21, 55 SMA in purple hues, medium line stroke.
HTF Indicators:
128, 200 SMA in yellow hues, thick line stroke.
Defaults are for daily timeframes and lower; suggest changing up the intervals for weekly and monthly to:
21 -> 30
55 -> 50
128 -> 100
$BTC, $ETH, #ALTS
twitter.com
(c) @jhaurawachsman 20190515

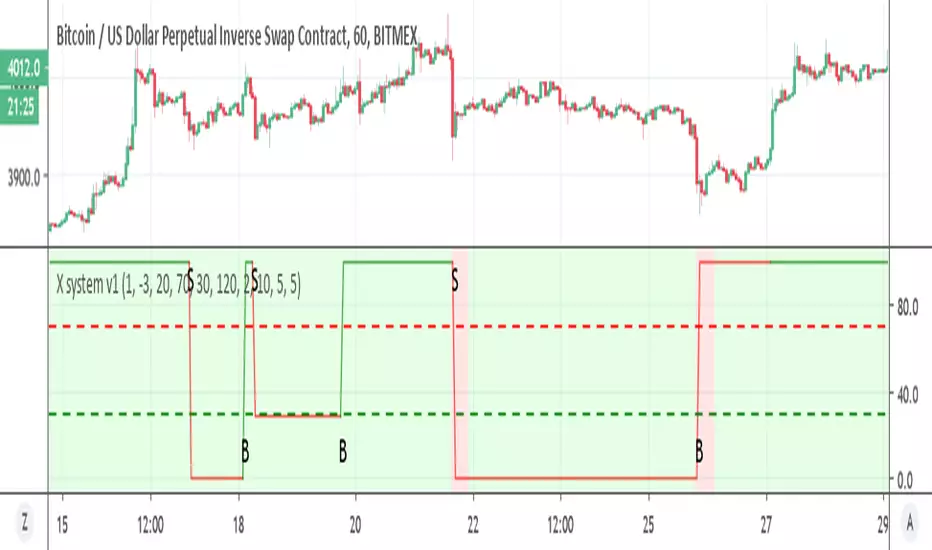
X system v1Similar to X system but here I use the super trend with MTF function
the sell option depend on the % channel sell seen in red as bearish rule (so both need to agree)
the buy option depend only on the MTF which is set on 2 hour on 1 hour candles. you can try to modify if you want shorter times to see if it better
if you want it sell more just remove the and bearish rule from t green for buy in the code
try to make it better and I hope it can help you :)
Donochian CCISo this indicator have the following:
1. MTF CCI
2. donochian channel MTF both non repaint mode
buliish and bearish zone determine by ratio of the the donochian cahnnel
enter or exit can be either the bullish or bearish change of color or by cross over or under of the CCI
or combination of both
The high max and low max of the donochian channel show in hilated bar

Donochian zonesThis indicator give the ratio between the high and low of donochian channel and if we take ratio and add it to each other then we can calculate if it + meaning bullish trend or negative meaning bearish trend
using non repainting MTF we can see the zone of the channel at different time set
we can use this indicator to filter bad signal or make it stand alone
here example of amazon stock with 360 min mtf over one hour graph
here facebook 240min over 15 min graph

linreg-areas (like fib system just more accurate) So this system is a different approach to form a daily fib like system.
Its based on linear regression and its slope , we calculate the slope of the line and we put it in MTF format that is without security and non repainting (int2=1440 min)
As you in graph the coin in this case BTC has cycle from low to high similar to the fibs system.
the lowest level is bellow -0.2 , next level is -0.1 ,0,0.1 and above 0.2 is consider the highest
with this system its easy to find the highs and the lows as the coin go between the levels either up or down like the fibs system.
one can use this together with fibs system in order to make analysis more accurate.
also it easy to set signals once the slope go between levels either up or down . another advantage for this system compare to fibs system is the ability to reduce the MTF to lower frame let say 4 hour or even less and then by the same logic to create system of high and lows to the most smaller frames (but if you do that you need in code to change the levels setting numbers so it fit the best )
follow the direction of the slope and you will find the road that you wish:))

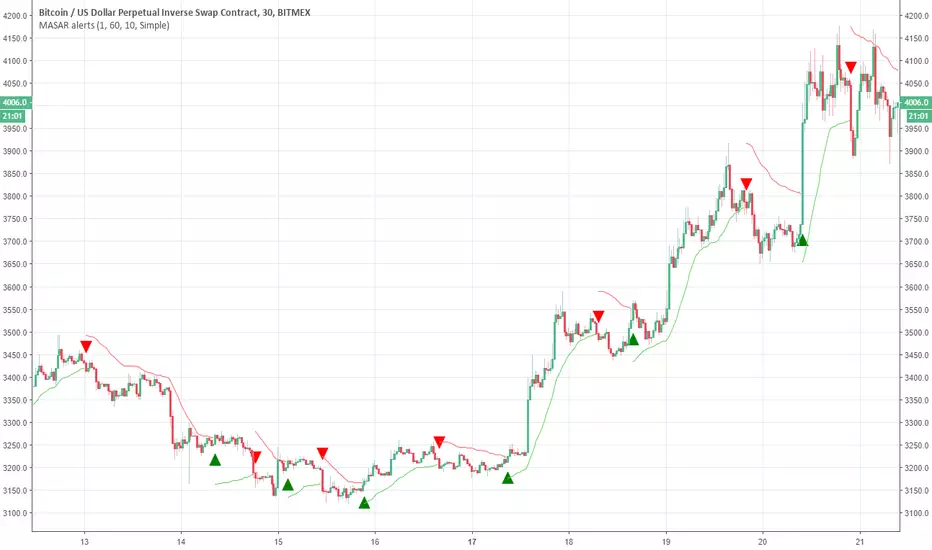
Moving Average Stop and Reverse alertsNothing fancy here , the main study is this one
so all credit to him. I change the MTF settings (int2 is contol of that ) and adds alerts
So in basic its a better SAR with MTF function
DEMARSIV1 alerts and take profitThis version is the same as DEMARSI with following differences
I add take profit to short and long when DEMA MTF 1 is crossing DEMA MTF 2 (they are calculated different that why when you increase int2 in min to longer time the difference between them increse)
if you want the TP to be on signal of fast and slow DEMA RSI 2 (just change the code inside) by putting the long cond to be as the buy cond
for any questions please ask

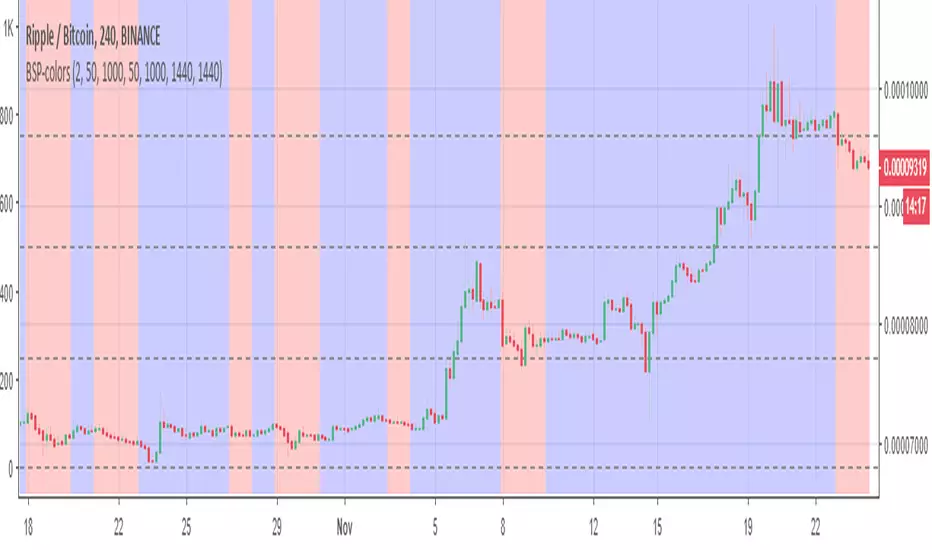
BSP-colorsIts MTF of the BSP model. here i need to warn you that this model can repaint. so I did not create any signals to it. On the other hand since its design for this mistake. you can use it to see the bullish or bearish zones in easy way.
So the basic idea here is to see the zones of buy and sell of weis model in mTF format.
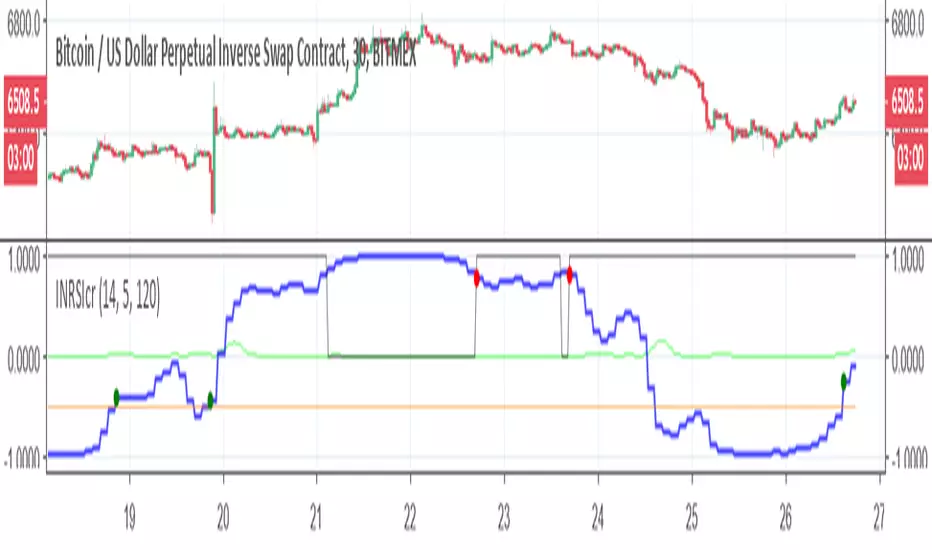
Inverse Fisher-rsi-crudeSo this is a crude version just to show the idea. I use the code of capissoimo, www.tradingview.com
together with my older code and I just change few things. in next version I will try make it more correct, but this is just to show the idea of the MTF reverse fisher RSI
this is setting for 30 min graph with MTF of 120 min
so have fun
Gomoku_V2I tried to improve the one - step equilibrium table.
Since the original glance consisted of the middle line of the Hiroo band, something is calculated from the upper and lower lines.
Leading span A = Double the width of the HiLo band (Green 2) * (1-75 (≒ 76.4% return)), the central complex clouds only changed the expression at a glance.
It is unified to shift all lines at first glance by 25. The old lagging span was renamed to the preceding price span.
You can use the first line of conversion line and reference line with the combination of the preceding conversion line, the preceding reference line and the preceding price span.
The part surrounded by the preceding conversion line and the preceding reference line is defined as rain cloud.
The leading span B is the interpretation of the rain cloud and the effective value of the cloud.
(the width of the reference line and the leading span A) ÷ The width of the rain cloud is like the intensity of the cloud.
Rain clouds have the same properties as clouds, and the twisted parts are weak.
When the type of cloud and rain cloud are different, it is countervailing and resistance seems to be weak.
Even when the width of the leading span A and the leading reference line is narrow, the resistance seems to be weak.
It seems there are clouds above and below as well because it was the motivation for development so there are two clouds each above and below. The clouds are five (although it is actually six) so it is the fifth grade.
It should normally be bounced back in the green zone.
There is a red zone for abnormal price fluctuations.
It seems that the upper and lower clouds only bounce back toward the center.
If you are not satisfied with price movements overall it seems that you are in the range market, often breaking through for the passage of time.
Update Ver 2.0
integrate MTF amagumo
Devices of color arrangement
The resistance is strong where the cloud color is thin.
It should be weak as the force is canceled as much as it is black.
Batch display option for each part
Specealthanks
Ichimoku kinkou hyou
KazmaxFAN Club # Place for technical discussion
一目均衡表を改良してみました。
元の一目はハイローバンドの中線から構成されていたので、上下の線から何かを算出しています。
先行スパンA=ハイローバンドの幅の2倍(Green2)*(1-75(≒76.4%戻し)) という発見により、中央の複雑な雲は一目の表現を変えるだけにしました。
一目の線は全て25前にずらすのに統一です。旧遅行スパンは先行価格スパンに改名しました。
先行転換線と先行基準線と先行価格スパンの組み合わせで一目の転換線と基準線の使い方が出来ます。
先行転換線と先行基準線で囲まれた部分は雨雲と定義。
先行スパンBは雨雲と雲の実効値という解釈です。
(基準線と先行スパンAの幅)÷雨雲の幅が雲の強度という感じです。
雨雲も雲と同じ性質を持っていて、ねじれた部分は弱いぽいです。
雲と雨雲の種類が異なる時は打ち消しあって抵抗が弱いようです。
先行スパンAと先行基準線の幅が狭い時も抵抗が弱いようです。
上下にも雲があるように思えたのが開発の動機だったので上下に各2本雲があります。雲が5本(本当は6本ですが)だから五目です。
通常はグリーンゾーンで跳ね返されるはずです。
異常な価格変動用にレッドゾーンがあります。
上下の雲は中央に向けて跳ね返すくらいしかしないようです。
全体的に価格移動に困ればレンジ相場になって、時間の経過で強行突破することが多いように見えます。
Update Ver2.0
MTF amagumoを統合
配色を工夫
雲の色が薄い所は抵抗が強いです。
黒い所ほど力が打ち消しあって弱いはずです。
各パーツごとに一括表示オプション
Specealthanks
一目均衡表
KazmaxFAN倶楽部 #テクニカル議論の場

Fractal - VA (Dynamic Wicks)This indicator, which we’ve developed as the Frectal - VA (Multi-Timeframe Visual Analytics), is designed for traders who utilize multi-timeframe analysis but want to keep their main chart clean of overlapping candles.
It functions as a Projected Dashboard, pulling price action from a higher timeframe (HTF) and rendering it as a set of dynamic, solid objects in the right-hand margin of your chart.
Core Philosophy
The "Frectal - VA" is built on the principle of Nested Structure. In professional trading, the "Value Area" or the "Fractal" of a higher timeframe often dictates the trend of the lower timeframe. By projecting these candles into the future (the right side of the chart), you can monitor HTF trend shifts, volatility, and candle closes without the HTF candles obscuring your current "live" price action.
Key Components
Decoupled Visualization: Unlike standard MTF indicators that overlay large boxes behind your current bars, this indicator creates a side-by-side comparison in the chart's whitespace.
Real-Time Data Streaming: It doesn't just show historical candles; the "lead" candle in the dashboard updates with every tick of the current price, showing you exactly how the higher timeframe candle is forming.
Dynamic Color Sync: The body, border, and wick of each projected candle are linked. If a 1-hour candle flips from bullish to bearish on a 5-minute chart, the entire dashboard object changes color instantly.
Customizable Offset: You control the "Drop" (Vertical Offset) and the "Margin" (Horizontal Offset). This allows you to tuck the indicator into a corner of your screen as a heads-up display (HUD).
Strategic Use Cases
Trend Confirmation: If you are trading a 1-minute "scalp" but the 15-minute dashboard shows a solid, large-bodied bearish candle, you are alerted to trade with the HTF momentum.
Volatility Monitoring: By observing the size of the wicks in the dashboard, you can see if the higher timeframe is experiencing "rejection" at certain levels, even if your local timeframe looks like a steady trend.
Visual Backtesting: Because it maintains a queue of the last
X
candles, you can see the immediate history of the HTF structure (e.g., a "Morning Star" pattern or "Engulfing" candles) at a glance.
Technical Specifications
Pine Script Version: v6 (latest standard).
Drawing Engine: Uses box and line arrays for high-performance rendering that doesn't lag the UI.
Memory Management: Automatically deletes old objects to stay within TradingView’s script limits, ensuring stability during long trading sessions.

RSI: Evolved [DAFE]RSI: Evolved : The Ultimate Momentum Intelligence Engine
30+ RSI Engines. 15+ Zero-Lag Smoothers. The Revolutionary Quantum Horizon. This is Not Just an RSI. This is the Evolution of Momentum.
█ PHILOSOPHY: BEYOND THE OSCILLATOR, INTO THE NEXUS
The standard Relative Strength Index is a relic. It is a brilliant, timeless concept trapped in a rigid, one-dimensional formula developed in the 1970s. It assumes all market momentum is uniform, that all volatility is equal, and that a single mathematical lens is sufficient to view the infinitely complex character of modern markets. It is not.
RSI: Evolved was not created to be another RSI. It was engineered to be the definitive evolution of momentum analysis. This is not an indicator; it is a powerful, interactive research environment. It is a laboratory where you, the trader, can move beyond the static "one-size-fits-all" approach and forge a momentum oscillator that is perfectly adapted to the unique physics of your market, timeframe, and trading style.
This suite deconstructs the very DNA of the RSI, rebuilding it with a library of over 30 distinct, mathematically diverse calculation engines . From timeless classics and exotic variations to proprietary DAFE quantum models, this suite provides an unparalleled arsenal for quantifying the unseen forces of market momentum.
█ THE EVOLUTION: WHAT MAKES THIS UNLIKE ANY OTHER RSI?
This is not just a collection of features; it is a seamlessly integrated, multi-layered analytical system. It stands in a class of its own for several key reasons:
The 30+ Algorithm Core: At its heart is a library of over 30 unique RSI calculation engines. You can now choose an engine based on its mathematical properties—whether you need the zero-lag responsiveness of a Hull RSI, the time-warping capability of a Laguerre RSI, or the predictive power of a DAFE Quantum Fusion RSI.
Advanced Post-Processing: After the RSI is calculated, it passes through a multi-stage refinement process. First, choose from over 15+ professional-grade smoothing algorithms to create a crystal-clear signal. Then, activate the intelligent Filter Module to scale the RSI's output based on trend, volatility, or momentum regimes.
The Quantum Horizon & Temporal Wave: This is a revolutionary leap in data visualization. The indicator projects the historical momentum waves from higher timeframes directly onto your main price chart as a futuristic, holographic overlay. You can now see the alignment (or divergence) of macro momentum without ever looking away from price action. This is multi-timeframe analysis evolved into an art form.
Dynamic, Volatility-Adaptive Zones: Static 70/30 levels are obsolete. Evolved's "Quantum Zones" are alive; they "breathe" with market volatility. They automatically widen during powerful trends to keep you in a winning trade and tighten during choppy consolidation to help you catch reversals with greater precision.
Comprehensive Analytical Modules: This is a full suite of institutional-grade tools, including a powerful regular and hidden Divergence Engine , a multi-timeframe Consensus Dashboard , and dynamic RSI Bands (Bollinger, Keltner, etc.) plotted directly on the oscillator.
█ THE QUANTUM HORIZON & TEMPORAL WAVE: SEEING MOMENTUM IN 4D
This groundbreaking feature fundamentally changes how you interact with multi-timeframe momentum data. The Quantum Horizon is a dedicated visualization module that projects up to three "Temporal Waves" directly onto your main price chart. Each wave is a historical representation of a momentum oscillator (RSI, MFI, or Stoch RSI) pulled from a higher timeframe of your choice. Instead of flipping between charts or cluttering your screen with multiple indicators, you get an immediate, intuitive, and aesthetically stunning view of the market's complete momentum structure.
Each Temporal Wave is a self-contained universe, rendered as a glowing, flowing line within its own gridded channel. This channel is not just for show; it represents the 0-100 scale of the oscillator, with key 30, 50, and 70 levels marked for reference. You can see the history of momentum, its peaks, its troughs, and its crossovers with its own signal line. This allows you to visually identify macro divergences, trend alignment, and exhaustion points on your primary trading chart, transforming your analysis from a fragmented process into a single, unified experience. This is no longer just an indicator; it is a true Heads-Up Display for the flow of time and momentum.
█ THE ARSENAL: A DEEP DIVE INTO THE RSI & SMOOTHING ENGINES
This is your library of mathematical DNA. Understanding your tools is the first step to mastery. The 30+ RSI types are grouped into distinct families, each with a unique philosophy.
THE RSI ENGINE FAMILIES
The Classics (Wilder's, Cutler's, EMA, WMA): These are the foundational building blocks of momentum analysis. They provide a reliable, time-tested baseline. Wilder's uses the RMA for a unique smoothing characteristic, while Cutler's uses the SMA for a more direct, arithmetic average of gains and losses. The EMA and WMA versions offer increased responsiveness by weighting recent price action more heavily.
The Low-Lag Warriors (DEMA, TEMA, Hull, ZLEMA): This family is engineered specifically to combat the inherent lag of classical averages. The Double and Triple EMA (DEMA, TEMA) use a composite of multiple EMAs to reduce latency. The Zero-Lag EMA (ZLEMA) attempts to remove lag by adjusting the source price with its own past data. The Hull RSI is a standout, using a weighted moving average calculation to achieve a remarkable balance of extreme smoothness and near-zero lag, making it ideal for scalping.
The Exotics (Laguerre, Connors, Fisher, KAMA): These engines employ advanced mathematical concepts to view momentum through a different lens. The Laguerre RSI , based on John Ehlers' work, uses a time-warping, non-linear filter that can be extremely responsive to changes in trend. The Fisher Transform RSI normalizes the output to a Gaussian distribution, making peaks and troughs sharper and more defined for clearer signals. The KAMA Adaptive RSI is a "smart" algorithm that automatically slows its calculation in choppy markets and speeds it up in strong trends.
The Volume-Based (Volume-Weighted, MFI, VWAP-Weighted): This family infuses price momentum with volume data, providing a measure of conviction. They answer not just "how fast is price moving?" but "how much participation is behind the move?". The Money Flow RSI (MFI) is a classic, while the Volume-Weighted and VWAP-Weighted versions directly incorporate volume into the gain/loss calculation, giving more weight to high-volume bars.
The DAFE Proprietary Engines (The "God Mode" Algos): The crown jewels of the Laboratory, these are custom-built, proprietary algorithms you will not find anywhere else.
DAFE Quantum Fusion: This engine calculates RSI on three harmonic timeframes simultaneously (based on the Golden Ratio) and "superimposes" them using a dynamic weighting system based on volume and momentum confidence. It is the most robust and balanced all-rounder.
DAFE Kinetic Energy: Based on the physics principle that Momentum = Mass × Velocity. Standard RSI only sees Velocity (price change). Kinetic RSI weights every price move by Relative Volume (Mass), measuring the true "force" of the market.
DAFE Spectral: This engine uses concepts from Digital Signal Processing to analyze the frequency of price moves. It automatically differentiates between the "Signal" (the underlying trend) and the "Noise" (the chop), and adapts its calculation speed accordingly.
DAFE Entropy Flow: A unique engine that uses Information Theory to measure market "disorder." In chaotic, high-entropy markets, it automatically dampens its own signal to avoid whipsaws. In orderly, low-entropy trends, it sharpens its signal to be more responsive.
THE POST-SMOOTHING FILTERS
After your primary RSI is calculated, you can pass it through one of over 15 advanced filters for unparalleled clarity.
Low-Lag (Hull, DEMA, TEMA): Ideal for responsive smoothing that tracks the raw RSI closely.
Adaptive (KAMA, VIDYA): Perfect for smart, regime-aware smoothing that is slow in chop and fast in trends.
DSP & Scientific (SuperSmoother, Butterworth, Gaussian, Jurik-Style): The pinnacle of signal processing. These filters provide the absolute cleanest signal with minimal lag, leveraging advanced digital signal processing techniques to surgically remove noise.
█ THE ANALYTICAL MODULES: BEYOND THE LINE
Dynamic Zones: Your overbought/oversold levels (e.g., 70/30) are no longer static lines. They are living, breathing zones that respond to market volatility. They automatically widen during powerful, high-volatility trends to prevent you from selling a strong uptrend too early. Conversely, they tighten during low-volatility consolidation, allowing you to catch smaller, mean-reverting moves with greater precision. This is a crucial evolution for trading in modern, dynamic markets.
Divergence Engine: The automated engine works tirelessly in the background to detect critical disconnects between price and momentum. It automatically identifies and plots both Regular Divergences (which often signal major trend reversals) and Hidden Divergences (which often signal trend continuations after a pullback) with clear on-chart and in-pane markers and lines.
MTF Dashboard: Context is everything. This module provides an instant read on the momentum across three higher timeframes of your choice. The "Consensus" reading tells you if all timeframes are aligned ("ALL BULL" or "ALL BEAR"), providing powerful contextual confirmation for your trades and helping you avoid taking signals that go against the macro flow.
RSI Bands: This module applies a full-fledged band methodology (Bollinger Bands, Keltner Channels, etc.) directly to the RSI line itself. A pierce of the upper or lower band is a powerful sign of a statistical extreme, often preceding a sharp reversion back to the mean. A "squeeze" in the RSI bands often precedes an explosive move in momentum.
Signal Line & Histogram: The fast-moving RSI line is paired with a slower, smoother Signal Line of your choice. Crossovers between these two lines can be used as effective entry/exit triggers that are often more reliable than simple overbought/oversold levels. The histogram visually represents the momentum (the velocity and acceleration) of the RSI itself, turning from light to dark green in a strengthening uptrend, for example.
█ DEVELOPMENT PHILOSOPHY
RSI: Evolved was forged from a single, guiding principle: momentum is not a fixed property; it is a dynamic, multi-faceted force with a unique character in every market. This tool was designed for the trader who is no longer satisfied with a one-size-fits-all indicator. It is for the analyst, the tinkerer, the scientist—the individual who seeks to deconstruct, understand, and master the hidden physics of market momentum. This is a tool for forging your own alpha, not just following a lagging line.
RSI: Evolved is designed to give you that patience and discipline, providing a crystal-clear, multi-dimensional view of momentum so you can act with precision when the perfect setup finally arrives.
█ DISCLAIMER AND BEST PRACTICES
THIS IS AN ADVANCED ANALYTICAL TOOL: This indicator provides intelligence on momentum, not financial advice. It should be used as a core component of a complete trading strategy.
RISK MANAGEMENT IS PARAMOUNT: All trading involves substantial risk. Never risk more capital than you are prepared to lose.
START WITH A ROBUST BASE: The "DAFE Quantum Fusion" engine with the "SuperSmoother" is an exceptionally powerful and well-balanced starting point for most markets.
USE CONFLUENCE: The highest probability signals occur when multiple modules agree. For example: a Regular Bullish Divergence, as the RSI crosses up from an Extreme Oversold Dynamic Zone, while the Quantum Horizon shows the higher timeframes are also starting to turn up.
"The hard part is not making the decision to buy or sell, but having the patience and discipline to wait for the right setup."
— Mark Weinstein
Taking you to school. - Dskyz, Trade with Anticipation. Trade with Strength. Trade with RSI: Evolved

Directional Movement Index + MTF TableHey guys, just sharing a modified DMI-ADX indicator. The main addition is the Multi-Timeframe functionality, which helps filter out noise by showing higher TF trends. Credits to TradingView for the original source code. Hope you find it useful!

Custom Dividers [louis]Custom Dividers is a streamlined utility designed for Multi-Timeframe Analysis (MTF). It allows you to visualize higher timeframe structures directly on lower timeframe charts by drawing infinite vertical lines at the open of new periods.
Unlike standard grid lines and other divider indicators, this has custom inputs, giving you complete control over non-standard timeframes (e.g., 90-minute cycles, 6-hour blocks, or 2-day periods).
🔑 Key Features
- 4 Independent Timeframe Slots: Configure up to four different vertical dividers simultaneously.
- Custom Minute Inputs (TF 1 & TF 2): Instead of restricting you to a dropdown, the first two slots allow you to input any integer for minutes.
Example: Set 90 for 90-minute cycle dividers.
Example: Set 360 for 6-hour dividers.
- Standard Timeframe Selectors (TF 3 & TF 4): Traditional dropdowns for standard periods like Daily (D), Weekly (W), or Monthly (M).
- Visual Customization:
Lines: Uses line.new() drawing logic to ensure dividers stretch infinitely from top to bottom, regardless of price scale.
Styles: Select from Solid, Dashed, or Dotted directly in the inputs.
Width & Color: Fully customizable to blend into your chart theme.
⚙️ How to Configure
Go to the Settings (Inputs Tab):
TF 1 & TF 2: Enter the specific number of minutes (e.g., 60 = 1 Hour, 240 = 4 Hours). Toggle the checkbox to Show/Hide.
TF 3 & TF 4: Select the timeframe period from the dropdown. Toggle the checkbox to Show/Hide.
Style: Choose your line style, color, and width.
Note: Since this indicator uses geometric drawings (line.new) to achieve full-height vertical lines, all visual settings (Color, Width, Style) are located in the Inputs Tab, not the Style tab.

SMC Louis 4H-15M V6为了方便你将这个脚本分享到 TradingView 社区或私人收藏,我为你准备了一份中英文对照的专业描述。这份描述突出了脚本的技术核心——**Louis Trading 的 SMC 进场逻辑**。
---
## 📝 脚本描述 / Script Description
### 中文描述:SMC Louis 实战进场辅助工具 (V6版本)
**核心理念:**
本脚本根据 Louis Trading 的 SMC(Smart Money Concepts)交易教学编写,专注于 **4H 趋势过滤 + 15M 结构突破** 的高胜率进场逻辑。它通过自动化的绘图,将复杂的盘面观察简化为清晰的视觉信号。
**主要功能:**
* **多时段趋势追踪**:内置 200 EMA 动态过滤大周期方向,确保你始终顺势交易。
* **自动 BOS (结构突破) 检测**:实时标记市场结构的改变,识别潜在的反转或延续机会。
* **动态 0.715 进场参考线**:当 15M 级别发生 BOS 突破时,脚本自动根据波段高低点计算并绘制 Louis 教学中的 **0.715 黄金回撤位**,无需手动拉斐波那契线。
* **失衡区 (FVG) 视觉化**:自动高亮显示价格快速移动留下的真空区域,帮助识别高概率的订单回踩区。
* **实时仪表盘**:右上角直观显示当前大周期方向与行动建议(等待回踩或反弹)。
**使用说明:**
1. 建议在 **15分钟 (15M)** 周期下使用。
2. 观察仪表盘的趋势方向。
3. 当绿色 **BOS** 出现后,等待价格回踩 **黄色虚线 (0.715)** 且该线位于 **FVG** 区域内时考虑进场。
---
### English Description: SMC Louis Strategy Entry Assistant (V6)
**Core Concept:**
This script is meticulously designed based on the SMC (Smart Money Concepts) methodology taught by Louis Trading. It focuses on the high-probability **4H Trend Filter + 15M Market Structure Break (BOS)** execution workflow. It automates the complex manual charting process into clear, actionable visual cues.
**Key Features:**
* **MTF Trend Filtering**: Integrated 200 EMA helps you stay on the right side of the 4H higher-timeframe trend.
* **Automated BOS Detection**: Real-time identification of Market Structure Breaks (BOS), highlighting potential trend reversals or continuations.
* **Dynamic 0.715 Entry Level**: When a BOS occurs on the 15M timeframe, the script automatically calculates and plots the **0.715 Fibonacci retracement level**—a signature entry point from Louis's strategy.
* **Fair Value Gap (FVG) Visualization**: Automatically highlights price imbalances (FVGs), helping you spot where "Smart Money" is likely to mitigate orders.
* **Live Dashboard**: A clean UI in the top-right corner provides immediate context on trend direction and actionable advice.
**How to Use:**
1. Best used on the **15-Minute (15M)** timeframe.
2. Check the dashboard for the overall trend bias.
3. Wait for a **BOS** label; look for price to retracing into the **Yellow Dashed Line (0.715)**, especially if it aligns with a plotted **FVG box**.
---
### 💡 建议
如果你打算发布这个脚本,建议在 TradingView 的设置中将“15M 摆动回溯周期”默认设置为 **10-15**,这通常能最准确地过滤掉市场杂讯。
**你想让我为你生成一份专门针对“移动端使用”的简化版界面代码吗?(去掉了复杂的仪表盘,只保留核心线条,适合手机查看)**

Sonic R 89 - NY SL Custom Fixed//@version=5
indicator("Sonic R 89 - NY SL Custom Fixed", overlay=true, max_lines_count=500)
// --- 0. TÙY CHỈNH THÔNG SỐ ---
group_session = "Cài đặt Phiên Giao Dịch (Giờ New York)"
use_session = input.bool(true, "Chỉ giao dịch theo khung giờ", group=group_session)
session_time = input.session("0800-1200", "Khung giờ NY 1", group=group_session)
session_time2 = input.session("1300-1700", "Khung giờ NY 2", group=group_session)
max_trades_per_session = input.int(1, "Số lệnh tối đa/mỗi khung giờ", minval=1, group=group_session)
group_risk = "Quản lý Rủi ro (Dashboard)"
risk_usd = input.float(100.0, "Số tiền rủi ro mỗi lệnh ($)", minval=1.0, group=group_risk)
group_sl_custom = "Cấu hình Stop Loss (SL)"
sl_mode = input.string("Dragon", "Chế độ SL", options= , group=group_sl_custom)
lookback_x = input.int(5, "Số nến (X) cho Swing SL", minval=1, group=group_sl_custom)
group_htf = "Lọc Đa khung thời gian (MTF)"
htf_res = input.timeframe("30", "Chọn khung HTF", group=group_htf)
group_sonic = "Cấu hình Sonic R"
vol_mult = input.float(1.5, "Đột biến Volume", minval=1.0)
max_waves = input.int(4, "Ưu tiên n nhịp đầu", minval=1)
trade_cd = input.int(5, "Khoảng cách lệnh (nến)", minval=1)
group_tp = "Quản lý SL/TP & Dòng kẻ"
rr_tp1 = input.float(1.0, "TP1 (RR)", step=0.1)
rr_tp2 = input.float(2.0, "TP2 (RR)", step=0.1)
rr_tp3 = input.float(3.0, "TP3 (RR)", step=0.1)
rr_tp4 = input.float(4.0, "TP4 (RR)", step=0.1)
line_len = input.int(15, "Chiều dài dòng kẻ", minval=1)
// --- 1. KIỂM TRA PHIÊN & HTF ---
is_in_sess1 = not na(time(timeframe.period, session_time, "America/New_York"))
is_in_sess2 = not na(time(timeframe.period, session_time2, "America/New_York"))
is_in_session = use_session ? (is_in_sess1 or is_in_sess2) : true
var int trades_count = 0
is_new_session = is_in_session and not is_in_session
if is_new_session
trades_count := 0
htf_open = request.security(syminfo.tickerid, htf_res, open, lookahead=barmerge.lookahead_on)
htf_close = request.security(syminfo.tickerid, htf_res, close, lookahead=barmerge.lookahead_on)
is_htf_trend = htf_close >= htf_open ? 1 : -1
// --- 2. TÍNH TOÁN CHỈ BÁO ---
ema89 = ta.ema(close, 89)
ema34H = ta.ema(high, 34)
ema34L = ta.ema(low, 34)
atr = ta.atr(14)
avgVol = ta.sma(volume, 20)
slope89 = (ema89 - ema89 ) / atr
hasSlope = math.abs(slope89) > 0.12
isSqueezed = math.abs(ta.ema(close, 34) - ema89) < (atr * 0.5)
var int waveCount = 0
if not hasSlope
waveCount := 0
newWave = hasSlope and ((low <= ema34H and close > ema34H) or (high >= ema34L and close < ema34L))
if newWave and not newWave
waveCount := waveCount + 1
// --- 3. LOGIC VÀO LỆNH ---
isMarubozu = math.abs(close - open) / (high - low) > 0.8
highVol = volume > avgVol * vol_mult
buyCondition = is_in_session and (trades_count < max_trades_per_session) and waveCount <= max_waves and is_htf_trend == 1 and
(isMarubozu or highVol) and close > ema34H and low >= ema89 and
(slope89 > 0.1 or isSqueezed ) and close > open
sellCondition = is_in_session and (trades_count < max_trades_per_session) and waveCount <= max_waves and is_htf_trend == -1 and
(isMarubozu or highVol) and close < ema34L and high <= ema89 and
(slope89 < -0.1 or isSqueezed ) and close < open
// --- 4. QUẢN LÝ LỆNH ---
var float last_entry = na
var float last_sl = na
var float last_tp1 = na
var float last_tp2 = na
var float last_tp3 = na
var float last_tp4 = na
var string last_type = "NONE"
var int lastBar = 0
trigger_buy = buyCondition and (bar_index - lastBar > trade_cd)
trigger_sell = sellCondition and (bar_index - lastBar > trade_cd)
// --- 5. TÍNH TOÁN SL & LOT SIZE ---
float contract_size = 1.0
if str.contains(syminfo.ticker, "XAU") or str.contains(syminfo.ticker, "GOLD")
contract_size := 100
// Logic tính SL linh hoạt
float swing_low = ta.lowest(low, lookback_x)
float swing_high = ta.highest(high, lookback_x)
float temp_sl_calc = na
if trigger_buy
temp_sl_calc := (sl_mode == "Dragon") ? ema34L : swing_low
if trigger_sell
temp_sl_calc := (sl_mode == "Dragon") ? ema34H : swing_high
float sl_dist_calc = math.abs(close - temp_sl_calc)
float calc_lots = (sl_dist_calc > 0) ? (risk_usd / (sl_dist_calc * contract_size)) : 0
if (trigger_buy or trigger_sell)
trades_count := trades_count + 1
lastBar := bar_index
last_type := trigger_buy ? "BUY" : "SELL"
last_entry := close
last_sl := temp_sl_calc
float riskAmt = math.abs(last_entry - last_sl)
last_tp1 := trigger_buy ? last_entry + (riskAmt * rr_tp1) : last_entry - (riskAmt * rr_tp1)
last_tp2 := trigger_buy ? last_entry + (riskAmt * rr_tp2) : last_entry - (riskAmt * rr_tp2)
last_tp3 := trigger_buy ? last_entry + (riskAmt * rr_tp3) : last_entry - (riskAmt * rr_tp3)
last_tp4 := trigger_buy ? last_entry + (riskAmt * rr_tp4) : last_entry - (riskAmt * rr_tp4)
// Vẽ dòng kẻ
line.new(bar_index, last_entry, bar_index + line_len, last_entry, color=color.new(color.gray, 50), width=2)
line.new(bar_index, last_sl, bar_index + line_len, last_sl, color=color.red, width=2, style=line.style_dashed)
line.new(bar_index, last_tp1, bar_index + line_len, last_tp1, color=color.green, width=1)
line.new(bar_index, last_tp2, bar_index + line_len, last_tp2, color=color.lime, width=1)
line.new(bar_index, last_tp3, bar_index + line_len, last_tp3, color=color.aqua, width=1)
line.new(bar_index, last_tp4, bar_index + line_len, last_tp4, color=color.blue, width=2)
// KÍCH HOẠT ALERT()
string alert_msg = (trigger_buy ? "BUY " : "SELL ") + syminfo.ticker + " at " + str.tostring(close) + " | SL Mode: " + sl_mode + " | Lot: " + str.tostring(calc_lots, "#.##") + " | SL: " + str.tostring(last_sl, format.mintick)
alert(alert_msg, alert.freq_once_per_bar_close)
// --- 6. CẢNH BÁO CỐ ĐỊNH ---
alertcondition(trigger_buy, title="Sonic R BUY Alert", message="Sonic R BUY Signal Detected")
alertcondition(trigger_sell, title="Sonic R SELL Alert", message="Sonic R SELL Signal Detected")
// --- 7. DASHBOARD & PLOT ---
var table sonic_table = table.new(position.top_right, 2, 10, bgcolor=color.new(color.black, 70), border_width=1, border_color=color.gray)
if barstate.islast
table.cell(sonic_table, 0, 0, "NY SESSION", text_color=color.white), table.cell(sonic_table, 1, 0, last_type, text_color=(last_type == "BUY" ? color.lime : color.red))
table.cell(sonic_table, 0, 1, "SL Mode:", text_color=color.white), table.cell(sonic_table, 1, 1, sl_mode, text_color=color.orange)
table.cell(sonic_table, 0, 2, "Trades this Sess:", text_color=color.white), table.cell(sonic_table, 1, 2, str.tostring(trades_count) + "/" + str.tostring(max_trades_per_session), text_color=color.yellow)
table.cell(sonic_table, 0, 3, "LOT SIZE:", text_color=color.orange), table.cell(sonic_table, 1, 3, str.tostring(calc_lots, "#.##"), text_color=color.orange)
table.cell(sonic_table, 0, 4, "Entry:", text_color=color.white), table.cell(sonic_table, 1, 4, str.tostring(last_entry, format.mintick), text_color=color.yellow)
table.cell(sonic_table, 0, 5, "SL:", text_color=color.white), table.cell(sonic_table, 1, 5, str.tostring(last_sl, format.mintick), text_color=color.red)
table.cell(sonic_table, 0, 6, "TP1:", text_color=color.gray), table.cell(sonic_table, 1, 6, str.tostring(last_tp1, format.mintick), text_color=color.green)
table.cell(sonic_table, 0, 7, "TP2:", text_color=color.gray), table.cell(sonic_table, 1, 7, str.tostring(last_tp2, format.mintick), text_color=color.lime)
table.cell(sonic_table, 0, 8, "TP3:", text_color=color.gray), table.cell(sonic_table, 1, 8, str.tostring(last_tp3, format.mintick), text_color=color.aqua)
table.cell(sonic_table, 0, 9, "TP4:", text_color=color.gray), table.cell(sonic_table, 1, 9, str.tostring(last_tp4, format.mintick), text_color=color.blue)
plot(ema89, color=slope89 > 0.1 ? color.lime : slope89 < -0.1 ? color.red : color.gray, linewidth=2)
p_high = plot(ema34H, color=color.new(color.blue, 80))
p_low = plot(ema34L, color=color.new(color.blue, 80))
fill(p_high, p_low, color=color.new(color.blue, 96))
plotshape(trigger_buy, "BUY", shape.triangleup, location.belowbar, color=color.green, size=size.small)
plotshape(trigger_sell, "SELL", shape.triangledown, location.abovebar, color=color.red, size=size.small)
bgcolor(isSqueezed ? color.new(color.yellow, 92) : na)
bgcolor(not is_in_session ? color.new(color.gray, 96) : na)

EL OJO DE DIOS - FINAL (ORDEN CORREGIDO)//@version=6
indicator("EL OJO DE DIOS - FINAL (ORDEN CORREGIDO)", overlay=true, max_boxes_count=500, max_lines_count=500, max_labels_count=500)
// --- 1. CONFIGURACIÓN ---
grpEMA = "Medias Móviles"
inpShowEMA = input.bool(true, "Mostrar EMAs", group=grpEMA)
inpEMA21 = input.int(21, "EMA 21", minval=1, group=grpEMA)
inpEMA50 = input.int(50, "EMA 50", minval=1, group=grpEMA)
inpEMA200 = input.int(200, "EMA 200", minval=1, group=grpEMA)
grpStrategy = "Estrategia"
inpTrendTF = input.string("Current", "Timeframe Señal", options= , group=grpStrategy)
inpADXFilter = input.bool(true, "Filtro ADX", group=grpStrategy)
inpADXPeriod = input.int(14, "Período ADX", group=grpStrategy)
inpADXLimit = input.int(20, "Límite ADX", group=grpStrategy)
inpRR = input.float(2.0, "Riesgo:Beneficio", group=grpStrategy)
grpVisuals = "Visuales"
inpShowPrevDay = input.bool(true, "Máx/Mín Ayer", group=grpVisuals)
inpShowNY = input.bool(true, "Sesión NY", group=grpVisuals)
// --- 2. VARIABLES ---
var float t1Price = na
var bool t1Bull = false
var bool t1Conf = false
var line slLine = na
var line tpLine = na
// Variables Prev Day
var float pdH = na
var float pdL = na
var line linePDH = na
var line linePDL = na
// Variables Session
var box nySessionBox = na
// --- 3. CÁLCULO ADX MANUAL ---
f_calcADX(_high, _low, _close, _len) =>
// True Range Manual
tr = math.max(_high - _low, math.abs(_high - _close ), math.abs(_low - _close ))
// Directional Movement
up = _high - _high
down = _low - _low
plusDM = (up > down and up > 0) ? up : 0.0
minusDM = (down > up and down > 0) ? down : 0.0
// Smoothed averages
atr = ta.rma(tr, _len)
plus = 100.0 * ta.rma(plusDM, _len) / atr
minus = 100.0 * ta.rma(minusDM, _len) / atr
// DX y ADX
sum = plus + minus
dx = sum == 0 ? 0.0 : 100.0 * math.abs(plus - minus) / sum
adx = ta.rma(dx, _len)
adx
// --- 4. CÁLCULO DE DATOS ---
ema21 = ta.ema(close, inpEMA21)
ema50 = ta.ema(close, inpEMA50)
ema200 = ta.ema(close, inpEMA200)
// MTF Logic
targetTF = inpTrendTF == "Current" ? timeframe.period : inpTrendTF == "15m" ? "15" : "60"
// CORRECCIÓN AQUÍ: Uso de argumentos nominales (gaps=, lookahead=) para evitar errores de orden
f_getSeries(src, tf) =>
tf == timeframe.period ? src : request.security(syminfo.tickerid, tf, src, gaps=barmerge.gaps_on, lookahead=barmerge.lookahead_off)
tf_close = f_getSeries(close, targetTF)
tf_high = f_getSeries(high, targetTF)
tf_low = f_getSeries(low, targetTF)
tf_ema21 = ta.ema(tf_close, inpEMA21)
tf_ema50 = ta.ema(tf_close, inpEMA50)
// Calcular ADX
float tf_adx = f_calcADX(tf_high, tf_low, tf_close, inpADXPeriod)
// Cruces
bool crossUp = ta.crossover(tf_ema21, tf_ema50)
bool crossDown = ta.crossunder(tf_ema21, tf_ema50)
bool crossSignal = crossUp or crossDown
bool adxOk = inpADXFilter ? tf_adx > inpADXLimit : true
// --- 5. LÓGICA DE SEÑALES ---
if crossSignal and adxOk and barstate.isconfirmed
t1Price := tf_ema21
t1Bull := tf_ema21 > tf_ema50
t1Conf := false
if not na(slLine)
line.delete(slLine)
slLine := na
if not na(tpLine)
line.delete(tpLine)
tpLine := na
label.new(bar_index, high + (ta.atr(14)*0.5), text="CRUCE T1", color=t1Bull ? color.green : color.red, textcolor=color.white, size=size.small)
bool touch = false
if not na(t1Price) and not t1Conf
if t1Bull
touch := low <= t1Price and close >= t1Price
else
touch := high >= t1Price and close <= t1Price
if touch and barstate.isconfirmed
t1Conf := true
float atr = ta.atr(14)
float sl = t1Bull ? low - (atr*0.1) : high + (atr*0.1)
float dist = math.abs(t1Price - sl)
float tp = t1Bull ? t1Price + (dist * inpRR) : t1Price - (dist * inpRR)
label.new(bar_index, t1Price, text="ENTRADA", color=color.yellow, textcolor=color.black, size=size.small)
slLine := line.new(bar_index, sl, bar_index + 15, sl, color=color.red, style=line.style_dashed, width=2)
tpLine := line.new(bar_index, tp, bar_index + 15, tp, color=color.green, style=line.style_dashed, width=2)
// --- 6. GRÁFICO ---
col21 = ema21 > ema21 ? color.teal : color.maroon
col50 = ema50 > ema50 ? color.aqua : color.fuchsia
col200 = ema200 > ema200 ? color.blue : color.red
plot(inpShowEMA ? ema21 : na, "EMA21", color=col21, linewidth=2)
plot(inpShowEMA ? ema50 : na, "EMA50", color=col50, linewidth=2)
plot(inpShowEMA ? ema200 : na, "EMA200", color=col200, linewidth=2)
bgcolor(ema50 > ema200 ? color.new(color.green, 95) : color.new(color.red, 95))
// --- 7. SESIÓN NY ---
isNYSummer = (month(time) == 3 and dayofmonth(time) >= 14) or (month(time) > 3 and month(time) < 11)
hourOffset = isNYSummer ? 4 : 5
nyHour = (hour - hourOffset) % 24
bool isSession = nyHour >= 6 and nyHour < 11
if isSession and inpShowNY
if na(nySessionBox)
nySessionBox := box.new(bar_index, high, bar_index, low, bgcolor=color.new(color.blue, 92), border_color=color.new(color.white, 0))
else
box.set_right(nySessionBox, bar_index)
box.set_top(nySessionBox, math.max(high, box.get_top(nySessionBox)))
box.set_bottom(nySessionBox, math.min(low, box.get_bottom(nySessionBox)))
if not isSession and not na(nySessionBox)
box.delete(nySessionBox)
nySessionBox := na
// --- 8. MÁX/MÍN AYER ---
hCheck = request.security(syminfo.tickerid, "D", high , lookahead=barmerge.lookahead_on)
lCheck = request.security(syminfo.tickerid, "D", low , lookahead=barmerge.lookahead_on)
if not na(hCheck)
pdH := hCheck
if not na(lCheck)
pdL := lCheck
if barstate.islast and inpShowPrevDay
line.delete(linePDH)
line.delete(linePDL)
if not na(pdH)
linePDH := line.new(bar_index - 50, pdH, bar_index, pdH, color=color.green)
if not na(pdL)
linePDL := line.new(bar_index - 50, pdL, bar_index, pdL, color=color.red)
alertcondition(crossSignal, "Cruce T1", "Cruce Tendencia 1")
alertcondition(touch, "Entrada Confirmada", "Entrada Confirmada")

[LJ] RSIM + ICT KillzonesIndicator Summary
This Pine Script indicator is a comprehensive, all-in-one toolkit designed for traders utilizing Inner Circle Trader (ICT) concepts. It visually maps out crucial time-based trading sessions, killzones, and key opening price levels directly on the chart. Alongside the time and price tools, it features a real-time "RSIM" (MTF RSI Monitor) dashboard to track market momentum across multiple timeframes, all while maintaining a lag-free chart through automated drawing cleanup.
Core Functionalities
ICT Killzones & Silver Bullets:
Visually demarcates specific high-probability trading windows—including the Asian, London, and New York (AM & PM) killzones, as well as the UK and US "Silver Bullet" times—using vertical lines and colored background highlights.
Key Opening Price Levels:
Automatically plots horizontal lines for significant opening prices, such as the New York Midnight Open (often used as true day open), CME Open, and NY AM/PM Opens. It also includes Higher Time Frame (HTF) levels for Weekly and Monthly opens.
Session High/Low Tracking:
Actively tracks and draws horizontal price levels for the High and Low of the current day, previous day, and individual Globex, Asian, London, and NY sessions.
Multi-Timeframe RSI Dashboard (RSIM):
An on-chart table that displays the current Relative Strength Index (RSI) values and a live countdown timer ("time to close") for the 5-minute, 15-minute, 1-hour, 4-hour, Daily, and Weekly timeframes.
Lunch "No-Trade-Zone":
Specifically highlights the New York Lunch period, visually warning traders of potential low-volume or erratic price action.
Automated Housekeeping:
A built-in memory management system that automatically deletes drawings (lines and labels) older than a user-defined number of days to prevent chart clutter and performance lag.
Built-in Debug Logger:
An optional on-chart logging table that tracks session triggers and script events, helping traders verify that times and levels are plotting correctly for their selected asset.
