Order Block with BoSHere’s a professional and concise description you can use for publishing your **TradingView script** titled **"Order Block with BoS"**:
---
### 📌 **Description for TradingView Publication:**
**"Order Block with Break of Structure (BoS)"** is a powerful price action-based indicator designed to identify potential reversal zones and momentum shifts using **Order Block** detection combined with **Break of Structure (BoS)** confirmation.
### 🔍 **Key Features:**
* **Order Block Detection**: Highlights bullish and bearish order blocks using precise candle structure logic.
* **Break of Structure (BoS)**: Confirms structural breaks above swing highs or below swing lows to validate potential trend continuation or reversal.
* **Dynamic ATR Filter**: Uses a 14-period ATR with dynamic thresholds to confirm significant moves, filtering out weak breakouts.
* **Visual Aids**:
* Color-coded **boxes** to mark detected Order Blocks.
* **Arrows** at BoS confirmation points when ATR confirms strong momentum.
* Optional **dashed BoS lines** to show where price broke structure.
### ⚙️ **Customizable Inputs**:
* `Swing Length`: Defines the sensitivity of swing high/low detection.
* `Show Break of Structure`: Toggle on/off BoS confirmation lines.
* `Candle Lookback`: Number of historical candles to consider.
This indicator is ideal for traders who incorporate **smart money concepts**, **market structure analysis**, or **institutional order flow** strategies.
---
Would you like me to help write the **strategy** version of this or translate the description into another language for international audiences?
ابحث في النصوص البرمجية عن "order"

Order Blocks with Volume Heatmap & Clusters - VK TradingOrder Blocks with Volume Heatmap & Clusters - VK Trading
This script is designed to identify and highlight Order Blocks, a key concept in institutional trading, and combines it with powerful tools like volume heatmaps and accumulation clusters for enhanced market analysis. Suitable for traders of all experience levels, this script provides a clear and customizable visualization to help identify significant market zones effectively.
What Does This Script Do?
Order Block Identification: Highlights bullish and bearish order blocks directly on the chart, making it easier to spot key supply and demand zones.
Volume Heatmap: A dynamic heatmap adjusts colors based on relative volume, allowing you to quickly identify areas of heightened activity.
Institutional Accumulation Clusters: Zones of potential institutional accumulation are calculated using a combination of ATR (Average True Range), standardized volume, and RSI (Relative Strength Index).
Automatic Clearing: Invalidated order blocks are automatically removed, ensuring your charts remain clean and focused.
Key Features
Customizable Sensitivity: Adjust the script’s sensitivity to tailor order block detection to different market conditions and strategies.
Advanced Volume Display Options: Toggle volume visibility on or off. Customize the position, size, and color of volume labels for better integration with your chart's design.
Dynamic Heatmap Intensity: Fine-tune the heatmap’s intensity and color to highlight areas of interest based on trading volume.
Dual Order Block Detection: Uses two independent detection settings to analyze the market from multiple perspectives.
Visual Alerts: Automatically draws key level lines based on detected order blocks for better clarity.
User Benefits:
Clear Market Analysis: Helps pinpoint institutional activity and key levels with minimal effort.
Increased Efficiency: Automates plotting and analysis, allowing you to focus on decision-making.
Versatile Compatibility: Complements strategies like Smart Money Concepts, Wyckoff, and Price Action approaches.
Disclaimer
This script is intended as an analytical and educational tool. It does not guarantee specific outcomes or eliminate trading risks. Use this tool at your own discretion and always practice proper risk management.

Order blocksHi all!
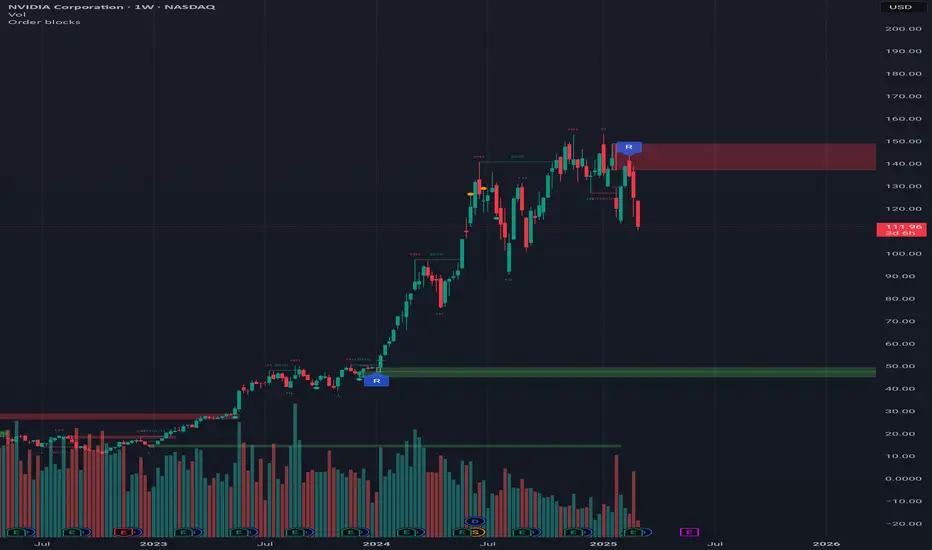
This indicator will show you found order blocks that can be used as supply or demand. It's my take on trying to create good order blocks and I hope it makes sense.
First off I suggest to verify the current trend before using an order block. This can be done in a variety of ways, one way could be to use my other script "Market structure" () which I use and suggest.
You can configure the indicator to behave differently depending on settings. These are the settings available:
• The order blocks created can be found in any higher timeframe defined in "Timeframe"
• The number of active order blocks are defined in "Count". If an order block is found the earliest order block will be replaced
• You can choose the type of order blocks that are found ("Bullish", "Bearish " or "Both") in "Type"
• The old order blocks can be kept if "Keep history" is checked
• Order blocks that are found are not removed when mitigated (entered) but when a new one appears. They can be removed when they are broken by price if "Remove broken zones" are checked
There is also a setting section called "Requirements" that defines what is required for an order block to be created. These are the settings:
• "Take out"
Check this if you want the base of the order block (the candle where the zone is drawn from (high and low)) to have to take out the previous candle (be higher or lower depending if the order block is bullish or bearish).
• "Consecutive rising/falling"
Each following candle in the reaction (the 3 reaction candles) needs to reach higher or lower (depending on bullish or bearish). Check this if you want that to be true.
• "Reaction"
Some sort of reaction is needed from the 3 candles creating the order block. This reaction is based on the value of the Average True Length (ATR) of length 14. You can here define a factor of the value from the ATR that these 3 candles needs to move in price. A higher need for a reaction (higher factor of the ATR) will create lesser zones. You can also choose to show this limit with the checkbox.
• "Fair Value Gap"
The reaction needs to create a gap (imbalance) in price. This gap is known as a "Fair Value Gap" and is created when the last candle's wick does not meet with the base candle's wick. Check this if you want this to be needed.
After these settings you can also choose the colors of the created zones. The ones that are active (called "Zones"), the ones that are replaced ("Replaced zones") and the ones that are broken ("Broken zones") (if this is enabled in "Remove broken zones").
I'm using my library "Touched" to be able to show you labels when the order blocks have a retest, false breakout and breakout. These labels can be hidden if you disable the labels under the style tab in the indicator settings.
The concept of order blocks is widely used among traders and can provide you with good supply or demand zones. I hope that this indicator makes sense.
My todo-list has a few things, but top of that list is adding alerts for zone interactions or creations. Please feel free to say what you want to be coded!
The order blocks in the publication chart are found in weekly timeframe but are shown on the daily timeframe. Other than that the image shows you zones from the default settings (which are based on the daily timeframe).
Best of luck trading!
Order Block v1Hello Traders :)
I am Only Fibonacci.
While coding this indicator, I examined many concepts and decided to blend them.
I took the method shared by most traders and added different perspectives and options.
First of all, you can choose how many order block regions you want to see on the screen.
Note: The levels displayed on the screen are the sum of bears and bulls.
You can also choose whichever you want to see, bearish or bullish.
You can specify the precision of pivot points.
Whether you want to select a zone with a body or a zone with a wick, you can see this in the settings.
You can extend the regions infinitely with the right extension option.
Order BlocksThis script analyses candle stick patterns and draws order blocks in real time, it is designed to be very easy to use and works on all markets.
With a simple sensitivity configuration to control the range of candles in scope for analysis, the order blocks are automatically drawn and removed in real time if price action closes through an order block.
Order Block FinderAfter finding a huge amount of use from TV user's wugamlo script Order Block Finder (Experimental) , I decided to make some much needed upgrades! Added support for plotting the last X number of Order Blocks and am currently working on a multi-timeframe version.
If you'd like to contribute to the MTF analysis portion, that would benefit tons of other scripts and open the possibility to more "MTF Panel" style indicators.
Please visit the original script page (link at top) to review how the indicator is used in trading.

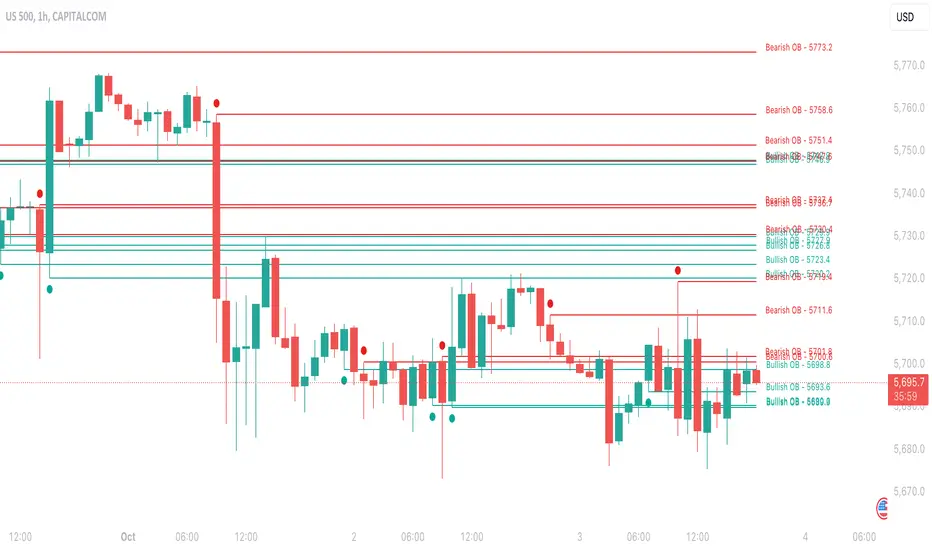
Order Blocks-[B.Balaei]Order Blocks -
**Description:**
The Order Blocks - indicator is a powerful tool designed to identify and visualize Order Blocks on your chart. Order Blocks are key levels where significant buying or selling activity has occurred, often acting as support or resistance zones. This indicator supports multiple timeframes (MTF), allowing you to analyze Order Blocks from higher timeframes directly on your current chart.
**Key Features:**
1. **Multi-Timeframe Support**: Choose any timeframe (e.g., Daily, Weekly) to display Order Blocks from higher timeframes.
2. **Customizable Sensitivity**: Adjust the sensitivity to detect more or fewer Order Blocks based on market conditions.
3. **Bullish & Bearish Order Blocks**: Clearly distinguishes between bullish (green) and bearish (red) Order Blocks.
4. **Alerts**: Get notified when price enters a Bullish or Bearish Order Block zone.
5. **Customizable Colors**: Personalize the appearance of Order Blocks to match your chart style.
**How to Use:**
1. Add the indicator to your chart.
2. Select your desired timeframe from the "Multi-Timeframe" settings.
3. Adjust the sensitivity and colors as needed.
4. Watch for Order Blocks to form and use them as potential support/resistance levels.
**Ideal For:**
- Swing traders and position traders looking for key levels.
- Traders who use multi-timeframe analysis.
- Anyone interested in understanding market structure through Order Blocks.
**Note:**
This indicator is for educational and informational purposes only. Always conduct your own analysis before making trading decisions.
**Enjoy trading with Order Blocks - !**

Order Size CalculatorScript to calculate the amount of stocks for of an order in relation to depot size (money), risk awareness, profit target and ATR

Volume Orderbook (Expo)█ Overview
The Volume Orderbook indicator is a volume analysis tool that visually resembles an order book. It's used for displaying trading volume data in a way that may be easier to interpret or more intuitive for certain traders, especially those familiar with order book analysis.
This indicator aggregate and display the total trading volume at different price levels over the entire range of data available on the chart, similar to how an order book displays current buy and sell orders at different price levels. However, unlike a real-time order book, it only considers historical trading data, not current bid and ask orders. This provides a 'historical order book' of sorts, indicating where most trading activities have taken place.
Summary
This is a volume-based indicator that shows the volume traded at specific price levels, highlighting areas of high and low activity.
█ Calculations
The algorithm operates by calculating the cumulative volume traded in each specific price zone within the range of data displayed on the chart. The length of each horizontal bar corresponds to the total volume of trades that occurred within that particular price zone.
In essence, when the price is in a specific zone, the volume is added to the bar representing that zone. A thicker bar implies a larger price zone, meaning that more volume is accumulated within that bar. Therefore, the thickness of the bar visually indicates the amount of trading activity that took place within the associated price zone.
█ How to use
The Volume Orderbook indicator serves as a beneficial tool for traders by identifying key price levels with a significant amount of trading activity. These high-volume areas could represent potential support or resistance levels due to the large number of orders situated there. The indicator's ability to spotlight these zones might be particularly advantageous in pinpointing breakouts or breakdowns when prices move beyond these high-volume regions. Moreover, the indicator could also assist traders in recognizing anomalies, such as when an unusually large volume of trades occurs at unconventional price levels.
Identify Key Price Levels: The indicator highlights high-volume areas where a significant number of trades have occurred, which could act as potential support or resistance levels. This is based on the notion that many traders have established positions at these prices, so these levels may serve as significant areas for market activity in the future.
Volume Nodes: These are the peaks (high-volume areas) and troughs (low-volume areas) seen on the indicator. High-volume nodes represent price levels at which a large amount of volume has been traded, typically areas of strong support or resistance. Conversely, low-volume nodes, where very little volume has been traded, indicate price levels that traders have shown little interest in the past and could potentially act as barriers to price. It's important to note that while high trading volume can imply significant market interest, it doesn't always mean the price will stop or reverse at these levels. Sometimes, prices can quickly move through high-volume areas if there are no current orders (demand) to match with the new orders (supply).
Analyze Market Psychology: The distribution of volume across different price levels can provide insights into the market's psychology, revealing the balance of power between buyers and sellers.
Highlight Potential Reversal Points: The indicator can help identify price levels with high traded volume where the market might be more likely to reverse since these levels have previously attracted significant interest from traders.
Validate Breakouts or Breakdowns: If the price moves convincingly past a high-volume node, it could indicate a strong trend, suggesting a potential breakout or breakdown. Conversely, if the price struggles to move past a high-volume node, it could suggest that the trend is weak and might potentially reverse.
Trade Reversals: High-volume areas could also indicate potential turning points in the market. If the price reaches these levels and then starts to move away, it might suggest a possible price reversal.
Confirm Other Signals: As with all technical indicators, the "Volume Orderbook" should ideally be used in conjunction with other forms of technical and fundamental analysis to confirm signals and increase the odds of successful trades.
Summary
The Volume Orderbook indicator allows traders to identify key price levels, analyze market psychology, highlight potential reversal points, validate breakouts or breakdowns, confirm other trading signals, and anticipate possible trade reversals, thereby serving as a robust tool for trading analysis.
█ Settings
Source: The user can select the source, the default of which is "close." This implies that volume is added to the volume order book when the closing price falls within a specific zone. Users can modify this to any indicator present on their chart. For example, if it's set to an SMA (Simple Moving Average) of 20, the volume will be added to the volume order book when the SMA 20 falls within the specific zone.
Rows and width: These settings allow users to adjust the representation of volume order book zones. "ROWS" pertains to the number of volume order book zones displayed, while "WIDTH" refers to the breadth of each zone.
Table and Grid: These settings allow traders to customize the Volume order-book's position and appearance. By adjusting the "left" parameter, users can shift the position of the Volume order book on the chart; a higher value pushes the order book further to the right. Additionally, users can enable "Table Border" and "Table Grid" options to add gridlines or borders to the Volume order book for easier viewing and interpretation.
-----------------
Disclaimer
The information contained in my Scripts/Indicators/Ideas/Algos/Systems does not constitute financial advice or a solicitation to buy or sell any securities of any type. I will not accept liability for any loss or damage, including without limitation any loss of profit, which may arise directly or indirectly from the use of or reliance on such information.
All investments involve risk, and the past performance of a security, industry, sector, market, financial product, trading strategy, backtest, or individual's trading does not guarantee future results or returns. Investors are fully responsible for any investment decisions they make. Such decisions should be based solely on an evaluation of their financial circumstances, investment objectives, risk tolerance, and liquidity needs.
My Scripts/Indicators/Ideas/Algos/Systems are only for educational purposes!

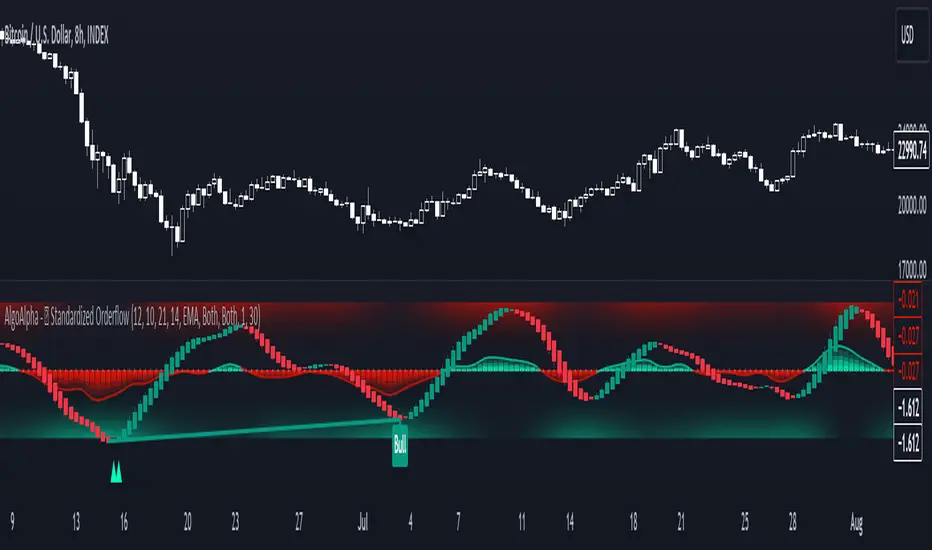
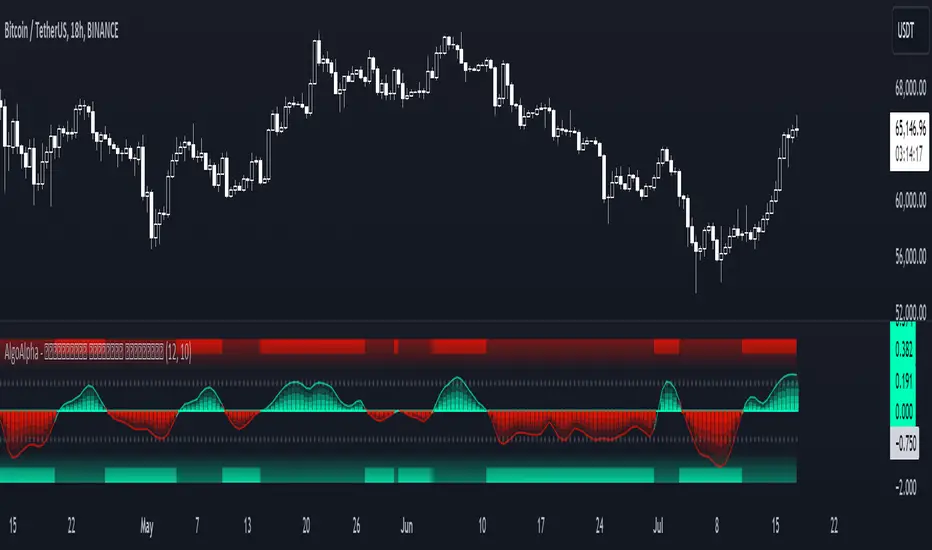
Standardized Orderflow [AlgoAlpha]Introducing the Standardized Orderflow indicator by AlgoAlpha. This innovative tool is designed to enhance your trading strategy by providing a detailed analysis of order flow and velocity. Perfect for traders who seek a deeper insight into market dynamics, it's packed with features that cater to various trading styles. 🚀📊
Key Features:
📈 Order Flow Analysis: At its core, the indicator analyzes order flow, distinguishing between bullish and bearish volume within a specified period. It uses a unique standard deviation calculation for normalization, offering a clear view of market sentiment.
🔄 Smoothing Options: Users can opt for a smoothed representation of order flow, using a Hull Moving Average (HMA) for a more refined analysis.
🌪️ Velocity Tracking: The indicator tracks the velocity of order flow changes, providing insights into the market's momentum.
🎨 Customizable Display: Tailor the display mode to focus on either order flow, order velocity, or both, depending on your analysis needs.
🔔 Alerts for Critical Events: Set up alerts for crucial market events like crossover/crossunder of the zero line and overbought/oversold conditions.
How to Use:
1. Setup: Easily configure the indicator to match your trading strategy with customizable input parameters such as order flow period, smoothing length, and moving average types.
2. Interpretation: Watch for bullish and bearish columns in the order flow chart, utilize the Heiken Ashi RSI candle calculation, and look our for reversal notations for additional market insights.
3. Alerts: Stay informed with real-time alerts for key market events.
Code Explanation:
- Order Flow Calculation:
The core of the indicator is the calculation of order flow, which is the sum of volumes for bullish or bearish price movements. This is followed by normalization using standard deviation.
orderFlow = math.sum(close > close ? volume : (close < close ? -volume : 0), orderFlowWindow)
orderFlow := useSmoothing ? ta.hma(orderFlow, smoothingLength) : orderFlow
stdDev = ta.stdev(orderFlow, 45) * 1
normalizedOrderFlow = orderFlow/(stdDev + stdDev)
- Velocity Calculation:
The velocity of order flow changes is calculated using moving averages, providing a dynamic view of market momentum.
velocityDiff = ma((normalizedOrderFlow - ma(normalizedOrderFlow, velocitySignalLength, maTypeInput)) * 10, velocityCalcLength, maTypeInput)
- Display Options:
Users can choose their preferred display mode, focusing on either order flow, order velocity, or both.
orderFlowDisplayCond = displayMode != "Order Velocity" ? display.all : display.none
wideDisplayCond = displayMode != "Order Flow" ? display.all : display.none
- Reversal Indicators and Divergences:
The indicator also includes plots for potential bullish and bearish reversals, as well as regular and hidden divergences, adding depth to your market analysis.
bullishReversalCond = reversalType == "Order Flow" ? ta.crossover(normalizedOrderFlow, -1.5) : (reversalType == "Order Velocity" ? ta.crossover(velocityDiff, -4) : (ta.crossover(velocityDiff, -4) or ta.crossover(normalizedOrderFlow, -1.5)) )
bearishReversalCond = reversalType == "Order Flow" ? ta.crossunder(normalizedOrderFlow, 1.5) : (reversalType == "Order Velocity" ? ta.crossunder(velocityDiff, 4) : (ta.crossunder(velocityDiff, 4) or ta.crossunder(normalizedOrderFlow, 1.5)) )
In summary, the Standardized Orderflow indicator by AlgoAlpha is a versatile tool for traders aiming to enhance their market analysis. Whether you're focused on short-term momentum or long-term trends, this indicator provides valuable insights into market dynamics. 🌟📉📈
Activity and Volume Orderflow Profile [AlgoAlpha]🔍 Activity and Volume Orderflow Profile 📊
🚀 Unlock the power of market order flow analysis with the Activity and Volume Orderflow Profile indicator by AlgoAlpha . This versatile tool helps you visualize and understand the dynamics of buying and selling pressure within a specified lookback period. Perfect for traders who want to dig deeper into volume-based market insights!
Key Features:
📊 Profile Type Options : Choose between "Comparison" and "Net Order Flow" to analyze market activity based on your preferred method.
🔎 Adjustable Lookback Period : Customize the lookback period to fit your trading strategy.
🎨 Flexible Appearance Settings : Toggle the display of the profile, lookback period visualization, and heatmap to suit your preferences.
🖍 Color Customization : Set your preferred colors for up and down volumes.
🕹 High Activity Highlight : Use the minimum transparency setting to highlight areas of significant activity.
Quick Guide to Using the Activity and Volume Orderflow Profile
🛠 Add the Indicator: Add the indicator to your favorites. Customize settings like profile type, lookback period, and resolution to fit your trading style.
📊 Market Analysis: Use the profile to identify areas of high buying or selling pressure. In "Comparison" mode, look for significant volume differences; in "Net Order Flow" mode, focus on net volume changes. Additionally, you can use the activity heatmap to find key levels that can act as support and resistance as price is likely to react to the zones as indicated by the heatmap.
How it Works:
The indicator operates by first gathering data on high and low prices, as well as buy and sell volumes, over a user-defined lookback period. It then calculates the maximum and minimum prices during this period and divides this range into bins based on the chosen resolution. For each bin, it computes the total volume of buy and sell orders. In "Comparison" mode, it displays side-by-side boxes representing buy and sell volumes, while in "Net Order Flow" mode, it shows the net volume difference. The indicator visually presents these profiles on the chart with customizable colors, transparency levels, and the option to display a heatmap for enhanced volume activity insights.
Maximize your trading with the Activity and Volume Orderflow Profile from AlgoAlpha! 🚀✨

RSI Support & Resistance Breakouts with OrderblocksThis tool is an overly simplified method of finding market squeeze and breakout completely based on a dynamic RSI calculation. It is designed to draw out areas of price levels where the market is pushing back against price action leaving behind instances of short term support and resistance levels you otherwise wouldn't see with the common RSI.
It uses the changes in market momentum to determine support and resistance levels in real time while offering price zone where order blocks exist in the short term.
In ranging markets we need to know a couple things.
1. External Zone - It's important to know where the highs and lows were left behind as they hold liquidity. Here you will have later price swings and more false breakouts.
2. Internal Zone - It's important to know where the highest and lowest closing values were so we can see the limitations of that squeeze. Here you will find the stronger cluster of orders often seen as orderblocks.
In this tool I've added a 200 period Smoothed Moving Average as a trend filter which causes the RSI calculation to change dynamically.
Regular Zones - without extending
The Zones draw out automatically but are often too small to work with.
To solve this problem, you can extend the zones into the future up to 40 bars.
This allows for more visibility against future price action.
--------------------------------------------
Two Types of Zones
External Zones - These zones give you positioning of the highest and lowest price traded within the ranging market. This is where liquidity will be swept and often is an ultimate breaking point for new price swings.
How to use them :
External Zones - External zones form at the top of a pullback. After this price should move back into its impulsive wave.
During the next corrective way, if price breaches the top of the previous External Zone, this is a sign of trend weakness. Expect a divergence and trend reversal.
Internal Zones - (OrderBlocks) Current price will move in relation to previous internal zones. The internal zone is where a majority of price action and trading took place. It's a stronger SQUEEZE area. Current price action will often have a hard time closing beyond the previous Internal Zones high or low. You can expect these zones to show you where the market will flip over. In these same internal zones you'll find large rejection candles.
**Important Note** Size Doesn't Matter
The size of the internal zone does not matter. It can be very small and still very powerful.
Once an internal zone has been hit a few times, its often not relevant any longer.
Order Block Zone Examples
In this image you can see the Internal Zone that was untouched had a STRONG price reaction later on.
Internal Zones that were touched multiple times had weak reactions later as price respected them less over time.
Zone Overlay Breakdown
The Zones form and update in real time until momentum has picked up and price begins to trend. However it leaves behind the elements of the inducement area and all the key levels you need to know about for future price action.
Resistance Fakeout : Later on after the zone has formed, price will return to this upper zone of price levels and cause fakeouts. A close above this zone implies the market moves long again.
Midline Equilibrium : This is simply the center of the strongest traded area. We can call this the Point of Control within the orderblock. If price expands through both extremes of this zone multiple times in the future, it eliminates the orderblock.
Support Fakeout : Just like its opposing brother, price will wick through this zone and rip back causing inducement to trap traders. You would need a clear close below this zone to be in a bearish trend.
BARCOLOR or Candle Color: (Optional)
Bars are colored under three conditions
Bullish Color = A confirmed bullish breakout of the range.
Bearish Color = A confirmed bearish breakout of the range.
Squeeze Color = Even if no box is formed a candle or candles can have a squeeze color. This means the ranging market happened within the high and low of that singular candle.

Institutional OrderBlock Pressure█ OVERVIEW
OrderBlocks are areas where Banks take a Short or Long position. So they create a movement that they would like to hide from us, but luckily for us they cannot. Take the example of Banks opening Short position for x reason. The Trend is already Bearish. The Price will fall and then make a Reversal
(most often to the price where they opened their positions) and it is at this precise moment that they will again resume a Short position twice as
large because for the moment, following this example it is not in their interest that the Price exceeds a certain Price since they are Seller.
As a result they create a solid Resistance (the strongest it is). There are several ways to interpret this logic, we can try to follow the movement of Banks
or on the contrary take advantage of the recovery of the course. Note that not having level 2 and access to the order book from TradingView we can only
make a rough estimate of the "OrderBlocks" through VPOC.
█ HOW TO INTERPRET?
• The Labels displayed by "Red Arrow" and "Green Arrow" represent supposed Bearish or Bullish OrderBlock. Note that you should not in any way interpret these "Arrows" as Signals to Buy or Sell for the reasons mentioned above.
• The OB Line works according to detected OrderBlock Candle. These lines indicate the potential recovery area. (The highlighted lines and candles are white by default).
• It is better to use this indicator on Higher TimeFrame like 2H or 4H.
• You can change the Volume Ratio (here VPOC) which is 89 by default.
• There is a Customization section that allows you to change the colors of the Lines and Candles from White to Black depending on your background color (Light or Dark).
• YES the indicator is Repainting and YES you can have False Alerts since Labels appear in intra-bar!
█ ALERTS
• In fact we don't really need Alerts for the logic of this indicator except maybe to get the Price of the last OB Detected and to keep this price in your Alert History and may use it later. Some improvements will come in future with updates and we have already planned to add Alerts when a "Line Cross" gone occur.
If you notice any bugs or if you have any suggestions, don't be hateful gangs ;)
Happy trading everyone and remember, risk management is the most important!
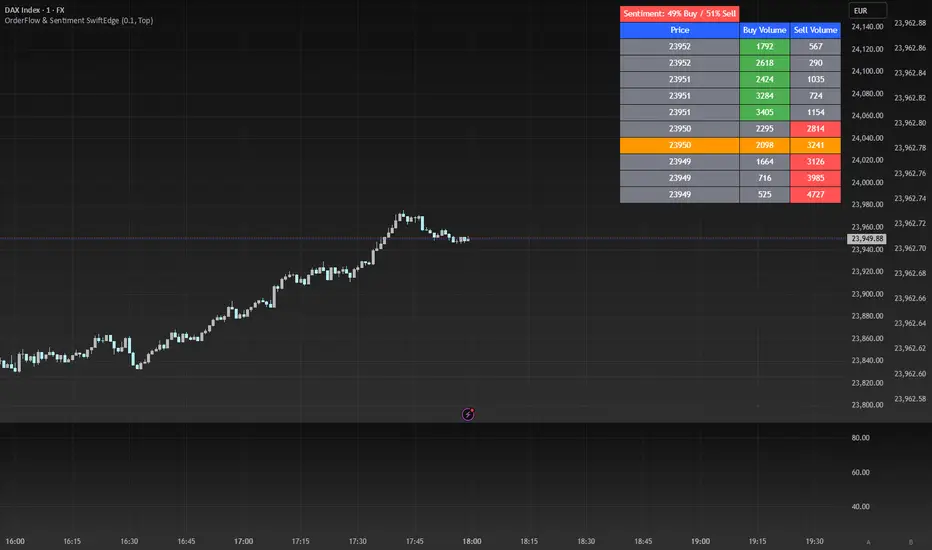
OrderFlow Sentiment SwiftEdgeOrderFlow Sentiment SwiftEdge
Overview
OrderFlow Sentiment SwiftEdge is a visual indicator designed to help traders analyze market dynamics through a simulated orderbook and market sentiment display. It breaks down the current candlestick into 10 price bins, estimating buy and sell volumes, and presents this data in an orderbook table alongside a sentiment row showing the buy vs. sell bias. This tool provides a quick and intuitive way to assess orderflow activity and market sentiment directly on your chart.
How It Works
The indicator consists of two main components: an Orderbook Table and a Market Sentiment Row.
Orderbook Table:
Simulates buy and sell volumes for the current candlestick by distributing total volume into 10 price bins based on price movement and proximity to open/close levels.
Displays the price bins in a table with columns for Price, Buy Volume, and Sell Volume, sorted from highest to lowest price.
Highlights the current price level in orange for easy identification, while buy and sell dominance is indicated with green (buy) or red (sell) backgrounds.
Market Sentiment Row:
Calculates the overall buy and sell sentiment (as a percentage) for the current candlestick based on the simulated orderflow data.
Displays the sentiment above the orderbook table, with the background colored green if buyers dominate or red if sellers dominate.
Features
Customizable Colors: Choose colors for buy (default: green), sell (default: red), and current price (default: orange) levels.
Lot Scaling Factor: Adjust the volume scaling factor (default: 0.1 lots per volume unit) to simulate realistic lot sizes.
Table Position: Select the table position on the chart (Top, Middle, or Bottom; default: Middle).
Default Properties
Positive Color: Green
Negative Color: Red
Current Price Color: Orange
Lot Scaling Factor: 0.1
Table Position: Middle
Usage
This indicator is ideal for traders who want to visualize orderflow dynamics and market sentiment in real-time. The orderbook table provides a snapshot of buy and sell activity at different price levels within the current candlestick, helping you identify areas of high buying or selling pressure. The sentiment row offers a quick overview of market bias, allowing you to gauge whether buyers or sellers are currently dominating. Use this information to complement your trading decisions, such as identifying potential breakout levels or confirming trend direction.
Limitations
This indicator simulates orderflow data based on candlestick price movement and volume, as TradingView does not provide tick-by-tick data. The volume distribution is an approximation and should be used as a visual aid rather than a definitive measure of market activity.
The indicator operates on the chart's current timeframe and does not incorporate higher timeframe data.
The simulated volumes are scaled using a user-defined lot scaling factor, which may not reflect actual market lot sizes.
Disclaimer
This indicator is for informational purposes only and does not guarantee trading results. Always conduct your own analysis and manage risk appropriately. The simulated orderflow data is an estimation and may not reflect real market conditions.
ICT Concept [TradingFinder] Order Block | FVG | Liquidity Sweeps🔵 Introduction
The "ICT" style is one of the subsets of "Price Action" technical analysis. ICT is a method created by "Michael Huddleston", a professional forex trader and experienced mentor. The acronym ICT stands for "Inner Circle Trader".
The main objective of the ICT trading strategy is to combine "Price Action" and the concept of "Smart Money" to identify optimal entry points into trades. However, finding suitable entry points is not the only strength of this approach. With the ICT style, traders can better understand price behavior and adapt their trading approach to market structure accordingly.
Numerous concepts are discussed in this style, but the key practical concepts for trading in financial markets include "Order Block," "Liquidity," and "FVG".
🔵 How to Use
🟣Order Block
Order blocks are a specific type of "Supply and Demand" zones formed when a series of orders are placed in a block. These orders could be created by banks or other major players. Banks typically execute large orders in blocks during their trading sessions. If they were to enter the market directly with a small quantity, significant price movements would occur before the orders are fully executed, resulting in less profit. To avoid this, they divide their orders into smaller, manageable positions. Traders should look for "buy" opportunities in "demand order blocks" areas and "sell" opportunities in "supply order blocks".
🟣Liquidity
These levels are where traders aim to exit their trades. "Market Makers" or smart money usually collects or distributes their trading positions near levels where many retail traders have placed their "Stop Loss" orders. When the liquidity resulting from these losses is collected, the price often reverses direction.
A "Stop Hunt" is a move designed to neutralize liquidity generated by triggered stop losses. Banks often use significant news events to trigger stop hunts and acquire the liquidity released in the market. If, for example, they intend to execute heavy buy orders, they encourage others to sell through stop hunts.
As a result, if there is liquidity in the market before reaching the order block region, the credibility of that order block is higher. Conversely, if liquidity is near the order block, meaning the price reaches the order block before reaching the liquidity area, the credibility of that order block is lower.
🟣FVG (Fair Value Gap)
To identify the "Fair Value Gap" on the chart, one must analyze candle by candle. Focus on candles with large bodies, examining one candle and the one before it. The candles before and after this central candle should have long shadows, and their bodies should not overlap with the body of the central candle. The distance between the shadows of the first and third candles is called the FVG range.
These zone function in two ways :
•Supply and Demand zone: In this case, the price reacts to these zone, and its trend reverses.
•Liquidity zone: In this scenario, the price "fills" the zone and then reaches the order block.
Important Note: In most cases, FVG zone with very small width act as supply and demand zone, while zone with a significant width act as liquidity zone, absorbing the price.
🔵 Setting
🟣Order Block
Refine Order Block : When the option for refining order blocks is Off, the supply and demand zones encompass the entire length of the order block (from Low to High) in their standard state and remain unaltered. On the option for refining order blocks triggers the improvement of supply and demand zones using the error correction algorithm.
Refine Type : The enhancement of order blocks via the error correction algorithm can be executed through two methods: Defensive and Aggressive. In the Aggressive approach, the widest possible range is taken into account for order blocks.
Show High Levels : If major high levels are to be displayed, set the option for showing high level to Yes.
Show Low Levels : If major low levels are to be displayed, set the option for showing low level to Yes.
Show Last Support : If showing the last support is desired, set the option for showing last support to Yes.
Show Last Resistance : If showing the last resistance is desired, set the option for showing last resistance to Yes.
🟣 FVG
FVG Filter : When FVG filtering is activated, the number of FVG areas undergoes filtration based on the specified algorithm.
FVG Filter Types :
1. Very Aggressive : Apart from the initial condition, an additional condition is introduced. For an upward FVG, the maximum price of the last candle should exceed the maximum price of the middle candle. Similarly, for a downward FVG, the minimum price of the last candle should be lower than the minimum price of the middle candle. This mode eliminates a minimal number of FVGs.
2. Aggressive : In addition to the conditions of the Very Aggressive mode, this mode considers the size of the middle candle; it should not be small. Consequently, a larger number of FVGs are eliminated in this mode.
3. Defensive : Alongside the conditions of the Very Aggressive mode, this mode takes into account the size of the middle candle, which should be relatively large with the majority of it comprising the body. Furthermore, to identify upward FVGs, the second and third candles must be positive, whereas for downward FVGs, the second and third candles must be negative. This mode filters out a considerable number of FVGs, retaining only those of suitable quality.
4. Very Defensive : In addition to the conditions of the Defensive mode, the first and third candles should not be very small-bodied doji candles. This mode filters out the majority of FVGs, leaving only the highest quality ones. Show Demand FVG: Enables the display of demand-related boxes, which can be toggled between off and on. Show Supply FVG: Enables the display of supply-related boxes along the path, which can also be toggled between off and on.
🟣 Liquidity
Statics Liquidity Line Sensitivity : A value ranging from 0 to 0.4. Increasing this value reduces the sensitivity of the "Statics Liquidity Line Detection" function and increases the number of identified lines. The default value is 0.3.
Dynamics Liquidity Line Sensitivity : A value ranging from 0.4 to 1.95. Increasing this value enhances the sensitivity of the "Dynamics Liquidity Line Detection" function and decreases the number of identified lines. The default value is 1.
Statics Period Pivot : Default value is set to 8. By adjusting this value, you can specify the period for static liquidity line pivots.
Dynamics Period Pivot : Default value is set to 3. By adjusting this value, you can specify the period for dynamic liquidity line pivots.
You can activate or deactivate liquidity lines as necessary using the buttons labeled "Show Statics High Liquidity Line," "Show Statics Low Liquidity Line," "Show Dynamics High Liquidity Line," and "Show Dynamics Low Liquidity Line".

Breaker Blocks + Order Blocks confirm [TradingFinder] BBOB Alert🔵 Introduction
In the realm of technical analysis, various tools and concepts are employed to identify key levels on price charts. These tools assist traders in analyzing market trends with greater precision, enabling them to optimize their trading decisions. Among these tools, the Order Block and Breaker Block hold a significant place, serving as effective instruments for analyzing market structure.
🟣 Order Block
An Order Block refers to zones on a chart where large financial institutions and high-volume traders place their orders. Due to the substantial volume of buy or sell orders in these areas, they are often regarded as pivotal points for potential price reversals or temporary pauses in a trend. Order Blocks are particularly crucial when prices react to these zones after a strong market move, acting as strong support or resistance levels.
🟣 Breaker Block
On the other hand, a Breaker Block refers to areas on a chart that previously functioned as Order Blocks but where the price has managed to break through and continue in the opposite direction. These zones are typically recognized as key points where market trends might shift, helping traders identify potential reversal points in the market.
🟣 Overlapping Block (BBOB)
Now, imagine a scenario where these two essential concepts in technical analysis—Order Blocks and Breaker Blocks—overlap on a chart. Although this overlap is not specifically discussed within the ICT (Inner Circle Trader) trading framework, exploring and utilizing this overlap can provide traders with powerful insights into strong support and resistance zones. The combination of these two robust concepts can highlight critical areas in trading, potentially offering significant advantages in making informed trading decisions.
In this article, we will delve into the concept of this overlap, explaining how to utilize it in trading strategies. Additionally, we will analyze the potential outcomes and benefits of incorporating this concept into your trading decisions.
Bullish Overlapping Block (BBOB) :
Bearish Overlapping Block (BBOB) :
🔵 How to Use
The overlap between Order Blocks and Breaker Blocks is a compelling and powerful concept that can help traders identify key levels on the chart with a high probability of success. This overlap is particularly valuable because it combines two well-regarded concepts in technical analysis—zones of high order volume and critical market shifts.
🟣 Here’s how to effectively use this overlap in your trading
1. Dentifying the Overlapping Block : To make the most of the overlap between Order Blocks and Breaker Blocks, begin by identifying these zones separately. Order Blocks are areas where price typically reacts and reverses after a strong market move.
Breaker Blocks are areas where a previous Order Block has been breached, and the price continues in the opposite direction. When these two zones overlap on a chart, it’s crucial to pay close attention to this area, as it represents a high-probability reaction zone.
2. Analyzing the Overlapping Block : After identifying the overlap zone, carefully analyze price action within this region. Candlestick patterns and price behavior can provide essential clues.
If the price reaches this overlap zone and strong reversal patterns such as Pin Bars or Engulfing patterns are observed, it’s likely that this zone will act as a pivotal reversal point. In such cases, entering a trade with confidence becomes more feasible.
3. Entering the Trade : When sufficient signs of price reaction are present in the overlap zone, you can proceed to enter the trade. If the overlap zone is within an uptrend and bullish reversal signals are evident, a long position might be appropriate.
Conversely, if the overlap zone is in a downtrend and bearish reversal signals are observed, a short position would be more suitable.
4. Risk Management : One of the most critical aspects of trading in overlap zones is managing risk. To protect your capital, place your stop loss near the lowest point of the Order Block (for buy trades) or the highest point (for sell trades). This approach minimizes potential losses if the overlap zone fails to hold.
5. Price Targets : After entering the trade, set your price targets based on other key levels on the chart. These targets could include other support and resistance zones, Fibonacci levels, or pivot points.
Bullish Overlapping Block :
Bearish Overlapping Block :
🟣 Benefits of the Overlapping Block Between Order Block and Breaker Block
1. Enhanced Precision in Identifying Key Levels : The overlap between these two zones usually acts as a highly reliable area for price reactions, increasing the accuracy of identifying entry and exit points.
2. Reduced Trading Risk : Given the high importance of the overlap zone, the likelihood of making incorrect decisions is reduced, contributing to overall lower trading risk.
3. Increased Probability of Success : The overlap between Order Blocks and Breaker Blocks combines two powerful concepts, enhancing the likelihood of success in trades, as multiple indicators confirm the importance of the area.
4. Creation of Better Trading Opportunities : Overlap zones often provide traders with more robust trading opportunities, as these areas typically represent strong reversal points in the market.
5. Compatibility with Other Technical Tools : This concept seamlessly integrates with other technical analysis tools such as Fibonacci retracements, trend lines, and chart patterns, offering a more comprehensive market analysis.
🔵 Setting
🟣 Global Setting
Pivot Period of Order Blocks Detector : Enter the desired pivot period to identify the Order Block.
Order Block Validity Period (Bar) : You can specify the maximum time the Order Block remains valid based on the number of candles from the origin.
Mitigation Level Order Block : Determining the basic level of a Order Block. When the price hits the basic level, the Order Block due to mitigation.
Mitigation Level Breaker Block : Determining the basic level of a Breaker Block. When the price hits the basic level, the Breaker Block due to mitigation.
Mitigation Level Overlapping Block : Determining the basic level of a Overlapping Block. When the price hits the basic level, the Overlapping Block due to mitigation.
🟣 Overlapping Block Display
Show All Overlapping Block : If it is turned off, only the last Order Block will be displayed.
Demand Overlapping Block : Show or not show and specify color.
Supply Overlapping Block : Show or not show and specify color.
🟣 Order Block Display
Show All Order Block : If it is turned off, only the last Order Block will be displayed.
Demand Main Order Block : Show or not show and specify color.
Demand Sub (Propulsion & BoS Origin) Order Block : Show or not show and specify color.
Supply Main Order Block : Show or not show and specify color.
Supply Sub (Propulsion & BoS Origin) Order Block : Show or not show and specify color.
🟣 Breaker Block Display
Show All Breaker Block : If it is turned off, only the last Breaker Block will be displayed.
Demand Main Breaker Block : Show or not show and specify color.
Demand Sub (Propulsion & BoS Origin) Breaker Block : Show or not show and specify color.
Supply Main Breaker Block : Show or not show and specify color.
Supply Sub (Propulsion & BoS Origin) Breaker Block : Show or not show and specify color.
🟣 Order Block Refinement
Refine Order Blocks : Enable or disable the refinement feature. Mode selection.
🟣 Alert
Alert Name : The name of the alert you receive.
Alert Overlapping Block Mitigation :
On / Off
Message Frequency :
This string parameter defines the announcement frequency. Choices include: "All" (activates the alert every time the function is called), "Once Per Bar" (activates the alert only on the first call within the bar), and "Once Per Bar Close" (the alert is activated only by a call at the last script execution of the real-time bar upon closing). The default setting is "Once per Bar".
Show Alert Time by Time Zone :
The date, hour, and minute you receive in alert messages can be based on any time zone you choose. For example, if you want New York time, you should enter "UTC-4". This input is set to the time zone "UTC" by default.
🔵 Conclusion
The overlap between Order Blocks and Breaker Blocks represents a critical and powerful area in technical analysis that can serve as an effective tool for determining entry and exit points in trading.
These zones, due to the combination of two key concepts in technical analysis, hold significant importance and can help traders make more confident trading decisions.
Although this concept is not specifically discussed in the ICT framework and is introduced as a new idea, traders can achieve better results in their trades through practice and testing.
Utilizing the overlap between Order Blocks and Breaker Blocks, in conjunction with other technical analysis tools, can significantly improve the chances of success in trading.

Implied Orderblock Breaker (Zeiierman)█ Overview
The Implied Order Block Breaker (Zeiierman) is a tool designed to identify enhanced order blocks with imbalances. These enhanced order blocks represent areas where there is a rapid price movement. Essentially, this indicator uses order blocks and suggests that a swift price movement away from these levels, breaking the current market structure, could indicate an area that the market has not correctly valued. This technique offers traders a unique method to identify potential market inefficiencies and imbalances, serving as a guide for potential price revisits.
The indicator doesn't scan for imbalances in the traditional sense — where there's an absence of trades between two price levels — but instead, it identifies quick movements away from key levels that suggest where an imbalance might exist. Relying on crossovers and cross-unders in conjunction with pivot points and examining the high/low within the same period provides an innovative method for traders to spot these potentially undervalued or overvalued areas in the market. These inferred imbalances can be crucial for traders looking for price levels where the market might make significant moves.
█ How It Works
Bullish
Crossover: The closing price of a bar crosses above a pivot high, which is an indication that buyers are in control and pushing the price upwards.
New Low Within Period: There is a lower low within the same period as the pivot high. This suggests that after setting a high, the market pulled back to set a new low, potentially leaving a price gap on the way up as the price quickly recovers.
Bearish
Crossunder: The closing price of a bar crosses under a pivot low, indicating that sellers are taking control and driving the price down.
New High Within Period: There is a higher high within the same period as the pivot low. This condition suggests that the market rallied to a new high before falling back below the pivot low, potentially leaving a gap on the way down.
█ How to Use
The enhanced order blocks are often revisited, and the price may aim to 'fill' the potential imbalance created by the rapid price movement, thereby presenting traders with potential entry or exit points. This approach aligns with the idea that imbalances are frequently revisited by the market, and when combined with the context of Order Blocks, it provides even more confluence.
Example
Here, if the price drops rapidly after setting a new high—crossing under the pivot low—it may skip over certain price levels, creating a 'gap' that signifies an area where the price might have been overvalued (imbalance), which the market may revisit for a potential price correction or revaluation.
█ Settings
Period: Determines the number of bars used for identifying pivot highs and lows. A higher value gives more significant but less frequent signals, while a lower value increases sensitivity but might give more false positives.
Pivot Surrounding: Specifies the number of candles to analyze around a pivot point. Increasing this value broadens the analysis range, potentially capturing more setups but possibly including less significant ones.
-----------------
Disclaimer
The information contained in my Scripts/Indicators/Ideas/Algos/Systems does not constitute financial advice or a solicitation to buy or sell any securities of any type. I will not accept liability for any loss or damage, including without limitation any loss of profit, which may arise directly or indirectly from the use of or reliance on such information.
All investments involve risk, and the past performance of a security, industry, sector, market, financial product, trading strategy, backtest, or individual's trading does not guarantee future results or returns. Investors are fully responsible for any investment decisions they make. Such decisions should be based solely on an evaluation of their financial circumstances, investment objectives, risk tolerance, and liquidity needs.
My Scripts/Indicators/Ideas/Algos/Systems are only for educational purposes!

Higher order Orderblocks + Breakerblocks + Range + AlertsThis script identifies Orderblocks, Breakerblocks and Range using higher order pivots and priceaction logic.
I tried to reduce the number of blocks to make the chart cleaner, for this purpose I use only second order pivots for both MSB lines and supply/demand boxes, I also tried to filter out shifts in MS and false breakouts.
Any box has GRAY color until it gets tested.
After successful test box gets colors:
RED for Supply
GREEN for Demand
BLUE for any Breakerblocks
For cleaner chart and script speed all broken boxes deletes from chart.
It gives comparatively clean chart on any TF, even on extra small (5m, 3m, 1m).
For Range there is option to plot 0.25, 0.5, 0.75 lines.
I usually use log scale on charts and there is an option to use it for proper range mean.
In previous my scripts i have requests to make alerts and this time i made it.
It has customizable alert catching all needed alerts into one output:
- Alert MSB - when market structure changes alert will inform you about its direction, MSB line and new Demand/Supply.
- Alert Orderblock or Breakerblock test - alerts when block was tested and it holds (in other words when it get RED/GREEN/BLUE colors)
- Alert New Range - when new range detected
- Alert Range test - alerts when range top or botoom was tested and it holds.
some examples :

CVD Absorption + Confirmation [Orderflow & Volume]This indicator detects bullish and bearish absorption setups by combining Cumulative Volume Delta (CVD) with price action, candlestick, and volume confirmations.
🔹 What is Absorption?
Absorption happens when aggressive buyers/sellers push CVD to new highs or lows, but price fails to follow through.
Bearish absorption: CVD makes a higher high, but price does not.
Bullish absorption: CVD makes a lower low, but price does not.
This often signals that limit orders are absorbing aggressive market orders, creating potential reversal points.
🔹 Confirmation Patterns
Absorption signals are only shown if they are validated by one of the following patterns:
Engulfing candle with low volume → reversal faces little resistance.
Engulfing candle with high volume → strong aggressive participation.
Pin bar with high volume → absorption visible in the wick.
CVD flattening / slope reversal → shift in aggressive order flow.
🔹 Signals
✅ Bullish absorption confirmed → Green label below the bar.
❌ Bearish absorption confirmed → Red label above the bar.
Each label represents a potential reversal setup after orderflow absorption is validated.
🔹 Alerts
Built-in alerts are included for both bullish and bearish confirmations, so you can track setups in real-time without watching the chart 24/7.
📌 How to Use:
Best applied at key levels (supply/demand, VWAP, OR, liquidity zones).
Look for confluence with your trading strategy before taking entries.
Works on all markets and timeframes where volume is reliable.

Efficiency Weighted OrderFlow [AlgoAlpha]Introducing the Efficiency Weighted Orderflow Indicator by AlgoAlpha! 📈✨
Elevate your trading game with our cutting-edge Efficiency Weighted Orderflow Indicator, designed to provide clear insights into market trends and potential reversals. This tool is perfect for traders seeking to understand the underlying market dynamics through efficiency-weighted volume calculations.
🌟 Key Features 🌟
✨ Smooth OrderFlow Calculation : Option to smooth order flow data for more consistent signals.
🔧 Customizable Parameters : Adjust the Order Flow Period and HMA Smoothing Length to fit your trading strategy.
🔍 Visual Clarity : Easily distinguish between bullish and bearish trends with customizable colors.
📊 Standard Deviation Normalization : Keeps order flow values normalized for better comparison across different market conditions.
🔔 Trend Reversal Alerts : Stay ahead with built-in alert conditions for significant order flow changes.
🚀 Quick Guide to Using the Efficiency Weighted Orderflow Indicator
🛠 Add the Indicator: Search for "Efficiency Weighted Orderflow " in TradingView's Indicators & Strategies. Customize settings like smoothing and order flow period to fit your trading style.
📊 Market Analysis: Watch for trend reversal alerts to capture trading opportunities by studying the behaviour of the indicator.
🔔 Alerts: Enable notifications for significant order flow changes to stay updated on market trends.
🔍 How It Works
The Efficiency Weighted Orderflow Indicator starts by calculating the efficiency of price movements using the absolute difference between the close and open prices, divided by volume. The order flow is then computed by summing these efficiency-weighted volumes over a specified period, with an option to apply Hull Moving Average (HMA) smoothing for enhanced signal stability. To ensure robust comparison, the order flow is normalized using standard deviation. The indicator plots these values as columns, with distinct colors representing bullish and bearish trends. Customizable parameters for period length and smoothing allow traders to tailor the indicator to their strategies. Additionally, visual cues and alert conditions for trend reversals and significant order flow changes keep traders informed and ready to act. This indicator improves on the Orderflow aspect of our Standardized Orderflow indicator. The Efficiency Weighted Orderflow is less susceptible to noise and is also quicker at detecting trend changes.
Volume Order Blocks [BigBeluga]Volume Order Blocks is a powerful indicator that identifies significant order blocks based on price structure, helping traders spot key supply and demand zones. The tool leverages EMA crossovers to determine the formation of bullish and bearish order blocks while visualizing their associated volume and relative strength.
🔵 Key Features:
Order Block Detection via EMA Crossovers:
Plots bullish order blocks at recent lows when the short EMA crosses above the long EMA.
Plots bearish order blocks at recent highs when the short EMA crosses below the long EMA.
Uses customizable sensitivity through the “Sensitivity Detection” setting to fine-tune block formation.
Volume Collection and Visualization:
Calculates the total volume between the EMA crossover bar and the corresponding high (bearish OB) or low (bullish OB).
Displays the absolute volume amount next to each order block for clear volume insights.
Percentage Volume Distribution:
Shows the percentage distribution of volume among bullish or bearish order blocks.
100% represents the cumulative volume of all OBs in the same category (bullish or bearish).
Order Block Removal Conditions:
Bullish order blocks are removed when the price closes below the bottom of the block.
Bearish order blocks are removed when the price closes above the top of the block.
Helps maintain chart clarity by only displaying relevant and active levels.
Midline Feature:
Dashed midline inside each order block indicates the midpoint between the upper and lower boundaries.
Traders can toggle the midline on or off through the settings.
Shadow Trend:
Shadow Trend dynamically visualizes trend strength and direction by adapting its color intensity based on price movement.
🔵 Usage:
Supply & Demand Zones: Use bullish and bearish order blocks to identify key market reversal or continuation points.
Volume Strength Analysis: Compare volume percentages to gauge which order blocks hold stronger market significance.
Breakout Confirmation: Monitor block removal conditions for potential breakout signals beyond support or resistance zones.
Trend Reversals: Combine EMA crossovers with order block formation for early trend reversal detection.
Risk Management: Use OB boundaries as potential stop-loss or entry points.
Volume Order Blocks is an essential tool for traders seeking to incorporate volume-based supply and demand analysis into their trading strategy. By combining price action, volume data, and EMA crossovers, it offers a comprehensive view of market structure and potential turning points.

Price Action Volumetric Order Blocks [UAlgo]"Price Action Volumetric Order Blocks" indicator aims to identify significant price zones in the market based on a combination of price action and volume analysis. It utilizes the concept of "Order Blocks," which are areas on the chart where large orders are believed to have been placed, influencing price behavior. By analyzing price swings and volume activity, the indicator attempts to highlight potential support and resistance levels.
🔶 Key Features
Swing Length: This input allows you to adjust the timeframe used to identify price swings for order block detection. A longer swing length will focus on larger timeframes and potentially capture stronger order blocks.
Show Last X Order Blocks: This controls the number of order blocks displayed on the chart. You can choose to visualize a specific number of the most recent order blocks.
Violation Check: This setting determines how the indicator identifies potential order block violations. You can choose between "Wick" or "Close" violations. A "Wick" violation occurs when the price (wick) extends beyond the order block boundaries, while a "Close" violation signifies that the closing price breaches the order block.
Hide Overlap: This option allows you to manage the display of overlapping order blocks. If set to "True," only non-overlapping order blocks will be shown, potentially offering a clearer visualization.
Colors: You can customize the color scheme for bullish (upward) and bearish (downward) order blocks to enhance visual clarity on the chart.
🔶 Interpreting the Indicator
Order Blocks: The teal-colored boxes represent bullish order blocks, indicating areas of demand where buying pressure is likely to be strong. Red-colored boxes represent bearish order blocks, indicating areas of supply where selling pressure is likely to be dominant. These zones often signal potential reversal points or consolidation areas.
Strength Calculations: The indicator calculates the relative strength of bullish and bearish blocks based on volume. A higher bullish strength indicates stronger buying pressure, while higher bearish strength suggests more selling pressure. Traders can use this information to gauge the strength of a price level and predict future price movements.
Market Structure Lines: The indicator displays horizontal lines to depict the current market structure, labeled as "MSB" (Market Sell Balance) or "BOS" (Break of Structure). These lines can help visualize the prevailing trend direction.
Order Block Violations: When a price wick or close breaches an order block (depending on the chosen violation type), the corresponding order block visualization is removed from the chart. This can signify a potential weakening of the identified support or resistance zone.
🔶 Disclaimer
Use with Caution: This indicator is provided for educational and informational purposes only and should not be considered as financial advice. Users should exercise caution and perform their own analysis before making trading decisions based on the indicator's signals.
Not Financial Advice: The information provided by this indicator does not constitute financial advice, and the creator (UAlgo) shall not be held responsible for any trading losses incurred as a result of using this indicator.
Backtesting Recommended: Traders are encouraged to backtest the indicator thoroughly on historical data before using it in live trading to assess its performance and suitability for their trading strategies.
Risk Management: Trading involves inherent risks, and users should implement proper risk management strategies, including but not limited to stop-loss orders and position sizing, to mitigate potential losses.
No Guarantees: The accuracy and reliability of the indicator's signals cannot be guaranteed, as they are based on historical price data and past performance may not be indicative of future results.

Dynamic Order Blocks [LuxAlgo]The Dynamic Order Blocks indicator displays the most recent unmitigated bullish and bearish order blocks on the chart, providing dynamic support/resistance areas.
When price sweeps an order block, this is highlighted by the script indicating a potential reversal.
The average between the displayed order blocks is also displayed.
🔶 USAGE
Order blocks are a popular method of price action analysis, representing price areas where more significant market participants accumulate their orders.
Displaying order blocks dynamically allows obtaining relevant areas of support/resistance. Users can obtain longer-term order blocks using a higher "Swing Lookback" setting.
Users can also use mitigation events to assess the current trend direction, with price mitigating a bearish order block (breaking above the upper extremity) indicating an uptrend, and price mitigating a bullish order block (breaking below the lower extremity) indicating a downtrend.
🔹 Average Level
An average level obtained from the displayed bullish and bearish order blocks is included in the indicator and offers an additional polyvalent dynamic support/resistance level.
The change of direction of the average line can also be indicative of the current trend direction.
🔹 Dynamic Sweeps
Price sweeping the mitigation level of an order block is highlighted on the chart using bordered rectangles. These highlight a breakout failure and can be indicative of a potential reversal.
🔶 SETTINGS
Swing Lookback: Period of the swing detection used to construct order blocks. Higher values will return longer-term order blocks.
Use Candle Body: Use the candle body as the order block area instead of the candle full range.
