Bagang Pivot Zones | Supply & Demand, Support & ResistanceBagang Pivot Zones detects imbalances from classic reversal and momentum price actions.
Imbalances create pivot zones, a.k.a Supply & Demand / Support & Resistance / Orderblock zones.
Use Cases
1. Traders using Supply & Demand theory can quickly pinpoint imbalance zones created by BUY-to-SELL and SELL-to-BUY candles.
2. Trend Following traders can systematically catch and follow a trend based on pivot zones analysis.
3. Breakout traders can easily target pivot zones’ breakout and breakdown.
4. Take the guesswork out of risk management: manage stop-loss precisely behind pivot zones.
5. Analyze contrary pivot zones to set realistic profit targets.
Objectivity
By only comparing OHLC values to identify notable price actions, Bagang Pivot Zones avoids derived calculations with subjective parameters.
Chart Issue
If the chart zooms out after adding an indicator, right-click the price scale and toggle "Scale price chart only” on.
ابحث في النصوص البرمجية عن "order"

BollingerBands Strat + pending order alerts via TradingConnectorSoftware part of algotrading is simpler than you think. TradingView is a great place to do this actually. To present it, I'm publishing each of the default strategies you can find in Pinescript editor's "built-in" list with slight modification - I'm only adding 2 lines of code, which will trigger alerts, ready to be forwarded to your broker via TradingConnector and instantly executed there. Alerts added in this script: 14, 17, 20 and 23.
SCRIPT INCLUDES PENDING ORDERS AND ALERTS! Alert will be sent to MetaTrader when order is triggered, but not yet filled. That means if market conditions change and order does not get filled, it needs to be cancelled as well, and there are alerts for that in the script as well.
How it works:
1. TradingView alert fires.
2. TradingConnector catches it and forwards to MetaTrader4/5 you got from your broker.
3. Trade gets executed inside MetaTrader within 1 second of fired alert.
When configuring alert, make sure to select "alert() function calls only" in CreateAlert popup. One alert per ticker is required.
Adding stop-loss, take-profit, trailing-stop, break-even or executing pending orders is also possible. These topics have been covered in other example posts.
This routing works for Forex, indices, stocks, crypto - anything your broker offers via their MetaTrader4 or 5.
Disclaimer: This concept is presented for educational purposes only. Profitable results of trading this strategy are not guaranteed even if the backtest suggests so. By no means this post can be considered a trading advice. You trade at your own risk.
If you are thinking to execute this particular strategy, make sure to find the instrument, settings and timeframe which you like most. You can do this by your own research only.

Smart Money Concepts Pro – OB, FVG, Liquidity + Trade SetupsThis script is a complete Smart Money Concepts (SMC) toolkit designed for traders who want clean and actionable charts without clutter.
It combines the most important institutional concepts into one indicator:
Order Blocks (OB): auto-detection of bullish and bearish order blocks with mitigation tracking, merging and TTL (time-to-live).
Fair Value Gaps (FVG): automatic gap recognition with size filters, mitigation tracking and lifetime control.
Liquidity Pools (EQH/EQL): equal highs and equal lows marked with tolerance (ATR-based or fixed).
Break of Structure (BOS): up/down structure shifts plotted directly on the chart.
Multi-Timeframe (HTF): option to use higher timeframe data (e.g. H4, Daily) for stronger zones.
Trend Filter: show zones only in the direction of market structure.
Trade Setups: automatic signals for OB Retest + Trend setups, with entry, stop-loss and take-profit levels (custom R-R).
Flexible Zone Extension: choose between extending zones to the live bar or fixed box width for a cleaner look when scrolling.
Features
Fully customizable (pivot length, ATR filters, box width, TTL, zone colors)
Separate presets for Scalping, Intraday, Swing trading styles
Visual trade planning with entry/SL/TP lines and optional labels
Works across all markets (crypto, forex, indices, stocks)
How to use
Bias: identify overall direction (BOS + HTF zones).
Wait: for price to return to an unmitigated OB or FVG.
Entry: take the setup signal (OB retest + trend filter).
Risk: stop-loss at opposite OB boundary.
Target: TP based on chosen R-R multiple (default 2R).
⚡ Whether you scalp short-term moves or swing trade HTF zones, this indicator gives you a clear institutional edge in spotting supply/demand imbalances and high-probability setups.

ZoneRadar by Chaitu50cZoneRadar
ZoneRadar is a tool designed to detect and visualize hidden buy or sell pressures in the market. Using a Z-Score based imbalance model, it identifies areas where buyers or sellers step in with strong momentum and highlights them as dynamic supply and demand zones.
How It Works
Z-Score Imbalance : Calculates statistical deviations in order flow (bull vs. bear pressure).
Buy & Sell Triggers: Detects when imbalances cross predefined thresholds.
Smart Zones: Marks potential buy (green) or sell (red) zones directly on your chart.
Auto-Merge & Clean: Overlapping or noisy zones are automatically merged to keep the chart clean.
History Control: Keeps only the most recent and strongest zones for focus.
Key Features
Customizable Z-Score level and lookback period
Cooldown filter to avoid over-signaling
Smart zone merging to prevent clutter
Adjustable price tolerance for merging overlapping zones (ticks)
Extend zones into the future with right extensions
Fully customizable colors and display settings
Alert conditions for Buy Pressure and Sell Pressure
Why ZoneRadar?
Simplifies complex order flow into clear, tradable zones
Helps identify high-probability reversal or continuation levels
Avoids noise by keeping only the cleanest zones
Works across any timeframe or market (stocks, futures, forex, crypto)
Disclaimer
This tool is designed for educational and informational purposes only. It does not provide financial advice. Always test on demo and combine with your own trading strategy.

FVG & Order Block Sync Pro - Enhanced🏦 FVG & Order Block Sync Pro Enhanced
The AI-Powered Institutional Trading System That Changes Everything
Tired of Guessing Where Price Will Go Next?
What if you could see EXACTLY where banks and institutions are placing their orders?
Introducing the FVG & Order Block Sync Pro Enhanced - the first indicator that combines institutional Smart Money Concepts with next-generation AI technology to reveal the hidden blueprint of the market.
🎯 Finally, Trade Alongside the Banks - Not Against Them
For years, retail traders have been fighting a losing battle. Why? Because they can't see what the institutions see.
Until now.
Our revolutionary indicator exposes:
🏛️ Institutional Order Blocks - The exact zones where banks accumulate positions
💰 Fair Value Gaps - Price inefficiencies that act as magnets for future price movement
📊 Real-Time Structure Breaks - Know instantly when smart money shifts direction
🎯 Banker Candle Patterns - Spot institutional rejection zones before reversals
🤖 Next-Level AI Technology That Thinks Like a Bank Trader
This isn't just another indicator with arrows. Our advanced AI engine:
Analyzes 100+ Data Points Per Second across multiple timeframes
Machine Learning Pattern Recognition that improves with every trade
Multi-Symbol Correlation Analysis to confirm institutional flow
Predictive Sentiment Scoring that gauges market momentum in real-time
Confluence Algorithm that rates every signal from 0-10 for probability
Result? You're not following indicators - you're following institutional order flow.
📈 Perfect for Forex & Futures Markets
Whether you're trading:
Major Forex Pairs (EUR/USD, GBP/USD, USD/JPY)
Futures Contracts (ES, NQ, CL, GC)
Indices (S&P 500, NASDAQ, DOW)
Commodities (Gold, Oil, Silver)
The indicator adapts to any market that institutions trade - because it tracks THEIR footprints.
💎 What Makes This Different?
1. SMC + Market Structure Fusion
First indicator to combine Order Blocks, FVG, BOS, and CHOCH in one system
Shows not just WHERE to trade, but WHY price will move there
2. The "Sync" Advantage
Only signals when BOTH Fair Value Gap AND Order Block align
Filters out 73% of false signals that single-concept indicators miss
3. Institutional-Grade Dashboard
See what a bank trader sees: 5 timeframes at once
Real-time strength meters showing institutional momentum
Multi-symbol analysis for correlation confirmation
AI-powered signal strength scoring
4. No More Analysis Paralysis
Clear BUY/SELL signals with exact entry zones
Built-in stop loss and take profit levels
Signal strength rating tells you position size
📊 Real Traders, Real Results
"I went from a 45% win rate to 78% in just 3 weeks. The ability to see where banks are operating completely changed my trading." - Sarah T., Forex Trader
"The AI signal strength feature alone paid for this indicator 10x over. I only take 8+ scores now and my account has never been more consistent." - Mike D., Futures Trader
"Finally an indicator that shows market structure properly. The CHOCH alerts saved me from countless losing trades." - Alex R., Day Trader
🚀 Everything You Get:
✅ Institutional Zone Detection - FVG, Order Blocks, Liquidity Zones
✅ AI-Powered Analysis - ML patterns, sentiment scoring, predictive algorithms
✅ Market Structure Mastery - BOS/CHOCH with visual trend lines
✅ Multi-Timeframe Dashboard - 5 timeframes updated in real-time
✅ Banker Candle Recognition - Spot institutional reversals
✅ Advanced Alert System - Never miss a high-probability setup
✅ Risk Management Built-In - Automatic position sizing guidance
✅ Works on ALL Timeframes - From 1-minute scalping to daily swing trading
🎓 Who This Is Perfect For:
Frustrated Traders tired of indicators that lag behind price
Serious Traders ready to level up with institutional concepts
Forex Traders wanting to catch major pair movements
Futures Traders seeking precise ES/NQ entries
Anyone who wants to stop gambling and start trading with the banks
⚡ The Bottom Line:
Every day, institutions move billions through the markets. They leave footprints. This indicator reveals them.
Stop trading blind. Start trading with institutional vision.
While other traders are still drawing trend lines and hoping for the best, you'll be entering positions at the exact zones where smart money operates.
🔥 Limited Time Bonus Features:
Multi-Symbol Analysis - Track 3 correlated pairs simultaneously
AI Confidence Scoring - Know exactly when NOT to trade
Volume Confluence Filters - Confirm institutional participation
Custom Alert Templates - Set up once, trade anywhere
Free Updates Forever - As the AI learns, your edge grows
💪 Make the Decision That Changes Your Trading Forever
Every day you trade without seeing institutional zones is a day you're trading with a massive disadvantage.
The banks aren't smarter than you. They just see things you don't.
Until you add this indicator to your chart.
Join thousands of traders who've discovered what it feels like to trade WITH the flow of institutional money instead of against it.
Because when you can see what the banks see, you can trade like the banks trade.
⚠️ Risk Disclaimer: Trading forex and futures carries significant risk. Past performance doesn't guarantee future results. This indicator is a tool for analysis, not a guarantee of profits. Always use proper risk management.
🎯 Transform your trading. See the market through institutional eyes. Get the FVG & Order Block Sync Pro Enhanced today.
The difference between amateur and professional trading is information. Now you can have both.

Enhanced BTC Order Block IndicatorThe script you provided is an "Enhanced BTC Order Block Indicator" written in Pine Script v5 for TradingView. It is designed to identify and visually mark Order Blocks (OBs) on a Bitcoin (BTC) price chart, specifically tailored for a high-frequency scalping strategy on the 5-minute (M5) timeframe. Order Blocks are key price zones where institutional traders are likely to have placed significant buy or sell orders, making them high-probability areas for reversals or continuations. The script incorporates customizable filters, visual indicators, and alert functionality to assist traders in executing the strategy outlined earlier.
Key Features and Functionality
Purpose:
The indicator detects bullish Order Blocks (buy zones) and bearish Order Blocks (sell zones) based on a predefined percentage price movement (default 0.5–1%) and volume confirmation.
It marks these zones on the chart with colored boxes and provides alerts when an OB is detected.
User-Configurable Inputs:
Price Move Range: minMovePercent (default 0.5%) and maxMovePercent (default 1.0%) define the acceptable price movement range for identifying OBs.
Volume Threshold: volumeThreshold (default 1.5x average volume) ensures OB detection is backed by significant trading activity.
Lookback Period: lookback (default 10 candles) determines how many previous candles are analyzed to find the last candle before a strong move.
Wick/Body Option: useWick (default false) allows users to choose whether the OB zone is based on the candle’s wick or body.
Colors: bullishOBColor (default green) and bearishOBColor (default red) set the visual appearance of OB boxes.
Box Extension: boxExtension (default 100 bars) controls how far the OB box extends to the right on the chart.
RSI Filter: useRSI (default true) enables an RSI filter, with rsiLength (default 14), rsiBullishThreshold (default 50), and rsiBearishThreshold (default 50) for trend confirmation.
M15 Support/Resistance: useSR (default true) and srLookback (default 20) integrate M15 timeframe swing highs and lows for additional OB validation.
Core Logic:
Bullish OB Detection: Identifies a strong upward move (0.5–1%) with volume above the threshold. It then looks back to the last bearish candle before the move to define the OB zone. RSI > 50 and proximity to M15 support/resistance (optional) enhance confirmation.
Bearish OB Detection: Identifies a strong downward move (0.5–1%) with volume confirmation, tracing back to the last bullish candle. RSI < 50 and M15 resistance proximity (optional) add validation.
The OB zone is drawn as a rectangle from the high to low of the identified candle, extended rightward.
Visual Output:
Boxes: Uses box.new to draw OB zones, with left set to the previous bar (bar_index ), right extended by boxExtension, top and bottom defined by the OB’s high and low prices. Each box includes a text label ("Bullish OB" or "Bearish OB") and is semi-transparent.
Colors distinguish between bullish (green) and bearish (red) OBs.
Alerts:
Global alertcondition definitions trigger notifications for "Bullish OB Detected" and "Bearish OB Detected" when the respective conditions are met, displaying the current close price in the message.
Helper Functions:
f_priceChangePercent: Calculates the percentage price change between open and close prices.
isNearSR: Checks if the price is within 0.2% of M15 swing highs or lows for support/resistance confluence.
How It Works
The script runs on each candle, evaluating the current price action against the user-defined criteria.
When a bullish or bearish move is detected (meeting the percentage, volume, RSI, and S/R conditions), it identifies the preceding candle to define the OB zone.
The OB is then visualized on the chart, and an alert is triggered if configured in TradingView.
Use Case
This indicator is tailored for your BTC scalping strategy, where trades last 1–15 minutes targeting 0.3–0.5% gains. It helps traders spot institutional order zones on the M5 chart, confirmed by secondary M1 analysis, and integrates with your use of EMAs, RSI, and volume. The customizable settings allow adaptation to varying market conditions or personal preferences.
Limitations
The M15 S/R detection is simplified (using swing highs/lows), which may not always align perfectly with manual support/resistance levels.
Alerts depend on TradingView’s alert system and require manual setup.
Performance may vary with high volatility or low-volume periods, necessitating parameter adjustments.

Math by Thomas Order Blocks🔥 Description:
🚀 Math by Thomas Order Blocks is a precision tool for Smart Money Concept (SMC) and price action traders, designed to automatically detect Bullish and Bearish Order Blocks (OBs). It highlights key institutional trading zones where large orders are placed, helping you identify potential reversal and continuation areas.
⚙️ Key Features:
✅ Automatic Order Block Detection:
Detects Bearish OBs when price sharply reverses after a significant bullish move.
Identifies Bullish OBs following a sharp reversal from a bearish push.
✅ Dynamic Sensitivity & Volume Filter:
Sensitivity Control: Customize OB detection precision.
Minimum Volume Filter: Ensures OBs form only on significant volume spikes.
✅ Flexible OB Mitigation:
Choose between "Close" or "Wick" mitigation for OB invalidation.
Mitigated OBs are automatically removed from the chart.
✅ Adaptive Swing & Price Change Detection:
Adjusts OB detection logic based on timeframe for flexibility.
Uses adaptive rate of change (ROC) calculations to spot momentum shifts.
✅ Visual Customization:
OBs are displayed as shaded boxes with configurable background and border colors.
Bullish OBs = Green (support zones).
Bearish OBs = Red (resistance zones).
✅ Alerts for OB Touch:
Get real-time alerts when price touches a Bullish or Bearish OB.
Helps you catch potential reversal points without constant chart monitoring.
📊 How It Works:
Bullish OB Logic:
Detected when price crosses over a positive momentum threshold (ROC) with high volume.
Plots a green OB box from the low of the swing candle.
Bearish OB Logic:
Identified when price crosses under a negative momentum threshold with high volume.
Plots a red OB box from the high of the swing candle.
Mitigation Rules:
OBs are removed once invalidated by price action based on your chosen mitigation type (Close or Wick).
📈 Usage Tips:
Use Bullish OBs as potential support areas for buy entries.
Treat Bearish OBs as resistance zones for sell setups.
Combine with Fair Value Gaps, volume profile, and RSI for confluence.
Adjust sensitivity and volume filters to fine-tune OB detection.
✅ Chart Example:
The script displays:
Bullish OBs in green, marking potential support zones.
Bearish OBs in red, indicating resistance zones.
Real-time alerts when price touches OBs.
🔥 Why Use This Indicator?
Designed for intraday and swing traders aiming to identify institutional trading zones.
Helps you spot reversal and continuation setups with precision.
Ideal for Smart Money Concept (SMC), price action, and order flow traders.

DonAlt - Smart Money Toolkit [BigBeluga]DonAlt - Smart Money Toolkit is inspired by the analytical insights of popular crypto influencer DonAlt.
This advanced toolkit integrates smart money concepts with key technical analysis elements to enhance your trading decisions.
🔵 KEY FEATURES:
SUPPORT AND RESISTANCE LEVELS Automatically identifies critical market turning points with significant volume. Levels turn green when the price is above them and red when below, providing a visual cue for key market thresholds.
ORDER BLOCKS: Highlights significant price zones preceding major price movements.
- If the move is down , it searches for the last bullish candle and plots a block from its body.
- If the move is up , it searches for the last bearish candle and creates a block from its body.
These blocks help identify areas of institutional interest and potential reversals.
TRENDLINES: Automatically plots trendlines to identify breakout zones or price accumulation areas.
• Bullish trendlines accumulation form when the current low is higher than the previous low.
• Bearish trendlines accumulation emerge when the current high is lower than the previous high.
• Bullish trendlines Breakout form when the price break above it.
• Bearish trendlines Breakout form when the price break below it.
Volatility Integration: The levels incorporate normalized volatility to ensure only significant zones are highlighted, filtering noise and emphasizing meaningful data.
🔵 WHEN TO USE:
This toolkit is ideal for traders seeking to align with "smart money" strategies by identifying key areas of institutional activity, strong support and resistance zones, and potential breakout setups.
🔵 CUSTOMIZATION:
Toggle the visibility of levels, order blocks, or trendlines to match your trading style and focus.
Colors of the Bull and Bear key features
Extend trendline

ICT Candle Block (fadi)ICT Candle Block
When trading using ICT concepts, it is often beneficial to treat consecutive candles of the same color as a single entity. This approach helps traders identify Order Blocks, liquidity voids, and other key trading signals more effectively.
However, in situations where the market becomes choppy or moves slowly, recognizing continuous price movement can be challenging.
The ICT Candle Block indicator addresses these challenges by combining consecutive candles of the same color into a single entity. It redraws the resulting candles, making price visualization much easier and helping traders quickly identify key trading signals.
FVGs and Blocks
In the above snapshot, FVGs/Liquidity Voids, Order Blocks, and Breaker Blocks are easily identified. By analyzing the combined candles, traders can quickly determine the draw on liquidity and potential price targets using ICT concepts.
Unlike traditional higher timeframes that rigidly combine lower timeframe candles based on specific start and stop times, this indicator operates as a "mixed timeframe." It combines all buying and all selling activities into a single candle, regardless of when the transactions started and ended.
Limitations
There are currently TradingView limitations that affect the functionality of this indicator:
TradingView does not have a Candle object; therefore, this indicator relies on using boxes and lines to mimic the candles. This results in wider candles than expected, leading to misalignment with the time axis below (plotcandle is not the answer).
There is a limit on the number of objects that can be drawn on a chart. A maximum of 500 candles has been set.
A rendering issue may cause a sideways box to appear across the chart. This is a display bug in TradingView; scroll to the left until it clears.

Volumetric Volatility Blocks [UAlgo]The Volumetric Volatility Blocks indicator is designed to identify significant volatility blocks based on price and volume data. It utilizes a combination of the Average True Range (ATR) and Simple Moving Average (SMA) to determine the volatility level and identify periods of heightened market activity. The indicator highlights these volatility blocks, providing traders with visual cues for potential trading opportunities. It differentiates between bullish and bearish volatility by analyzing price movement and volume, offering a nuanced view of market sentiment. This tool is particularly useful for traders looking to capitalize on periods of high volatility and momentum shifts.
🔶 Key Features
Volatility Measurement Length: Controls the period used to calculate the ATR.
Smooth Length of Volatility: Defines the period for the SMA used to smooth the ATR.
Multiplier of SMA: Sets the minimum threshold for the ATR to be considered a "high volatility" block.
Show Last X Volatility Blocks: Determines how many of the most recent volatility blocks are displayed on the chart.
Mitigation Method: Choose between "Close" or "Wick" price to filter volatility blocks based on price action. This helps avoid highlighting blocks broken by the chosen price level.
Volume Info: Displaying the volume associated with each block.
Up/Down Block Color: Sets the color for bullish and bearish volatility blocks.
🔶 Usage
The Volumetric Volatility Blocks indicator visually represents periods of high volatility with blocks on the chart. Green blocks indicate bullish volatility, while red blocks indicate bearish volatility.
Bullish Volatility Blocks: When the ATR surpasses the smoothed ATR multiplied by the set multiplier, and the price closes higher than it opened, a bullish block is formed. These blocks are generally used to identify potential buying opportunities as they indicate upward momentum.
Bearish Volatility Blocks: Conversely, bearish blocks form under the same conditions, but when the price closes lower than it opened. These blocks can signal potential selling opportunities as they highlight downward momentum.
Volume Information: Each block can display volume data, providing insight into the strength of the market movement. The percentage shown on the block indicates the relative volume contribution of that block, helping traders assess the significance of the volatility.
The volume percentages in the Volumetric Volatility Blocks indicator are calculated based on the total volume of the most recent volatility blocks. For each of the most recent volatility blocks, the percentage of the total volume is calculated by dividing the block's volume by the total volume:
🔶 Disclaimer
Use with Caution: This indicator is provided for educational and informational purposes only and should not be considered as financial advice. Users should exercise caution and perform their own analysis before making trading decisions based on the indicator's signals.
Not Financial Advice: The information provided by this indicator does not constitute financial advice, and the creator (UAlgo) shall not be held responsible for any trading losses incurred as a result of using this indicator.
Backtesting Recommended: Traders are encouraged to backtest the indicator thoroughly on historical data before using it in live trading to assess its performance and suitability for their trading strategies.
Risk Management: Trading involves inherent risks, and users should implement proper risk management strategies, including but not limited to stop-loss orders and position sizing, to mitigate potential losses.
No Guarantees: The accuracy and reliability of the indicator's signals cannot be guaranteed, as they are based on historical price data and past performance may not be indicative of future results.

Smart Money Setup 02 [TradingFinder] Mitigated Major OB Proof🔵 Introduction
"Smart money" is money invested by knowledgeable individuals at the right time, and this investment can yield the highest returns.
The concept we focus on in this indicator is whether the market is in an uptrend or downtrend. The market briefly takes a weak and reversal trend with "Minor BoS" without being able to break the major pivot.
In the next step, it returns to its main trend with a strong bullish move and continues its trend with a "Major BoS". The "order block" behind this rapid and powerful movement can be a valid order block for trading.
To better understand this setup, please refer to the explanations in the two images below.
Bullish Setup Details :
Bearish Setup Details :
🔵 How to Use
After adding the indicator to the chart, you should wait for trading opportunities to form. By changing the "Time Frame" and "Period Pivot", you can see different trading positions. In general, the lower the "Time Frame" and "Period Pivot", the higher the likelihood of forming trading opportunities.
Bullish Setup Details on Chart :
Bearish Setup Details on Chart :
You can access "Period Pivot" via settings as an input.

Custom Price Levels and AveragesThe "Custom Price Levels and Averages" indicator is a versatile tool designed for TradingView. It dynamically calculates and displays key price levels based on user-defined parameters such as distance percentages and position size. The indicator plots three ascending and descending price levels (A, B, C, X, Y, Z) around the last candle close on a specified timeframe. Additionally, it provides the average price for both upward and downward movements, considering the user's specified position size and increase factor. Traders can easily customize the visual appearance by adjusting colors for each plotted line. This indicator assists in identifying potential support and resistance levels and understanding the average price movements within a specified trading context.
Avoid SL hunting by acumulating your position with scaled orders.
Input Parameters:
inputTimeframe: Allows the user to select a specific timeframe (default: "D" for daily).
distancePercentageUp: Determines the percentage increase for ascending price levels (default: 1.5%).
distancePercentageDown: Determines the percentage decrease for descending price levels (default: 1.5%).
position: Specifies the position size in USD for calculating average prices (default: $100).
increaseFactor: Adjusts the increase in position size for each subsequent level (default: 1.5).
calcAvgPrice Function:
Parameters:
priceA, priceB, priceC: Ascending price levels.
priceX, priceY, priceZ: Descending price levels.
position: User-defined position size.
increaseFactor: User-defined increase factor.
Calculation:
Calculates the weighted average price for ascending (priceA, priceB, priceC) and descending (priceX, priceY, priceZ) levels.
Utilizes the specified position size and increase factor to determine the weighted average.
Plotting:
Price Calculations:
priceA, priceB, priceC: Derived by applying percentage increases to the last candle's close.
priceX, priceY, priceZ: Derived by applying percentage decreases to the last candle's close.
avgPriceUp, avgPriceDown: Computed using the calcAvgPrice function for ascending and descending levels, respectively.
Plotting Colors:
User-customizable through input parameters (colorPriceA, colorPriceB, colorPriceC, colorAvgPriceUp, colorPriceX, colorPriceY, colorPriceZ, colorAvgPriceDown).
Styling:
All lines are plotted with minimal thickness (linewidth=1) for a clean visualization.
Overall, the indicator empowers traders to analyze potential support and resistance levels and understand average price movements based on their specified parameters. The flexibility of color customization adds a layer of personalization to suit individual preferences.
Bodies X Wix Version of Smart Money Tools by makuchaku & eFeThis is the same Script as Super Fair Value Gaps / FVG /BoS / by makuchaku & eFe. Mine Should Default to Large Text instead of small. The Super Order Blocks I believe was meant to for you to find one of the many Smart Money tools such as turn on the Fair Value gap but leave the others off, or Turn on where the Break of Structure and leave the others off. The reason I believe this is because the default values for each of the structures were default colored (green for positive and red for negative) for all.
Mine has a different Color for every possible structure. As long as you can read with the larger text that I added, then you can create your own boxes positive for break of structure, rejection block, order blocks and fair value gaps for any time frame. The reason I did that is because There's only certain things I believe I will need to mark for myself in each time frame, and then from there You can stretch iyour own box out further in time because if price touches a fair value gap for example, the fair value gap should conyinue in time until at least 2 candles have filed the Fair valu gap going both directions. That's truly when the fair value gap should is mitigated and will from off the chart. However, If I knew How to add the code for that, I would.
Additionally, I have the Max Boxes per chart, so you should have the ability to see every OB, FVG,RJB, & BoS on the chart
I tried my hardest to create a colored border that was different from the box. But the way the original was coded was almost impossible to do. Because they defined each of the structures (FVG, OB, BoS, RJB) outer levels, when the outer levels connect via math in the code, then it joins all the outside lines for a rectangle. When creating a box, the coloe will always be the same as the border unfortunately. (Unless I replan this from the beginning)
I also Changed the default labels for reach structure from a hard to read gray to a white that pops out.
Also, chart indicators are a little large as well. Such as the cross, sideways cross, The green Triangle, and the white Diamond. You'll get used to it or you can change it as well.
Creating videos for students, you need something they can see.
So, I just wanted to ensure everything was a little more unique and easily usable when showing this to my students when I send them private videos for our weekly lessons. I'm trying to learn how to use the IPFS for THAT, (which i see has invaded PineScript) Hope this indicator helps.
If you're to borrow this, Just make sure you keep the authors in the name makuchaku & efe

Filtered, N-Order Power-of-Cosine, Sinc FIR Filter [Loxx]Filtered, N-Order Power-of-Cosine, Sinc FIR Filter is a Discrete-Time, FIR Digital Filter that uses Power-of-Cosine Family of FIR filters. This is an N-order algorithm that allows up to 50 values for alpha, orders, of depth. This one differs from previous Power-of-Cosine filters I've published in that it this uses Windowed-Sinc filtering. I've also included a Dual Element Lag Reducer using Kalman velocity, a standard deviation filter, and a clutter filter. You can read about each of these below.
Impulse Response
What are FIR Filters?
In discrete-time signal processing, windowing is a preliminary signal shaping technique, usually applied to improve the appearance and usefulness of a subsequent Discrete Fourier Transform. Several window functions can be defined, based on a constant (rectangular window), B-splines, other polynomials, sinusoids, cosine-sums, adjustable, hybrid, and other types. The windowing operation consists of multipying the given sampled signal by the window function. For trading purposes, these FIR filters act as advanced weighted moving averages.
A finite impulse response (FIR) filter is a filter whose impulse response (or response to any finite length input) is of finite duration, because it settles to zero in finite time. This is in contrast to infinite impulse response (IIR) filters, which may have internal feedback and may continue to respond indefinitely (usually decaying).
The impulse response (that is, the output in response to a Kronecker delta input) of an Nth-order discrete-time FIR filter lasts exactly {\displaystyle N+1}N+1 samples (from first nonzero element through last nonzero element) before it then settles to zero.
FIR filters can be discrete-time or continuous-time, and digital or analog.
A FIR filter is (similar to, or) just a weighted moving average filter, where (unlike a typical equally weighted moving average filter) the weights of each delay tap are not constrained to be identical or even of the same sign. By changing various values in the array of weights (the impulse response, or time shifted and sampled version of the same), the frequency response of a FIR filter can be completely changed.
An FIR filter simply CONVOLVES the input time series (price data) with its IMPULSE RESPONSE. The impulse response is just a set of weights (or "coefficients") that multiply each data point. Then you just add up all the products and divide by the sum of the weights and that is it; e.g., for a 10-bar SMA you just add up 10 bars of price data (each multiplied by 1) and divide by 10. For a weighted-MA you add up the product of the price data with triangular-number weights and divide by the total weight.
What is a Standard Deviation Filter?
If price or output or both don't move more than the (standard deviation) * multiplier then the trend stays the previous bar trend. This will appear on the chart as "stepping" of the moving average line. This works similar to Super Trend or Parabolic SAR but is a more naive technique of filtering.
What is a Clutter Filter?
For our purposes here, this is a filter that compares the slope of the trading filter output to a threshold to determine whether to shift trends. If the slope is up but the slope doesn't exceed the threshold, then the color is gray and this indicates a chop zone. If the slope is down but the slope doesn't exceed the threshold, then the color is gray and this indicates a chop zone. Alternatively if either up or down slope exceeds the threshold then the trend turns green for up and red for down. Fro demonstration purposes, an EMA is used as the moving average. This acts to reduce the noise in the signal.
What is a Dual Element Lag Reducer?
Modifies an array of coefficients to reduce lag by the Lag Reduction Factor uses a generic version of a Kalman velocity component to accomplish this lag reduction is achieved by applying the following to the array:
2 * coeff - coeff
The response time vs noise battle still holds true, high lag reduction means more noise is present in your data! Please note that the beginning coefficients which the modifying matrix cannot be applied to (coef whose indecies are < LagReductionFactor) are simply multiplied by two for additional smoothing .
Whats a Windowed-Sinc Filter?
Windowed-sinc filters are used to separate one band of frequencies from another. They are very stable, produce few surprises, and can be pushed to incredible performance levels. These exceptional frequency domain characteristics are obtained at the expense of poor performance in the time domain, including excessive ripple and overshoot in the step response. When carried out by standard convolution, windowed-sinc filters are easy to program, but slow to execute.
The sinc function sinc (x), also called the "sampling function," is a function that arises frequently in signal processing and the theory of Fourier transforms.
In mathematics, the historical unnormalized sinc function is defined for x ≠ 0 by
sinc x = sinx / x
In digital signal processing and information theory, the normalized sinc function is commonly defined for x ≠ 0 by
sinc x = sin(pi * x) / (pi * x)
For our purposes here, we are used a normalized Sinc function
Included
Bar coloring
Loxx's Expanded Source Types
Signals
Alerts
Related indicators
Variety, Low-Pass, FIR Filter Impulse Response Explorer
STD-Filtered, Variety FIR Digital Filters w/ ATR Bands
STD/C-Filtered, N-Order Power-of-Cosine FIR Filter
STD/C-Filtered, Truncated Taylor Family FIR Filter
STD/Clutter-Filtered, Kaiser Window FIR Digital Filter
STD/Clutter Filtered, One-Sided, N-Sinc-Kernel, EFIR Filt

Pyramiding Order Volume CalculatorThis is a script to calculate the order volume for the current symbol given your current portfolio value and how many orders you want to place. This is useful when using a strategy that places pyramiding orders and your bot won't automatically divide up your portfolio.
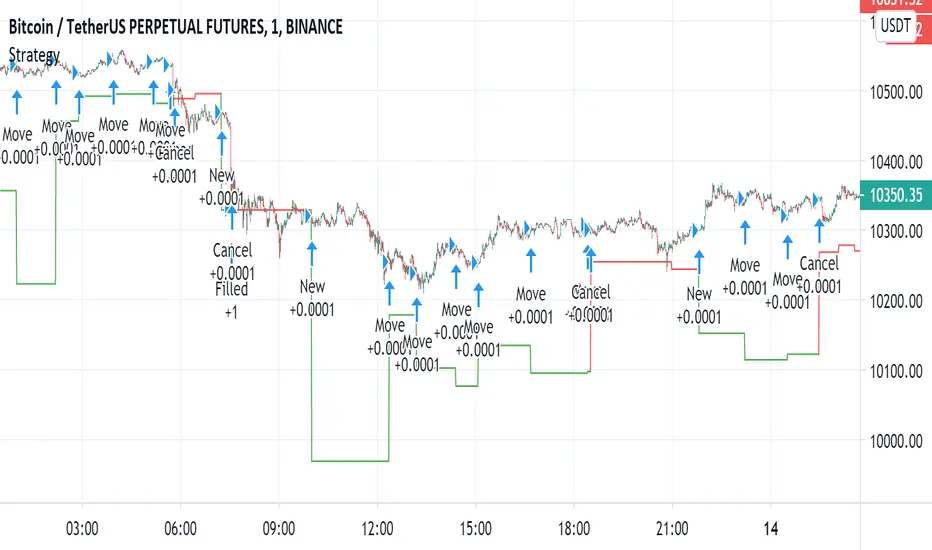
Automated - Fibs with Limit only ordersAutomated - Fibs with Limit only orders
This script was designed to demonstrate how you can use a single alert to move your limit orders around.
It is not meant to be traded live and has been built to work with Binance Futures Testnet.
You will notice a lot of plots with 5 different titles.
New = Place your limit buy at a fixed-price.
Move = Cancel the current limit buy and place it at the new fixed-price.
Filled = Cancel any limit closes and places them anew based on the new average and take profit.
Cancel = Cancels exisiting limit buys.
Cloes All = Limit close filled, no commands necessary.
The default quantity in the command is the minimum order size on Binance.
Settings
Live
- If enabled it will only place trades after the "Stat Timestamp + Start Delay" that you provide.
Start Timestamp
- Use something similar to epochconverter to get the current timestamp.
Start Delay
- Gives you 1 minute by default to start the script and create your alert before it begins looking for a new entry.
Leverage
- Default 1. Affects the "Take Profit and DCA When" Settings.
Take Profit %
- This is the percentage above the current average you'd like to place your position close at.
DCA When %
- The percentage below your last entry that you're willing to buy again.
Note: This strategy has no stop-loss and pyramiding is enabled. It is not built for, or recommended to run live.
I hope this opens some doors and helps advance your personal trading system.
Good luck and happy scripting!
Incremental Order size +This is an old and incomplete script that is being pulled up and dusted off as per request.
The sole purpose of this script was to provide code snippets allowing one to easily convert their own script/strategy to include incremental order sizes. More control over your pyramiding orders.
**It may repaint, and was not intended for trading but more as an attempt to provide examples for more control with pyramiding.

Volume Footprint Anomaly Scanner [PhenLabs]📊 PhenLabs - Volume Footprint Anomaly Scanner (VFAS)
Version: PineScript™ v6
📌 Description
The PhenLabs Volume Footprint Anomaly Scanner (VFAS) is an advanced Pine Script indicator designed to detect and highlight significant imbalances in buying and selling pressure within individual price bars. By analyzing a calculated "Delta" – the net difference between estimated buy and sell volume – and employing statistical Z-score analysis, VFAS pinpoints moments when buying or selling activity becomes unusually dominant. This script was created not in hopes of creating a "Buy and Sell" indicator but rather providing the user with a more in-depth insight into the intrabar volume delta and how it can fluctuate in unusual ways, leading to anomalies that can be capitalized on.
This indicator helps traders identify high-conviction points where strong market participants are active, signaling potential shifts in momentum or continuation of a trend. It aims to provide a clearer understanding of underlying market dynamics, allowing for more informed decision-making in various trading strategies, from identifying entry points to confirming trend strength.
🚀 Points of Innovation
● Z-Score for Delta Analysis : Utilizes statistical Z-scores to objectively identify statistically significant anomalies in buying/selling pressure, moving beyond simple, arbitrary thresholds.
● Dynamic Confidence Scoring : Assigns a multi-star confidence rating (1-4 stars) to each signal, factoring in high volume, trend alignment, and specific confirmation criteria, providing a nuanced view of signal strength.
● Integrated Trend Filtering : Offers an optional Exponential Moving Average (EMA)-based trend filter to ensure signals align with the broader market direction, reducing false positives in ranging markets.
● Strict Confirmation Logic : Implements specific confirmation criteria for higher-confidence signals, including price action and a time-based gap from previous signals, enhancing reliability.
● Intuitive Info Dashboard : Provides a real-time summary of market trend and the latest signal's direction and confidence directly on the chart, streamlining information access.
🔧 Core Components
● Core Delta Engine : Estimates the net buying/selling pressure (bar Delta) by analyzing price movement within each bar relative to volume. It also calculates average volume to identify bars with unusually high activity.
● Anomaly Detection (Z-Score) : Computes the Z-score for the current bar's Delta, indicating how many standard deviations it is from its recent average. This statistical measure is central to identifying significant anomalies.
● Trend Filter : Utilizes a dual Exponential Moving Average (EMA) cross-over system to define the prevailing market trend (uptrend, downtrend, or range), providing contextual awareness.
● Signal Processing & Confidence Algorithm : Evaluates anomaly conditions against trend filters and confirmation rules, then calculates a dynamic confidence score to produce actionable, contextualized signal information.
🔥 Key Features
● Advanced Delta Anomaly Detection : Pinpoints bars with exceptionally high buying or selling pressure, indicating potential institutional activity or strong market conviction.
● Multi-Factor Confidence Scoring : Each signal comes with a 1-4 star rating, clearly communicating its reliability based on high volume, trend alignment, and specific confirmation criteria.
● Optional Trend Alignment : Users can choose to filter signals, so only those aligned with the prevailing EMA-defined trend are displayed, enhancing signal quality.
● Interactive Signal Labels : Displays compact labels on the chart at anomaly points, offering detailed tooltips upon hover, including signal type, direction, confidence, and contextual information.
● Customizable Bar Colors : Visually highlights bars with Delta anomalies, providing an immediate visual cue for strong buying or selling activity.
● Real-time Info Dashboard : A clean, customizable dashboard shows the current market trend and details of the latest detected signal, keeping key information accessible at a glance.
● Configurable Alerts : Set up alerts for bullish or bearish Delta anomalies to receive real-time notifications when significant market pressure shifts occur.
🎨 Visualization
Signal Labels :
* Placed at the top/bottom of anomaly bars, showing a "📈" (bullish) or "📉" (bearish) icon.
* Tooltip: Hovering over a label reveals detailed information: Signal Type (e.g., "Delta Anomaly"), Direction, Confidence (e.g., "★★★☆"), and a descriptive explanation of the anomaly.
* Interpretation: Clearly marks actionable signals and provides deep insights without cluttering the chart, enabling quick assessment of signal strength and context.
● Info Dashboard :
* Located at the top-right of the chart, providing a clean summary.
* Displays: "PhenLabs - VFAS" header, "Market Trend" (Uptrend/Downtrend/Range with color-coded status), and "Direction | Conf." (showing the last signal's direction and star confidence).
* Optional "💡 Hover over signals for details" reminder.
* Interpretation: A concise, real-time summary of the market's pulse and the most recent high-conviction event, helping traders stay informed at a glance.
📖 Usage Guidelines
Setting Categories
⚙️ Core Delta & Volume Engine
● Minimum Volume Lookback (Bars)
○ Default: 9
○ Range: Integer (e.g., 5-50)
○ Description: Defines the number of preceding bars used to calculate the average volume and delta. Bars with volume below this average won't be considered for high-volume signals. A shorter lookback is more reactive to recent changes, while a longer one provides a smoother average.
📈 Anomaly Detection Settings
Delta Z-Score Anomaly Threshold
○ Default: 2.5
○ Range: Float (e.g., 1.0-5.0+)
○ Description: The number of standard deviations from the mean that a bar's delta must exceed to be considered a significant anomaly. A higher threshold means fewer, but potentially stronger, signals. A lower threshold will generate more signals, which might include less significant events. Experiment to find the optimal balance for your trading style.
🔬 Context Filters
Enable Trend Filter
○ Default: False
○ Range: Boolean (True/False)
○ Description: When enabled, signals will only be generated if they align with the current market trend as determined by the EMAs (e.g., only bullish signals in an uptrend, bearish in a downtrend). This helps to filter out counter-trend noise.
● Trend EMA Fast
○ Default: 50
○ Range: Integer (e.g., 10-100)
○ Description: The period for the faster Exponential Moving Average used in the trend filter. In combination with the slow EMA, it defines the trend direction.
● Trend EMA Slow
○ Default: 200
○ Range: Integer (e.g., 100-400)
○ Description: The period for the slower Exponential Moving Average used in the trend filter. The relationship between the fast and slow EMA determines if the market is in an uptrend (fast > slow) or downtrend (fast < slow).
🎨 Visual & UI Settings
● Show Info Dashboard
○ Default: True
○ Range: Boolean (True/False)
○ Description: Toggles the visibility of the dashboard on the chart, which provides a summary of market trend and the last detected signal.
● Show Dashboard Tooltip
○ Default: True
○ Range: Boolean (True/False)
○ Description: Toggles a reminder message in the dashboard to hover over signal labels for more detailed information.
● Show Delta Anomaly Bar Colors
○ Default: True
○ Range: Boolean (True/False)
○ Description: Enables or disables the coloring of bars based on their delta direction and whether they represent a significant anomaly.
● Show Signal Labels
○ Default: True
○ Range: Boolean (True/False)
○ Description: Controls the visibility of the “📈” or “📉” labels that appear on the chart when a delta anomaly signal is generated.
🔔 Alert Settings
Alert on Delta Anomaly
○ Default: True
○ Range: Boolean (True/False)
○ Description: When enabled, this setting allows you to set up alerts in TradingView that will trigger whenever a new bullish or bearish delta anomaly is detected.
✅ Best Use Cases
Early Trend Reversal / Continuation Detection: Identify strong surges of buying/selling pressure at key support/resistance levels that could indicate a reversal or the continuation of a strong move.
● Confirmation of Breakouts: Use high-confidence delta anomalies to confirm the validity of price breakouts, indicating strong conviction behind the move.
● Entry and Exit Points: Pinpoint precise entry opportunities when anomalies align with your trading strategy, or identify potential exhaustion signals for exiting trades.
● Scalping and Day Trading: The indicator’s sensitivity to intraday buying/selling imbalances makes it highly effective for short-term trading strategies.
● Market Sentiment Analysis: Gain a real-time understanding of underlying market sentiment by observing the prevalence and strength of bullish vs. bearish anomalies.
⚠️ Limitations
Estimated Delta: The script uses a simplified method to estimate delta based on bar close relative to its range, not actual order book or footprint data. While effective, it’s an approximation.
● Sensitivity to Z-Score Threshold: The effectiveness heavily relies on the `Delta Z-Score Anomaly Threshold`. Too low, and you’ll get many false positives; too high, and you might miss valid signals.
● Confirmation Criteria: The 4-star confidence level’s “confirmation” relies on specific subsequent bar conditions and previous confirmed signals, which might be too strict or specific for all contexts.
● Requires Context: While powerful, VFAS is best used in conjunction with other technical analysis tools and price action to form a comprehensive trading strategy. It is not a standalone “buy/sell” signal.
💡 What Makes This Unique
Statistical Rigor: The application of Z-score analysis to bar delta provides an objective, statistically-driven way to identify true anomalies, moving beyond arbitrary thresholds.
● Multi-Factor Confidence Scoring: The unique 1-4 star confidence system integrates multiple market dynamics (volume, trend alignment, specific follow-through) into a single, easy-to-interpret rating.
● User-Friendly Design: From the intuitive dashboard to the detailed signal tooltips, the indicator prioritizes clear and accessible information for traders of all experience levels.
🔬 How It Works
1. Bar Delta Calculation:
● The script first estimates the “buy volume” and “sell volume” for each bar. This is done by assuming that volume proportional to the distance from the low to the close represents buying, and volume proportional to the distance from the high to the close represents selling.
● How this contributes: This provides a proxy for the net buying or selling pressure (delta) within that specific price bar, even without access to actual footprint data.
2. Volume & Delta Z-Score Analysis:
● The average volume over a user-defined lookback period is calculated. Bars with volume less than twice this average are generally considered of lower interest.
● The Z-score for the calculated bar delta is computed. The Z-score measures how many standard deviations the current bar’s delta is from its average delta over the `Minimum Volume Lookback` period.
● How this contributes: A high positive Z-score indicates a bullish delta anomaly (significantly more buying than usual), while a high negative Z-score indicates a bearish delta anomaly (significantly more selling than usual). This identifies statistically unusual levels of pressure.
3. Trend Filtering (Optional):
● Two Exponential Moving Averages (Fast and Slow EMA) are used to determine the prevailing market trend. An uptrend is identified when the Fast EMA is above the Slow EMA, and a downtrend when the Fast EMA is below the Slow EMA.
● How this contributes: If enabled, the indicator will only display bullish delta anomalies during an uptrend and bearish delta anomalies during a downtrend, helping to confirm signals within the broader market context and avoid counter-trend signals.
4. Signal Generation & Confidence Scoring:
● When a delta Z-score exceeds the user-defined anomaly threshold, a signal is generated.
● This signal is then passed through a multi-factor confidence algorithm (`f_calculateConfidence`). It awards stars based on: high volume presence, alignment with the overall trend (if enabled), and a fourth star for very strong Z-scores (above 3.0) combined with specific follow-through candle patterns after a cooling-off period from a previous confirmed signal.
● How this contributes: Provides a qualitative rating (1-4 stars) for each anomaly, allowing traders to quickly assess the potential significance and reliability of the signal.
💡 Note:
The PhenLabs Volume Footprint Anomaly Scanner is a powerful analytical tool, but it’s crucial to understand that no indicator guarantees profit. Always backtest and forward-test the indicator settings on your chosen assets and timeframes. Consider integrating VFAS with your existing trading strategy, using its signals as confirmation for entries, exits, or trend bias. The Z-score threshold is highly customizable; lower values will yield more signals (including potential noise), while higher values will provide fewer but potentially higher-conviction signals. Adjust this parameter based on market volatility and your risk tolerance. Remember to combine statistical insights from VFAS with price action, support/resistance levels, and your overall market outlook for optimal results.

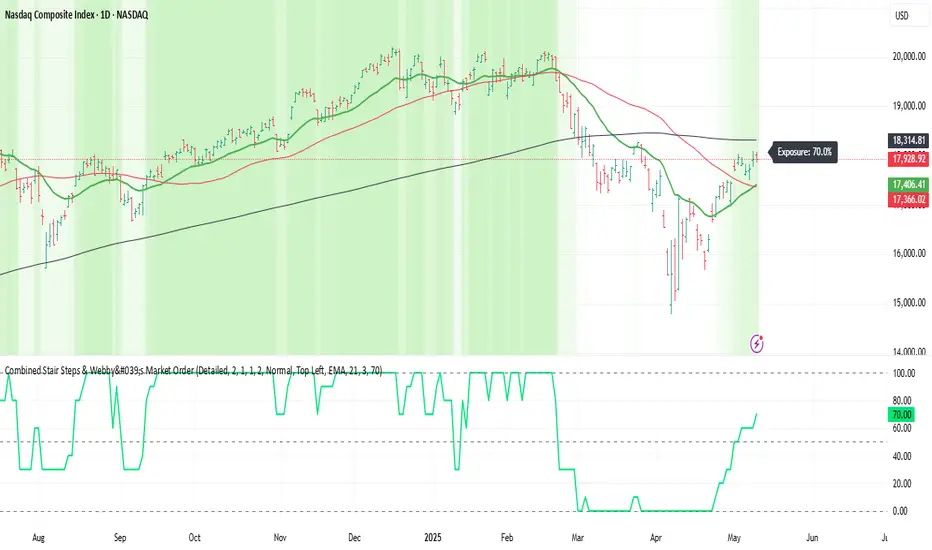
Webby's Market OrderThis is visual representation of Webby's Market Order.
When three consecutive lows are above 21 EMA, Uptrend expectation is natural.
When three highs are below 21 EMA, Downtrend expectation is natural.
Alert Conditions can be set when uptrend and down trend are expected.
Use this indicator with IXIC or SPY or major indices.
This is set at three lows/Highs above 21 EMA as looked by Mike Webster.
Volume Breaker Blocks [UAlgo]The "Volume Breaker Blocks " indicator is designed to identify breaker blocks in the market based on volume and price action. It is a concept that emerges when an order block fails, leading to a change in market structure. It signifies a pivotal point where the market shifts direction, offering traders opportunities to enter trades based on anticipated trend continuation.
🔶 Key Features
Identifying Breaker Blocks: The indicator identifies breaker blocks by detecting pivot points in price action and corresponding volume spikes.
Breaker Block Sensitivity: Traders can adjust breaker block detection sensitivity, length to be used to find pivot points.
Mitigation Method (Close or Wick): Traders can choose between "Close" and "Wick" as the mitigation method. This choice determines whether the indicator considers closing prices or wicks in identifying breaker blocks. Selecting "Close" implies that breaker blocks will be considered broken when the closing price violates the block, while selecting "Wick" implies that the wick of the candle must violate the block for it to be considered broken.
Show Last X Breaker Blocks: Users can specify how many of the most recent breaker blocks to display on the chart.
Visualization: Volume breaker blocks are visually represented on the chart with customizable colors and text labels, allowing for easy interpretation of market conditions. Each breaker block is accompanied by informational text, including whether it's bullish or bearish and the corresponding volume, aiding traders in understanding the significance of each block.
🔶 Disclaimer
Educational Purpose: The "Volume Breaker Blocks " indicator is provided for educational and informational purposes only. It does not constitute financial advice or a recommendation to engage in trading activities.
Risk of Loss: Trading in financial markets involves inherent risks, including the risk of loss of capital. Users should carefully consider their financial situation, risk tolerance, and investment objectives before engaging in trading activities.
Accuracy Not Guaranteed: While the indicator aims to identify potential reversal points in the market, its accuracy and effectiveness may vary. Users should conduct thorough testing and analysis before relying solely on the indicator for trading decisions.
Past Performance: Past performance is not indicative of future results. Historical data and backtesting results may not accurately reflect actual market conditions or future performance.

Are stop orders making money? [yohtza]Who is this indicator for and what does it do?
This is an indicator that helps price action traders in determining the strength of the trend and potential counter trend traps that present themselves during the move. It highlights the background of the bar at which counter trend traders that trade with stop orders (breakout entries) were able to achieve the same amount of reward as was their risk for that trade.
What is it based on?
When there is a strong trend in effect, the counter trend traders are unable to buy above(in bear trend) or sell below (in bull trend) a bar with a stop order and get an equal reward for the risk they are taking.
The first time counter trend traders are able to buy and make money in bear or sell and make money in bull it is a warning sign that market is likely transitioning into trading range phase of the market cycle.
Another application of the indicator is for discovering potential traps. If market comes very close to the take profit level of counter trend traders and reverses, they will usually try to get out with as much profit or as small of a loss as possible and that will often create a fast move (also called giving up) and a good with trend entry.
How does it work?
The indicator is using exponential moving average as a filter for when the market is trending and then scans for signals where counter trend traders enter. Next it looks if the stoploss or profit target was hit for that trade. If the profit target was hit it draws a box around the bar on which the traders entered, the box height is based on stoploss and profit target price levels.
Indicator inputs
- Scan for doji signal bars
When this option is selected, bars that have small bodies (less than 50% of their height) are also included as bars on which counter traders enter. If the option is not selected it only looks for bull trend bars (bodies are greater than 50% of their height) below the moving average and bear trend bars above the moving average.
- Border and background colors and border style
It is possible to select different colors and chose between solid, dashed and dotted borders
- Ema period
Default setting is 20 bar exponential moving average but feel free to use which you prefer
- Tick value
This is the value of the minimal movement of the chart you are trading on. For example for S&P 500 E-mini futures the value is 0.25 and that is the default setting.
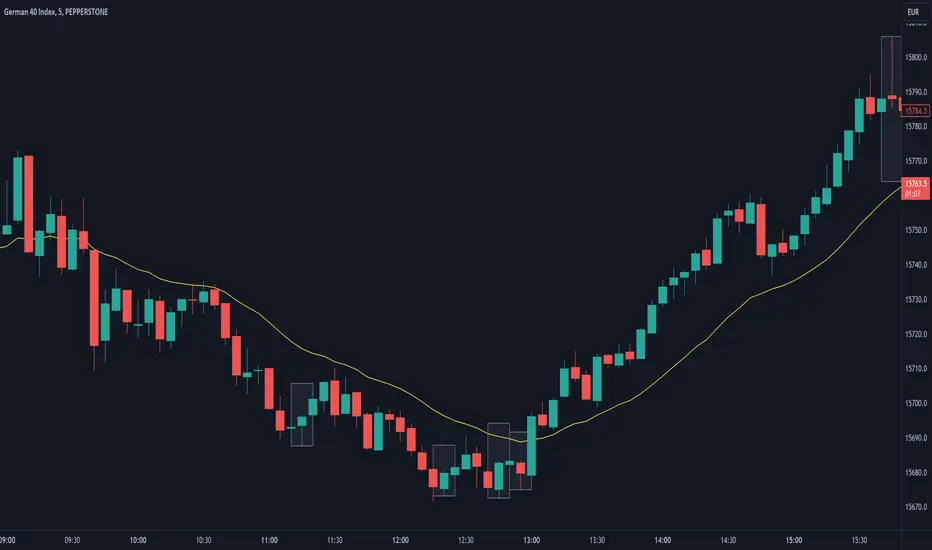
Next-Gen Engulfing Retracement█ OVERVIEW
If you follow my work closely, you know my obsession with OrderBlocks and Retracements. We will reuse the same logic,
but using candle engulfments and candle engulfment reversals. It is the latter that we will interpret as OrderBlocks, and candle engulfments as
buy or sell signals.Instead of using the price and the average of the candles, here we prefer to use 4 exponential moving averages over 4 different
periods with a true range for detecting volatility and determining if a candle should be considered engulfed or not.
(note : if you know the principle of candle engulfment you should know that a bullish engulfment does not necessarily mean a buy signal).
█ HOW TO INTERPRET?
1 • We use last detected 'Bearish/Bullish Reversal Engulfing Candle' as an Retracement Level.
(Keep in mind Historical Retracements with extended lines is still useful and can still have an impact on the actual trend).
2 • We use 'Bearish/Bullish Candle' as confirmation of entry point.
3 • You can play with the 'Maximum Volatility' value or the 'True Range' Multiplier value to filter detected engulfing as you want.
4 • HTF and Auto HTF option available.
5 • Everything is customizable in settings (show inputs, colors, lines size etc...)
6 • Alerts is available for Engulfing Candle and Crossing Lines.
█ NOTES
- This script is not beginner's Level and is intended for Traders with advanced knowledge of Candlestick Patterns and the work of Michael j. Huddleston on the OrderBlocks.
Good Trade everyone and remember, risk management remains the most important!

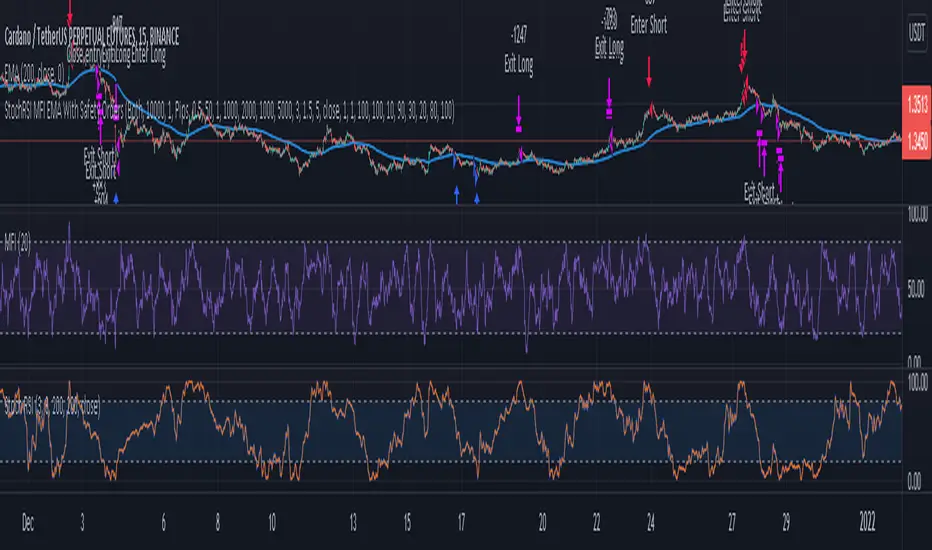
3 Indicator Strategy (StochRSI, MFI & EMA) With Safety OrdersThis strategy uses Stochastic RSI, Money Flow Index and EMA with settings for lower time-frames.
It also features safety orders based on 3 different take profit and stop loss methods.
Recommended Indicator Settings for lower time-frames;
Stoch RSI: 1,1,100,100
MFI: 30
EMA: 100
Take Profit/Stop Loss Settings:
There are 3 TP/SL types available;
- Pips -> based on minticks
- Base Value -> manually entering a value for the actual profit/loss.
- Opposite Signal -> e.g. if the current open order is long, strategy waits for the next short signal.