Directional Movement OscillatorThe Directional Movement Oscillator (DMO) is an adaption to the Directional Movement Index (DMI).
The difference is that DMO is one line, whereas DMI has 3 lines: +DI,-DI, and ADX.
The DMO line calculation: DMO = (+DI) - (-DI)
I excluded the ADX in DMO because its completely useless.
Try this indicator out, good luck ;)
-racer8
ابحث في النصوص البرمجية عن "oscillator"

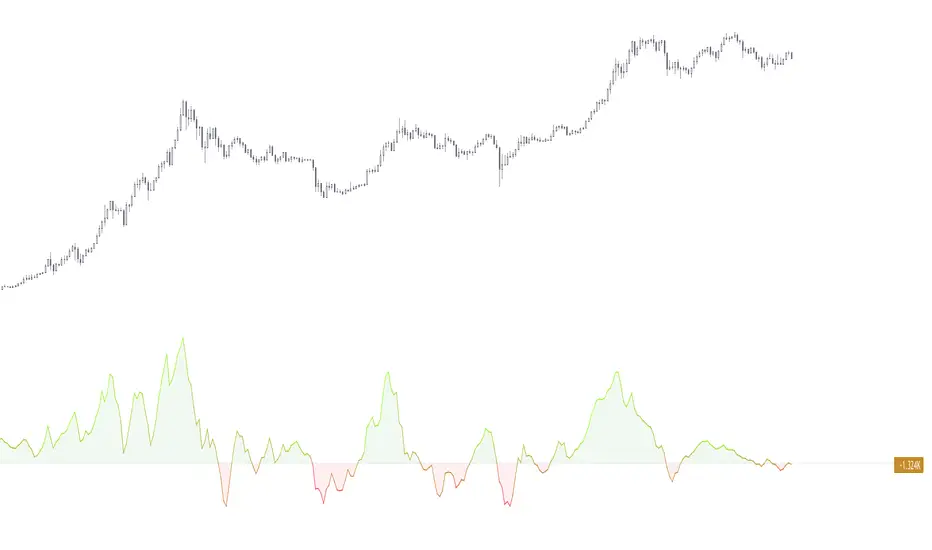
Indicator: Price Weight Oscillator [xQT5]This is my revision of AO (Awesome Oscillator) that can give more correct and early signals as on my opinion.
I'm used a original formula of AO and modified it with high and low prices adding.
Enjoy it!

Gann Trend OscillatorDeveloped by Robert Krausz, the Gann Trend Oscillator is a trend-following indicator used to determine the financial instruments long-term price direction.

E3 Super OscillatorCustom oscillator with settings for the custom histogram. Signals are displayed for Very Strong Buy, Pretty Strong Buy, Risky Buy, same for sell signals. Works on all time frames.

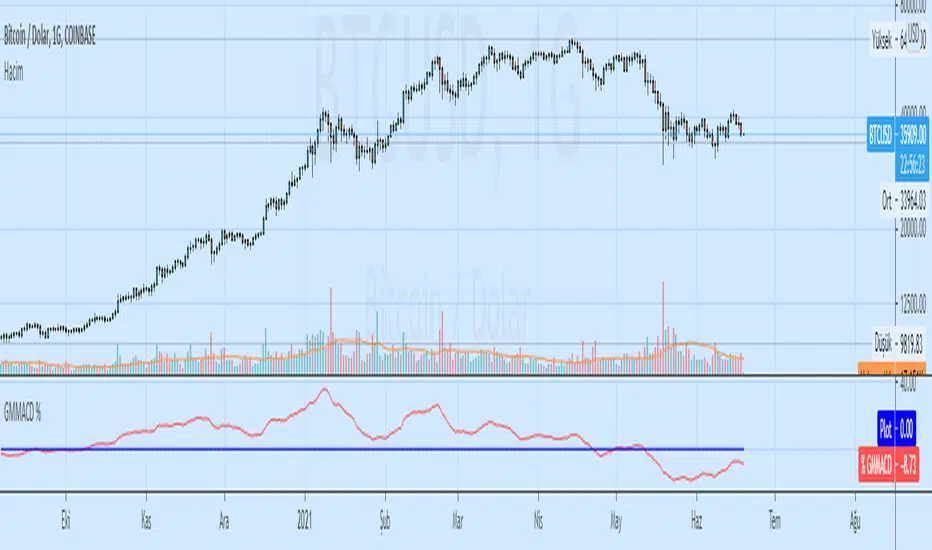
Bitcoin Energy Value OscillatorBitcoin Energy Value as an oscillator against price.
Calculated as: (Bitcoin Price / Bitcoin Energy Value - 1) * 100

Multi-Oscillator Divergence StudyCreated study to allow access to alert conditions.
See strategy to understand how this indicator is used.

TMMS OscillatorThe TMMS oscillator (aka “Trading Made More Simpler”) is an indicator made of conditions based on both 2 separated Stochastic and 1 RSI.
Bullish zone is green and bearish one is red. When the histogram is grey, no signals is available at that time.
The indicator has an option to show the current trend of an Hull moving average (ascending or descending curve). When the trend is up, green dots are plotted on the zero line. When the trend is down, the dots are coloured in red.
Greetings, success with your trade!!!

Bitcoin Production Cost OscillatorFor Trav,
Oscillator version of "Bitcoin Production Cost".
Based on raw data from CBECI.
Follow me to read more about the calculation logic.

Klinger Oscillator more sensitive to volume mkmunir3This oscillator has been modified to make it more responsive to volume thereby giving the trader the increased ability to appreciate the volume with the required weightage it deserves .

Function : Stochastic Oscillator Here is the Stochastic Oscillator function.
Now you can easily use length with mutable variables !!

MTF CMO (Chande Momentum Oscillator)Simple Multi-Timeframe version of the Chande Momentum Oscillator . Many thanks to HPotter whos script I used as a starting point. This displays 1, 2, 3, 4, and 24 period CMOs on the graph. 1, 2, 3, and 4 periods are smoothed by using their simple moving averages. 24 period is unsmoothed. I prefer to set my chart to a 1 hour timeframe and look for bottoming or topping patterns in the momentum. Strongest topping or bottoming patterns are when all timeframes roll over including the 24 period.


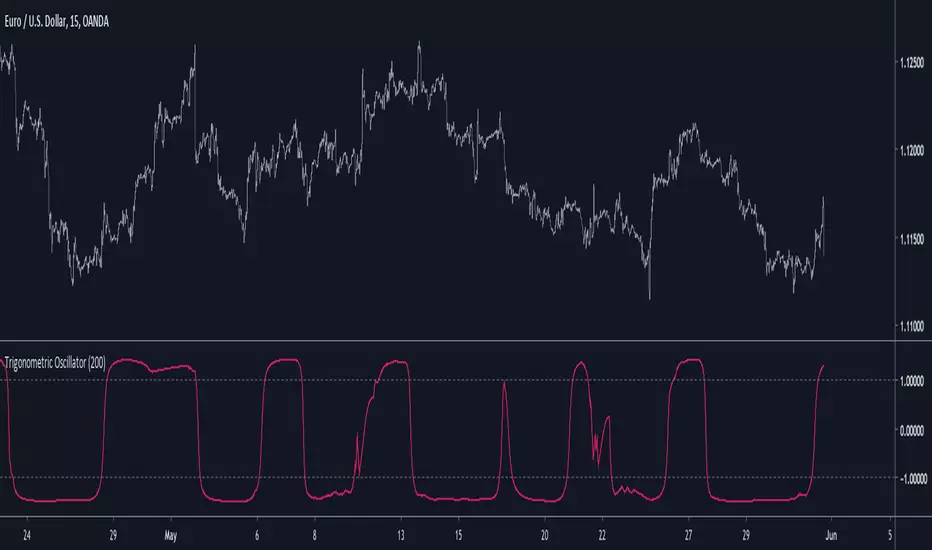
Trigonometric OscillatorIts a pretty old script and i have absolutely no idea how i did it, the code kinda look like the phase wrapping/unwrapping formula. This indicator is an oscillator, sometimes its reactivity is impressive so i think its a good idea to post it, feel free to experiment with it.
Chaikin OscillatorThis script plots the original Chaikin Oscillator in addition of highlighting positive/negative pressure areas.

Volume Weighted MACD OscillatorThis oscillator plots volume weighted convergence/divergence from the 20, 50 and 200 tick MA's. I wanted to build another way to look at the data I saw being generated in my first script.

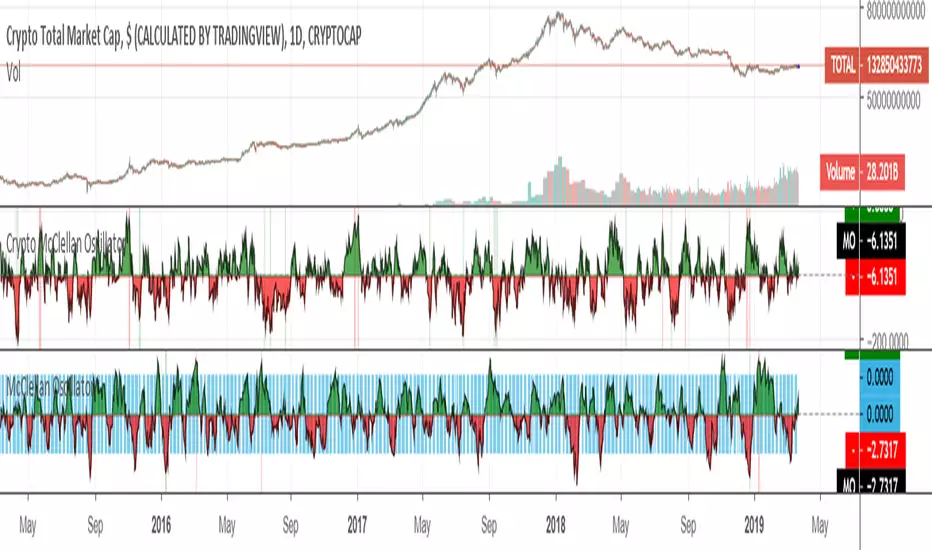
Crypto McClellan OscillatorMcClellan Oscillator for cryptocurrency, taking into account only the top 40 cryptos.
Original code was by LazyBear.
Waddah Attar Explosion and WaveTrend Oscillator combinedWaddah Attar Explosion by LazyBear and WaveTrend Oscillator by Krypt.
All credits goes to LazyBear and Krypt, i have only done some combining with the two indicators, barcolors and BG colors to clarify entrys and exits.
Combine with CM_Williams Vix_Fix, Super Guppy R1.0 by JustUncleL and you have a powerful tool.
Barcolors to look for
Aggressive Buy 1 = Lime
Agressive Buy 2 = Aqua
Buy = Green
Sell 1 = Orange
Sell 2 = Red
This is my first try, so be nice to me :-)

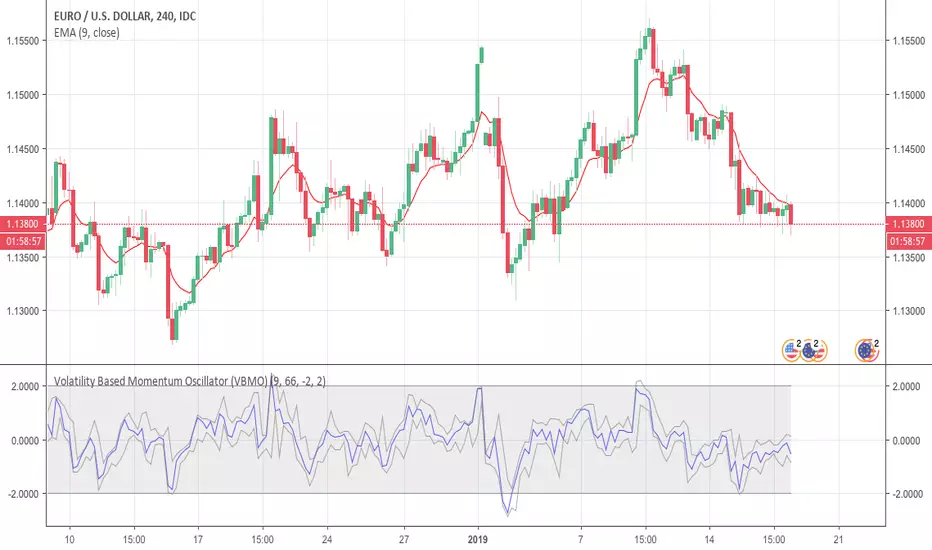
Volatility Based Momentum Oscillator (VBMO)There is a frequent and definitive pattern in price movement, whereby price will steadily drift lower, then accelerate before bottoming out. Similarly, price will often steadily rise, then accelerate into a climax top.
The Volatility Based Momentum Oscillator (VBMO) is designed to delineate between steady versus more accelerated and climactic price movements.
VBMO is calculated using a short-term moving average, the distance of price from this moving average, and the trading instrument’s historical volatility. Even though VBMO’s calculation is relatively simple, the resulting values can help traders identify, analyze and act upon many scenarios, such as climax tops, reversals, and capitulation. Moreover, since the units and scale for VBMO are always the same, the indicator can be used in a consistent manner across multiple timeframes and instruments.
For more details, there is an article further describing VBMO and its applicability.