Bullish and Bearish Harami DetectorHere’s a description of the script I built for you, designed for a **TradingView public indicator**:
### **Custom Bullish and Bearish Harami Detector with Timeframe Selection**
This custom Pine Script detects **Bullish Harami** and **Bearish Harami** candlestick patterns on the selected timeframe, with configurable settings for how many prior candles to consider for pattern detection.
---
### **Features:**
1. **Timeframe Selection:**
- **Input Field for Timeframe**: The script allows users to choose the timeframe for detecting patterns. For instance, you can set it to 1 hour, 4 hours, or even daily candles, ensuring the detection works as per your chosen market view.
- This is controlled by the `input.timeframe` function, and the user is prompted to select the desired timeframe (e.g., "1h", "4h", "1d").
2. **Enable/Disable Pattern Detection:**
- The user has the flexibility to enable or disable the detection of **Bullish Harami** and **Bearish Harami** patterns.
- The two toggles `detectBullishHarami` and `detectBearishHarami` allow users to turn on/off the detection for each pattern type.
3. **Customizable Bearish Candle Count for Bullish Harami:**
- The user can define how many prior **bearish candles** should be present before a **Bullish Harami** can be detected.
- The input variable `bearishCandleCountBullish` lets you choose how many previous bearish candles to consider for detecting a **Bullish Harami** (for example, the last 3, 5, or 6 bearish candles).
4. **Customizable Bullish Candle Count for Bearish Harami:**
- Similar to the Bullish Harami, the script allows the user to define how many prior **bullish candles** should be present before a **Bearish Harami** pattern is detected.
- The input variable `bearishCandleCountBearish` lets you select how many previous bullish candles to check for **Bearish Harami**.
5. **Pattern Detection Logic:**
- **Bullish Harami**: Detected when a bearish candle (open > close) is followed by a smaller bullish candle (open < close) where the entire body of the second candle is contained within the body of the first candle.
- **Bearish Harami**: Detected when a bullish candle (open < close) is followed by a smaller bearish candle (open > close) where the entire body of the second candle is contained within the body of the first candle.
- Both patterns are subject to the user-defined conditions (number of previous bearish or bullish candles).
6. **Visual Indicators:**
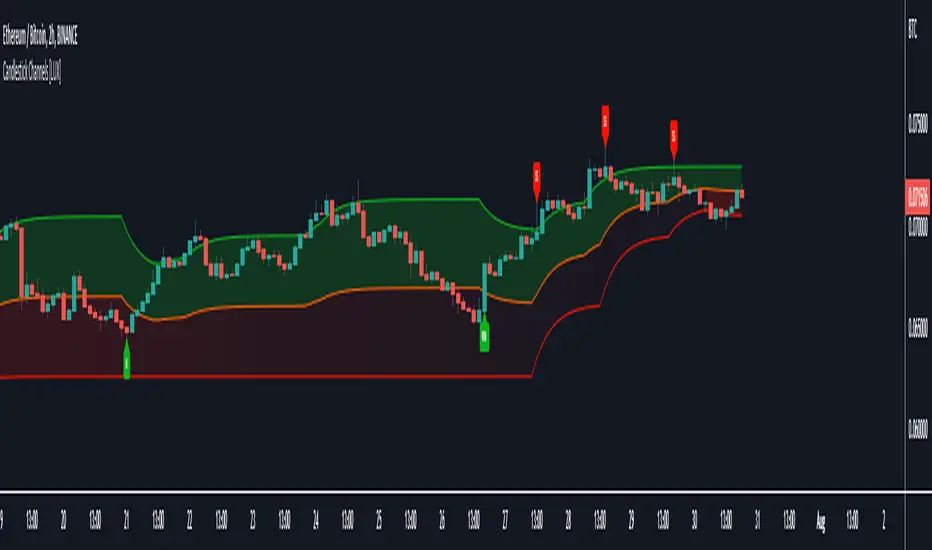
- **Bullish Harami**: A green label is plotted **below the bar** to indicate a **Bullish Harami** pattern.
- **Bearish Harami**: A red label is plotted **above the bar** to indicate a **Bearish Harami** pattern.
- The labels are displayed using the `plotshape` function with custom colors and text.
7. **Additional Settings**:
- The script includes tooltips and descriptions for each input to make the settings clear for users, allowing even those unfamiliar with candlestick patterns to understand and use the indicator effectively.
---
### **How It Works:**
- The script first checks the specified timeframe and identifies the current and previous candlesticks.
- It then applies the user-defined conditions for detecting the **Bullish Harami** and **Bearish Harami** patterns by checking the relative positions and sizes of the candlesticks over the selected number of previous candles.
- Once a pattern is detected, it plots a label on the chart (green for **Bullish Harami** and red for **Bearish Harami**) at the appropriate location (below or above the candle).
- The script updates dynamically as the price action unfolds.
---
### **Use Cases:**
- **Traders**: This script is useful for traders who want to identify reversal patterns like **Bullish Harami** and **Bearish Harami** on their chosen timeframes and adjust the sensitivity by changing the number of prior candles for pattern detection.
- **Customization**: Users can fine-tune the script’s settings based on their specific trading strategy, adjusting both the timeframe and the number of candles for pattern detection.
---
### **Conclusion:**
This indicator is an effective tool for detecting candlestick patterns, specifically **Bullish Harami** and **Bearish Harami**, on **TradingView**. By allowing customization in terms of timeframe and the number of prior candles to consider, users can tailor the script to fit their trading strategy and market conditions.
مؤشر Pine Script®