Elliott Wave with Supertrend Exit - Strategy [presentTrading]## Introduction and How it is Different
The Elliott Wave with Supertrend Exit provides automated detection and validation of Elliott Wave patterns for algorithmic trading. It is designed to objectively identify high-probability wave formations and signal entries based on confirmed impulsive and corrective patterns.
* The Elliott part is mostly referenced from Elliott Wave by @LuxAlgo
Key advantages compared to discretionary Elliott Wave analysis:
- Wave Labeling and Counting: The strategy programmatically identifies swing pivot highs/lows with the Zigzag indicator and analyzes the waves between them. It labels the potential impulsive and corrective patterns as they form. This removes the subjectivity of manual wave counting.
- Pattern Validation: A rules-based engine confirms valid impulsive and corrective patterns by checking relative size relationships and fib ratios. Only confirmed wave counts are plotted and traded.
- Objective Entry Signals: Trades are entered systematically on the start of new impulsive waves in the direction of the trend. Pattern failures invalidate setups and stop out positions.
- Automated Trade Management: The strategy defines specific rules for profit targets at fib extensions, trailing stops at swing points, and exits on Supertrend reversals. This automates the entire trade lifecycle.
- Adaptability: The waveform recognition engine can be tuned by adjusting parameters like Zigzag depth and Supertrend settings. It adapts to evolving market conditions.
ETH 1hr chart
In summary, the strategy brings automation, objectivity and adaptability to Elliott Wave trading - removing subjective interpretation errors and emotional trading biases. It implements a rules-based, algorithmic approach for systematically trading Elliott Wave patterns across markets and timeframes.
## Trading Logic and Rules
The strategy follows specific trading rules based on the detected and validated Elliott Wave patterns.
Entry Rules
- Long entry when a new impulsive bullish (5-wave) pattern forms
- Short entry when a new impulsive bearish (5-wave) pattern forms
The key is entering on the start of a new potential trend wave rather than chasing.
Exit Rules
- Invalidation of wave pattern stops out the trade
- Close long trades on Supertrend downturn
- Close short trades on Supertrend upturn
- Use a stop loss of 10% of entry price (configurable)
Trade Management
- Scale out partial profits at Fibonacci levels
- Move stop to breakeven when price reaches 1.618 extension
- Trail stops below key swing points
- Target exits at next Fibonacci projection level
Risk Management
- Use stop losses on all trades
- Trade only highest probability setups
- Size positions according to chart timeframe
- Avoid overtrading when no clear patterns emerge
## Strategy - How it Works
The core logic follows these steps:
1. Find swing highs/lows with Zigzag indicator
2. Analyze pivot points to detect impulsive 5-wave patterns:
- Waves 1, 3, and 5 should not overlap
- Waves 3 and 5 must be longer than wave 1
- Confirm relative size relationships between waves
3. Validate corrective 3-wave patterns:
- Look for overlapping, choppy waves that retrace the prior impulsive wave
4. Plot validated waves and Fibonacci retracement levels
5. Signal entries when a new impulsive wave pattern forms
6. Manage exits based on pattern failures and Supertrend reversals
Impulsive Wave Validation
The strategy checks relative size relationships to confirm valid impulsive waves.
For uptrends, it ensures:
```
Copy code- Wave 3 is longer than wave 1
- Wave 5 is longer than wave 2
- Waves do not overlap
```
Corrective Wave Validation
The strategy identifies overlapping corrective patterns that retrace the prior impulsive wave within Fibonacci levels.
Pattern Failure Invalidation
If waves fail validation tests, the strategy invalidates the pattern and stops signaling trades.
## Trade Direction
The strategy detects impulsive and corrective patterns in both uptrends and downtrends. Entries are signaled in the direction of the validated wave pattern.
## Usage
- Use on charts showing clear Elliott Wave patterns
- Start with daily or weekly timeframes to gauge overall trend
- Optimize Zigzag and Supertrend settings as needed
- Consider combining with other indicators for confirmation
## Default Settings
- Zigzag Length: 4 bars
- Supertrend Length: 10 bars
- Supertrend Multiplier: 3
- Stop Loss: 10% of entry price
- Trading Direction: Both
ابحث في النصوص البرمجية عن "pivot points"

Bank Nifty ScalpingThis indicator is designed for scalping purposes.
Users have the option to input the desired source and enable or disable the following indicators:
Multiple EMA (Exponential moving average)
Simultaneously displays multiple moving averages to quickly identify shifts in momentum and obtain confirmation from slower-moving averages.
By default, the EMA display settings are configured to show the 20-day EMA and the 200-day EMA. However, users have the flexibility to modify the display settings according to their preferences. This means that users can customize the indicator to show the EMA values of their choice, such as EMA 50 and EMA 100.
VWAP ( Volume weighted average price )
Default value is set to ‘hl2’
A bullish trend is indicated when the price is above the Volume Weighted Average Price (VWAP), while a bearish trend is indicated when the price is below the VWAP.
VWMA ( Volume weighted moving average )
In the VWMA (Volume Weighted Moving Average) indicator, a default value of 20 is used. If the price is higher than the VWMA, it typically indicates a bullish trend. Conversely, if the price is lower than the VWMA, it suggests a bearish trend. The VWMA takes into account both price and volume, providing a weighted average that can help identify shifts in market sentiment.
Multiple SuperTrends
Default value is 10 and 2 / 10 and 3
A bullish trend is identified when the price is above the SuperTrend indicator, whereas a bearish trend is observed when the price is below the SuperTrend indicator.
Camarilla Pivot Points (Level 3 and 4 only)
Levels 3 and 4 serve as crucial support and resistance levels, acting as the final line of defense against strong trends. These levels are expected to generate reversals, where price often changes direction.
CPR ( Central Pivot Points)
The Daily Central Pivot Point Indicator is a popular tool used in technical analysis. It calculates several levels based on the previous day's high, low, and closing prices.
Strong Volume
The user has the ability to set the average volume for Nifty and BankNifty indices to calculate strong volume.
Elder Impulse System
The Impulse System, developed by Alexander Elder and discussed in his book "New Trading for a Living," is a censorship trading system designed to determine whether a trade should be allowed or prohibited. Additionally, it can be used to identify when a trend is starting to weaken. The Impulse System relies on the following factors:
1. Slope of a Fast Exponential Moving Average (EMA): The fast EMA's slope reflects the price's inertia or momentum.
2. Slope of the Moving Average Convergence Divergence (MACD): The MACD's slope indicates the strength or power of the price movement.
Based on these factors, the Impulse System categorizes candles or price bars into three colors:
* Green Candle: When both the fast EMA and MACD are rising, indicating upward momentum.
* Red Candle: When both the fast EMA and MACD are declining, suggesting downward momentum.
* Blue Candle: In all other cases where the conditions for green or red candles are not met, representing a neutral or uncertain market condition.
By applying the Impulse System, traders can gain insights into the market trend, its strength, and potential shifts in momentum, helping them make informed trading decisions.
Happy Trading

Relative Strength Index w/ STARC Bands and PivotsThis is an old script that I use with some useful RSI strategies from "Technical Analysis for the Trading Professional" 2nd edition by Constance Brown.
The base RSI comes with the option for custom length, and has some pre-configured ranges for looking at exits and entrances. The idea is to be bullish when bounces happen in the red zone during an already bullish trend or when the indicator enters green without a rejection. Be bearish if the indicator falls through the red zone or fails to enter green during an already bearish trend.
I have added the formulas used for creating STARC bands (just think fancier volatility bands) with adjustable tolerances. The idea is to look out for when the RSI touches one of the bands and reverses. This is usually indicative of a strong reversal (though the timing will be up to the trader). Best use this on shorter time frames during a volatile time of a stock's price action.
Although a little messy, there is a small segment of the script which includes pivot points. I like to use these because they make indicating local highs/lows for finding divergences easier.
Finally, I have added a couple of customizable EMAS for the RSI itself. Useful when combined with the other features!

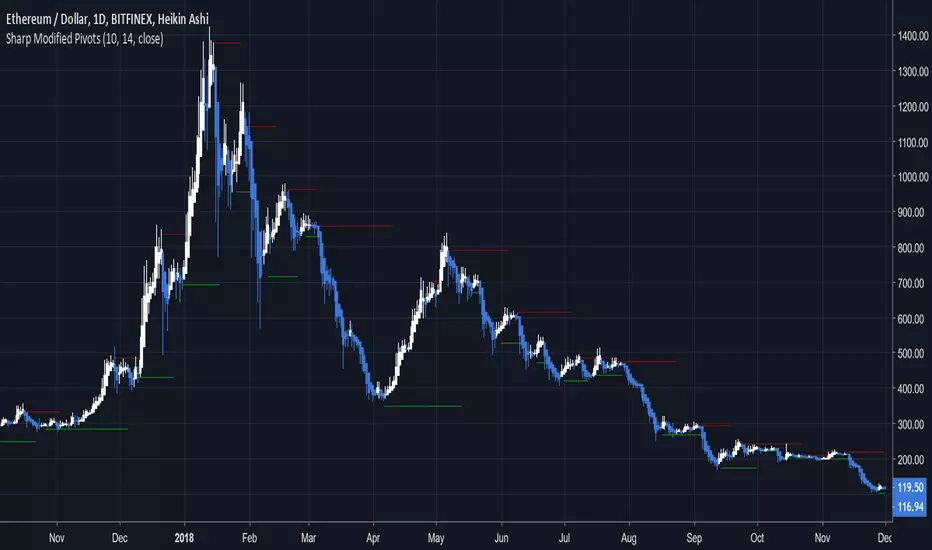
Hurst Diamond Notation PivotsThis is a fairly simple indicator for diamond notation of past hi/lo pivot points, a common method in Hurst analysis. The diamonds mark the troughs/peaks of each cycle. They are offset by their lookback and thus will not 'paint' until after they happen so anticipate accordingly. Practically, traders can use the average length of past pivot periods to forecast future pivot periods in time🔮. For example, if the average/dominant number of bars in an 80-bar pivot point period/cycle is 76, then a trader might forecast that the next pivot could occur 76-ish bars after the last confirmed pivot. The numbers/labels on the y-axis display the cycle length used for pivot detection. This indicator doesn't repaint, but it has a lot of lag; Please use it for forecasting instead of entry signals. This indicator scans for new pivots in the form of a rainbow line and circle; once the hi/lo has happened and the lookback has passed then the pivot will be plotted. The rainbow color per wavelength theme seems to be authentic to Hurst (or modern Hurst software) and has been included as a default.

Global & local RSI / quantifytoolsAs the terms global and local imply, global RSI describes broad relative strength, whereas local RSI describes local relative strength within the broad moves. A macro and micro view of relative strength so to speak. Global and local RSI are simply regular RSI and stochastic RSI. Local RSI extremes ( stochastic RSI oversold/overbought) often mark a pivot in RSI which naturally reflects to price. Local RSI extremes are visualized inside the global RSI bands (upper band for overbought, lower band for oversold) in a "heat map" style.
By default:
Stochastic RSI >= 75 = yellow
Stochastic RSI >= 87 = orange
Stochastic RSI >= 100 = pink
Users also have the ability smooth the RSI with their preferred smoothing method ( SMA , EMA , HMA , RMA, WMA ) and length. This leads to different behavior in RSI, rendering the typical RSI extremes (> 70 or < 30) suboptimal or even useless. By enabling adaptive bands, the extremes are readjusted based on typical RSI pivot points (median pivots ), which gives much more relevant reference points for oversold/overbought conditions in both global and local RSI. This feature can be used without smoothing, but it rarely provides a meaningful difference, unless the RSI calculation length is messed with.
Global RSI can be plotted as candles, bars or a line. Candles and bars can be useful for detecting rejections (wicks) in relative strength, the same you would with OHLC data. Sometimes there are "hidden rejections" that are visible in relative strength but not on OHLC data, which naturally gives an advantage. All colors can be adjusted in the input menu. You also have a real-time view of the current RSI states in top right corner. Available alerts are the following: global RSI overbought, global RSI oversold, local RSI overbought and local RSI oversold.

Camarilla PivotsA slimmed down/cleaner version of the "Pivot Points Standard" indicator. This is for Camarilla pivots only. The S and R pivots are renamed to L/H and the colors of pivot 1 and 2 are faded out by default since those pivots are less used in the Camarilla trading system. They can also be disabled of course.

NSDT Pivot ZonesThis is a new take on Traditional Pivot Points. By modifying the calculations, we were able to create "pivot zones" with a decent degree of accuracy.

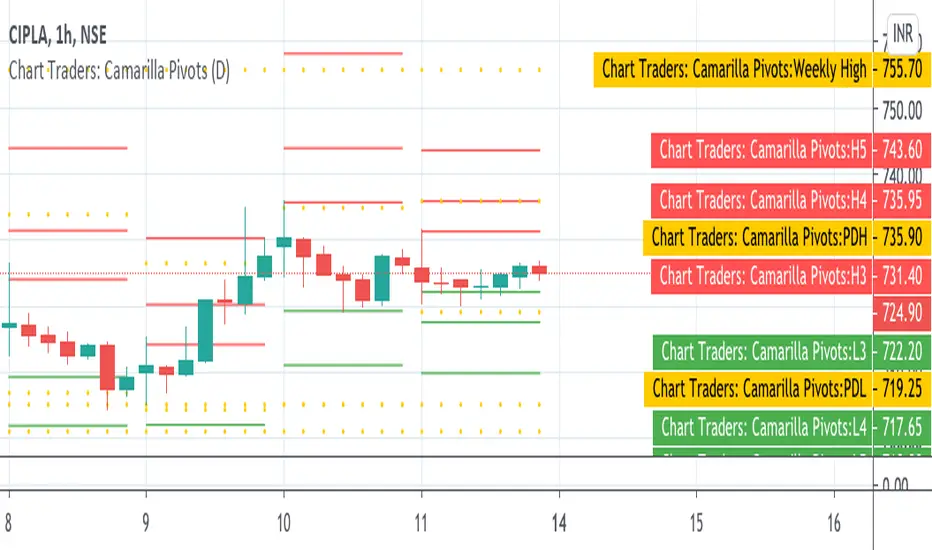
Chart Traders: Camarilla PivotsChart Traders: Camarilla Pivot point indicator gives you support and resistance level.
This indicator give (h1 to H5) five resistance level and (L1 to L5) support level. You can buy at any support level with reversal sign and sell at resistance with reversal sign.
In this indicator you can also see the next day Camarilla pivot points.
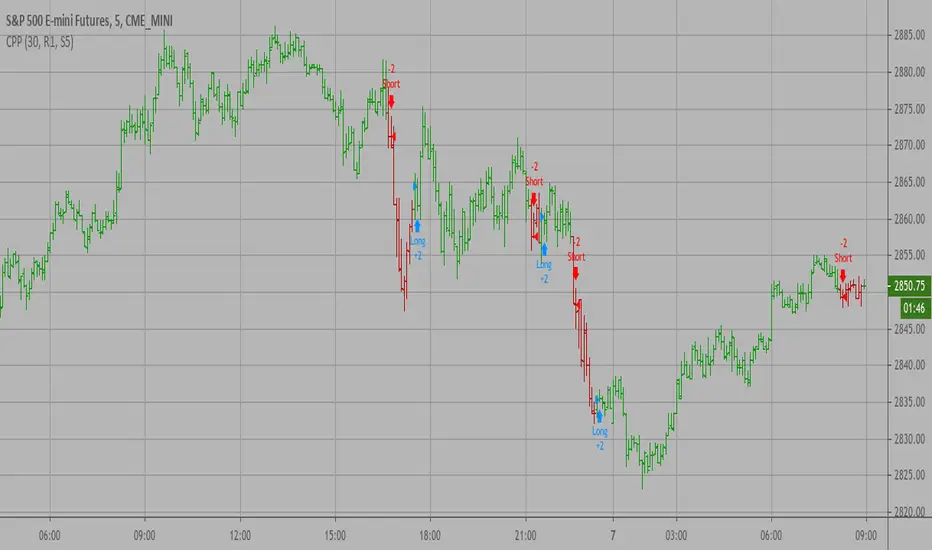
Camarilla Pivot Points Backtest Pivot point studies highlight prices considered to be a likely turning point
when looking at values from a previous period, whether it be daily, weekly,
quarterly or annual. Each pivot point study has its own characteristics on
how these points are calculated.
Red color = Sell
Green color = Buy
WARNING:
- For purpose educate only
- This script to change bars colors.
Camarilla Pivot Points Strategy Pivot point studies highlight prices considered to be a likely turning point
when looking at values from a previous period, whether it be daily, weekly,
quarterly or annual. Each pivot point study has its own characteristics on
how these points are calculated.
Red color = Sell
Green color = Buy
WARNING:
- For purpose educate only
- This script to change bars colors.

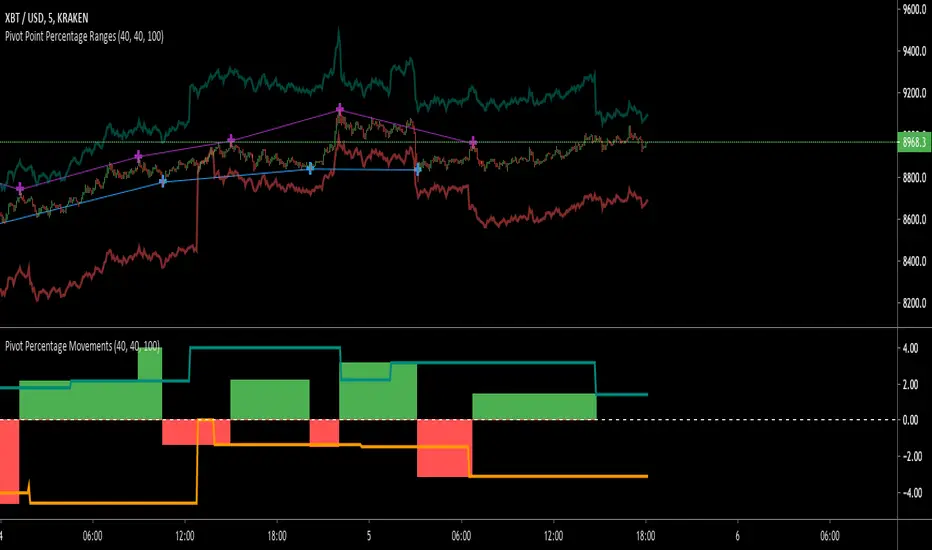
Pivot Point RangesThis script is meant to be a partner script to my Pivot Points Percentage Differences () indicator. It can be used to verify the percentages are what they should be, and give you a visual range in which to trade in.
If you have any questions please feel free to ask!
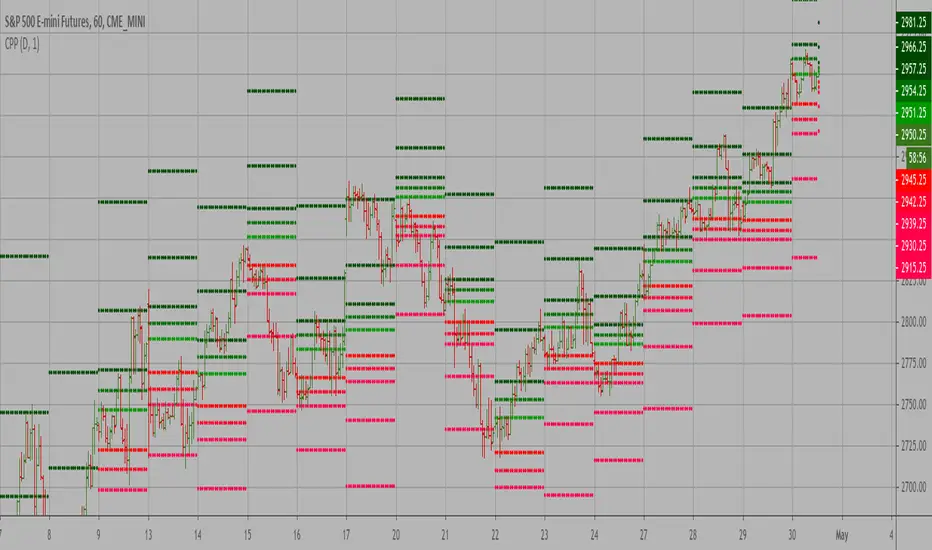
Camarilla Pivot Points V1 Pivot point studies highlight prices considered to be a likely turning point
when looking at values from a previous period, whether it be daily, weekly,
quarterly or annual. Each pivot point study has its own characteristics on
how these points are calculated.
WARNING:
- For purpose educate only
Divergences (Pivots)I created the divergence indicator using pivot points.
Leftbars and Rightbars of Pivots are the same here and taken together as "Div Period", default set as 2 (= "Short" period).
The second period ("Long") multiplies this by 2, if a period of 2 is set, the "Long" period will be 4.
The third period ("Long2") multiplies the "Long" by 2, in this case the "Long2" period would be 8.
In these periods the high and lows of "source" (default = "close", can be changed though) and "RSI" are captured and compared.
The default "RSI length" of "14" can be changed as well.
"Short", "Long" and "Long2" periods can be made visible together or separately (Settings > Inputs).
I recommend to use a "Period" of "1" when using "W" charts, "1 or 2" on "D" charts, and "2 or 3" (maybe higher) when using lower timeframes.
Bullish divergences are "Green", Bearish divergences are "Red", Hidden divergences (Bullish and Bearish) are "White".
"Short" > "▲▼" (Bullish = Up, Bearish = Down)
"Long" > "∆∇" (Bullish = Up, Bearish = Down)
"Long2" > "⇧⇩" (Bullish = Up, Bearish = Down)
The "Values" of "HH"(Higher High), "LL" (Lower Low"), "HL"(Higher Low) & "LH"(Lower High) can be made visible (Settings > Inputs).
Thank you!
Camerilla PivotsBefore starting special thanks to @QuantNomad for his script "Ultimate Pivot Point Alerts"
Link : -
Please follow and support him for his work.
In this script I'm modifying how time frame factor is imported into the script and removing other types of Pivots and cleaning it further for only CAMs, I've also added the formulas for 5 and 6 numbers, it will help in trading breakout strategies.
Note that this way of importing Time frame produces minor difference in readings/levels from how it is done in QuantNomads script, so before taking your pics you should calculate your levels on separate sheet and compare which ones are working for you and your strategy.
I've been using this CAM setup for almost a year now, so I coded it as per my needs, it is up to users to utilize it to theirs.
Further utility:
1. You can hide/unhide S/R levels 5/6
2. This is MultiTimeframe version, meaning you can change Time-frame of Pivots being displayed on any TF chart.
3. Lines are produced for only level 3 and 4. And you can choose to hide them. Only Pivot line is kept and can not be hidden.
4. You can also choose to hide/unhide level value and only see label if you want.
5. No historical levels are kept to avoid clutter.
I've not included alerts as I don't use them, but if anyone wants it I suggest referring to @QuantNomad script bank. He has published number of excellent scripts in this regard.
There is no restrictions on this script, it can be used and reproduced freely. Its my way of doing little something for community and my first script.
Enjoy.

Trendlines - JD This script draws trendlines from the pivot points in the price chart.
The input for the function that draws the trendlines is any calculation or function (eg. pivot points),
that most of the time and occasionally produces a 'non n/a' value.
The trendline function then connects the non n/a values and axtends the connections of those points in a trendline.
There is an option to draw the lines from the wicks or from the 'real bodies' of the candles.
The trendlines can either extend infinitely or only run for an adjustable amount of bars.
JD.

Pivot cycles - JDThis indicator tells you how many bars it takes to get from one pivot point to another.
This can give you a probability of when an upward or downward pivot is 'overdue'.
As is the nature of pivot points, this naturally lags by default by half of the pivot length!!
eg. if the pivot length is set to 6 the indicator will give you the pivot point 3 bars later.
JD.
#DYOR
#nottradingadvice

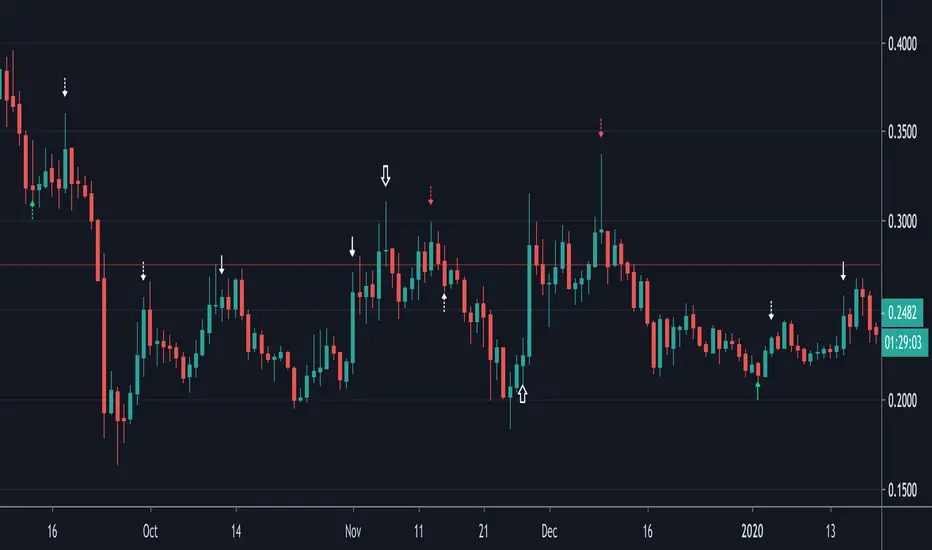
Sharp Modified PivotsThis uses everget's implementation of the Sharp Modified Moving Average to plot pivot points.
It can also show you when to exit your long or short positions if you toggle the option.
Check out everget's scripts at www.tradingview.com
Pivots High/Low 3bar No Period w/ Signals -Tom1traderwww.tradingview.com
This price action indicator calculated on the relationship of 3 adjacent bars/candles adds an extra dimension to my indicator mix and with
a different perspective can help confirm or question an opinion formed by other indications (volume related, momentum, the chart itself and etc.).
Further, I have traded with it a bit now and like it. So much for comfort - I have seen no clear evidence that the movement of the next bar is paying any
attention to indicators, lines or patterns on charts. They are all based on the same historical data whether that data is run through an indicator algorithm
or used to draw (chart style) on a chart. But they make me feel better about my trades and I prefer them to a coin flip. :-)
Pivot High Definition - (Pivot Low is reversed): A three-bar pivot high represents resistance and is formed when sellers turn price from up to down. It is seen where a price bar with a lower high closes below the previous bar's low, where the previous bar's high is higher than the bar that preceded it.
Read more: Price Pivots Circle Big Profits www.investopedia.com
Follow us: Investopedia on Facebook
I see some n period high/low indicators named pivots. This indicator has no period and is based on the relationship of 3 bars usually referred to as Pivots High Low.
Also no relationship to daily calculated "Pivot Points". As such this is a PRICE ACTION indicator. It works the same on ALL TIME FRAMES.
These pivots sometimes do not occur very often and usually are not at tops or bottoms.
This is why I used a combination of most recent PHs and PLs along with
the price to derive the signal.

Auto Fib Retracement-custom lines📈 Auto Fib Retracement (with Custom Line Thickness)
This indicator provides an automatic application of Fibonacci Retracement and Extension levels based on key Pivot points on the chart. It uses advanced logic to identify relevant momentum based on user-defined parameters, ensuring dynamic and accurate level drawing without the need for manual measurement.
Key Features of the Indicator ✨
Automatic Drawing: Fibonacci levels are automatically drawn based on the last significant Pivot swing detected by the indicator.
Fibonacci Retracement and Extension: Displays classic retracement levels (such as 0.382, 0.5, 0.618) and extensions (such as 1.272, 1.618, 2.618, etc.), with the option to individually toggle the visibility of each level.
Custom Line Width (New Feature): This is the key added functionality! For every Fibonacci level, an option has been included to individually adjust the line thickness (width). This allows traders to visually highlight (bold) critical support/resistance levels (like 0, 0.618, 1, etc.) to make them more noticeable on the chart.
Pivot Customization: Control the sensitivity of Pivot detection using the "Deviation" and "Depth" parameters.
Line Extension: Options to extend the Fibonacci lines to the left, right, or both sides.
Detail Display: Ability to show/hide Fibonacci values (levels) and prices on the labels.
⚙️ Input Parameters
This indicator offers complete control over how the Fibonacci levels are displayed:
Deviation: A multiplier that affects how much the price must deviate from the previous pivot for a new pivot to be formed. Increasing the value makes the indicator less sensitive; decreasing it makes it more sensitive.
Depth: The minimum number of bars considered when calculating the pivots.
Reverse: Option to reverse the drawing direction (from top to bottom or vice-versa).
Extend Left/Right: Controls the extension of the Fibonacci lines.
Level Settings (0, 0.236, 0.382, 0.5, 0.618, etc.):
Checkbox: Turn the display of each individual Fibonacci level on or off.
Value: Customize the Fibonacci value (e.g., you can change 0.618 to 0.65).
Color: Adjust the line color.
Line Width: Crucial option! Allows you to set the line thickness from 1 to 5. Use this to emphasize the most important levels.
Background Transparency: Adjust the transparency of the background fill between the Fibonacci levels.
How to Use It 💡
This tool is ideal for traders who use Fibonacci Retracement to determine potential areas of support and resistance, profit targets (extensions), and entry zones. Use the Custom Line Width option to visually set apart the key levels you believe have the most significant impact on the market (e.g., 0, 0.5, 0.618, and 1).

Volume Profile, Pivot Anchored by DGT - reviewedVolume Profile, Pivot Anchored by DGT - reviewed
This indicator, “Volume Profile, Pivot Anchored”, builds a volume profile between swing highs and lows (pivot points) to show where trading activity is concentrated.
It highlights:
Value Area (VAH / VAL) and Point of Control (POC)
Volume distribution by price level
Pivot-based labels showing price, % change, and volume
Optional colored candles based on volume strength relative to the average
Essentially, it visualizes how volume is distributed between market pivots to reveal key price zones and volume imbalances.

Market Pressure Oscillator█ OVERVIEW
The Market Pressure Oscillator is an advanced technical indicator for TradingView, enabling traders to identify potential trend reversals and momentum shifts through candle-based pressure analysis and divergence detection. It combines a smoothed oscillator with moving average signals, overbought/oversold levels, and divergence visualization, enhanced by customizable gradients, dynamic band colors, and alerts for quick decision-making.
█ CONCEPT
The indicator measures buying or selling pressure based on candle body size (open-to-close difference) and direction, with optional smoothing for clarity and divergence detection between price action and the oscillator. It relies solely on candle data, offering insights into trend strength, overbought/oversold conditions, and potential reversals with a customizable visual presentation.
█ WHY USE IT?
- Divergence Detection: Identifies bullish and bearish divergences to reinforce signals, especially near overbought/oversold zones.
- Candle Pressure Analysis: Measures pressure based on candle body size, normalized to a ±100 scale.
- Signal Generation: Provides buy/sell signals via overbought/oversold crossovers, zero-line crossovers, moving average zero-line crossovers, and dynamic band color changes.
- Visual Clarity: Uses dynamic colors, gradients, and fill layers for intuitive chart analysis.
Flexibility: Extensive settings allow customization to individual trading preferences.
█ HOW IT WORKS?
- Candle Pressure Calculation: Computes candle body size as math.abs(close - open), normalized against the average body size over a lookback period (avgBody = ta.sma(body, len)). - Candle direction (bullish: +1, bearish: -1, neutral: 0) is multiplied by body weight to derive pressure.
- Cumulative Pressure: Sums pressure values over the lookback period (Lookback Length) and normalizes to ±100 relative to the maximum possible value.
- Smoothing: Optionally applies EMA (Smoothing Length) to normalized pressure.
- Moving Average: Calculates SMA (Moving Average Length) for trend confirmation (Moving Average (SMA)).
- Divergence Detection: Identifies bullish/bearish divergences by comparing price and oscillator pivot highs/lows within a specified range (Pivot Length). Divergence signals appear with a delay equal to the Pivot Length.
- Signals: Generates signals for:
Crossing oversold upward (buy) or overbought downward (sell).
Crossing the zero line by the oscillator or moving average (buy/sell).
Bullish/bearish divergences, marked with labels, enhancing signals, especially near overbought/oversold zones.
Dynamic band color changes when the moving average crosses MA overbought/oversold thresholds (green for oversold, red for overbought).
- Visualization: Plots the oscillator and moving average with dynamic colors, gradient fills, transparent bands, and labels, with customizable overbought/oversold levels.
Alerts: Built-in alerts for divergences, overbought/oversold crossovers, and zero-line crossovers (oscillator and moving average).
█ SETTINGS AND CUSTOMIZATION
- Lookback Length: Period for aggregating candle pressure (default: 14).
- Smoothing Length (EMA): EMA length for smoothing the oscillator (default: 1). Higher values smooth the signal but may reduce signal frequency; adjust overbought/oversold levels accordingly.
- Moving Average Length (SMA): SMA length for the moving average (default: 14, minval=1). Higher values make SMA a trend indicator, requiring adjusted MA overbought/oversold levels.
- Pivot Length (Left/Right): Candles for detecting pivot highs/lows in divergence calculations (default: 2, minval=1). Higher values reduce noise but add delay equal to the set value.
- Enable Divergence Detection: Enables divergence detection (default: true).
- Overbought/Oversold Levels: Thresholds for the oscillator (default: 30/-30) and moving average (default: 10/-10). For the moving average, no arrows appear; bands change color from gray to green (oversold) or red (overbought), reinforcing entry signals.
- Signal Type: Select signals to display: "None", "Overbought/Oversold", "Zero Line", "MA Zero Line", "All" (default: "Overbought/Oversold").
- Colors and Gradients: Customize colors for bullish/bearish oscillator, moving average, zero line, overbought/oversold levels, and divergence labels.
- Transparency: Adjust gradient fill transparency (default: 70, minval=0, maxval=100) and band/label transparency (default: 40, minval=0, maxval=100) for consistent visuals.
- Visualizations: Enable/disable moving average, gradients for zero/overbought/oversold levels, and gradient fills.
█ USAGE EXAMPLES
- Momentum Analysis: Observe the MPO Oscillator above 0 for bullish momentum or below 0 for bearish momentum. The SMA, being smoother, reacts slower and can confirm trend direction as a noise filter.
- Reversal Signals: Look for buy triangles when the oscillator crosses oversold upward, especially when the SMA is below the MA oversold threshold and the band turns green. Similarly, seek sell triangles when crossing overbought downward, with the SMA above the MA overbought threshold and the band turning red.
- Using Divergences: Treat bullish (green labels) and bearish (red labels) divergences as reinforcement for other signals, especially near overbought/oversold zones, indicating stronger potential trend reversals.
- Customization: Adjust lookback length, smoothing, and moving average length to specific instruments and timeframes to minimize false signals.
█ USER NOTES
Combine the indicator with tools like Fibonacci levels or pivot points to enhance accuracy.
Test different settings for lookback length, smoothing, and moving average length on your chosen instrument and timeframe to find optimal values.

Confluence Engine Confluence Engine is a practical, non-repainting decision aid that scores market conditions from −100…+100 by combining six proven modules: Trend, Momentum, Volatility, Volume, Structure, and an HTF confirmation. It’s designed for crypto, forex, indices, and stocks, and it fires entries only on confirmed bar closes.
What’s inside
Trend: EMA 20/50/200 alignment plus a Supertrend/KAMA toggle (you choose the baseline).
Momentum: RSI + MACD with confirmed-pivot divergence detection.
Volatility: ATR% and Bollinger Band width vs its average to favor expansion over chop.
Volume: OBV-style cumulative flow slope + volume surge vs SMA×multiplier.
Market Structure: Confirmed pivots, BOS (break of structure) and CHOCH (change of character).
HTF Filter: Closed higher-timeframe context via request.security(..., barmerge.gaps_on, barmerge.lookahead_off).
Why it does not repaint
Signals are computed and plotted on closed bars only.
Pivots/divergences use confirmed pivot points (no forward look).
HTF series are fetched with lookahead_off and use the last closed HTF bar in realtime.
No future bar references are used for entries or alerts.
How to use (3 steps)
Pick a timeframe pair: use a 4–6× HTF multiplier (5m→30m, 15m→1h, 1h→4h, 4h→1D, 1D→1W).
Trade with the HTF: take longs only when the HTF filter is bullish; shorts only when bearish.
Prefer expansion: act when BB width > its average and ATR% is elevated; skip most signals in compression.
Suggested presets (start here)
Crypto (BTC/ETH): 15m→1h, 1h→4h. stLen=10, stMult=3.0, bbLen=20, surgeMul=1.8–2.2, thresholds +40 / −40 (intraday can try +35 / −35).
Forex majors: 15m→1h, 1h→4h. stLen=10–14, stMult=2.5–3.0, surgeMul=1.5–1.8, thresholds +35 / −35 (swing: +45 / −45).
US equities (liquid): 5m→30m/1h, 15m→1h/2h. stMult=3.0–3.5, surgeMul=1.6–2.0, thresholds +45 / −45 to reduce chop.
Indices (ES/NQ): 5m→30m, 15m→1h. Defaults are fine; start at +40 / −40.
Gold/Oil: 15m→1h, 1h→4h. Thresholds +35 / −35, surgeMul=1.6–1.9.
Inputs (plain English)
Use Supertrend (off = KAMA): choose the trend baseline.
EMA Fast/Mid/Slow: 20/50/200 by default for classic stack.
RSI/MACD + divergence pivots: momentum and exhaustion context.
ATR Length & BB Length: volatility regime detection.
Volume SMA & Surge Multiplier: defines “meaningful” volume spikes.
Pivot left/right & “Confirm BOS/CHOCH on Close”: structure strictness.
Enable HTF & Higher Timeframe: confirms the lower timeframe direction.
Thresholds (+long / −short): when the score crosses these, you get signals.
Signals & alerts (IDs preserved)
Entry shapes plot at bar close when the score crosses thresholds.
Alerts you can enable:
CONFLUENCE LONG — long entry signal
CONFLUENCE SHORT — short entry signal
BULLISH BIAS — score turned positive
BEARISH BIAS — score turned negative
Best practices
Focus on signals with HTF agreement and volatility expansion; require volume participation (surge or rising OBV slope) for higher quality.
Raise thresholds (+45/−45 or +50/−50) to reduce whipsaws in choppy sessions.
Lower thresholds (+35/−35) only if you also require volatility/volume filters.
Performance & scope
Works across crypto/FX/equities/indices; no broker data or special feeds required.
No repainting by design; signals/alerts are computed on closed bars.
As with any tool, results vary by regime; always combine with risk management.
Disclosure
This script is for educational purposes only and is not financial advice. Trading involves risk. Test on historical data and paper trade before using live.

Smart Market Matrix Smart Market Matrix
This indicator is designed for intraday, scalping, providing automated detection of price pivots, liquidity traps, and breakout confirmations, along with a context dashboard featuring volatility, trend, and volume.
## Summary Description
### Menu Settings & Their Roles
- **Swing Pivot Strength**: Controls the sensitivity for detecting High/Low pivots.
- **Show Pivot Points**: Toggles the display of HH/LL markers on the chart.
- **VWMA Length for Trap Volume** & **Volume Spike Multiplier**: Identify concentrated volume spikes for liquidity traps.
- **Wick Ratio Threshold** & **Max Body Size Ratio**: Detect candles with disproportionate wicks and small bodies (doji-ish) for traps.
- **ATR Length for Trap**: Measures volatility specific to trap detection.
- **VWMA Length for Breakout Volume**, **ATR Multiplier for Breakout**, **ATR Length for Breakout**, **Min Body/Range Ratio**: Set adaptive breakout thresholds based on volatility and volume.
- **OBV Smooth Length**: Smooths OBV momentum for breakout confirmation.
- **Enable VWAP Filter for Confirmations**: Optionally validate breakouts against the VWAP.
- **Enable Higher-TF Trend Filter** & **Trend Filter Timeframe**: Align breakout signals with the 1h/4h/Daily trend.
- **ADX Length**, **EMA Fast/Slow Length for Context**: Parameters for the context dashboard (Volatility, Trend, Volume).
- **Show Intraday VWAP Line**, **VWAP Line Color/Width**: Display the intraday VWAP line with custom style.
### Signal Interpretation Map
| Signal | Description | Recommended Action |
|--------------------------------|-----------------------------------------------------------|-------------------------------------------|
| 📌 **HH / LL (pivot)** | Market structure (support/resistance) | Note key levels |
| **Bull Trap(green diamond)** | Sweep down + volume spike + wick + rejection | Go long with trend filter
| **Bear Trap(red diamond)** | Sweep up + volume spike + wick + rejection | Go short with trend filter
| 🔵⬆️ **Breakout Confirmed Up** | Close > ATR‑scaled high + volume + OBV↑ | Go long with trend filter |
| 🔵⬇️ **Breakout Confirmed Down** | Close < ATR‑scaled low + volume + OBV↓ | Go short with trend filter |
| 📊 **VWAP Line** | Intraday reference to guide price | Use as dynamic support/resistance |
| ⚡ **Volatility** | ATR ratio High/Med/Low | Adjust position size |
| 📈 **Trend Context** | ADX+EMA Strong/Moderate/Weak | Confirm trend direction |
| 🔍 **Volume Context** | Breakout / Rising / Falling / Calm | Check volume momentum |
*This summary gives you a quick overview of the key settings and how to interpret signals for efficient intraday scalping.*
### Suggested Settings
- **Intraday Scalping (5m–15m)**
- `Swing Pivot Strength = 5`
- `VWMA Length for Trap Volume = 10`, `Volume Spike Multiplier = 1.6`
- `ATR Length for Trap = 7`
- `VWMA Length for Breakout Volume = 12`, `ATR Length for Breakout = 9`, `ATR Multiplier for Breakout = 0.5`
- `Min Body/Range Ratio for Breakout = 0.5`, `OBV Smooth Length = 7`
- `Enable Higher-TF Trend Filter = true` (TF = 60)
- `Show Intraday VWAP Line = true` (Color = orange, Width = 2)
- **Swing Trading (4h–Daily)**
- `Swing Pivot Strength = 10`
- `VWMA Length for Trap Volume = 20`, `Volume Spike Multiplier = 2.0`
- `ATR Length for Trap = 14`
- `VWMA Length for Breakout Volume = 30`, `ATR Length for Breakout = 14`, `ATR Multiplier for Breakout = 0.8`
- `Min Body/Range Ratio for Breakout = 0.7`, `OBV Smooth Length = 14`
- `Enable Higher-TF Trend Filter = true` (TF = D)
- `Show Intraday VWAP Line = false`
*Adjust these values based on the symbol and market volatility for optimal performance.*
