Cuban's Price Action ChannelThe latest in the indicator series tailored to discretionary traders.
This script draws a channel by using the highs and lows of previous timeframes. The H1 and H4 fill is extremely useful for taking low timeframe front-side reversals in a ranging environment, while providing high timeframe levels to take profit at, and plan your next trade.
I believe this script provides a solid fundamental price action understanding and foundation to anyone's discretionary trading setup.
ابحث في النصوص البرمجية عن "price action"

Tradeer Price Action Pack v1.01This indicator is able to show many price action patterns that are not widely known to the public and many more. For example Point Of Control of every bar from used TF, Fibonachi retracement and extension based on weekly, monthly and yearly TF, it shows pivots in the right way on the chart. With this indicator trader can easily find strong support or resistence levels by using GAP (single) in price, it is not the overnight GAP many traders are using in stock market, but this one shows strong buying or selling pressure. There are many more options to display or set.

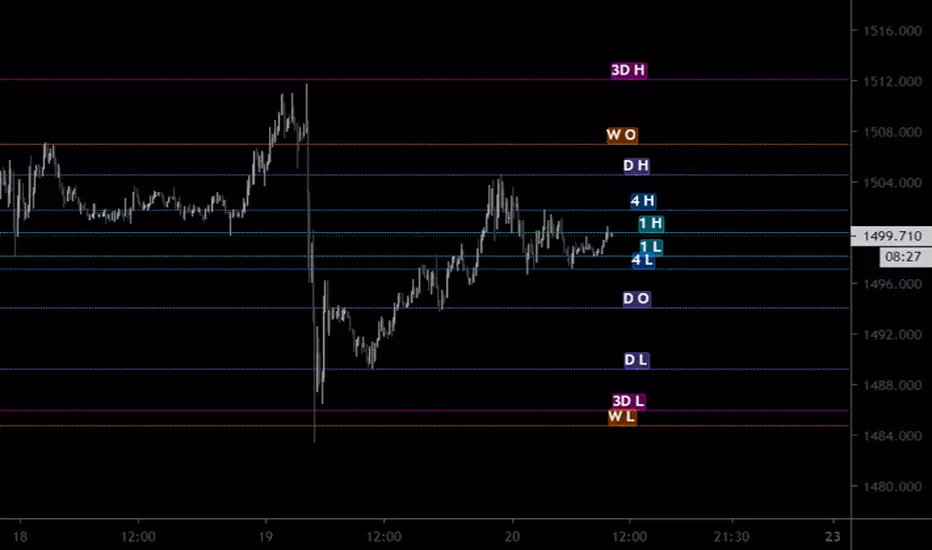
Pumpenomics Price-action Levels (OHL M)Simple price-action levels in regards to the OHL and M levels.
Levels available:
Open (Orange)
High (Green)
Low (Red)
Middle [ /2] (Aqua)
Timeframes available:
1H, 4H, Daily, Weekly, Monthly, Quarterly, Yearly
Enjoy!
-
Inspired by Long Term Levels (4h, D, W, M, Q, & Y) by scarf

Iconik Trading Suite: Price Action AlertsDisplays signals for Iconik MACD bullish and bearish crosses (including front running signals) along with tops and bottoms.
DM for a PowerPoint describing this indicator and the rest of Iconik in detail.
Iconik Trading Suite Indicator List:
ITS-OSC: Oscillators (v2)
ITS-PAA: Price Action Alerts (v2)
ITS-ASR: Auto Support/Resistance
-> Daily (v2)
-> 3 Day (v2)
-> Weekly (v2)
ITS-4TFC: 4 Time Frame Confirmation (v1)
ITS-DIV: Divergence Seeker (v1)

[AU] Price Action Levelsv2a
Price action levels for multiple timeframes with standard alignment and offset options using modulus for stagger and spacing
1hr, 4hr, D, 3D, W, M, Quarter, Year timeframes and levels available
Based upon Long term levels by scarf()
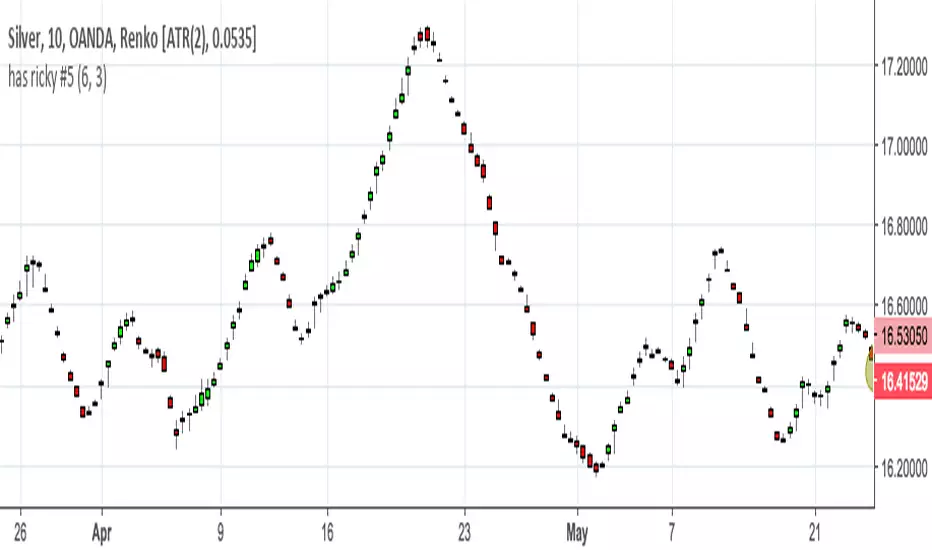
Forecast Oscillator & Point of ForceThis is a scaled version of the Forecast Oscillator, paired with a Point of Force Indicator, my modification of an indicator, whose original name and developer happened to be missing on my notes, so my regards to the author).
Point of force is a spot from where price action will dynamically evolve in the same direction or soon reverse and pursue that reversed path. It may be an indication of a turning point or entry point to consider going long/short and should be use together with a background oscillator showing a prevailing local trend.


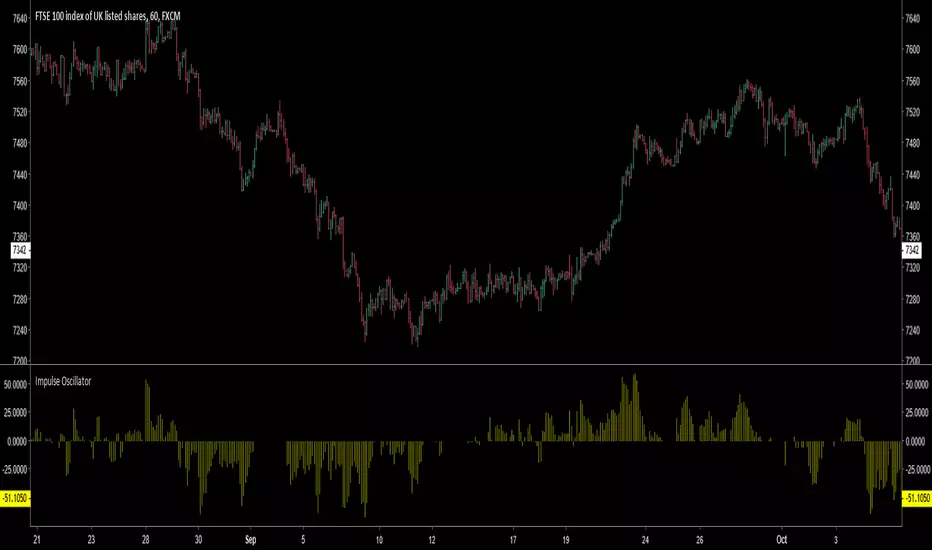
Impulse Oscillator without legs for Price Action & Elliott WavesHi Traders,
I have a newcomer for impulsetrading.
This indicator is an oscillator that show without legs impulses of Price Action .
For the expertise: you can use it for counting elliott waves !
Have fun and winning trades!
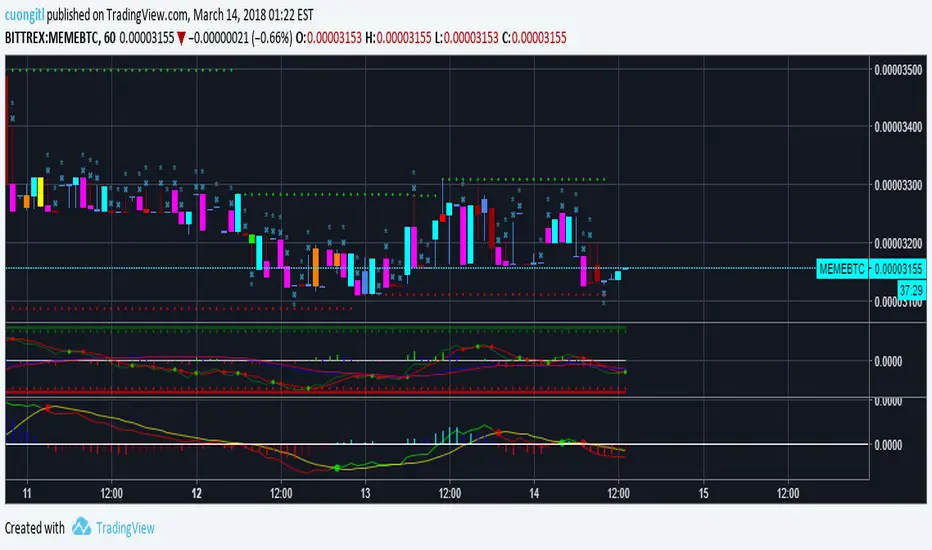
CryptoVN - Price Action Bars and Fractal v2*Mod version from "CM_Price-Action-Bars by ChrisMoody" and "Fractal Support Resistance (Fixed Volume) 2" by synapticEx.
v2:
- Fix some bug
- Allow On/Off Fractal Support & Resistance Levels on chart.
(*)Price Action Bars:
- Yellow = Inside Bar – Breakout Patterns
- Orange = Outside Bar – Breakout Patterns
- Green/Red = Pin Bars
- Aqua/Fuchsia = Shaved Bars
(*) Fractal Support/Resistance on current chart.
(*)My Advice to You:
- The Trend Is Your Friend. TRADE WHAT YOU SEE, NOT WHAT YOU THINK.
Good luck. Happy Trading Life ^^!
-- Notes: for this indicator work, you must set the Candles color look like this:

CryptoVN - Price Action Bard and Fractal*Mod version from "CM_Price-Action-Bars" by ChrisMoody and "Fractal Support Resistance (Fixed Volume) 2" by synapticEx
(*)Price Action Bars:
- Yellow = Inside Bar – Breakout Patterns
- Orange = Outside Bar – Breakout Patterns
- Green/Red = Pin Bars
- Aqua/Fuchsia = Shaved Bars
(*) Fractal Support/Resistance on current chart.
(*)My Advice to You:
- The Trend Is Your Friend. TRADE WHAT YOU SEE, NOT WHAT YOU THINK.
Good luck. ^^!


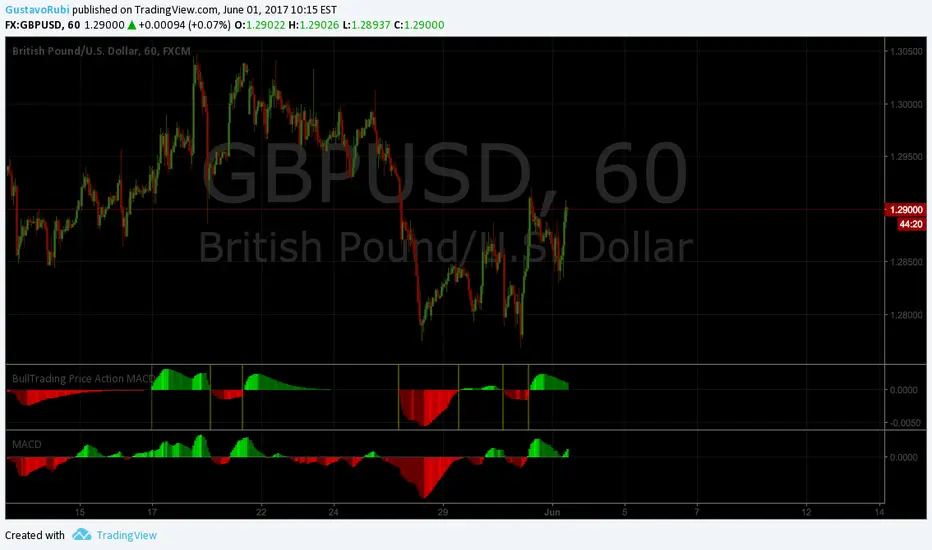
BullTrading PA-MACDBullTrading PA-MACD contains different algorithms based on price action to calculate and display the popular MACD indicator. It will display more relevant crosses without sacrificing much sensibility (use fractal entries).
Basic price-action scriptIn the indicator field my basic price-action script appliead on the Dutch AEX-index with a weekly timeframe .

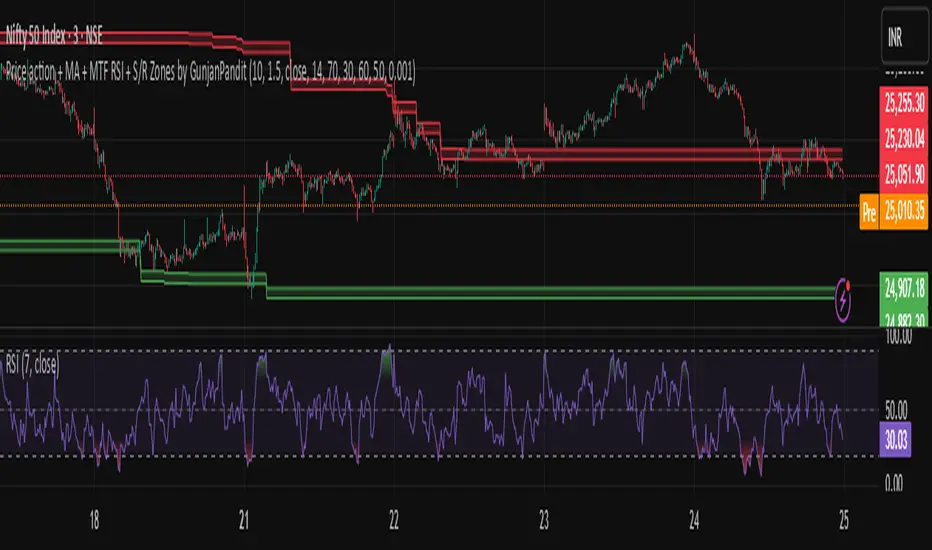
Price action + MA + MTF RSI + S/R Zones by GunjanPanditDescription:
This script combines multiple powerful trading tools into a unified indicator designed for trend-following and confirmation-based entries. It is built to assist traders in identifying actionable signals based on price structure, volatility, and momentum across multiple timeframes.
🔧 How It Works
✅ UT Bot Core Logic
The script uses a variation of the UT Bot (Ultimate Trend Bot) method to generate buy/sell signals.
Signals are based on ATR-filtered trailing stop levels to reduce noise and detect real trend changes.
A Buy is triggered when the price closes above the UT trailing stop.
A Sell is triggered when the price closes below it.
✅ Multi-Timeframe RSI Confirmation
RSI is calculated on a user-defined higher timeframe (default: 1 hour).
A buy signal is confirmed only if RSI is below the oversold level, and vice versa for sell signals.
This confirmation layer adds an extra filter to improve signal reliability and reduce whipsaws.
✅ Support & Resistance Zones (MTF)
The script automatically plots dynamic support and resistance zones using highs/lows from the selected higher timeframe.
These zones are visualized as shaded bands, helping users recognize key levels where price may reverse or consolidate.
✅ Visual Aids & Alerts
Buy and Sell signals are clearly labeled on the chart.
Optional RSI plot in a separate pane for visual monitoring.
Real-time alert conditions included for both Buy and Sell entries.
📈 Use Case & Recommendations
This script is best suited for:
Swing trading or intraday strategies in trending markets.
Traders who want confirmation across timeframes to filter noise.
Spotting key entry zones aligned with momentum and volatility.
Recommended to use in combination with:
Volume or trend structure analysis.
Stop-loss and take-profit risk management based on ATR or S/R zones.
inal Thoughts
This indicator is ideal for traders who value:
Multi-timeframe analysis
Visual clarity
Signal confirmation
And clean, customizable overlays for actionable trading insights.
Algorithmic Kalman Filter [CRYPTIK1]Price action is chaos. Markets are driven by high-frequency algorithms, emotional reactions, and raw speculation, creating a constant stream of noise that obscures the true underlying trend. A simple moving average is too slow, too primitive to navigate this environment effectively. It lags, it gets chopped up, and it fails when you need it most.
This script implements an Algorithmic Kalman Filter (AKF), a sophisticated signal processing algorithm adapted from aerospace and robotic guidance systems. Its purpose is singular: to strip away market noise and provide a hyper-adaptive, self-correcting estimate of an asset's true trajectory.
The Concept: An Adaptive Intelligence
Unlike a moving average that mindlessly averages past data, the Kalman Filter operates on a two-step principle: Predict and Update.
Predict: On each new bar, the filter makes a prediction of the true price based on its previous state.
Update: It then measures the error between its prediction and the actual closing price. It uses this error to intelligently correct its estimate, learning from its mistakes in real-time.
The result is a flawlessly smooth line that adapts to volatility. It remains stable during chop and reacts swiftly to new trends, giving you a crystal-clear view of the market's real intention.
How to Wield the Filter: The Core Settings
The power of the AKF lies in its two tuning parameters, which allow you to calibrate the filter's "brain" to any asset or timeframe.
Process Noise (Q) - Responsiveness: This controls how much you expect the true trend to change.
A higher Q value makes the filter more sensitive and responsive to recent price action. Use this for highly volatile assets or lower timeframes.
A lower Q value makes the filter smoother and more stable, trusting that the underlying trend is slow-moving. Use this for higher timeframes or ranging markets.
Measurement Noise (R) - Smoothness: This controls how much you trust the incoming price data.
A higher R value tells the filter that the price is extremely noisy and to be more skeptical. This results in a much smoother, slower-moving line.
A lower R value tells the filter to trust the price data more, resulting in a line that tracks price more closely.
The interaction between Q and R is what gives the filter its power. The default settings provide a solid baseline, but a true operator will fine-tune these to perfectly match the rhythm of their chosen market.
Tactical Application
The AKF is not just a line; it's a complete framework for viewing the market.
Trend Identification: The primary signal. The filter's color code provides an unambiguous definition of the trend. Teal for an uptrend, Pink for a downtrend. No more guesswork.
Dynamic Support & Resistance: The filter itself acts as a dynamic level. Watch for price to pull back and find support on a rising (Teal) filter in an uptrend, or to be rejected by a falling (Pink) filter in a downtrend.
A Higher-Order Filter: Use the AKF's trend state to filter signals from your primary strategy. For example, only take long signals when the AKF is Teal. This single rule can dramatically reduce noise and eliminate low-probability trades.
This is a professional-grade tool for traders who are serious about gaining a statistical edge. Ditch the lagging averages. Extract the signal from the noise.

Price Action: Engulfing PatternsBullish Engulfing Pattern Detection: A bullish engulfing pattern is identified when the previous candle is bearish (close < open ), the current candle is bullish (close > open), and the current candle's body engulfs the previous candle's body (close >= open and open <= close ).
Bearish Engulfing Pattern Detection: A bearish engulfing pattern is identified when the previous candle is bullish (close > open ), the current candle is bearish (close < open), and the current candle's body engulfs the previous candle's body (open >= close and close <= open ).
Plotting the Patterns: The plotshape function is used to mark the detected patterns on the chart. Bullish engulfing patterns are marked below the bar with a green upward label, while bearish engulfing patterns are marked above the bar with a red downward label.

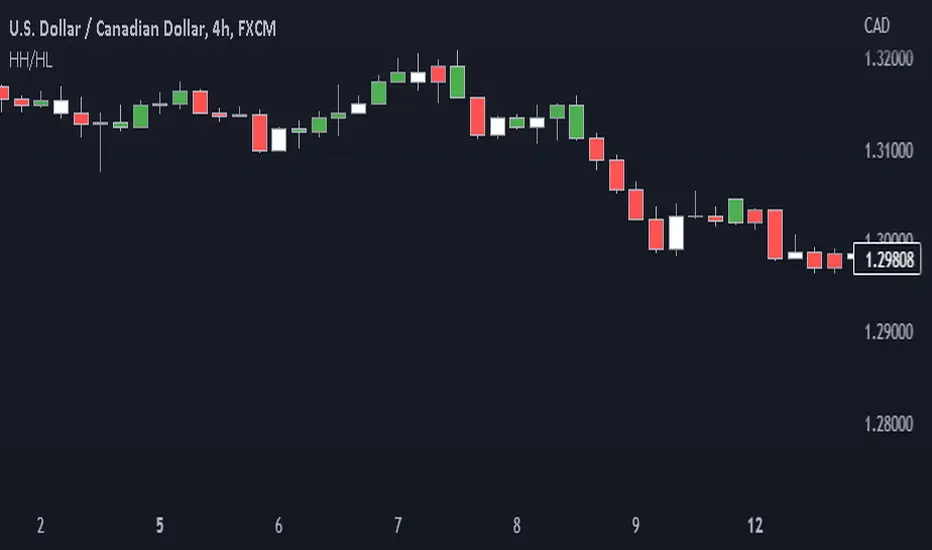
Price action: candlestick trend painter This script paints bars in different colors based on whether they are trending up or down.
It shows you if a candle is bearish or bullish based on the high and low of the previous candle.
Bull candles form higher highs (HH) and higher lows (HL) from the previous candle and are painted green.
Bear candles form lower highs (LH) and lower lows (LL) from the previous candle and are painted red.
Disclaimer
Copyright by Drbondsbody.
The information contained in my scripts/indicators/ideas does not constitute financial advice or a solicitation to buy or sell any securities of any type. I will not accept liability for any loss or damage, including without limitation any loss of profit, which may arise directly or indirectly from the use of or reliance on such information.
All investments involve risk, and the past performance of a security, industry, sector, market, financial product, trading strategy, or individual’s trading does not guarantee future results or returns. Investors are fully responsible for any investment decisions they make. Such decisions should be based solely on an evaluation of their financial circumstances, investment objectives, risk tolerance, and liquidity needs.
My scripts/indicators/ideas are only for educational purposes!
Price Action: Inside Bar BoxesThis script automatically draws rectangles around bars inside IB pattern.
Note :: because Pinescript does not allow changes to already drawn charts on historical bars, checkbox "show only last box" doesn't work for arrows

FluidTrades - SMC Lite
Price action and supply and demand is a key strategy use in trading. We wanted it to be easy and efficient for user to identify these zones, so the user can focus less on marking up charts and focus more on executing trades.
This indicator shows you supply and demand zones by using pivot points to show you the recent highs and the recent lows.
Features
This indicator includes some features relevant to SMC , these are highlighted below:
Full internal & swing market structure labeling in real-time
Swing Structure: Displays the swing structure labels & solid lines on the chart (BOS).
Supply & demand ( bullish & bearish )
Swing Points: Displays swing points labels on chart such as HH, HL, LH, LL.
Options to style the indicator to more easily display these concepts
White OB (supply): search for short opportunities
Blue OB (demand): search for long opportunities
Break of structure ( BOS )
For markets to move up and down a break in market structure must occur. A break in market structure occurs when the market begins to shift direction and break the previous HH and HL or HL and LL of the market. We also integrated the feature that you can see the BOS lines. In the indicator settings you can adjust the color of the label.
Settings
SwingHigh/Low Length: Allows the user to select Historical (default) or Present, which displays only recent data on the chart.
Supply/demand box width: Allows user to change the size of the supply and demand box
History to keep: allows the user to select how many most recent supply & demand box appear on the chart.
Visual settings
Show zig zag : allow user to see market patters within the market
Show price action labels: allow user to turn on/off the (swing points)
Supply box color : allow users to change the color of their supply box
Demand box color : allow users to change the color of their supply box
Bos label color : allow users to change the color of their BOS label
Poi label color : allow user to change the color of their POI label
Price action label : allow users to change the color of their swing points labels
Zig zag color : allow users to change the color of the zig/zag market patters
Warning
Never blindly take a trade on a supply/demand box - wait for a proper market structure to occur before considering a trade.

sarbesh tiwari- Separate ATRprice action. itv shows good result. donate if make profit.contact at mitthu497@gmail.com

Price Action - Support & Resistance by DGTSᴜᴘᴘᴏʀᴛ ᴀɴᴅ Rᴇꜱɪꜱᴛᴀɴᴄᴇ , is undoubtedly one of the key concepts of technical analysis
█ Sᴜᴘᴘᴏʀᴛ ᴀɴᴅ Rᴇꜱɪꜱᴛᴀɴᴄᴇ Dᴇꜰɪɴɪᴛɪᴏɴ
Support and Resistance terms are used by traders to refer to price levels on charts that tend to act as barriers, preventing the price of an financial instrument from getting pushed in a certain direction.
A support level is a price level where buyers are more aggressive than sellers. This means that the price is more likely to "bounce" off this level rather than break through it. However, once the price has breached this level it is likely to continue falling until meeting another support level.
A resistance level is the opposite of a support level. It is where the price tends to find resistance as it rises. Again, this means that the price is more likely to "bounce" off this level rather than break through it. However, once the price has breached this level it is likely to continue rising until meeting another resistance level.
A previous support level will sometimes become a resistance level when the price attempts to move back up, and conversely, a resistance level will become a support level as the price temporarily falls back.
█ Iᴅᴇɴᴛɪꜰʏɪɴɢ Sᴜᴘᴘᴏʀᴛ ᴀɴᴅ Rᴇꜱɪꜱᴛᴀɴᴄᴇ
Support and resistance can come in various forms, and the concept is more difficult to master than it first appears. Identification of key support and resistance levels is an essential ingredient to successful technical analysis.
If the price stalls and reverses in the same price area on minimum of two different occasions, then a horizontal line is drawn to show that the market is struggling to move past that area. Those areas are static barriers, one of the most popular forms of support/resistance and are highlighted with horizontal lines.
Repeated test , the more often a support/resistance level is "tested" over an extended period of time (touched and bounced off by price), the more significance is given to that specific level
High volume , the more buying and selling that has occurred at a particular price level, the stronger the support or resistance level is likely to be
Market psychology , plays a major role as traders and investors remember the past and react to changing conditions to anticipate future market movement.
Psychological levels , is a price level that significantly affects the price of an underlying financial instrument. Typically, near round numbers often serve as support and resistance
The following support and resistance related topics are beyond the scope of this study, so they will be mentioned roughly only as a reference for support and resistance concept
Trendlines , Support and resistance levels in trends are dynamic. Throughout an uptrend, levels of support tend to look like a trendline, usually clustering around higher lows. As the price rises, the price where buyers consider the stock to be “too cheap” also changes, which creates new support levels on the way up. The same is also true for resistance levels. In an uptrend, a stock is continuously breaking through perceived resistance levels and making new highs
Moving Averages , is a constantly changing line that smooths out past price data while also allowing the trader to identify support and resistance. In the example Notice how the price of the asset finds support at the moving average when the trend is up, and how it acts as resistance when the trend is down
The Fibonacci Retracement/Extension tool , is a favorite among many short-term traders because it clearly identifies levels of potential support and resistance
Pivot Point Calculations , is another common technical analysis technique, where pivot point is calculated based on the high, low, and closing prices of previous trading session/day and support & resistance levels are projected based on the pivot point, different calculation techniques are available, as presented in this example of an pivot point indicator : PVTvX by DGT
█ Tʀᴀᴅɪɴɢ Bᴀꜱᴇᴅ ᴏɴ Sᴜᴘᴘᴏʀᴛ ᴀɴᴅ Rᴇꜱɪꜱᴛᴀɴᴄᴇ
Once an area or "zone" of support or resistance has been identified, those price levels can serve as potential entry or exit points because, as a price reaches a point of support or resistance, it will do one of two things—bounce back away from the support or resistance level (trading ranges), or violate the price level and continue in its direction (trading breakouts) —until it hits the next support or resistance level
The basic trading method for using support and resistance is to buy near support in uptrends or the parts of ranges or chart patterns where prices are moving up and to sell/sell short near resistance in downtrends or the parts of ranges and chart patterns where prices are moving down. Buying near support or selling near resistance can pay off, but there is no assurance that the support or resistance will hold. Therefore, consider waiting for some confirmation that the market is still respecting that area
Trading breakouts, a breakout is a potential trading opportunity that occurs when an asset's price moves above a resistance level or moves below a support level on increasing volume. The first step in trading breakouts is to identify current price trend patterns along with support and resistance levels in order to plan possible entry and exit points. Once the asset trades beyond the price barrier, volatility tends to increase and prices usually trend in the breakout's direction. Breakouts are such an important trading strategy since these setups are the starting point for future volatility increases, large price swings and, in many circumstances, major price trends. When trading breakouts, it is important to consider the underlying asset's support and resistance levels. The more times an asset price has touched these areas, the more valid these levels are and the more important they become. At the same time, the longer these support and resistance levels have been in play, the better the outcome when the asset price finally breaks out. Asset prices will often move slightly further than we expect them to. This doesn't happen all the time, but when it does it is called a false breakout. Therefore it is important to consider waiting for some confirmation while trading breakouts. It’s also popular for traders to sell 50% of their positions at the resistance level, and hold the rest in anticipation of a breakout above resistance
█ Pʀɪᴄᴇ Aᴄᴛɪᴏɴ - Sᴜᴘᴘᴏʀᴛ & Rᴇꜱɪꜱᴛᴀɴᴄᴇ ʙʏ DGT Sᴛᴜᴅʏ
This experimental study attempts to identify the support and resistance levels. Assumes a simple logic to discover moments where the price is rising or falling consecutively for minimum 3 bars with the condition volume increases on each bar and the last bar’s volume should be bigger than the long term volume moving average. A line will be drawn at the end of the move (highest or lowest, depending on the move direction), the line will be drawn at minimum on the 3rd bar and if condition holds for other consecutive bars the line will switch to 4th, 5th etc bar.
Lines will not be deleted so the historical ones will remain and will emphasis the levels significance when they overlap in feature. Strong levels are more likely to hold and cause the price to move in the other direction, whereas the minor levels may only cause the price to pause and keep moving in the same direction. Determining future levels of support and resistance can drastically improve the returns of a short-term investing strategy
Bar colors will be painted based on the volume of the specific bar to its long term volume moving average. This will help identifying the support and resistance levels significance and emphasis the sings of breakouts
Finally, Volume spikes will be marked on top of the price chart. A high volume usually indicates more interest in the security and the presence of institutional traders. However, a rapidly rising price in an uptrend accompanied by a huge volume may be a sign of exhaustion. Traders usually look for breaks of support and resistance to enter positions. When security break critical levels without volume , you should consider the breakout suspect and prime for a reversal off the highs/lows. Volume spikes are often the result of news-driven events. Volume spike will often lead to sharp reversals since the moves are unsustainable due to the imbalance of supply and demand
A good example with many support and resistance concepts observed on a stock chart and detected by the study
Settings:
Length of volume moving average, where volume moving average is used to detect support and resistance levels, is used as reference to compare with threshold values for volume spikes and colors of the bars
Hint, to get more historical lines scrolling chart to left will enable visualization of them. Please note they may appear to much all 500 line limit is used 😉
Special thanks to @HEMANT Telegram user, for his observations and suggestions
Disclaimer:
Trading success is all about following your trading strategy and the indicators should fit within your trading strategy, and not to be traded upon solely
The script is for informational and educational purposes only. Use of the script does not constitute professional and/or financial advice. You alone have the sole responsibility of evaluating the script output and risks associated with the use of the script. In exchange for using the script, you agree not to hold dgtrd TradingView user liable for any possible claim for damages arising from any decision you make based on use of the script
