Bjorgum Double Tap█ OVERVIEW
Double Tap is a pattern recognition script aimed at detecting Double Tops and Double Bottoms. Double Tap can be applied to the broker emulator to observe historical results, run as a trading bot for live trade alerts in real time with entry signals, take profit, and stop orders, or to simply detect patterns.
█ CONCEPTS
How Is A Pattern Defined?
Doubles are technical formations that are both reversal patterns and breakout patterns. These formations typically have a distinctive “M” or a “W” shape with price action breaking beyond the neckline formed by the center of the pattern. They can be recognized when a pivot fails to break when tested for a second time and the retracement that follows breaks beyond the key level opposite. This can trap entrants that were playing in the direction of the prior trend. Entries are made on the breakout with a target projected beyond the neckline equal to the height of the pattern.
Pattern Recognition
Patterns are recognized through the use of zig-zag; a method of filtering price action by connecting swing highs and lows in an alternating fashion to establish trend, support and resistance, or derive shapes from price action. The script looks for the highest or lowest point in a given number of bars and updates a list with the values as they form. If the levels are exceeded, the values are updated. If the direction changes and a new significant point is made, a new point is added to the list and the process starts again. Meanwhile, we scan the list of values looking for the distinctive shape to form as previously described.
█ STRATEGY RESULTS
Back Testing
Historical back testing is the most common method to test a strategy due in part to the general ease of gathering quick results. The underlying theory is that any strategy that worked well in the past is likely to work well in the future, and conversely, any strategy that performed poorly in the past is likely to perform poorly in the future. It is easy to poke holes in this theory, however, as for one to accept it as gospel, one would have to assume that future results will match what has come to pass. The randomness of markets may see to it otherwise, so it is important to scrutinize results. Some commonly used methods are to compare to other markets or benchmarks, perform statistical analysis on the results over many iterations and on differing datasets, walk-forward testing, out-of-sample analysis, or a variety of other techniques. There are many ways to interpret the results, so it is important to do research and gain knowledge in the field prior to taking meaningful conclusions from them.
👉 In short, it would be naive to place trust in one good backtest and expect positive results to continue. For this reason, results have been omitted from this publication.
Repainting
Repainting is simply the difference in behaviour of a strategy in real time vs the results calculated on the historical dataset. The strategy, by default, will wait for confirmed signals and is thus designed to not repaint. Waiting for bar close for entires aligns results in the real time data feed to those calculated on historical bars, which contain far less data. By doing this we align the behaviour of the strategy on the 2 data types, which brings significance to the calculated results. To override this behaviour and introduce repainting one can select "Recalculate on every tick" from the properties tab. It is important to note that by doing this alerts may not align with results seen in the strategy tester when the chart is reloaded, and thus to do so is to forgo backtesting and restricts a strategy to forward testing only.
👉 It is possible to use this script as an indicator as opposed to a full strategy by disabling "Use Strategy" in the "Inputs" tab. Basic alerts for detection will be sent when patterns are detected as opposed to complex order syntax. For alerts mid-bar enable "Recalculate on every tick" , and for confirmed signals ensure it is disabled.
█ EXIT ORDERS
Limit and Stop Orders
By default, the strategy will place a stop loss at the invalidation point of the pattern. This point is beyond the pattern high in the case of Double Tops, or beneath the pattern low in the case of Double Bottoms. The target or take profit point is an equal-legs measurement, or 100% of the pattern height in the direction of the pattern bias. Both the stop and the limit level can be adjusted from the user menu as a percentage of the pattern height.
Trailing Stops
Optional from the menu is the implementation of an ATR based trailing stop. The trailing stop is designed to begin when the target projection is reached. From there, the script looks back a user-defined number of bars for the highest or lowest point +/- the ATR value. For tighter stops the user can look back a lesser number of bars, or decrease the ATR multiple. When using either Alertatron or Trading Connector, each change in the trail value will trigger an alert to update the stop order on the exchange to reflect the new trail price. This reduces latency and slippage that can occur when relying on alerts only as real exchange orders fill faster and remain in place in the event of a disruption in communication between your strategy and the exchange, which ensures a higher level of safety.
👉 It is important to note that in the case the trailing stop is enabled, limit orders are excluded from the exit criteria. Rather, the point in time that the limit value is exceeded is the point that the trail begins. As such, this method will exit by stop loss only.
█ ALERTS
Five Built-in 3rd Party Destinations
The following are five options for delivering alerts from Double Tap to live trade execution via third party API solutions or chat bots to share your trades on social media. These destinations can be selected from the input menu and alert syntax will automatically configure in alerts appropriately to manage trades.
Custom JSON
JSON, or JavaScript Object Notation, is a readable format for structuring data. It is used primarily to transmit data between a server and a web application. In regards to this script, this may be a custom intermediary web application designed to catch alerts and interface with an exchange API. The JSON message is a trade map for an application to read equipped with where its been, where its going, targets, stops, quantity; a full diagnostic of the current state and its previous state. A web application could be configured to follow the messages sent in this format and conduct trades in sync with alerts running on the TV server.
Below is an example of a rendered JSON alert:
{
"passphrase": "1234",
"time": "2022-05-01T17:50:05Z",
"ticker": "ETHUSDTPERP",
"plot": {
"stop_price": 2600.15,
"limit_price": 3100.45
},
"strategy": {
"position_size": 0.1,
"order_action": "buy",
"market_position": "long",
"market_position_size": 0,
"prev_market_position": "flat",
"prev_market_position_size": 0
}
}
Trading Connector
Trading Connector is a third party fully autonomous Chrome extension designed to catch alert webhooks from TradingView and interface with MT4/MT5 to execute live trades from your machine. Alerts to Trading Connector are simple; just select the destination from the input drop down menu, set your ticker in the "TC Ticker" box in the "Alert Strings" section and enter your URL in the alert window when configuring your alert.
Alertatron
Alertatron is an automated algo platform for cryptocurrency trading that is designed to automate your trading strategies. Although the platform is currently restricted to crypto, it offers a versatile interface with high flexibility syntax for complex market orders and conditions. To direct alerts to Alertatron, select the platform from the 3rd party drop down, configure your API key in the ”Alertatron Key” box and add your URL in the alert message box when making alerts.
3 Commas
3 Commas is an easy and quick to use click-and-go third party crypto API solution. Alerts are simple without overly complex syntax. Messages are simply pasted into alerts and executed as alerts are triggered. There are 4 boxes at the bottom of the "Inputs" tab where the appropriate messages to be placed. These messages can be copied from 3 Commas after the bots are set up and pasted directly into the settings menu. Remember to select 3 Commas as a destination from the third party drop down and place the appropriate URL in the alert message window.
Discord
Some may wish to share their trades with their friends in a Discord chat via webhook chat bot. Messages are configured to notify of the pattern type with targets and stop values. A bot can be configured through the integration menu in a Discord chat to which you have appropriate access. Select Discord from the 3rd party drop down menu and place your chat bot URL in the alert message window when configuring alerts.
👉 For further information regarding alert setup, refer to the platform specific instructions given by the chosen third party provider.
█ IMPORTANT NOTES
Setting Alerts
For alert messages to be properly delivered on order fills it is necessary to place the following placeholder in the alert message box when creating an alert.
{{strategy.order.alert_message}}
This placeholder will auto-populate the alert message with the appropriate syntax that is designated for the 3rd party selected in the user menu.
Order Sizing and Commissions
The values that are sent in alert messages are populated from live metrics calculated by the strategy. This means that the actual values in the "Properties" tab are used and must be set by the user. The initial capital, order size, commission, etc. are all used in the calculations, so it is important to set these prior to executing live trades. Be sure to set the commission to the values used by the exchange as well.
👉 It is important to understand that the calculations on the account size take place from the beginning of the price history of the strategy. This means that if historical results have inflated or depleted the account size from the beginning of trade history until now, the values sent in alerts will reflect the calculated size based on the inputs in the "Properties" tab. To start fresh, the user must set the date in the "Inputs" tab to the current date as to remove trades from the trade history. Failure to follow this instruction can result in an unexpected order size being sent in the alert.
█ FOR PINECODERS
• With the recent introduction of matrices in Pine, the script utilizes a matrix to track pivot points with the bars they occurred on, while tracking if that pivot has been traded against to prevent duplicate detections after a trade is exited.
• Alert messages are populated with placeholders ; capability that previously was only possible in alertcondition() , but has recently been extended to `strategy.*()` functions for use in the `alert_message` argument. This allows delivery of live trade values to populate in strategy alert messages.
• New arguments have been added to strategy.exit() , which allow differentiated messages to be sent based on whether the exit occurred at the stop or the limit. The new arguments used in this script are `alert_profit` and `alert_loss` to send messages to Discord
ابحث في النصوص البرمجية عن "profit"

Trailing Stop AlertsThis script is designed as an ATR-based trailing stop tool to assist in managing open positions.
Once you're involved in a profitable trade, if you add this script to your chart you'll be prompted to select a bar to begin trailing from.
You can then adjust the candle lookback distance for swing high/lows (7 by default), the ATR multiplier (1.0 by default), and the direction to trail (Long/Short).
You can also adjust the ATR period in the settings menu if you want to (14 period by default).
Once the script is added to your chart, it will begin drawing your trailing stop and you can then set up alerts.
Alert Options:
Any alert() function call : Will trigger an alert for both conditions (trailing stop updated, trailing stop hit)
Alert Conditions : Trailing Stop Update will trigger whenever the stop is updated, Trailing Stop Hit will trigger whenever the stop is hit.
Note: the alerts will only fire once per bar close and the trailing stop will not update on realtime bars.

ms hypersupertrendThis is a well-known strategy by using 3 different Supertrends and a trend-defining EMA,
feel free to play around with the settings, a backtest on 8h ETHUSDT pair brought some good results using
the 233EMA and investing 75% of a 10k start capital
the idea is to have at least 2 super trends going green above the trend-EMA to go long and exit by turning
2 super trends red (idea: 1 super trend in red could initialize a take profit)
shorts work vice versa
The EMA shows in green for uptrends and in red for downtrends, if it is blue no Signal will be taken because
the 3 super trends are not all above or below the trendline(EMA)
//-------------------------------------------------------------------------------------------------------------------------------------------------
Update 1:
- Fixed a minor input error
- Added ATR stoploss, and commented out the percentage stop loss
- Added time window to backtest
- Added exit on risk/reward is met
- This version is only buy...wait for next update adding shorts and more
As always, thanks for your ideas, likes, and support. Feel free to mess around with the settings and give me your feedback.

Forex Fractal EMA ScalperThis is a forex scalper designed for very short timeframes 1-5 min max.
At the same time due to the short timeframe, is recommend to re optimize it weekly .
Its components are
Fractals
Triple EMA with different lengths
Rules for entry:
For long : we have an up fractal and all 3 ema are in ascending order
For short: we have a down fractal and all 3 ema are in descending order.
Rules for exit
We exit when we either get a reverse order or when we hit the take profit or stop loss calculated in fixed pips.

Smart EMA SignalsThis indicator starts by plotting each time the price action crosses above or below the EMA, of which you can tune the timeframe and duration.
It then takes it a step further and plots whether or not that indicator would have given you a profitable trade, of which you can also tune the parameters (Max wait time, and % Profit).
Once you have your EMA tuned to your liking, set up alerts to notify you of a golden opportunity.

Bjorgum Triple EMA Strat-This script uses a triple EMA strategy to establish trend direction and reversal points
-Inputs are smoothed with Heiken Ashi values to reduce whipsaws, while providing timely execution
-Buy and sell indications are dictated by bar color
-Bar color is dictated by the candle close value in relation to the EMAs, specifically the faster of the 3
(If candle closes above or below the fast and intermediate averages, a buy or sell signal is indicated by bar color change)
-If the close falls between the two a cautionary signal is given. The viewer can hold, or take profit, or evaluate other indicators for clues
-Best results are obtained when coupled with Bjorgum TSI and Bjorgum RSI for confirmation of signals (see TradingView profile)
@Bjorgum on Stocktwits

TSI CCI Hull with profit$$$This is a modified version of @SeaSide420 TSI CCI Hull with profits exit on long and short order
ORIGINAL SCRIPT:
/// /// feel free to edit/improve and comment


SMA Cross strategyThis is a simple strategy which is always profitable and trades better than most premium channels and I give it out for free :)
Working very good on ETHUSDT futures on binance :)

Study for Squeeze Momentum Indicator [LazyBear]This study is based on LazyBear Squeeze Momentum Indicator and my strategy developed using it.
I added some custom feature and filters.
Main improvements are:
1- study is updated to version 4 of pine script;
2- I added alerts for entry rules and exit rules.
3- Alert syntax can be customized for webhooks: I added one example only for long entry.
You can customize a lot of features to get a profitable strategy.
Here is a link to original study.
Please use comment section for any feedback.

What is ProfitableBTC, BNB or your favorite Alt Coin? This indicator shows what is profitable at the moment. Red bars are alt days, green bars are BTC days. Otherwise, it is a BNB day.
Hmm, most of the time it is a BNB day!

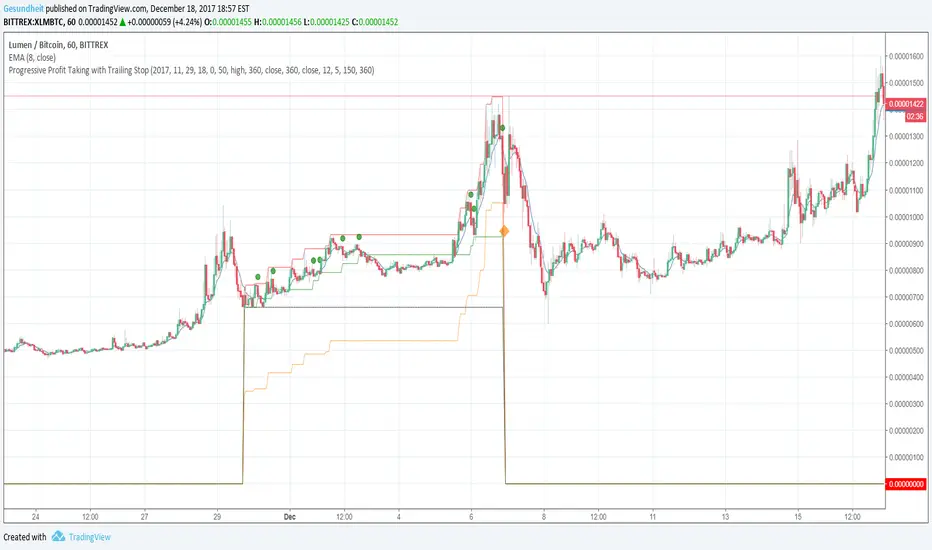
Progressive Profit Taking with Trailing StopThis is version 2 of
Special features:
Added partial profit taking as price rises. Profit taking is triggered by price crossing an EMA.
After profit taking, price has to rise by a user-specified percent before taking profits again.
Also includes condition for fully closing position after meeting specified profit target.
To incorporate into your algo, turn the plotshape functions into alertcondition.
RSI with small Take Profit - Long-onlyThis script open a long position when RSI < 30 and close the position after a small take profit. No stop loss but if you analyse List of Trades then you'll see that several position are closed for unknow reason.

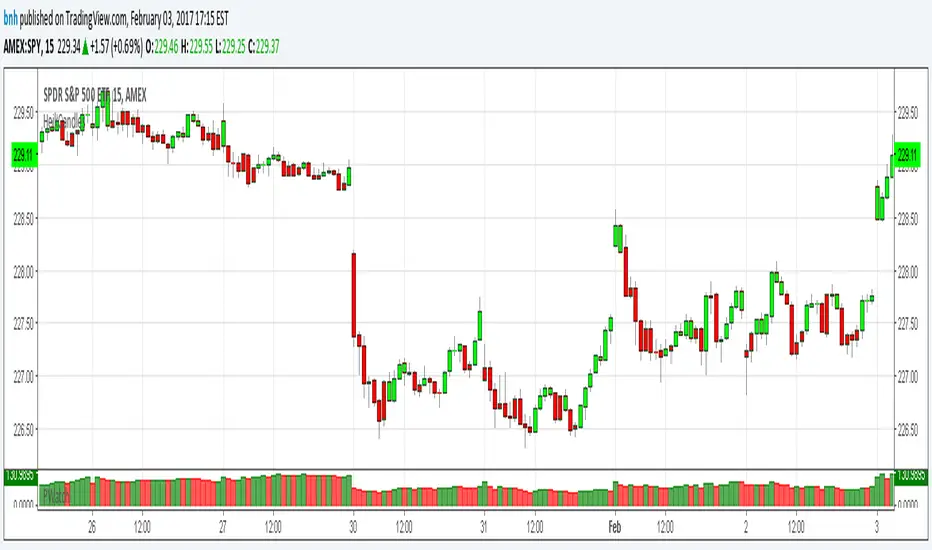
Hershey's Portfolio WatchThanks to user rwestbury for the idea!
Watch the profit in dollars of your portfolio in REAL TIME, love it!
Put this in a window that doesn't change often, for it takes long to initially load.
I use it in my window where I monitor the US index SPY.
Edit and add as many symbols as you want below, you should be able to figure it out.
Just add symbol, number of shares and price.
I'll improve on this later, like trim the code down with function calls, etc.
Good trading!
Brian Hershey
Smart Take ProfitThis script for EURUSD on the M3 timeframe detects Take Profit zones close to a reversal, automatically displays TP1, TP2, and Stop Loss, and follows the RSI + Bollinger Band + ATR logic.
It triggers an exit signal when the price touches a Bollinger Band, when the RSI is in an extreme zone, or when there is a rejection candle.
It automatically calculates the TP at 0.8 ATR, TP2 at 1.0 ATR, and the Stop Loss at 0.6 ATR.
It operates on the EURUSD M3 timeframe. You decide the entry point. This indicator is not a trading strategy.

Apex Wallet - Bitcoin Halving Cycle & Profit ProjectionOverview The Apex Wallet Bitcoin Halving Cycle Profit is a strategic macro-analysis tool designed for Bitcoin investors and long-term holders. It provides a visual framework of Bitcoin's 4-year cycles by identifying past halving dates and projecting future ones automatically. The script highlights key accumulation and profit-taking windows based on historical cycle performance.
Dynamic Cycle Intelligence
Halving Milestones: Automatically detects and marks all major halving events (2012, 2016, 2020, 2024) with precise timestamps.
Predictive Projections: Using an estimated 1,460-day cycle, the script projects up to 30 future halving events to help plan long-term investment horizons.
Timeframe Optimization: Built specifically for Weekly (W) and Monthly (M) charts to provide a clean, high-level perspective of market structure.
Key Strategy Visuals
Profit Windows: Visualizes "Start" and "End" profit zones with automated vertical lines and color-coded labels based on user-defined offsets from the halving.
DCA Chain Signals: Identifies strategic Dollar Cost Averaging (DCA) points throughout the cycle to assist in disciplined accumulation.
Heatmap Shading: Features dynamic background shading that intensifies as the cycle progresses toward historical peak performance periods.
How to Use:
Switch to a Weekly or Monthly Bitcoin chart.
Use the Green Labels (Profit START) to identify early cycle strength.
Monitor the Red Labels (Profit END) for historical cycle exhaustion zones.

Risk & Lot Calculator PanelFXMANS Risk & Lot Panel
Smart Risk Management Tool for TradingView
- Overview
FXMANS Risk & Lot Panel is a lightweight and professional risk management tool designed to help traders calculate position size (lot) and take-profit levels directly on the chart, without cluttering the screen.
The panel is displayed as a minimal table in the top-right corner of the chart and automatically adapts to the currently opened symbol.
This tool focuses on clarity, precision, and usability, making it suitable for scalpers, day traders, and swing traders.
- Key Features
Automatic Direction Detection
The script can automatically determine BUY or SELL direction based on:
Entry Price
Stop Loss Price
Logic:
Stop Loss below Entry → BUY
Stop Loss above Entry → SELL
Manual override is available if auto direction is disabled.
Risk-Based Lot Size Calculation
Calculates position size based on:
User-defined risk amount in USD
Distance between Entry and Stop Loss
Symbol-specific tick size and point value
Ensures consistent risk management across all markets.
Automatic Take Profit (RR Based)
Take Profit is calculated automatically using a predefined Risk / Reward (RR) ratio.
Supports both BUY and SELL scenarios.
- Symbol-Aware Calculation
Uses TradingView’s built-in symbol properties:
syminfo.mintick
syminfo.pointvalue
Works correctly on:
Forex
Indices
Metals
Crypto
- Minimal & Non-Intrusive UI
Small, fixed panel located at the top-right corner
Designed to avoid covering price action
Clean FXMANS-style color palette
- Safe Panel Size Control
Panel size can be adjusted from settings:
Small
Medium
Large
Size changes are handled without modifying layout geometry, preventing UI bugs.
- How It Works
Enter your Entry Price and Stop Loss Price
Define your Risk Amount ($)
Set your desired Risk / Reward ratio
The script automatically calculates:
Trade Direction (BUY / SELL)
Lot Size
Take Profit Level
All results are displayed instantly in the panel
- Example Use Case
Risk: $100
Entry: 1.0850
Stop Loss: 1.0800
RR: 2.0
- The panel will automatically display:
Direction: BUY
Lot Size adjusted to risk exactly $100
Take Profit at 2R
- Important Notes
Entry and Stop Loss prices must be valid (greater than zero).
The tool does not place trades automatically.
Calculations are for position sizing only and may vary slightly depending on broker specifications.
- Disclaimer
This script is intended for educational and analytical purposes only.
Trading involves risk, and users are responsible for their own trading decisions.
- Ideal For
Traders who follow strict risk management rules
Forex, crypto, and index traders
Scalpers and intraday traders
Anyone who wants clean and fast position sizing on TradingView

Live Position Sizer (LPS)Description (EN)
(Magyar leíráshoz görgess lejjebb!)
Live Position Sizer (LPS) is a discretionary trading utility designed to visualize risk, reward, and position size directly on the chart in real time.
The indicator draws a TradingView-style long or short position box and calculates the required position size based on your defined capital, maximum risk, stop-loss distance, and a user-defined lot conversion factor.
LPS is intended strictly as a decision-support and risk management tool. It does not place trades or generate automated signals.
Core features:
Automatic Long / Short position visualization
Dynamic Entry, Stop Loss, and Take Profit levels
Real-time position size calculation
Configurable Risk/Reward ratio
Fully customizable colors, transparency, and line styles
Clean, minimal on-chart labels showing direction, RR, and lot size
Only one active position box at a time for a clutter-free chart
Position sizing logic:
TradingView internally calculates position size in units, not broker-specific lots.
To bridge this difference, LPS uses a user-defined “Units per 1 Lot” multiplier.
Examples:
Forex (standard lot): 100000
Gold (XAUUSD): 1 or 100 (broker dependent)
Indices (e.g. NAS100): 1
The indicator first calculates the position size in TradingView units and then converts it to lots using this multiplier.
The displayed lot size is rounded to 0.01 lots.
Stop Loss logic:
The Stop Loss level is derived from the High or Low of a selectable previous candle.
Increasing the bar-back value places the Stop Loss further away, which:
increases stop distance
reduces position size for the same risk
Intended use:
Manual / discretionary trading
Risk management and position sizing
Trade planning and visualization
Educational purposes
Important notes:
This indicator does not execute trades
No alerts or automation by default
Lot size and contract specifications vary by broker
Always verify the exact lot or contract size with your broker before trading
------------------------------------
Description (HU)
A Live Position Sizer (LPS) egy diszkrecionális kereskedést támogató segédindikátor, amely valós időben jeleníti meg a kockázatot, a célárat és a pozícióméretet közvetlenül a charton.
Az indikátor TradingView-stílusú long vagy short pozíció boxot rajzol, és kiszámolja a szükséges pozícióméretet a megadott tőke, maximális kockázat, stop-loss távolság és egy felhasználó által definiált LOT szorzó alapján.
Az LPS nem stratégia, kizárólag döntéstámogató és kockázatkezelési eszköz.
Fő funkciók:
Automatikus Long / Short pozíció megjelenítés
Entry, Stop Loss és Take Profit szintek vizuális ábrázolása
Valós idejű pozícióméret számítás
Állítható Risk/Reward arány
Teljesen testreszabható színek, átlátszóság és vonalstílus
Letisztult chart label (irány, RR, lot méret)
Egyszerre csak egy aktív pozíció box
Pozícióméretezési logika:
A TradingView belsőleg egységekben (units) számol, nem bróker-specifikus LOT-okban.
Ennek kezelésére az LPS egy „Units per 1 Lot” beállítást használ.
Példák:
Forex standard lot: 100000
Arany (XAUUSD): 1 vagy 100 (brókertől függ)
Indexek (pl. NAS100): 1
Az indikátor először TradingView egységekben számol, majd ezt átváltja LOT-ra a megadott szorzó segítségével.
A kijelzett LOT méret 0.01-re van kerekítve.
Stop Loss logika:
A Stop Loss szint a kiválasztott korábbi gyertya high vagy low értékéből kerül meghatározásra.
Nagyobb bar-back érték:
távolabb helyezi a stopot
azonos kockázat mellett kisebb pozícióméretet eredményez
Ajánlott felhasználás:
Manuális, diszkrecionális kereskedés
Kockázatkezelés és pozícióméretezés
Trade tervezés
Oktatási célok
Fontos megjegyzések:
Az indikátor nem köt automatikusan
Alapértelmezetten nincs alert vagy automatizmus
A LOT és contract méret brókerenként eltérhet
Kereskedés előtt mindig ellenőrizd a pontos LOT / contract specifikációt a brókerednél

Dual MA Crossover with Profit Targets + Stop-LossChatGPT script and is a dual moving average crossover script with profit targets and stop loss

Roboquant RP Profits NY Open Retest StrategyRoboquant RP Profits NY Open Retest Strategy A good strategy for CL

PARTH Gold Profit IndicatorWhat's Inside:
✅ What is gold trading (XAU/USD explained)
✅ Why trade gold (5 major reasons)
✅ How to make money (buy/sell mechanics)
✅ Complete trading setup using your indicator
✅ Entry rules (when to buy/sell with examples)
✅ Risk management (THE MOST IMPORTANT)
✅ Best trading times (London-NY overlap)
✅ 3 trading styles (scalping, swing, position)
✅ 6 common mistakes to avoid
✅ Realistic profit expectations
✅ Pre-trade checklist
✅ Step-by-step getting started guide
✅ Everything a beginner need

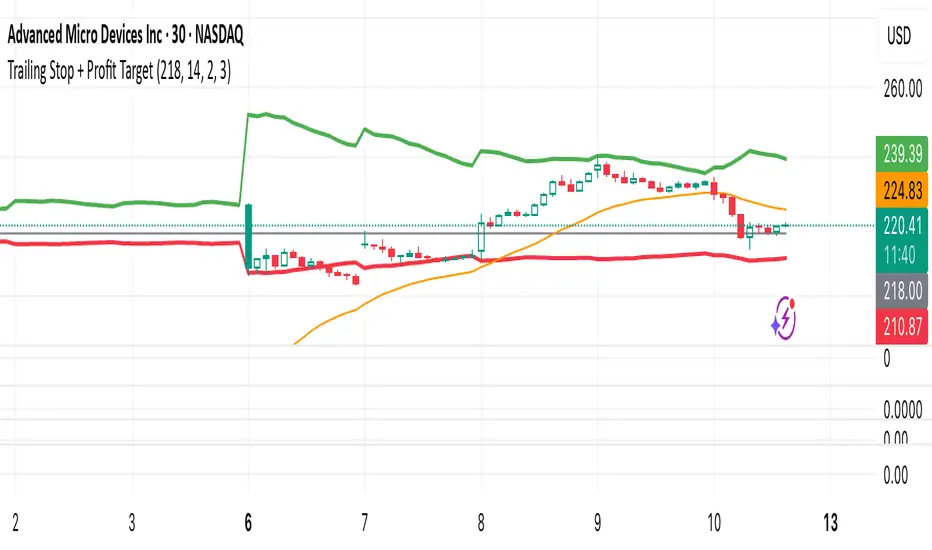
Trailing Stop + Profit TargetTrailing Stop + Exit Confirmation is a manual-entry tool designed to help traders visually manage trades with dynamic trailing stops and profit targets, based on ATR projections with a toggle button to reset calculations in real-time. Contains a “Short” toggle to work for short positions as well, which automatically inverses the PT and SL lines when toggled on.
Primary Calculations: Utilizes a manually adjustable entry price (default: $5 — ideal for options traders) that (when adjusted and recalculated) populates the chart with an adaptive ATR-based trailing stop line, dynamic profit target line, and optional 21-day EMA for directional context.
Below the Entry Price is a fully functional, manual reset toggle to reset all parameters mid-session to assess risk-reward based on entry price, risk tolerance, etc. followed by the “Short” toggle.
Primary Directions/Functions:
Enter your trade price in the “Manual Entry Price” field.
The script will begin plotting a dynamic trailing stop and profit target based on current market conditions.
Use the reset toggle to clear all calculations and start a new position at any time.
Customizable Settings:
ATR Length and Multiplier
Risk/Reward Profit Target Multiplier
Toggle to show/hide trailing stop, target, and EMA lines
Options Trading Use Case:
This tool is especially useful for options traders looking to manage premium-based entries (e.g., $5.00) on intraday or swing trades. The dynamic stop and target lines provide clear visual cues for scaling out or exiting based on price action, while allowing for tighter or looser risk depending on volatility (ATR).
This tool does not auto-detect entries or backtest positions. It is intended to complement your entry signals, not generate them. I've written an Options Momentum Signal indicator you can find right here which functions well in tandem with this tool.
Made for traders who execute trades manually and want typical preset guidelines for profit and stop loss signals but lets you recalculate them by simply clicking a button, especially if any major news or downturn causes a big change in market conditions so you can make adjustments in real time.
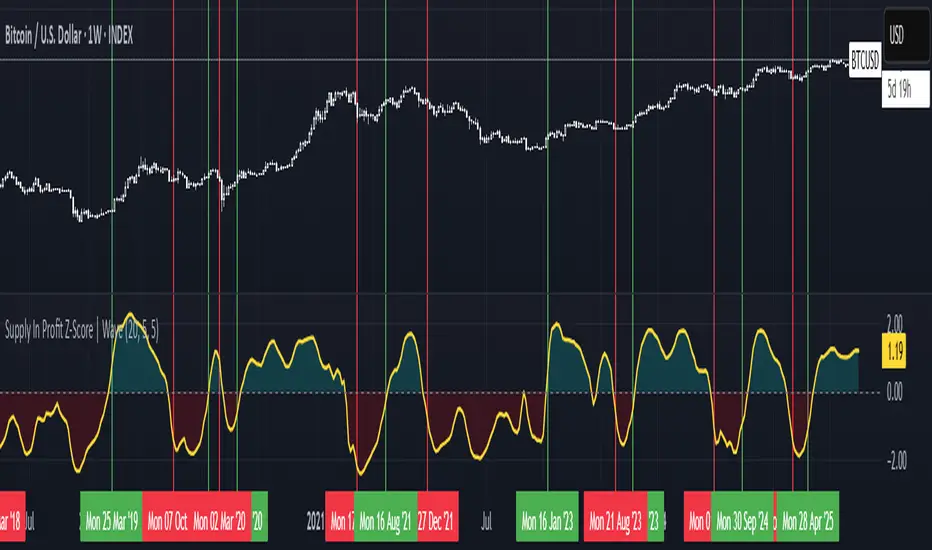
Supply In Profit Z-Score | Wave BackgroundSupply in Profit Z-Score
Modified by Quant_Hustler | Original by QuantChook
What it does
The Supply in Profit Z-Score measures how extreme the balance is between BTC addresses in profit versus those in loss compared to historical norms.
It highlights periods of excessive optimism or pessimism, helping traders identify market sentiment extremes that can signal potential turning points or confirm ongoing trends.
This version is designed for longer-term strategies, using smoothing and statistical normalization to focus on broader market sentiment cycles rather than short-term noise.
How it works
--Data Retrieval: Pulls on-chain data showing the percentage of Bitcoin addresses currently in profit and in loss.
--Spread Calculation: Finds the difference between the two to gauge overall sentiment balance.
--Alpha Decay Adjustment (optional): Normalizes extreme values to stabilize the signal over time.
--Smoothing: Applies a moving average to filter daily volatility and improve long-term clarity.
--Z-Score Conversion: Standardizes the data to show how far current sentiment deviates from historical averages.
--Visualization: Plots the result around a neutral midpoint (zero line) — positive values indicate profit dominance, negative values indicate loss dominance.
How to use it
--Above Zero: More addresses in profit → bullish sentiment and strong trend conditions.
--Below Zero: More addresses in loss → bearish sentiment or potential accumulation zones.
--Extreme Values: Mark overly optimistic or capitulated sentiment, often preceding major reversals.
Why use it in trend following
--This indicator serves as an on-chain sentiment confirmation layer for trend-following systems, especially on higher timeframes (daily or weekly).
--In uptrends, sustained positive readings confirm market strength and investor confidence.
--In downtrends, persistent negative readings confirm weakness and help avoid false reversal signals.
--Divergences between price and sentiment (e.g., rising price but weakening sentiment) often signal momentum loss or potential trend transitions.
Modifications from the original by QuantChook
Added EMA, adaptive Z-score smoothing and capping to reduce volatility and noise.
Introduced a wave-style visualization for intuitive sentiment shifts.
Improved calculation structure and upgraded for Pine Script v6 efficiency.
Tuned signal responsiveness and smoothing parameters for long-term trend accuracy.
Simplified user inputs and grouping for easier customization and integration.
In summary:
A refined, statistically grounded on-chain sentiment oscillator — originally developed by QuantChook and enhanced by Quant_Hustler — built to support long-term trend-following strategies by quantifying Bitcoin market sentiment through real-time profit and loss dynamics.