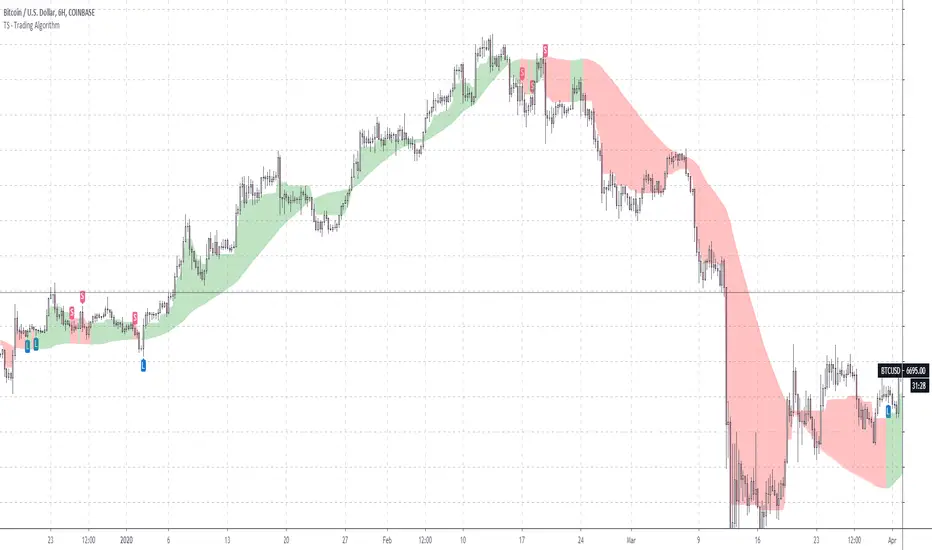
TS - Trading AlgorithmWhat is it?
The Tradespot MA Algo is an all in one, profitable moving average based trading strategy that presents long and short opportunities.
This indicator does not repaint. Once a bar has closed, the signal will remain permanently printed onto the chart.
What can I do with it?
Use on the following markets:
COINBASE:BTCUSD
COINBASE:ETHUSD
COINBASE:ETHBTC
Timeframe: 1D
What does each signal mean?
Long label is a strong buy signal
Short label is a strong sell signal
X's indicate a warning telling you that you should possibly exit your position. You should review these signals alongside other indicators such as volatility.
Review X signals?
Yes, there are concrete buys and sells but the X's indicate possible exits that might also be fakeouts, we can created the perfect indicator set up to review these with our TS - Trend Confirmation indicator and our TS - Volatility Screener indicator
How do I get access?
Please contact me on TradingView for details.
ابحث في النصوص البرمجية عن "profitable"
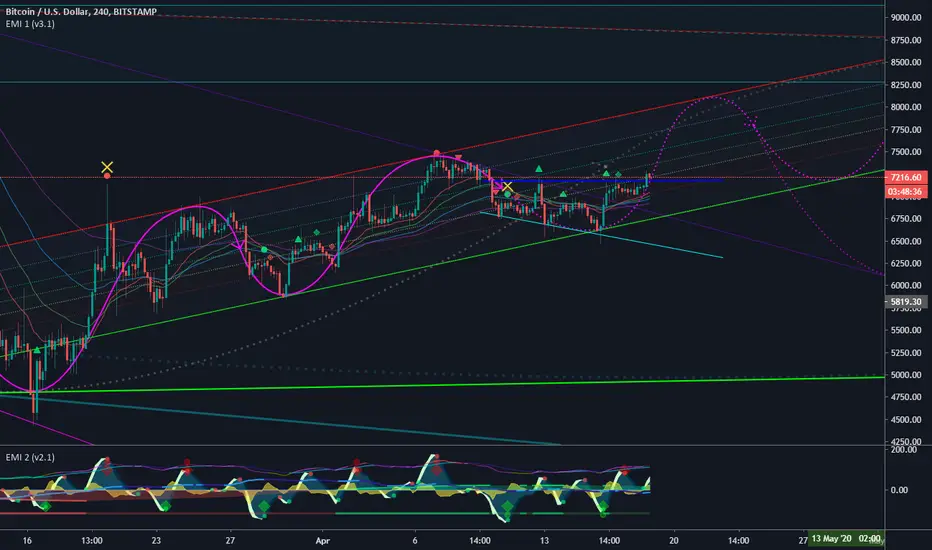
EMI 1 (v3.1)After months and months of back-testing. I finally decided to release this update. Would also like to give out a special thanks to TradingView for making it possible to create scripts and share this with the community. I have acquired a lot of information in this community. I believe that when you take, you should also share. That’s why I am sharing this wonderful indicator for free. Remember, knowledge and experience is the most valuable things in life.
EMI, short for Epic Market Indicator:
60-80% theoretically profitable trades, depending on the time period. However if you use EMI blindly, the percentage might even go lower. Nevertheless, there should be enough presenting opportunities, if you use her wisely. Remember, like any instrument, 'practice makes perfect'.
EMI 1 is actually a combination of diverse indicators:
Tesla EMA/SMA Ribbon: Periods based upon Nikola Tesla's favorite numbers; 3, 6, 9. (Disabled by default)
Fibonacci EMA Ribbon: Periods based upon Fibonacci frequency; 21, 34, 55, 89. (Enabled by default)
Regular EMA/SMA Ribbon: Periods based upon Standard frequency; 10, 20, 100, 200. (Disable by default)
Pivots (Disabled by default).
Bollinger bands (Disabled by default).
Bar trend color (Disabled by default).
Buy & Sell signals, which makes EMI a unique indicator: Based upon diverse indicators & oscillators buy or sell signals. Not predictions, but high probabilities.(Enabled by default, obviously ^^ )
Red symbols are sell or short signals / Green symbols are buy or long signals.
Dots represents possible price action trend reversals and the diamond symbols could be a possible confirmation and the big X is even a stronger confirmation signal. (A top or bottom, not THE bottom or top). These signals are based upon certain buy & sell conditions by a diversity of indicators known by most traders. Think for example, crossing EMA’s, Stochastic RSI , MACD , oversold and overbought territories.
New v3.1:
Modified to even more accurate buy & sell signals
Yellow X
Bar trend colors based on Money Flow Velocity or Money Flow
The signal conditions are based on different oscillators, known by many traders. ALWAYS wait for the candle to close and preferring even more confirmations before taking any consideration nor actions. No signals means most of the time trend continuation. EMI 2 in combination with EMI 1 and traditional authentic pattern formations with a darkened theme is recommended. For more explanation please ask my on streams or join my academy once it's online!
Good luck fellow traders and don't forget to tap the like & follow button. Thanks in advance.
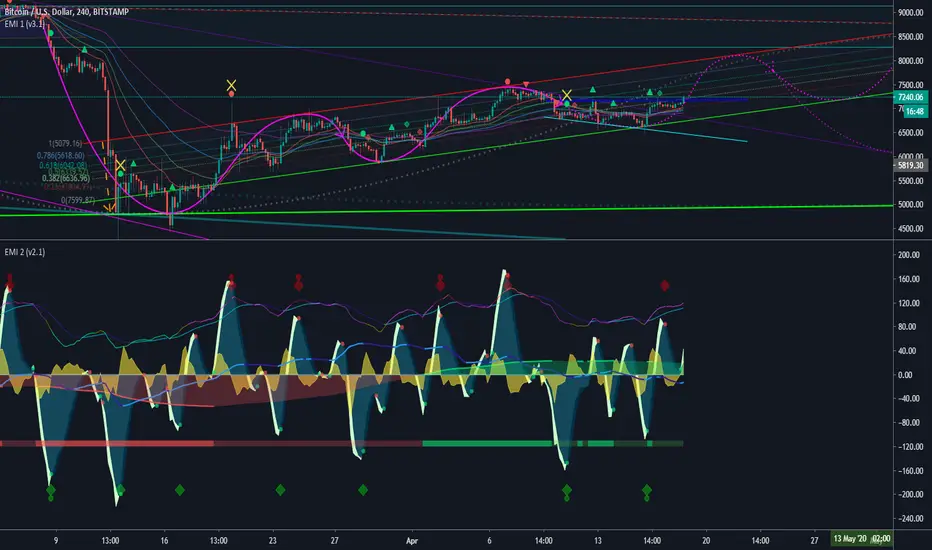
EMI 2 (v2.1)After months and months of back-testing. I finally decided to release this update. Would also like to give out a special thanks to TradingView for making it possible to create scripts and share this with the community. I have acquired a lot of information in this community. I believe that when you take, you should also share. That’s why I am sharing this wonderful indicator for free. Remember, knowledge and experience is the most valuable things in life.
EMI, short for Epic Market Indicator:
60-80% theoretically profitable trades, depending on the time period. However if you use EMI blindly, the percentage might even go lower. Nevertheless, there should be enough presenting opportunities, if you use her wisely. Remember, like any instrument, 'practice makes perfect'.
This indicator is a combination of different oscillators:
Common:
MACD
VWAP
RSI
Stochastic
Money Flow
Money Flow Velocity
Buy & Sell signals
Bottom & Top signals
Volume Flow heat map
New v2.1:
Money Flow Velocity
RSI added level 1 & 2 over-bought or -sold territories
Modified Top & Bottom conditions
Modified algorithms for even more accurate analysis
Modified Money Flow settings
RSI turns green or red when entering overbought or oversold territories.
Dots on wave crossings are buy or sell signals.
Diamonds above are possible bottoms and tops.
Green = Possible Bull/Bottom signals
Red = Possible Sell/Top signals
The signal conditions are based on different oscillators, known by many traders. ALWAYS wait for the candle to close and preferring even more confirmations before taking any consideration nor actions. No signals means most of the time trend continuation. EMI 2 in combination with EMI 1 and traditional authentic pattern formations with a darkened theme is recommended.
Good luck fellow traders and don't forget to tap the like & follow button. Thanks in advance.
Rogue Profit Alert IndicatorThis is a complex script developed to measure specific volatility parameters and enter trades based on predetermined rules which are proprietary and will not be released, so don't ask for specific indicator settings.
This indicator accompanies the "Rogue Profit Strategy" and can be used for creating alerts based on the strategy's performance. Please read the more in depth description on the "Rogue Profit Strategy" page. Make sure the input parameters are the same for both the Strategy and Indicator to insure accurate signals.
This is a very powerful and profitable script that will simplify your trading and has been in development and tested for three years. Message for details on how to obtain access. Please allow up to 24 hours for a response.

Correlation Trend Indicator - Dr. John EhlersHot off the press, I present this "Correlation Trend Indicator" employing PSv4.0, originally formulated by Dr . John Ehlers for TASC - May 2020 Traders Tips. John Ehlers might describe it's characteristics as being a mean reverting trend identification oscillator range bound to +/-1.0 irregardless of any timeframe or asset. I could have finessed this indicator with all kinds of bells and whistles, but I wanted to keep it simple and handy enough for novice Pine programmers or Tradingview newcomers to use. This algorithm, in a slightly modified form, is actually a small portion of the base code for John Ehlers' highly complex Autocorrelation Periodogram and his Convolution SwamiChart.
Some members may have notice that I published a very similar script last month. That is correct. It's sole intention was completely different, having more diverse versatility and complexity, but with slightly reduced computational performance. While they seem eerily similar, they are genetically different. This function only has only one required "series" parameter and the correlation is calculated using the period, not bar_index. Correlating with bar_index or period yields identical results either way. Bottom line, this indicator is elegantly simplistic, yet highly utilitarian and easy to use.
Features List Includes:
Dark Background - Easily disabled in indicator Settings->Style for "Light" charts or with Pine commenting
AND a few more... You have the source!
The comments section below is solely just for commenting and other remarks, ideas, compliments, etc... regarding only this indicator, not others. When available time provides itself, I will consider your inquiries, thoughts, and concepts presented below in the comments section, should you have any questions or comments regarding this indicator. When my indicators achieve more prevalent use by TV members, I may implement more ideas when they present themselves as worthy additions. As always, "Like" it if you simply just like it with a proper thumbs up, and also return to my scripts list occasionally for additional postings. Have a profitable future everyone!

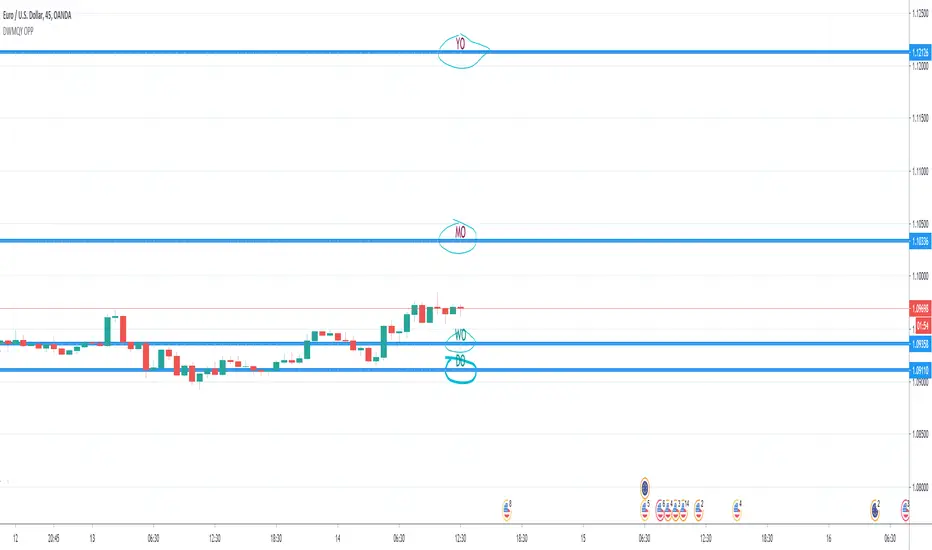
Day & Week & Month & Quarter & Year Open Price PointsPresent to your attention, basic “Day & Week & Month & Quarter & Year Open Price Points Indicator” !
You can determine support & resistance using Yearly, Quarterly, Monthly and Weekly open price points on a chart with any timeframe.
It is not a widely used technique, but according to different academic studies, levels are reliable. Google it! You can enhance your trading by adding that technique in your tool list.
At the current stage, Indicator shows Open Price Points.
Opening price points are extended into the future from the opening candle of each year, quarter, month and week and day.
By nature of that points, every level may be used as a support and as a resistance level at a similar time.
Initial setup:
1) Open the indicator Inputs settings, enable/disable additional Price Points.
2) Open the indicator Style settings, click on a style of each line and click on a “Price Line.”
How to use that?
With a lot of available strategies, there are two leading: Level convergence and Trend line convergence.
1) Level convergence involves locating two or more opening points that merge. This confluence can lead to greater accuracy and profitability.
2) Trend line convergence - The intersection of a trend line at a weekly, monthly, quarterly or even yearly opening level can produce fast and profitable reactions.
Try that!
As a stand-alone strategy, you can utilize that:
Price action under the WO (DO, MO, QO, YO) – Bearish
Price action above the WO (DO, MO, QO, YO) – Bullish
TIP: opening level not always good as a stand-alone tool!
Indicator Settings:
Show Daily Open (disabled by default)
Show Weekly Open (ON by default)
Show Monthly Open (ON by default)
Show Quarter Open (disabled by default)
Show Yearly Open (disabled by default)
Indicator Styling:
By default, each line is shown in the form of circles, line-width 1, silver colour.
Labels can be only in one of two states: Maroon (if open price less than ((open + high + low + close)/4) or Teal (if open price high than ((open + high + low + close)/4).
Alerts:
With the Indicator you can add a few different alerts:
DO Alert
WO Alert
MO Alert
QO Alert
YO Alert
Play with it:
Add a new alert with following condition: your SYMBOL crossing DWMQY OPP Weekly Open.
Options: Once per Bar.
Future of the Indicator:
The Indicator is a necessary part of more prominent Indicator which will include 8 modules in total:
2~ Arabian Wise Tunnels Module
3~ RH Waves Module (something like Vegas Waves)
4~ Trend Channels Module
5~ Opening Range Zoning Module
6~ Breakout Module
7~ BS Hemisphere Module
8~ Price Action Module
DISCLAIMER! RISK WARNING!
PAST PERFORMANCE IS NOT NECESSARILY INDICATIVE OF FUTURE RESULTS. TRADERS SHOULD NOT BASE THEIR DECISION ON INVESTING IN ANY TRADING PROGRAM SOLELY ON THE PAST PERFORMANCE PRESENTED, ADDITIONALLY, IN MAKING AN INVESTMENT DECISION, TRADERS MUST ALSO RELY ON THEIR OWN EXAMINATION OF THE PERSON OR ENTITY MAKING THE TRADING DECISIONS.
//Written by iambitboy request.
STEMWAPThis update includes the stop loss long and stop loss short adjustments as well as VWAP tuning into the STEM script.
I tend to not use the VWAP tuning but sometimes the strategy script will benefit slightly from using it.
The adjustment values make a huge difference, especially when using this on shorter time frames.
The idea is to tweak the strategy settings until you have something profitable, then set your stemwap to those settings and use it as a helpful guideline for your day trades.

EMA Mean Reversionthis is a mean reversion strategy using ema std deviations
use flat scaling 5 orders buy and sell - just close it back when it hits the VWMA
strategy operates to make dozens of small profitable trades in exchange for a larger loss on rare trending moves.
It works by projecting five 0.5% std deviations from the ema as volatility bands to help you scale into shorts and longs. generally flat scaling will work better than ascending. there is no SL logic for the strategy - positions should be closed when prices crosses back through the VWMA . To be used on lower timeframes only as the bands to do not expand or contract according to ATR
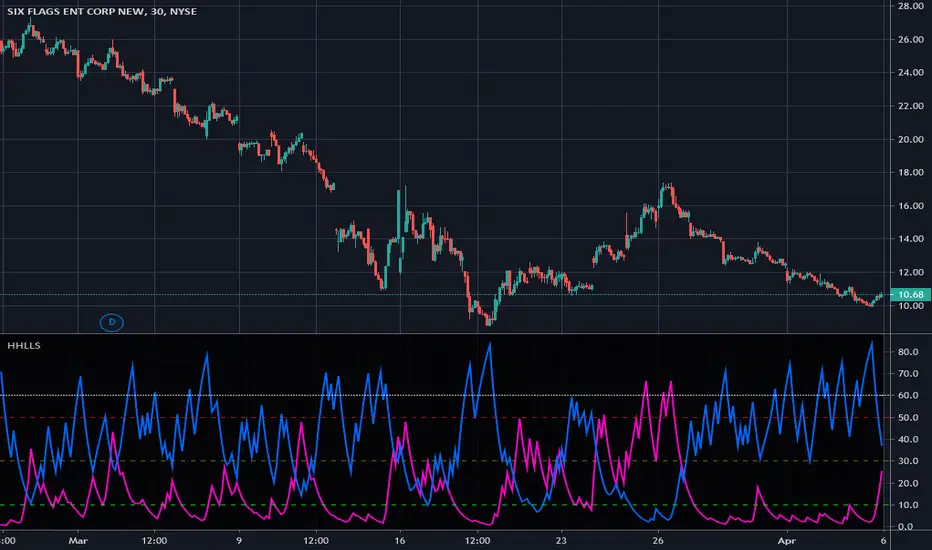
Higher Highs & Lower Lows Stochastics - Vitali ApirineThis is my modified "Higher Highs & Lower Lows Stochastics" employing PSv4.0, originally formulated by Vitali Apirine for TASC - February 2016 Traders Tips. Reading through a TASC magazine of mine, behold, I found a little known indicator that I can't find anywhere on all of Tradingview. That was a tragedy I felt I had to resolve... This indicator is best described as a dual momentum indicator, being helpful with anticipating reversals, spotting emerging trends, and defining correction periods. I felt it worthy of justice to unveil this for all TV members to utilize and also learn from. It's uniqueness is beyond past due for the honor it deserves on Tradingview.
As always, I have included advanced Pine programming techniques that conform to proper "Pine Etiquette". For those of you who are newcomers to Pine Script, this code release may also help you comprehend the "Power of Pine" by employing advanced programming techniques while exhibiting code utilization in a most effective manner. This script's uniqueness displays that we can now override built-in Pine functions. Firstly, you may have noticed that I replaced ema(), sma(), highest(), and lowest(). If you weren't aware of this Pine capability, well, here is a prime example... Now you know! Just heed caution when doing so to ensure your replacement algorithms are 100% sound. Lastly, I also added an additional "Median" line where the companion stochastics seemingly appear to gravitate within a central zone.
NOTICE: You may have observed, there is highest(), lowest(), ema(), and sma() custom functions overwriting Pine built-ins, some of which are audaciously used in ternary. "IF" you are planning to use Pine Script v4.0 functions in ternary, be forewarned, they WILL NOT operate as expected in most scenarios. The reason why I legitimately used them here in ternary is because they are ONLY manually controlled by an input(). If these were dynamically controlled with bar-to-bar dynamic conditional logic, you would most certainly run into serious unexpected programming issues, potentially resulting in hours of frustrations and guaranteed loss of hair. That's my lesson for this release, so never ever forget this when utilizing the full potential of the "Power of Pine". For more information concerning these potential dilemmas, please consult "Execution of Pine functions and historical context inside function blocks" in the "Pine Script v4 User Manual".
Features List Includes:
Dark Background - Easily disabled in indicator Settings->Style for "Light" charts or with Pine commenting
AND much, much more... You have the source!
The comments section below is solely just for commenting and other remarks, ideas, compliments, etc... regarding only this indicator, not others. When available time provides itself, I will consider your inquiries, thoughts, and concepts presented below in the comments section, should you have any questions or comments regarding this indicator. When my indicators achieve more prevalent use by TV members, I may implement more ideas when they present themselves as worthy additions. As always, "Like" it if you simply just like it with a proper thumbs up, and also return to my scripts list occasionally for additional postings. Have a profitable future everyone!
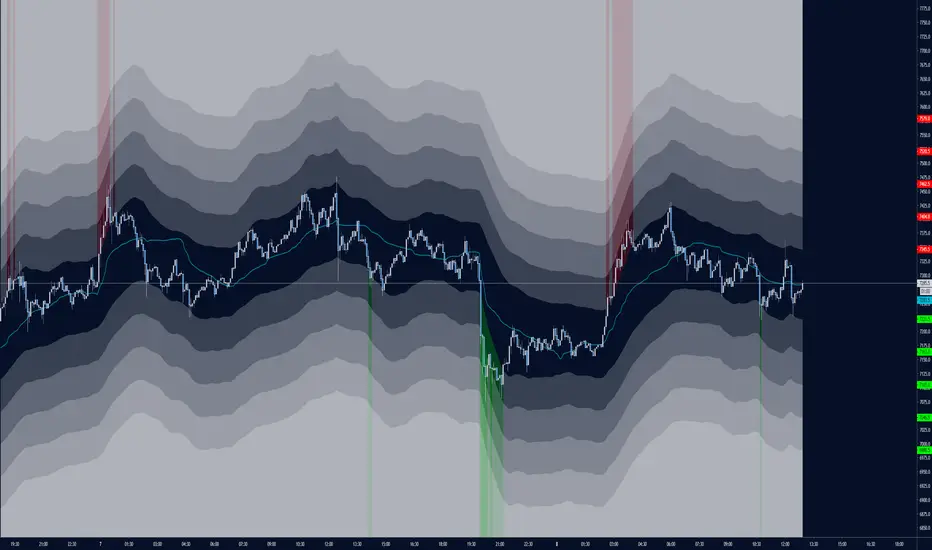
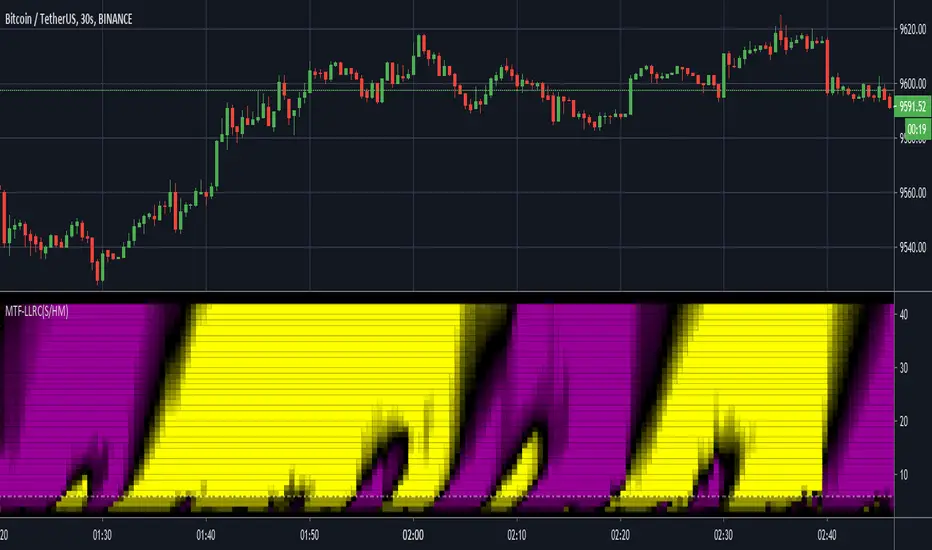
MTF Lag-Less RasterChart (Spectrogram/HeatMap)I present yet another state-of-the-art "MTF Lag-Less RasterChart" employing PSv4.0. Simply describing how this indicator works, the bottom of the indicator pane is most reactive and is highly effective at identifying reversal points quickly once they occur, while the upper portion of the indicator commonly shows enduring trends. This may be my finest multi-timeframe heatmap indicator that I have created so far, complete with multiple stunning gradient color schemes. I'm unsure if I will be able to pack any more tech into these RasterCharts. This may exclude additional algorithms or polychromatics I may discover later on that are worthy of other RasterChart releases. One last thing, this is a companion indicator to my "Lag-Less Rainbow Ribbon" indicator, because the heavily modified base algorithms are nearly identical.
I once again would like to personally thank Dr . John Ehlers for inspiring me to ponder into the realm of heatmap technology and all it has to offer. Your mathemagical splendor is most appreciated! You're a divine inspiration to the algorithmic trading community and forever shall be.
The MTF capabilities include seconds, minutes, and days. If the time frame settings are shorter in time than the current sampling interval, a warning notification will be appropriately displayed. I included a horizontal rule to approximately gauge at what level you may wish to have before entering/exiting a trade upon identifying a trend change. This gizmo functions on all assets on time frames ranging from one second bars up to the "All" chart having monthly bars.
Lastly, I have included so many color scheming techniques that I couldn't demonstrate all of them above. This indicator has what I would term as enhanced "predator" vision. For those of you who have witnessed these movies, you may understand what I have built. This indicator additionally includes a color morphing control to perfectly adjust the gradients to your visual liking, on any time frame whether it be seconds or daily chart preferences. The use of this indicator is just like any of my other RasterCharts or heatmap indicators found on the internet, except it has the greatest versatility I have accomplished as of yet.
Features List Includes:
"Source" selection
MTF controls for seconds, minutes, and days
Adjustable horizontal rule to differentiate between more reactive aspects of turning point fluctuations in the lower portion of the chart (visible above)
Window aperture control
Adjustable heatmap brightness control
Visual color scheme techniques (a few of many are displayed above)
Color gradient morphing
Color inversion control
This is not a freely available indicator, FYI. To witness my Pine poetry in action, properly negotiated requests for unlimited access, per indicator, may ONLY be obtained by direct contact with me using TV's "Private Chats" or by "Message" hidden in my member name above. The comments section below is solely just for commenting and other remarks, ideas, compliments, etc... regarding only this indicator, not others. When available time provides itself, I will consider your inquiries, thoughts, and concepts presented below in the comments section, should you have any questions or comments regarding this indicator. When my indicators achieve more prevalent use by TV members, I may implement more ideas when they present themselves as worthy additions. As always, "Like" it if you simply just like it with a proper thumbs up, and also return to my scripts list occasionally for additional postings. Have a profitable future everyone!
SpiralGrinder Ultimate Trading System SpiralGrinder Ultimate Trading System
SpiralGrinder Ultimate (SGU) is a unique type of Trading System dedicated for leverage-trading BTC on Bitmex platform. Since it's highly customized to give statistically reliable signals based exclusively on BTC/USD Perpetual Swaps BITMEX chart BITMEX:XBTUSD , using it with other BTC charts will give usable, but less reliable signals!
SpiralGrinder’s Ultimate first iteration was SpiralSwinger V1 indicator released in march 2019, since then much has been changed, different algos were developed and then thrown into the bin, until after 6 months of intensive work current version was developed, backtested on XBT/USD Perpetual Inverse Swap Contract chart from Bitmex exchange on whole chart history from late 2015 until January 2020, on these timeframes – 1d, 12h, 8h, 6h, 4h, 3h, 2h, 90m, 1h.
Indicator algo is based on idea of price being a so called "fractal" - when same price action patterns occur over and over from time to time on different timeframes be it 1D, 4h, 1h or even 15m! Every time a particular timeframe (TF) has suitable volatility and price action is exhibiting wave structure with distinct highs and lows there will be a situations when high probability trade setups are possible. To predict those recurrent situations SGU tracks more than 30 parameters (godmode oscillator and some it’s experimental derivatives, historical volatility coefficients, some time-based variables, ATR-based Trend lines, regular divergences… etc) comparing them against each other, so when “all stars are aligned” based on statistical model built into its algo and when price has enough potential to move in particular direction reaching some measured move target a SIGNAL to enter position is generated.
Theoretical True Winrate of this indicator is around 60%, while practical is somewhat under 50%. True Winrate is a percentage of trades that reached PREDICTED target be it 1R or 20R prediction, instead of just being a common winrate (used by most traders) - percentage of all profitable trades even though many of them didn’t reach initially predicted targets. True WinRate is tied to a signal generating algo implemented in SGU and cannot be changed unless a new more sophisticated algo is found by the developer of this indicator and is implemented in future updates!
Main User Interface of SGU consists of many elements that are developed to help manage trades more efficiently without any emotional impact on decision making process. Apart from obvious Long/Short signals there are also predicted targets that should be hit with some probability for every given signal, suggested stop loss levels corresponding to predicted RR. There are 4 ATR-based trendlines that help determine trend bias on current timeframe and to set intermediate take profit points on the way toward target, also there are indicators of regular divergences to show us weakness during uptrends and downtrends, also there are special warnings included when price closes behind particularly important ATR line with strength enough to continue further it’s movement in initial direction. Also there are 2 candle color-based systems available: one of monitoring how overbought or oversold is price on current TF, second is created to tell us overall trend sentiment - how strong is movement of price in particular direction.
Since price could move in the same fashion during prolonged periods of time there could be a particular TF when signals will be absent till price volatility and oscillator readings doesn’t change its character and become favorable (become synchronized with price action) for signals to be generated. That’s why this indicator should be monitored on multiple TFs at once – you’ll never know on which TF next signal will appear. There will be a multiple signals going on parallel at the SAME TIME, simultaneously in DIFFERENT DIRECTIONS: for example swing long trade based on signal from 12h TF, while having a scalp short at the same time based on 1h chart. Exploring this kind of optimized multi-tasking could be done only by splitting bankroll on multiple accounts registered on Bitmex platform.
Suggested timeframes to monitor for potential signals are empirically chosen that their round multiples should give 24H or 1440m=(24h x 60m) : 12h x 2 = 24h, 3h x 8 = 24h, 144m x 10 = 1440m=24h.
Therefore main timeframes are: 1D, 12h, 8h, 6h, 4h, 3h, 2h, 90m and 1h.
Additional timeframes to watch are: 288m, 144m, and 72m.
Timeframes under 1h aren’t tested yet, but could be traded with additional caution: 45m, 36m and 30m.
To track effectively all signals generated by SGU one should have at least PRO subscription plan paid on TradingView as this allows to use non-standard timeframes and maximum of 10 server-side alerts on price/indicators necessary to work with this indicator.
To do in near future: add volume weighted macd with custom settings as an additional confluence in algo to increase average win rate of signals.
Attention! Past performance of this indicator is not indicative of future results!
For those interested to dig deeper into logic behind using SGU a full 20-page pdf user manual is available for download here: drive.google.com
To gain free test access just write me a DM.

Gridbot visualizor and advisor V1.0This scripts visualizes the buy and sell levels as used by gridbots.
It also gives you some recommended settings if you want to use manual mode instead of AI mode, based on timeframe, target grid size etc.
The inputs should be pretty much self explanatory, if you have any questions feel free to drop me a message below.
Have fun, be healthy and profitable!
Jurgenvv ( aka CryptoJur)
This script uses some code or ideas from:
ck-3commas-GRID-bot-Visualisation by ChrisKaye.
How to make the status box to the right was learned from Daveatt his scripts.

RobinHood SignalBotThis script gives traders the tools to search for profitable trading strategies, and automate them using 3commas, OANDA, or any other trading platform that supports TradingView signals. SignalBot pulls the arrow and bow signals from RobinHoods Bow and Arrow, as well as the candlestick patterns from RobinHood Candles. These signals can be filtered in thousands of different ways using volume, momentum, RSI, MFI, StochRSI, EMA’s etc. The Candle Range Percentile (located in the center of the indicator) is another powerful filter that filters all candles that do not meet a desired percentage threshold. For example, if you set the Candle Range Percentile to 1%, this will filter out all candles that do not make more than a 1% move, and subsequently, all signals will be filtered with the candles that do not make more than a 1% move. This works great for filtering out signals in sideways markets, or to target high volume and high volatility bars.
The green and red arrows at the top indicate the bullish or bearish arrows that are pulled from the RobinHoods Arrow indicator. The red and green numbers at the bottom are trend percentages being pulled from RobinHoods Bow. The blue circles are bullish candlestick patterns, and the red circles are bearish candlestick patterns that are pulled from RobinHood Candles. The red dashes above the percentage numbers represent bearish candle close, and the green dash represents bullish candle close.
Creating alerts is easy as the thousands of different signal configurations can be sent through only 8 alert outputs.
This script can be used in all financial markets, and can be set up for long range signals for trend trades, or short range signals for quick scalp trades.
No Repaints

Dual Purpose Pine Based CorrelationThis is my "Pine-based" correlation() function written in raw Pine Script. Other names applied to it are "Pearson Correlation", "Pearson's r", and one I can never remember being "Pearson Product-Moment Correlation Coefficient(PPMCC)". There is two basic ways to utilize this script. One is checking correlation with another asset such as the S&P 500 (provided as a default). The second is using it as a handy independent indicator correlated to time using Pine's bar_index variable. Also, this is in fact two separate correlation indicators with independent period adjustments, so I guess you could say this indicator has a dual purpose split personality. My intention was to take standard old correlation and apply a novel approach to it, and see what happens. Either way you use it, I hope you may find it most helpful enough to add to your daily TV tool belt.
You will notice I used the Pine built-in correlation() in combination with my custom function, so it shows they are precisely equal, even when the first two correlation() parameters are reversed on purpose or by accident. Additionally, there's an interesting technique to provide a visually appealing line with two overlapping plot()s combined together. I'm sure many members may find that plotting tactic useful when a bird's nest of plotting is occurring on the overlay pane in some scenarios. One more thing about correlation is it's always confined to +/-1.0 irregardless of time intervals or the asset(s) it is applied to, making it a unique oscillator.
As always, I have included advanced Pine programming techniques that conform to proper "Pine Etiquette". For those of you who are newcomers to Pine Script, this code release may also help you comprehend the "Power of Pine" by employing advanced programming techniques in Pine exhibiting code utilization in a most effective manner. One of the many tricks I applied here was providing floating point number safeties for _correlation(). While it cannot effectively use a floating point number, it won't error out in the event this should occur especially when applying "dominant cycle periods" to it, IF you might attempt this.
NOTICE: You may have observed there is a sqrt() custom function and you may be thinking... "Did he just sick and twistedly overwrite the Pine built-in sqrt() function?" The answer is... YES, I am and yes I did! One thing I noticed, is that it does provide slightly higher accuracy precision decimal places compared to the Pine built-in sqrt(). Be forewarned, "MY" sqrt() is technically speaking slower than snail snot compared to the native Pine sqrt(), so I wouldn't advise actually using it religiously in other scripts as a daily habit. It is seemingly doing quite well in combination with these simple calculations without being "sluggish". Lastly, of course you may always just delete the custom sqrt() function, via Pine Editor, and then the script will still operate flawlessly, yet more efficiently.
Features List Includes:
Dark Background - Easily disabled in indicator Settings->Style for "Light" charts or with Pine commenting
AND much, much more... You have the source!
The comments section below is solely just for commenting and other remarks, ideas, compliments, etc... regarding only this indicator, not others. When available time provides itself, I will consider your inquiries, thoughts, and concepts presented below in the comments section, should you have any questions or comments regarding this indicator. When my indicators achieve more prevalent use by TV members, I may implement more ideas when they present themselves as worthy additions. As always, "Like" it if you simply just like it with a proper thumbs up, and also return to my scripts list occasionally for additional postings. Have a profitable future everyone!

Relative Normalized VolatilityThere are plenty of indicators that aim to measure the volatility (degree of variation) in the price of an instrument, the most well known being the average true range and the rolling standard deviation. Volatility indicators form the key components of most bands and trailing stops indicators, but can also be used to normalize oscillators, they are therefore extremely versatile.
Today proposed indicator aim to compare the estimated volatility of two instruments in order to provide various informations to the user, especially about risk and profitability.
CALCULATION
The relative normalized volatility (RNV) indicator is the ratio between the moving average of the absolute normalized price changes value of two securities, that is:
SMA(|Δ(a)/σ(a)|)
―――――――――――
SMA(|Δ(b)/σ(b)|)
Where a and b are two different securities (note that notation "Δ(x)" refer to the 1st difference of x, and the "||" notation is used to indicate absolute value, for example "|x|" means absolute value of x) .
INTERPRETATION
The indicator aim tell us which security is more volatile between a and b , with a value of the indicator greater than 1 indicating that a is on average more volatile than b over the last length period, while a value lower than 1 indicating that the security b is more on average volatile than a .
The indicator use the current symbol as a , while the second security b must be defined in the setting window (by default the S&P500). Risk and profitability are closely related to volatility, as larger price variations could potentially mean larger losses (but also larger gains), therefore a value of the indicator greater than 1 can indicate that it could be more risked (and profitable) to trade security a .
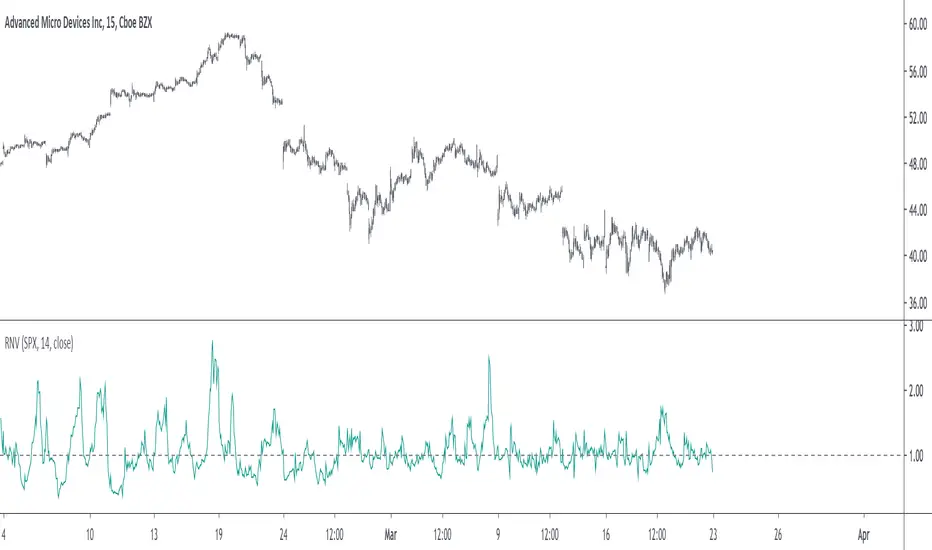
RNV using AMD (top) volatility against Intel (bottom) volatility.
RNV using EURUSD (top) volatility against USDJPY (bottom) volatility.
Larger values of length will make the indicator fluctuate less often around 1. You can also plot the logarithm of the ratio instead in order to have the indicator centered around 0, it will also help make values originally below 1 have more importance in the scale.
POSSIBLE ERRORS
If you compare different types of markets the indicator might return NaN values, this is because one market might be closed, for example if you compare AMD against BTCUSD with the indicator you will get NaN values. If you really need to compare two markets then increase your time frame, else use an histogram or area plot in order to have a cleaner plot.
CONCLUSION
An original indicator comparing the volatility between two securities has been presented. The choice of posting a volatility indicator has been made by my twitter followers, so if you want to decide which type of indicator i should do next make sure to check my twitter to see if there are polls available (i should do one after every posted indicator).
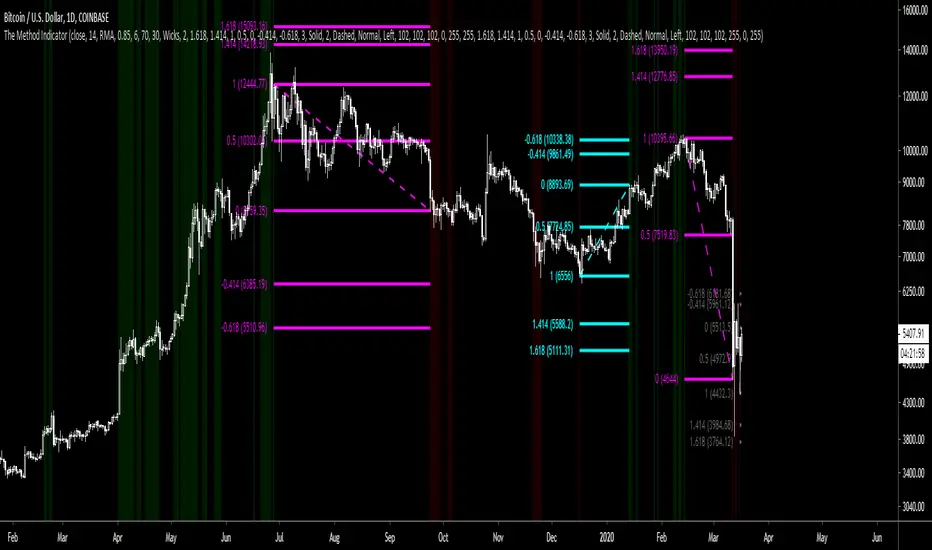
The Method IndicatorThe main use of this indicator is to capitalize on momentum driven movements of the RSI from 70-30 or 30-70 using these fib levels to plan your trade entries and exits, aiding in the creation of a simple yet profitable trading system.
Contact me via TradingView private message to request access.