Real Relative Volume - Line Indicator - Time Adjusted - DE & EN// English description below
Die richtige Aktie zu finden, ist nich immer einfach. Eine wichtige Variable bei der Aktienauswahl stellt das relative Volumen dar, welches von vielen erfolgreichen Tradern und Trading Firmen benutzt wird. Stell es Dir so vor: Statt sich das absolute Volumen anzuschauen, schauen wir uns die tatsächliche Stärke an. Wie viel Volumen wird also heute im Vergleich zu einem regulären Tag gehandelt. Dies gibt Aufschluss darüber, ob die Aktie "In-Play" ist.
Merke: Ist das RVOL (Relative Volumen) erhöht, sind mehr Marktteilnehmer an dieser Aktie interessiert als üblich. Dies ist besonders dann wichtig, wenn die Marktrichtung und die Richtung der Aktie nicht übereinstimmen.
Wenn der Markt steigt, steigen auch die meisten Aktien. Dies kann folglich auch ohne erhöhtes RVOL passieren. Was ist aber, wenn der Markt gegen uns geht? Dann werden wir schnell bei RVOL-schwachen Aktien ausgeschüttelt. Daher wollen wir unseren Fokus immer auf Aktien setzen, die ein erhöhtes relatives Volumen haben! Dies sind die Aktien, die gerade wirklich stark gehandelt werden und wahrscheinlich einen Katalysten dafür haben.
Der Real Relative Volume - Line Indicator zeigt Dir das aktuelle relative Volumen an. Unser Algo benutzt dabei das tatsächliche kumulative Volumen des aktuellen Tages zum jeweiligen (aktuellen) Zeitpunkt und vergleicht dieses mit dem historischen Durchschnittsvolumen zum gleichen Zeitpunkt . Damit bekommen wir ein korrektes Abbild der aktuellen Stärke. Mit Hilfe des Indikators können wir ebenfalls sehen, ob diese Stärke zunimmt, gleich bleibt, oder gegebenenfalls schnell and Power verliert. Im Gegensatz zu anderen Skripten nutzen wir eine fortschrittliche Methode, die aktuelle Position am Tag erkennt und damit nicht die Session in gleiche Teile teilt. Vorteil: Der Indikator funktioniert auch in Krypto, Forex, DE-Aktien, Indizes etc.
Funktionen:
Bitte ohne verlängerte Handelszeiten nutzen!
Sessions Back: Verändert die Baseline, die Du mit dem heutigen Volumen vergleichst. Beispiel: 10 - Zur aktuellen Uhrzeit siehst Du das reale relative Volumen von heute in Relation zu den letzten 10 Sessions (zur gleichen Zeit). (*max 5000 Kerzen)
Threshold: Stelle eine bestimmte Schwelle ein, bei der Du dich über die TradingView Funktion alarmieren lassen möchtest.
T1-4: Stelle unterschiedliche RVOL Werte ein.
Use Traffic Color for Line: Die unterschiedlichen T1-4 Werte und Farben werden für das Liniendiagramm genutzt.
Dieser Indikator wird häufig mit unserer zweiten Version Real Relative Volume - Bar Indicator - Time Adjusted - DE & EN verwendet.
/////// English version
Finding the right stock is not always easy. An important variable in stock selection is the relative volume, which is used by many successful traders and trading firms. Think of it like this: Instead of looking at absolute volume, we look at actual strength. So how much volume is traded today compared to a regular day? This gives an indication of whether the stock is "in play".
Note: If the RVOL (relative volume) is increased, more market participants are interested in this stock than usual. This is especially important if the market direction and the direction of the stock do not match.
If the market rises, most shares will also rise. This can, therefore, happen without an increased RVOL. But what happens if the market goes against us? Then we are quickly shaken out of RVOL-weak stocks. Therefore, we always want to focus on stocks that have an increased relative volume! These are the stocks that are trading really strongly right now and probably have a catalyst for that.
The Real Relative Volume - Line Indicator shows you the current relative volume. Our Algo uses the actual cumulative volume of the current day at the respective (current) time and compares it with the historical average volume at the same time . This gives us a correct picture of the current strength. With the help of the indicator, we can also see whether this strength increases, remains the same, or if it loses power quickly. Unlike other scripts, we use an advanced method that recognizes the current position on the day and thus does not split the session into equal parts. Advantage: The indicator also works in crypto, forex, foreign stock markets, indices, and many more.
Functions:
Please use without extended trading hours!
Sessions Back: Changes the baseline that you compare to today's volume. Example: 10 - At the current time you see the real relative volume of today in relation to the last 10 sessions (at the same time). (*max 5000 Bars)
Threshold: Set a certain threshold at which you want to be alerted via the TradingView function.
T1-4: Set different RVOL values.
Use Traffic Color for Line: The different T1-4 values & colors are used for the line plot.
This indicator is often used with our second version Real Relative Volume - Bar Indicator - Time Adjusted - DE & EN .
ابحث في النصوص البرمجية عن "relative volume"
Strategy - Relative Volume GainersStrategy - Relative Volume Gainers
Overview:
This trading strategy, called "Relative Volume Gainers," is designed for Long Entry opportunities in the stock market. The strategy aims to identify potential trading candidates based on specific technical conditions, including volume, price movements, and indicator alignments.
Strategy Rules:
The strategy is focused solely on Long Entry positions.
The volume for the current trading day must be greater than or equal to the volume of the previous day.
The percentage change in price must be greater than or equal to 2.5%.
The Last Traded Price (LTP) must be greater than or equal to the Exponential Moving Average (EMA) 200.
The Relative Volume for the current trading day (calculated over the last 30 days) must be greater than or equal to the Simple Moving Average (SMA) of Relative Volume over the same 30 days.
The current candle on the chart should be Green or Bullish, indicating positive price movement.
The price difference between bid and ask prices should be kept to a minimum.
It's recommended to also analyze market depth for better insights.
Strategy Requirements:
Add the Exponential Moving Average (EMA) 200 to your trading chart.
This strategy can be applied on charts of any timeframe.
For intraday trading, particularly for early entry, consider using a 1-minute timeframe.
It is advisable to create a screener to identify potential trades in real-time market conditions.
Risk Warning:
Stocks that meet the strategy criteria might exhibit high volatility and a high beta, making them inherently risky to trade. Exercise caution and adhere to predetermined risk management strategies.
Determine your trading quantity based on your entry price and stop loss in order to manage risk effectively.
Quantity Calculation Formula:
Quantity calculation is crucial to manage risk and position sizing. The following formulas can be used based on your trading scenario:
Quantity with Leverage:
Quantity = (((Using Capital / 100) * Risk Percent) / (Entry Price - Stop Loss)) * Leverage
Eg: Quantity = (((10000 / 100) * 0.2) / (405.5 - 398.5)) * 5
Quantity = 14
Risk = Rs.100 (Rs.100 is 1% of Rs.10000. So the risk is 1%, means we lose only Rs.100 when the SL is hit. If SL is increased the Quantity will get reduced to maintain a fixed risk of Rs.100)
Quantity without Leverage:
Quantity = (((Using Capital / 100) * Risk Percent) / (Entry Price - Stop Loss))
Note:
Always stay informed about market conditions and be prepared for potential rapid price movements when trading stocks that meet the strategy criteria. Strictly adhere to your predefined risk management strategy to safeguard your capital.

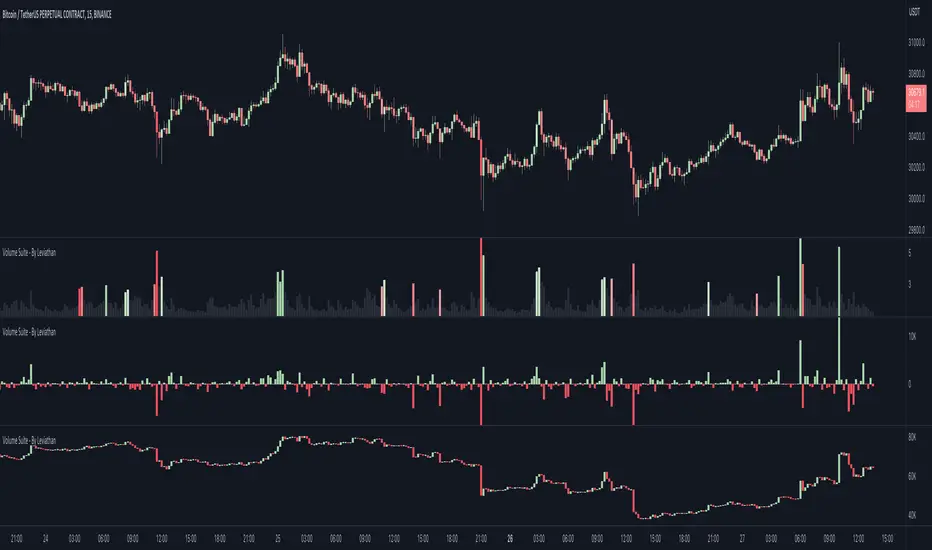
Volume Suite - By Leviathan (CVD, Volume Delta, Relative Volume)Volume Suite is an all-in-one script that includes several volume-based indicators such as CVD, Volume Delta, Relative Volume, Buy/Sell Volume, Cumulative Relative Volume and more. Additionally, it offers fully customisable appearance and features for improved data visualization, such as highlights for high volume activity, small price changes with high volume, or large price changes with low volume and more.
Data available in version 1:
- Volume Delta
Volume Delta is the net difference between Buy Volume and Sell Volume at a given bar. Positive Delta indicates that Buy Volume > Sell Volume, while Negative Delta means that Sell Volume > Buy Volume. As there is not way to get tick data on Tradingview, calculating Volume Delta is improvised by using the direction of lower timeframe candles and their volume.
- Cumulative Volume Delta (CVD)
CVD is a running total/cumulation of Volume Delta values, where positive VD gets added to the sum and negative VD gets subtracted from the sum. It can be used for trend strength analysis, divergence strategies, sentiment, etc.
- Buy/Sell Volume
Buy and Sell Volume provides an insight into volume activity in a given bar by estimating the buying/selling volume based on the direction of lower timeframe candles and their volume.
- Relative Volume
Relative Volume is used to compare current trading volume to past trading volume over a given period. For instance, a relative volume of 1.0 indicates that volume is at an average level, while a relative volume of 2.0 suggests that the volume is twice as high as the average.
- Cumulative Relative Volume (CRVOL)
CRVOL is a running total/cumulation of Relative Volume values, where RVOL at close>open gets added to the sum and RVOL at close
SuperTrend + Relative Volume (Kernel Optimized)Introducing our new KDE Optimized Supertrend + Relative Volume Indicator!
This innovative indicator combines the power of the Supertrend indicator along with Relative Volume. It utilizes the Kernel Density Estimation (KDE) to estimate the probability of a candlestick marking a significant trend break or reversal.
❓How to Interpret the KDE %:
The KDE % is a crucial metric that reflects the likelihood that the current candlestick represents a true break in the SuperTrend line, supported by an increase in relative volume. It estimates the probability of a trend shift or continuation based on historical SuperTrend breaks and volume patterns:
Low KDE %: A lower probability that the current break is significant. Price action is less likely to reverse, and the trend may continue.
Moderate KDE - High KDE %: An increased possibility that a trend reversal or consolidation could occur. Traders should start watching for confirmation signals.
📌How Does It Work?
The SuperTrend indicator uses the Average True Range (ATR) to determine the direction of the trend and identifies when the price crosses the SuperTrend line, signaling a potential trend reversal. Here's how the KDE Optimized SuperTrend Indicator works:
SuperTrend Calculation: The SuperTrend indicator is calculated, and when the price breaks above (bullish) or below (bearish) the SuperTrend line, it is logged as a significant event.
Relative Volume: For each break in the SuperTrend line, we calculate the relative volume (current volume vs. the average volume over a defined period). High relative volume can suggest stronger confirmation of the trend break.
KDE Array Calculation: KDE is applied to the break points and relative volume data:
Define the KDE options: Bandwidth, Number of Steps, and Array Range (Array Max - Array Min).
Create a density range array using the defined number of steps, corresponding to potential break points.
Apply a Gaussian kernel function to the break points and volume data to estimate the likelihood of the trend break being significant.
KDE Value and Signal Generation: The KDE array is updated as each break occurs. The KDE % is calculated for the breakout candlestick, representing the likelihood of the trend break being significant. If the KDE value exceeds the defined activation threshold, a darker bullish or bearish arrow is plotted after bar confirmation. If the KDE value falls below the threshold, a more transparent arrow is drawn, indicating a possible but lower probability break.
⚙️Settings:
SuperTrend Settings:
ATR Length: The period over which the Average True Range (ATR) is calculated.
Multiplier: The multiplier applied to the ATR to determine the SuperTrend threshold.
KDE Settings:
Bandwidth: Determines the smoothness of the KDE function and the width of the influence of each break point.
Number of Bins (Steps): Defines the precision of the KDE algorithm, with higher values offering more detailed calculations.
KDE Threshold %: The level at which relative volume is considered significant for confirming a break.
Relative Volume Length: The number of historic candles used in calculating KDE %

Comparison Chart with Relative Volume Gradient CandlesThis indicator provides a way to use Relative Volume Gradient Paintbars on an alternate/comparison symbol while still looking at your main charted symbol. For instance, this allows you to plot the ES1! or SPY or QQQ above/below your charted symbol, and see its current Relative Volume signal, and compare that to the your currently-charted individual stock symbol, etc., and while keeping the candles from both symbols all lined up perfectly. It also provides 4 different custom MAs which can be applied to the comparison symbol.
The idea here is that you can potentially use my other indicator, Relative Volume Gradient Paintbars, on the primary symbol to evaluate that chart, while using this particular indicator to quickly analyze the same Relative Volume data on a comparison market symbol such as the SPY or QQQ without having to switch charted symbols. You can also quickly compare price action and location relative to familiar moving averages to quickly gauge relative strength of the stock vs. the market symbol.

TradeGuider VSA Relative VolumeThe TradeGuider VSA Lite package is designed for those traders who want to trade in harmony with the professionals (‘smart money’) and is based on Tom Williams’ Volume Spread Analysis methodology ( VSA ). It works in any market and any time frame. The trader can use it as a standalone toolkit to support their trading decisions, or in conjunction with other trading tools to obtain additional confirmations.
The package consists of two parts:
TradeGuider VSA Lite indicator
TradeGuider Relative Volume indicator
Together with the TradeGuider VSA Lite indicator, the TradeGuider VSA Relative Volume indicator helps to determine the interaction between supply and demand as well as assisting traders in their trading decisions. In the VSA methodology all analysis is based on Relative Volume . This means that the exact values of the volume on the price bars are not nearly as important as their volume in relation to the previous volume bars. The following classifications of Relative Volume are used in VSA:
Ultra High Volume
Very High Volume
High Volume
Average Volume
Low Volume
Very Low Volume
Users can easily see how any volume bar is classified by observing which color band in the volume indicator is reached by the top of any given volume bar.
Price bars where the volume is Ultra High very often begin the VSA Setup, while price bars on Low or Very Low Volume can be the confirmation and end the VSA Setup.
Using this indicator, users may also observe bullish (when price falls and volume decreases) and bearish (when price rises and volume decreases) behavior.
See the Author's instructions below to get access to this package and the accompanying documentation.

[E5 Trading] Relative VolumeRelative Volume Overview
The E5 Trading Relative Volume indicator enhances volume analysis in several ways:
First, volume has been normalized to a percentage value, enabling standard thresholds for strong, average, and weak volume.
Second, each candle's volume is evaluated against its history to identify statistically significant bull and bear volume bars that may indicate whale (or institutional) buying and selling.
Relative Volume Thresholds
Volume has been normalized to a percentage value based on a user-defined period. Default (50).
This enables using standard thresholds across all assets to determine strong, average, and weak volume.
Price moves with strong relative volume are more meaningful to technical analysis than equivalent price moves with weak relative volume.
Use as confluence with price breakouts...trends can often be identified early when price breakouts are supported by strong relative volume.
Similarly, price breakouts supported by weak relative volume will likely reverse.
Volume Power Bars
Identify whale buying and selling with Volume Power Bars and follow the smart money!
Bull | Bear Volume Power Bars show statistically significant Bull and Bear Volume Bars that may indicate whale (or institutional) buying and selling. Default (On).
Trends often follow the direction of Volume Power Bars.

Point-in-time Relative Volume OscillatorShows relative volumetric strength of a trend.
The column bars show relative strength in percentage.
The color is based on the change in strength in comparison to the previous bar.
The EMA is used to determine if one should enter/exit or stay.

Baz: Relative VolumeThis script is for Relative Volume Percentage.
Lookback Period is the average period to include compare with current bar.
RVOL multiplier is the threhold % for relative volume. (In Color)
I have enabled coloring for different bar which let user easy to determine BUY or SELL Relative Volume
RELATIVE VOLUME
BUY - BLUE
SELL - RED
Can be used in smaller timeframe for intraday.

Cyclical Relative Volume + CMFThis Tool is built on the basis of the relative volume of the cycle in question, it can be set as desired.
It is present a background area that indicates whether operators are more likely to accumulate or distribute, again on the basis of cyclicalit.
We can set the% variation of the volumes above the average of the cycle
Hight Threshold highlights in red or green the histograms that exceed the cycle average by x%
Low Threshold highlights in orange the volumes that are less than x% above the cycle average
Finally, volumes below the cycle average will be highlighted.
This tool expresses its maximum in Breakout or Swing operations
The Breakout is purchased if the volumes are 25/50 % higher than the average of the cycle and if the CMF is in the accumulation phase
Instead, I buy the swing if the volumes are below the average of the cycle or around the Low Threshold threshold, if we are in a phase of strong accumulation or in the presence of a slight phase of Positive Money Flow Decrease
The CMF in accumulation / distribution is highlighted by the background color that can be set as desired based on the following parameters:
-Positive Money Flow Increase
-Positive Money Flow Decrease
-Negative Money Flow Decrease
-Negative Money Flow Increase
For any bugs contact the creators

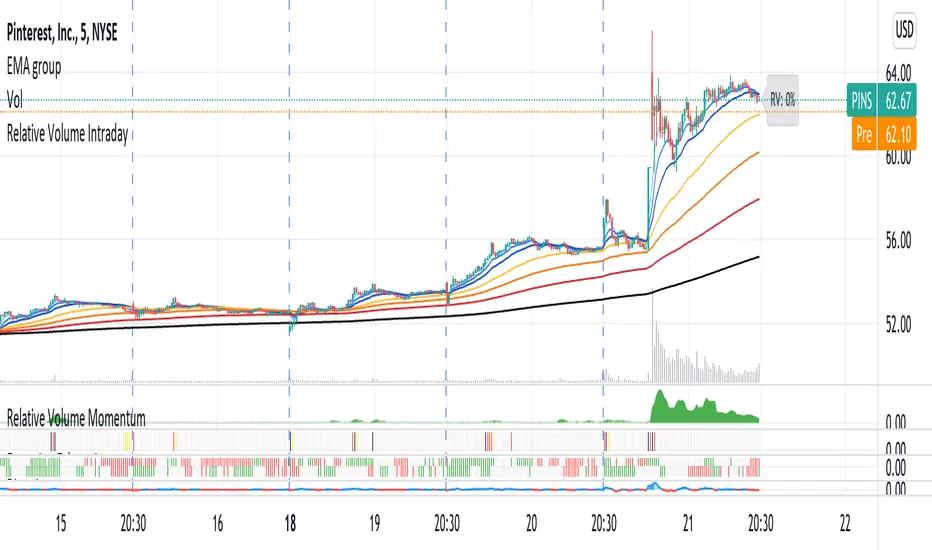
RVOL - Relative Volume IntradayIn the context of intraday trading, RVOL stands for Relative Volume. It is a technical indicator that compares the current volume of a stock to its average volume over a specified period. A RVOL above 1 suggests higher than average trading volume, potentially indicating increased interest and volatility.
The precise definition of real time relative volume is current cumulative volume up to the time of day divided by average cumulative volume up to this time of day. It means for example taking the volume from 09:45 to 10:00 and comparing it to what it does from 09:45 to 10:00 every day.
This indicator supports all timeframes from1 minute to 4 hours.
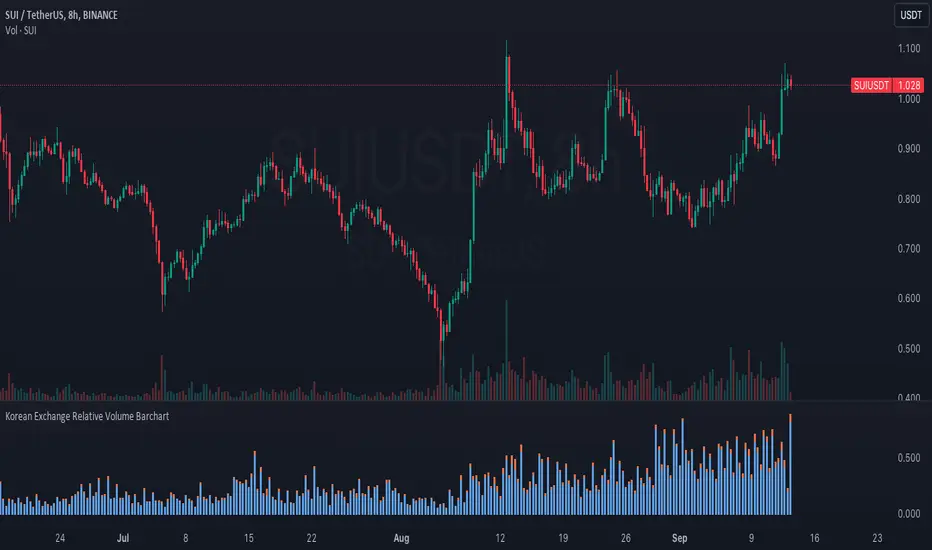
Korean Exchange Relative Volume BarchartKorean Exchange Relative Volume Barchart
The Korean Exchange Relative Volume Barchart indicator compares the trading volume of a cryptocurrency on any symbol with the combined volumes of major Korean exchanges, Upbit and Bithumb. This tool helps traders understand regional trading activities, offering insights into market sentiment influenced by Korean markets.
For example 0.5 would indicate that the Korean exchanges are doing 50% of the volume of the selected symbol.
Features:
Exchange Selection: Include or exclude Upbit and Bithumb in the comparison.
Automatic Symbol Mapping: Automatically maps the current chart's symbol to equivalent symbols on Upbit and Bithumb.
Stacked Bar Chart Visualization: Plots a stacked bar chart showing the relative volume contributions of Binance, Upbit, and Bithumb.
Usage:
Add the Indicator: Apply it to a cryptocurrency chart on TradingView.
Configure Settings: Toggle inclusion of Upbit and Bithumb in the settings.
Interpret the Chart: The stacked bar chart displays the proportion of trading volumes from each exchange.
Notes:
Symbol Compatibility: Ensure the cryptocurrency is listed on the Korean exchanges for accurate comparison.
Data Accuracy: Volumes are compared in the same base currency (e.g., BTC), so no exchange rate conversion is necessary.
Enhance your trading analysis by understanding the influence of Korean exchanges on cryptocurrency volumes with the Korean Exchange Volume Comparison indicator.
4C Volume w/ Relative Volume at TimeThis is a Volume indicator that also shows Relative Volume at Time (RVOL).
The RVOL is easily visible as a background color, that changes between Low and High RVOL colors.
The RVOL portion of the indicator is a modified version of the 'Relative Volume At Time' indicator by Tradingview (which has been the best/most accurate RVOL indicator i have seen yet on Tradingview, and seems to closely match the how the "Zanger Volume" indicator works).
Elevated RVOL can be a very important criteria for trading , especially on lower time frames.
This indicator can be used as a simple filter when looking at charts to determine whether it should be traded or not, based on the RVOL.
Higher volume/participation relative to previous time periods can lead to better follow through of moves and price action, and can lead to trending conditions.
Lower RVOL can lead to choppy market conditions, with lower participation and follow through on chart patterns.
The RVOL portion of the indicator draws from the Tradingview 'Relative Volume At Time' indicator developed by authors @e2e4mfck and @LucF , for TradingView.
This indicator takes the Past Volume mark and changes it into a background color.
High RVOL = When the day's cumulative volume is greater than the Past Volume levels, then the background is painted Blue by default
Low RVOL = When the day's cumulative volume is lower than the Past Volume levels, then the background is painted Purple by default
See annotated examples in the chart Below, which compares/contrasts this new indicator with the RVOL indicator by Tradingview:
Portions of the 'Relative Volume At Time' indictor code have been removed to clean up the script.
Plans in the future are to remove more code were possible, to further refine the script and speed up the processing times for the indicator.
If anyone is able to strip out more and keep it functioning the same, please let me know.
Enjoy.
Credit also goes to author @LazyBear . Portions of the Volume indicator is adapted from - HawkEye Volume Indicator

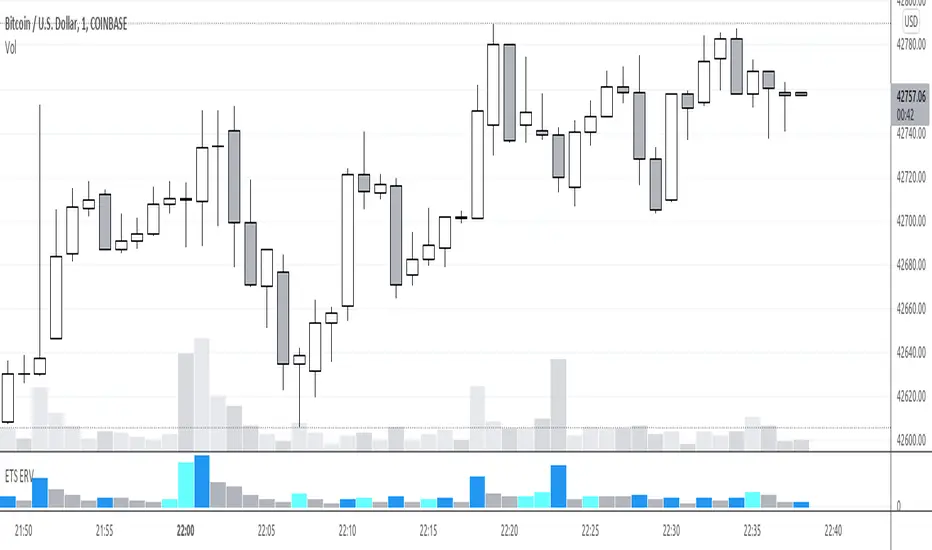
Early Relative Volume"Buy or Sell when you see a spike in volume" is advice that you often hear, the problem for me was that you only find out that volume is spiking after the fact. So that's why I created the Early Relative Volume indicator.
The Early Relative Volume indicator takes the amount of time that has passed for the current bar, let's say 10 seconds, and compares the volume of that first 10 seconds to the average volume in 10 seconds of the previous candle.
That means that it will tell you if the volume thus far in the current candle is more or less than the relative volume of the previous candle, so that you can potentially get an indication that the volume of the current candle is going to be greater or less than the previous candle.
This approach is of course not perfect, and obviously the values update as the current candle progresses, but I've found it useful to identify early breakout candles.
There is also an option to do the same calculation with the size of the body of the candle, by enabling the "Blue bars if candle body and volume bigger" option. It will only turn blue of both the volume and the size of the candle's body is calculated to be bigger.
I hope this helps you in your trading!
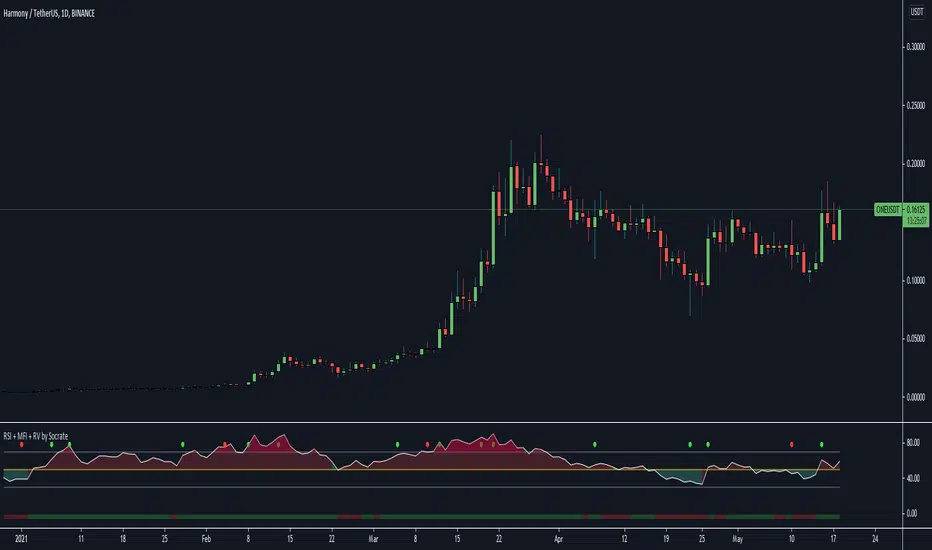
RSI , Money Flow Index, Anormal Relative Volume 3in1 indicator
RSI , Money Flow Index and Anormal Relative Volume indicator.
How the indicator works ? You have dot's on the top to show you the anormal relative volumes (you can adjust it with the treshold), you have a classical RSI cloud wich give you an quick opinion about the trend momemtum strengh, and the bar on bottom gives you a quick hint on the actual moneyflow stream.
Inputs that you can setup :
- Source
- RSI Lenght
- Neutral level
- Overbought value
- Oversold value
- MFI Lengh
- RV length
- RV Period
- RV Treshold
- RV smoothing value
- RV Breakout Based on
!!!!!!!!!!!!!!!!!!!!!!!!!!
Remember, an oversold RSI doesn't mean you should BUY an asset, it means the momentum is week on the bull side, the same but opposit for Overbought ;)
!!!!!!!!!!!!!!!!!!!!!!!!!
Relative anormal volumes are a good hint on something is happening on an asset, remember, dont put the treshold too low, i recommended min value on 1.25 for stocks, min value 1.5/1.8 for crypto-currencies.
!!!!!!!!!!!!!!!!!!!!!!!!!
Have fun !
Daily Real-Time Relative Volume *Eastern Time Zone Only*Calculates the current relative volume in real-time compared to the inputted moving average length.
*VOLUME MUST CHANGE on the current chart, once loaded, with the indicator before the script activates and presents the current relative volume*
On high volume stocks the script should activate almost immediately on low volume stocks it may take a little while.
Relative Volume that equals or exceeds the High Volume Threshold set will color the column either red or green (based on current and previous days close).
Relative Volume that is below the Low Volume Threshold set will color the column yellow.
Relative volume between the Low and High Volume Thresholds set will color the column black.

Volume Spikes Pro - relative volume comparisonThe Enhanced Volume Spike Detector builds on the basic relative volume comparison by adding price direction analysis and more sophisticated categorization of volume events.
Directional Analysis
This indicator doesn't just identify volume spikes, but categorizes them as:
- **Bullish**: Volume spike with upward price movement
- **Bearish**: Volume spike with downward price movement
- **Neutral**: Volume spike with minimal price change
- **Strong**: Exceptional volume spike (2.5x+ default) regardless of direction
Visual Classification
Different color schemes instantly communicate the volume spike type:
- Green for bullish volume (price rising)
- Red for bearish volume (price falling)
- Dark Green for strong bullish volume
- Dark Red for strong bearish volume (price falling)
Customization Tips
- For day trading or short timeframes: Consider reducing MA length to 10-15
- For swing trading: The default 20 is appropriate
- For position trading or longer timeframes: Consider increasing to 30-50
- For more selective signals: Increase multiplier to 2.0 or higher
- For more comprehensive detection: Decrease multiplier to 1.3-1.4

RVM Relative Volume MomentumRVM Relative Volume Momentum is an indicator that shows relative volume as a percentage of volume over the last 5 bars to the average volume of the same 5 bars of the previous 3 days.
RVI Relative Volume IntradayRVI Relative Volume Intraday is a simple label next to the last bar that shows the relative volume as a percentage of the ratio of today's volume to the average volume for the same intraday time period of the last five days. Useful for break-out intraday strategies.

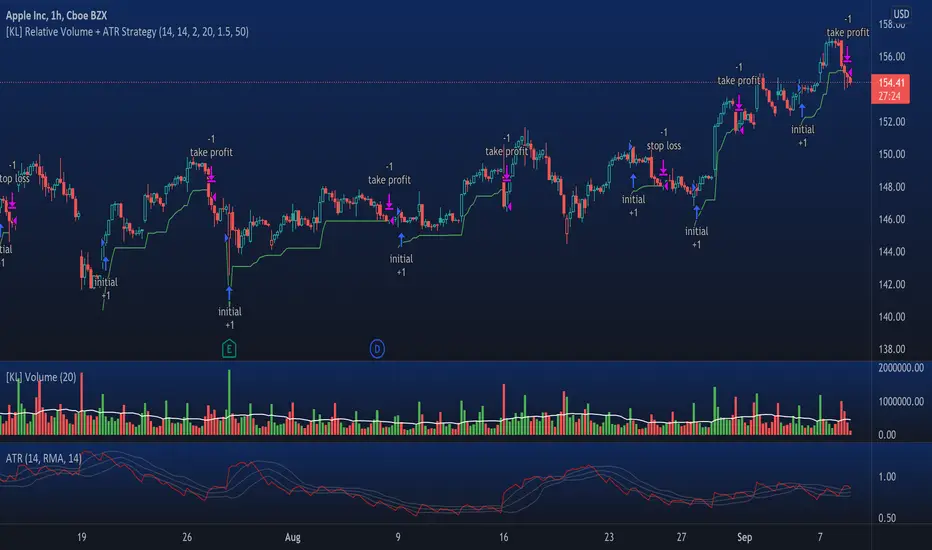
[KL] Relative Volume + ATR StrategyThis strategy will enter into long position when (a) current volume is above the average volume, and when (b) volatility of prices (based on ATR) is relatively low.
Backtested on hourly timeframes, win rates range between 35% to 50% on stocks with positive drifts (i.e. tendency to move upwards). Default setups are as follows:
- Average volume is computed using simple moving average (sma) of 14 periods. By default, 1.4x ratio seems to work well on most large cap stocks. If it's too high, then amount of potential points for entry will decrease. But if it's too low, then this indicator becomes meaningless.
- ATR (for determining volatility), look back period is 14 (following conventions). I have noticed that the profits could change drastically when changed to different values for each individually security. Feel free to experiment around with this parameter.
Other information: This strategy is based off of one of my previous scripts; a script called "Relatively Volume Strategy". The objective of this new script is to simplify the process of determining periods of low volatility. In this new script, we assume prices are consolidating when current ATR is within its moving average value by +/- one standard deviation.
Trade Context Relative Volume With BarsThis indicator will show you the relative volume today vs. the last X number of days.
This way, you don't have to wait until the end of the day to see how the volume compares to previous days.
Volume=Volatility so this helps give us a gauge for projections for the day.
This will only work with minute bars.
Enjoy

Trade Context Relative Volume With BarsTrade Context Relative Volume with bars is an indicator that shows how much volume we have at a particular time of day when compared to the last X number of days.
The beauty of the indicator is you do not have to wait until the end of the day to see the average volume for today's session.
This indicator only works on minute bars and it will give you the relative volume for each bar, and a cumulative ratio for the entire day (up to that point).
Enjoy.

ka66: Normalised/Relative VolumeThis is an idea taken from a John Bollinger (of Bollinger Bands fame) talk. Instead of showing volume with a moving average overlay, we show volume relative to its moving average:
avgVolume = sma(volume, 10) // several configurable MAs allowed
relativeVolume = volume / avgVolume
Now if we get a value of 1, that means the current volume is the same as its historical average. Under 0, less than average, and above zero, greater than its average.
If we get a value like 2, then current volume is twice its average. I hope the implication of this being displayed visually is becoming clearer.
We plot this relative volume as columns.
We then plot horizontal levels, like 1, 2, 3 to see the magnitude of the current volume relative to its average.
Consecutive rising or falling relative volume is shown in the same colour.
I am still exploring volume as trading data point, but we see some ideas from this visual representation:
How do volume patterns change across timeframes? Do we get better signals or higher or lower time frames (e.g. big relative volume spikes)
Can consecutive rises or falls indicate a big potential move, even though price is just fluctuating.
What about a switch from rise to fall.
If we get pinbars/spikes with a big relative volume spike, can we then infer more clearly whether buyers or sellers are in control.