Range Sentiment Profile [LuxAlgo]The Range Sentiment Profile indicator is inspired from the volume profile and aims to indicate the degree of bullish/bearish variations within equidistant price areas inside the most recent price range.
The most bullish/bearish price areas are highlighted through lines extending over the entire range.
🔶 SETTINGS
Length: Most recent bars used for the calculation of the indicator.
Rows: Number of price areas the price range is divided into.
Use Intrabar: Use intrabar data to compute the range sentiment profile.
Timeframe: Intrabar data timeframe.
🔶 USAGE
This tool can be used to easily determine if a certain price area contain more significant bullish or bearish price variations. This is done by obtaining an estimate of the accumulation of all the close to open variations occurring within a specific profile area.
A blue range background indicates a majority of bullish variations within each area while an orange background indicates a majority of bearish variations within each area.
Users can easily identify the areas with the most bullish/bearish price variations by looking at the bullish/bearish maximums.
It can be of interest to see where profile bins might have no length, these can indicate price areas with price variations with alternating signs (bullish variations are followed by a bearish sign) and similar body. They can also indicate a majority of either bullish or bearish variations alongside a minority of more significant opposite variations.
These areas can also provide support/resistance, as such price entering these areas could reverse.
Users can obtain more precise results by allowing the profile to use intrabar data. This will change the calculation of the profile, see the details section for more information.
🔶 DETAILS
The Range Sentiment Profile's design is similar to the way a volume profile is constructed.
First the maximum/minimum values over the most recent Length bars are obtained, these define the calculation range of the profile.
The range is divided into Rows equidistant areas. We then see if price lied within a specific area, if it's the case we accumulate the difference between the closing and opening price for that specific area.
Let d = close - open . The length of the bin associated to a specific area is determined as follows:
length = Width / 100 * Area / Max
Where Area is the accumulated d within the area, and Max the maximum value between the absolute value of each accumulated d of all areas.
The percentage visible on each bin is determined as 100 multiplied by the accumulated d within the area divided by the total absolute value of d over the entire range.
🔹 Intrabar Calculation
When using intrabar data the range sentiment profile is calculated differently.
For a specific area and candle within the interval, the accumulated close to open difference is accumulated only if the intrabar candle of the user selected timeframe lies within the area.
This can return more precise results compared to the standard method, at the cost of a higher computation time.
ابحث في النصوص البرمجية عن "sentiment"

Cryptocurrency Market Sentiment v1.0Introduction:
Capable of observing the market sentiment of the cryptocurrency market
The relative status of BTC and altcoins
How it works:
1. The general uptrend process of the cryptocurrency market is BTC → ETH → high-cap altcoins → low-cap altcoins. When funds cannot push up BTC's market cap, funds gradually flow into smaller-cap altcoins until the upward trend ends.
2. Select ETH as the representative of altcoins, and understand the sentiment and current stage
3. Mathematical principle : divide the price of ETH by the price of BTC, and then apply it to the RSI formula .
How to use it:
1. Similar to the RSI indicator , when CMS enters the overbought zone, it represents an active altcoin market, a passionate market sentiment , and the end of the uptrend.
2. When CMS enters the oversold zone, it indicates the leading stage of BTC in the rising trend or the capital flow back to BTC in the declining process .
3. If CMS is at a low level, long positions should focus on altcoins, and short positions should focus on BTC, and vice versa.
----------------------------------------------------------------------------------------------------------
简单介绍:
能够观察加密市场市场情绪
BTC和寨币的相对状态
如何工作:
1、加密市场一般的上涨过程为 BTC → ETH → 大市值山寨 → 小市值山寨,当资金无法推动大市值的BTC上涨时,资金就会逐渐流向市值较小的山寨,直到一轮上涨结束。
2、选取ETH作为altcoins的代表,通过ETH与BTC的关系来了解加密市场的情绪和目前上涨的阶段。
3、数学原理:将ETH的价格/BTC的价格,随后将其带入RSI公式
如何使用:
1、与RSI指标类似,当cms进入超买时,代表寨币市场的活跃,市场情绪热烈,上涨进入尾声。
2、当cms进入超卖时,为上涨中BTC领涨的阶段或下降过程中资金回流BTC。
3、如果cms在低位,做多应关注altcoins,做空应关注btc,反之亦然。

VaR Market Sentiment by TenozenHello there! I am excited to share with you my new trading concept implemented in the "VaR Market Sentiment" indicator. But before that, let me explain what VaR is. VaR, or Value at Risk, is an indicator that helps you identify the worst-case scenario of a market movement based on a percentile/confidence level. This means that it calculates the worst moves, whether it's a buy or sell, based on the timeframe you're using.
Now, let's discuss how VaR Market Sentiment works. It uses a historical VaR to calculate the worst move either if the market goes up or down based on a percentile/confidence level. The default setting is the 95th percentile, which means that the market is unlikely to hit your SL level within the day if you're using a daily timeframe, etc.
To determine the strength of a candle, it subtracts the value of both sides based on the returns of the current timeframe with the VaR value (Bullish VaR - Bullish Returns, Bearish VaR - Bearish Returns). If the result is above the mean, the current candle is potentially weak. Conversely, if the result is below the mean, the current candle is potentially strong. The deviation shows critical sentiments, where if the market is above the deviation, it means that the current candle is really weak. If it's below the deviation, it means that the current candle is really strong.
It's important to note that this indicator needs other supporting indicators such as trend-following or mean reversion indicators based on your trading style. Also, as a follow-up to my previous concept, I called out that the market has what's called "power." And for now, I conclude that VaR Market Sentiment is the "power."
I'm going to share more helpful indicators in the future! I hope this indicator will be helpful for you guys! Ciao!

Market Sentiment Index US Top 40 [Pt]▮Overview
Market Sentiment Index US Top 40 [Pt} shows how the largest US stocks behave together. You pick one simple measure—High Low breakouts, Above Below moving average, or RSI overbought/oversold—and see how many of your chosen top 10/20/30/40 NYSE or NASDAQ names are bullish, neutral, or bearish.
This tool gives you a quick view of broad-market strength or weakness so you can time trades, confirm trends, and spot hidden shifts in market sentiment.
▮Key Features
► Three Simple Modes
High Low Index: counts stocks making new highs or lows over your lookback period
Above Below MA: flags stocks trading above or below their moving average
RSI Sentiment: marks overbought or oversold stocks and plots a small histogram
► Universe Selection
Top 10, 20, 30, or 40 symbols from NYSE or NASDAQ
Option to weight by market cap or treat all symbols equally
► Timeframe Choice
Use your chart’s timeframe or any intraday, daily, weekly, or monthly resolution
► Histogram Smoothing
Two optional moving averages on the sentiment bars
Markers show when the faster average crosses above or below the slower one
► Ticker Table
Optional on-chart table showing each ticker’s state in color
Grid or single-row layout with adjustable text size and color settings
▮Inputs
► Mode and Lookback
Pick High Low, Above Below MA, or RSI Sentiment
Set lookback length (for example 10 bars)
If using Above Below MA, choose the moving average type (EMA, SMA, etc.)
► Universe Setup
Market: NYSE or NASDAQ
Number of symbols: 10, 20, 30, or 40
Weights: on or off
Timeframe: blank to match chart or pick any other
► Moving Averages on Histogram
Enable fast and slow averages
Set their lengths and types
Choose colors for averages and markers
► Table Options
Show or hide the symbol table
Select text size: tiny, small, or normal
Choose layout: grid or one-row
Pick colors for bullish, neutral, and bearish cells
Show or hide exchange prefixes
▮How to Read It
► Sentiment Bars
Green means bullish
Red means bearish
Near zero means neutral
► Zero Line
Separates bullish from bearish readings
► High Low Line (High Low mode only)
Smooth ratio of highs versus lows over your lookback
► MA Crosses
Fast MA above slow MA hints rising breadth
Fast MA below slow MA hints falling breadth
► Ticker Table
Each cell colored green, gray, or red for bull, neutral, or bear
▮Use Cases
► Confirm Market Trends
Early warning when price makes highs but breadth is weak
Catch rallies when breadth turns strong while price is flat
► Spot Sector Rotation
Switch between NYSE and NASDAQ to see which group leads
Watch tech versus industrial breadth to track money flow
► Filter Trade Signals
Enter longs only when breadth is bullish
Consider shorts when breadth turns negative
► Combine with Other Indicators
Use RSI Sentiment with trend tools to spot overextended moves
Add volume indicators in High Low mode for breakout confirmation
► Timeframe Analysis
Daily for big-picture bias
Intraday (15-min) for precise entries and exits

US Sentiment Index [CryptoSea]The US Sentiment Index is an advanced analytical tool designed for traders seeking to uncover patterns, correlations, and potential leading signals across key market tickers. This indicator surpasses traditional sentiment measures, providing a data-driven approach that offers deeper insights compared to conventional indices like the Fear and Greed Index.
Key Features
Multi-Ticker Analysis: Integrates data from a diverse set of market indicators, including gold, S&P 500, U.S. Dollar Index, Volatility Index, and more, to create a comprehensive view of market sentiment.
Customisable Sensitivity Settings: Allows users to adjust the moving average period to fine-tune the sensitivity of sentiment calculations, adapting the tool to various market conditions and trading strategies.
Detailed Sentiment Scaling: Utilises a 0-100 scale to quantify sentiment strength, with colour gradients that visually represent bearish, neutral, and bullish conditions, aiding in quick decision-making.
Below is an example where the sentiment index can give leading signals. We see a first sign of wekaness in the index as it drops below its moving average. Shortly after we see it dip below our median 50 level, another sign of weakeness. We see the SPX price action to take a hit following the sentiment index decrease.
Tickers Used and Their Impact on Sentiment
The impact of each ticker on sentiment can be bullish or bearish, depending on their behaviour:
Gold (USGD): Typically seen as a safe-haven asset, rising gold prices often indicate increased market fear or bearish sentiment. Conversely, falling gold prices can signal reduced fear and a shift towards bullish sentiment in riskier assets.
S&P 500 (SPX): A rising S&P 500 is usually a sign of bullish sentiment, reflecting confidence in economic growth and market stability. A decline, however, suggests bearish sentiment and a potential move towards risk aversion.
U.S. Dollar Index (DXY): A strengthening U.S. Dollar can be a sign of fear as investors seek safety in the dollar, which is bearish for risk assets. A weakening dollar, on the other hand, can signal bullish sentiment as capital flows into riskier assets.
Volatility Index (VIX): Known as the "fear gauge," a rising VIX indicates increased market fear and bearish sentiment. A falling VIX suggests a calm, bullish market environment.
Junk Bonds (JNK): Rising junk bond prices often reflect bullish sentiment as investors take on more risk for higher returns. Conversely, falling junk bond prices signal increased fear and bearish sentiment.
Long-Term Treasury Bonds (TLT): Higher prices for long-term treasuries usually indicate a flight to safety, reflecting bearish sentiment. Lower prices suggest a shift towards riskier assets, indicating bullish sentiment.
Financial Sector ETF (XLF): Strength in the financial sector is typically bullish, indicating confidence in economic conditions. Weakness in this sector can reflect bearish sentiment and concerns about financial stability.
Unemployment Rate (USUR): A rising unemployment rate is a bearish signal, indicating economic weakness. A declining unemployment rate is bullish, reflecting economic strength and job growth.
U.S. Interest Rates (USINTR, USIRYY): Higher interest rates can be bearish, as they increase borrowing costs and reduce spending. Lower rates are generally bullish, promoting economic growth and risk-taking.
How it Works
Sentiment Calculation: The US Sentiment Index combines data from multiple tickers, calculating sentiment by scaling the distance from their respective moving averages. Each asset's behaviour is interpreted within the context of market fear or greed, providing a refined sentiment reading that adjusts dynamically.
Market Strength Analysis: When the index is above 50 and also above its moving average, it indicates particularly strong or bullish market conditions, driven by greed. Conversely, when the index is below 50 and under its moving average, it signals bearish or weak market conditions, associated with fear.
Correlation and Pattern Detection: The indicator analyses correlations among the included assets to detect patterns that might signal potential market movements, giving traders a leading edge over simpler sentiment measures.
Adaptive Background Colouring: Utilises a colour gradient that dynamically adjusts based on sentiment values, highlighting extreme fear, neutral, and extreme greed levels directly on the chart.
Flexible Display Options: Offers settings to toggle the moving average plot and adjust its period, giving users the ability to tailor the indicator's sensitivity and display to their specific needs.
In this example below, we can see the Sentiment rise above the Moving Average (MA). Price action goes on to follow this, although there is an instance where it dips below the MA, it quickly rises back above again as a sign of strength.
Another way you can use this index is by simply using the MA, if its trending up, we know the macro sentiment is bullish.
Application
Data-Driven Insights: Offers traders a detailed, data-driven approach to sentiment analysis, incorporating a broad spectrum of market indicators to deliver actionable insights.
Pattern Recognition: Helps identify patterns and correlations that may lead to market reversals or continuations, providing a nuanced view that goes beyond simple sentiment gauges.
Enhanced Decision-Making: Equips traders with a robust tool to validate trading strategies and make informed decisions based on comprehensive sentiment analysis.
The US Sentiment Index by is an essential addition to the toolkit of any trader looking to navigate market complexities with precision and confidence. Its advanced features and data-driven approach offer unparalleled insights into market sentiment, setting it apart from conventional sentiment indicators.

Session-Based Sentiment Oscillator [TradeDots]Track, analyze, and monitor market sentiment across global trading sessions with this advanced multi-session sentiment analysis tool. This script provides session-specific sentiment readings for Asian (Tokyo), European (London), and US (New York) markets, combining price action, volume analysis, and volatility factors into a comprehensive sentiment oscillator. It is an original indicator designed to help traders understand regional market psychology and capitalize on cross-session sentiment shifts directly on TradingView.
📝 HOW IT WORKS
1. Multi-Component Sentiment Engine
Price Action Momentum : Calculates normalized price movement relative to recent trading ranges, providing directional sentiment readings.
Volume-Weighted Analysis : When volume data is available, incorporates volume flow direction to validate price-based sentiment signals.
Volatility-Adjusted Factors : Accounts for changing market volatility conditions by comparing current ATR against historical averages.
Weighted Combination : Merges all components using optimized weightings (Price: 1.0, Volume: 0.3, Volatility: 0.2) for balanced sentiment readings.
2. Session-Segregated Tracking
Automatic Session Detection : Precisely identifies active trading sessions based on user-configured time parameters.
Independent Calculations : Maintains separate sentiment accumulation for each major session, updated only during respective active hours.
Historical Preservation : Stores session-specific sentiment values even when sessions are closed, enabling cross-session comparison.
Real-Time Updates : Continuously processes sentiment during active sessions while preserving inactive session data.
3. Cross-Session Transition Analysis
Sentiment Differential Detection : Monitors sentiment changes when transitioning between trading sessions.
Configurable Thresholds : Generates signals only when sentiment shifts exceed user-defined minimum thresholds.
Directional Signals : Provides distinct bullish and bearish transition alerts with visual markers.
Smart Filtering : Applies smoothing algorithms to reduce false signals from minor sentiment variations.
⚙️ KEY FEATURES
1. Session-Specific Dashboard
Real-Time Status Display : Shows current session activity (ACTIVE/CLOSED) for all three major sessions.
Sentiment Percentages : Displays precise sentiment readings as percentages for easy interpretation.
Strength Classification : Automatically categorizes sentiment as HIGH (>50%), MEDIUM (20-50%), or LOW (<20%).
Customizable Positioning : Place dashboard in any corner with adjustable size options.
2. Advanced Signal Generation
Transition Alerts : Triangle markers indicate significant sentiment shifts between sessions.
Extreme Conditions : Diamond markers highlight overbought/oversold threshold breaches.
Configurable Sensitivity : Adjust signal thresholds from 0.05 to 0.50 based on trading style.
Alert Integration : Built-in TradingView alert conditions for automated notifications.
3. Forex Currency Strength Analysis
Base/Quote Decomposition : For forex pairs, separates sentiment into individual currency strength components.
Major Currency Support : Analyzes USD, EUR, GBP, JPY, CHF, CAD, AUD, NZD strength relationships.
Relative Strength Display : Shows which currency is driving pair movement during active sessions.
4. Visual Enhancement System
Session Background Colors : Distinct background shading for each active trading session.
Overbought/Oversold Zones : Configurable extreme sentiment level visualization with colored zones.
Multi-Timeframe Compatibility : Works across all timeframes while maintaining session accuracy.
Customizable Color Schemes : Full color customization for dashboard, signals, and plot elements.
🚀 HOW TO USE IT
1. Add the Script
Search for "Session-Based Sentiment Oscillator " in the Indicators tab or manually add it to your chart. The indicator will appear in a separate pane below your main chart.
2. Configure Session Times
Asian Session : Set Tokyo market hours (default: 00:00-09:00) based on your chart timezone.
European Session : Configure London market hours (default: 07:00-16:00) for European analysis.
US Session : Define New York market hours (default: 13:00-22:00) for American markets.
Timezone Adjustment : Ensure session times match your broker's specifications and account for daylight saving changes.
3. Optimize Analysis Parameters
Sentiment Period : Choose 5-50 bars (default: 14) for sentiment calculation lookback period.
Smoothing Settings : Select 1-10 bars smoothing (default: 3) with SMA, EMA, or RMA options.
Component Selection : Enable/disable volume analysis, price action, and volatility factors based on available data.
Signal Sensitivity : Adjust threshold from 0.05-0.50 (default: 0.15) for transition signal generation.
4. Interpret Readings and Signals
Positive Values : Indicate bullish sentiment for the active session.
Negative Values : Suggest bearish sentiment conditions.
Dashboard Status : Monitor which session is currently active and their respective sentiment strengths.
Transition Signals : Watch for triangle markers indicating significant cross-session sentiment changes.
Extreme Alerts : Note diamond markers when sentiment reaches overbought (>70%) or oversold (<-70%) levels.
5. Set Up Alerts
Configure TradingView alerts for:
- Bullish session transitions
- Bearish session transitions
- Overbought condition alerts
- Oversold condition alerts
❗️LIMITATIONS
1. Data Dependency
Volume Requirements : Volume-based analysis only functions when volume data is provided by your broker. Many forex brokers do not supply reliable volume data.
Price Action Focus : In absence of volume data, sentiment calculations rely primarily on price movement and volatility factors.
2. Session Time Sensitivity
Manual Adjustment Required : Session times must be manually updated for daylight saving time changes.
Broker Variations : Different brokers may have slightly different session definitions requiring time parameter adjustments.
3. Ranging Market Limitations
Trend Bias : Sentiment calculations may be less reliable during extended sideways or low-volatility market conditions.
Lag Consideration : As with all sentiment indicators, readings may lag during rapid market transitions.
4. Regional Market Focus
Major Session Coverage : Designed primarily for major global sessions; may not capture sentiment from smaller regional markets.
Weekend Gaps : Does not account for weekend gap effects on sentiment calculations.
⚠️ RISK DISCLAIMER
Trading and investing carry significant risk and can result in financial loss. The "Session-Based Sentiment Oscillator " is provided for informational and educational purposes only. It does not constitute financial advice.
- Always conduct your own research and analysis
- Use proper risk management and position sizing in all trades
- Past sentiment patterns do not guarantee future market behavior
- Combine this indicator with other technical and fundamental analysis tools
- Consider overall market context and your personal risk tolerance
This script is an original creation by TradeDots, published under the Mozilla Public License 2.0.
Session-based sentiment analysis should be used as part of a comprehensive trading strategy. No single indicator can predict market movements with certainty. Exercise proper risk management and maintain realistic expectations about indicator performance across varying market conditions.

MTF Sentiment ProMTF Sentiment Pro - Advanced Multi-Timeframe Analysis
Purpose & Methodology
MTF Sentiment Pro provides traders with comprehensive market sentiment analysis across multiple timeframes. This indicator's unique innovation is its weighted scoring system that evaluates both technical indicators and volume metrics to determine market sentiment across customizable timeframes.
Unlike simple indicator overlays or basic multi-timeframe tools, this indicator:
1. Calculates sentiment using a proprietary weighted formula across 7 different timeframes
2. Incorporates volume confirmation to validate price movements (a critical element often overlooked)
3. Provides clear visualization of sentiment alignment between lower and higher timeframes
4. Uses majority-rule algorithms for overall sentiment determination (2/3 rule for LTF, 3/4 rule for HTF)
Technical Components & Integration
Each timeframe's sentiment score is derived from a combination of:
- **EMA**: Evaluates trend direction and price position relative to moving average
- **RSI**: Measures momentum with sensitivity to the 50-level for trend determination
- **MACD**: Assesses trend strength and momentum through histogram analysis
- **Bollinger Bands**: Determines price volatility and position relative to the mean
- **VWAP**: Provides volume-adjusted price reference
- **OBV**: Confirms price moves with cumulative volume analysis
What makes this combination powerful is how these components are integrated:
- Each indicator contributes a weighted value to the overall sentiment score
- User-definable weights allow customization based on strategy preferences
- Volume confirmation adds a critical dimension beyond basic price-only indicators
- Multi-timeframe analysis helps identify alignment/divergence across time horizons
Trading Applications & Limitations
This indicator works best for:
- Trend confirmation across multiple timeframes
- Identifying potential reversal zones where LTF and HTF sentiments diverge
- Entry/exit timing when paired with your primary strategy rules
- Market structure analysis across different time horizons
Note: While this indicator provides comprehensive sentiment analysis, it should be used as part of a complete trading strategy with proper risk management. No indicator can predict market movements with certainty.
Usage Instructions
1. Select appropriate timeframes for your trading style or use one of the included presets
2. Adjust indicator weights to match your analytical preferences
3. Look for timeframe alignment/divergence to identify potential opportunities
4. Use the overall LTF and HTF sentiment readings for broader market context
This indicator was developed to solve the challenge of efficiently analyzing sentiment across multiple timeframes while incorporating volume confirmation - something that would otherwise require multiple indicators and manual correlation.

Dskyz (DAFE) Quantum Sentiment Flux - Beginners Dskyz (DAFE) Quantum Sentiment Flux - Beginners:
Welcome to the Dskyz (DAFE) Quantum Sentiment Flux - Beginners , a strategy and concept that’s your ultimate wingman for trading futures like MNQ, NQ, MES, and ES. This gem combines lightning-fast momentum signals, market sentiment smarts, and bulletproof risk management into a system so intuitive, even newbies can trade like pros. With clean DAFE visuals, preset modes for every vibe, and a revamped dashboard that’s basically a market GPS, this strategy makes futures trading feel like a high-octane sci-fi mission.
Built on the Dskyz (DAFE) legacy of Aurora Divergence, the Quantum Sentiment Flux is designed to empower beginners while giving seasoned traders a lean, sentiment-driven edge. It uses fast/slow EMA crossovers for entries, filters trades with VIX, SPX trends, and sector breadth, and keeps your account safe with adaptive stops and cooldowns. Tuned for more action with faster signals and a slick bottom-left dashboard, this updated version is ready to light up your charts and outsmart institutional traps. Let’s dive into why this strat’s a must-have and break down its brilliance.
Why Traders Need This Strategy
Futures markets are a wild ride—fast moves, volatility spikes (like the April 28, 2025 NQ 1k-point drop), and institutional games that can wreck unprepared traders. Beginners often get lost in complex systems or burned by impulsive trades. The Quantum Sentiment Flux is the antidote, offering:
Dead-Simple Setup: Preset modes (Aggressive, Balanced, Conservative) auto-tune signals, risk, and sizing, so you can trade without a quant degree.
Sentiment Superpower: VIX filter, SPX trend, and sector breadth visuals keep you aligned with market health, dodging chop and riding trends.
Ironclad Safety: Tighter ATR-based stops, 2:1 take-profits, and preset cooldowns protect your capital, even in chaotic sessions.
Next-Level Visuals: Green/red entry triangles, vibrant EMAs, a sector breadth background, and a beefed-up dashboard make signals and context pop.
DAFE Swagger: The clean aesthetics, sleek dashboard—ties it to Dskyz’s elite brand, making your charts a work of art.
Traders need this because it’s a plug-and-play system that blends beginner-friendly simplicity with pro-level market awareness. Whether you’re just starting or scalping 5min MNQ, this strat’s your key to trading with confidence and style.
Strategy Components
1. Core Signal Logic (High-Speed Momentum)
The strategy’s engine is a momentum-based system using fast and slow Exponential Moving Averages (EMAs), now tuned for faster, more frequent trades.
How It Works:
Fast/Slow EMAs: Fast EMA (Aggressive: 5, Balanced: 7, Conservative: 9 bars) and slow EMA (12/14/18 bars) track short-term vs. longer-term momentum.
Crossover Signals:
Buy: Fast EMA crosses above slow EMA, and trend_dir = 1 (fast EMA > slow EMA + ATR * strength threshold).
Sell: Fast EMA crosses below slow EMA, and trend_dir = -1 (fast EMA < slow EMA - ATR * strength threshold).
Strength Filter: ma_strength = fast EMA - slow EMA must exceed an ATR-scaled threshold (Aggressive: 0.15, Balanced: 0.18, Conservative: 0.25) for robust signals.
Trend Direction: trend_dir confirms momentum, filtering out weak crossovers in choppy markets.
Evolution:
Faster EMAs (down from 7–10/21–50) catch short-term trends, perfect for active futures markets.
Lower strength thresholds (0.15–0.25 vs. 0.3–0.5) make signals more sensitive, boosting trade frequency without sacrificing quality.
Preset tuning ensures beginners get optimized settings, while pros can tweak via mode selection.
2. Market Sentiment Filters
The strategy leans hard into market sentiment with a VIX filter, SPX trend analysis, and sector breadth visuals, keeping trades aligned with the big picture.
VIX Filter:
Logic: Blocks long entries if VIX > threshold (default: 20, can_long = vix_close < vix_limit). Shorts are always allowed (can_short = true).
Impact: Prevents longs during high-fear markets (e.g., VIX spikes in crashes), while allowing shorts to capitalize on downturns.
SPX Trend Filter:
Logic: Compares S&P 500 (SPX) close to its SMA (Aggressive: 5, Balanced: 8, Conservative: 12 bars). spx_trend = 1 (UP) if close > SMA, -1 (DOWN) if < SMA, 0 (FLAT) if neutral.
Impact: Provides dashboard context, encouraging trades that align with market direction (e.g., longs in UP trend).
Sector Breadth (Visual):
Logic: Tracks 10 sector ETFs (XLK, XLF, XLE, etc.) vs. their SMAs (same lengths as SPX). Each sector scores +1 (bullish), -1 (bearish), or 0 (neutral), summed as breadth (-10 to +10).
Display: Green background if breadth > 4, red if breadth < -4, else neutral. Dashboard shows sector trends (↑/↓/-).
Impact: Faster SMA lengths make breadth more responsive, reflecting sector rotations (e.g., tech surging, energy lagging).
Why It’s Brilliant:
- VIX filter adds pro-level volatility awareness, saving beginners from panic-driven losses.
- SPX and sector breadth give a 360° view of market health, boosting signal confidence (e.g., green BG + buy signal = high-probability trade).
- Shorter SMAs make sentiment visuals react faster, perfect for 5min charts.
3. Risk Management
The risk controls are a fortress, now tighter and more dynamic to support frequent trading while keeping accounts safe.
Preset-Based Risk:
Aggressive: Fast EMAs (5/12), tight stops (1.1x ATR), 1-bar cooldown. High trade frequency, higher risk.
Balanced: EMAs (7/14), 1.2x ATR stops, 1-bar cooldown. Versatile for most traders.
Conservative: EMAs (9/18), 1.3x ATR stops, 2-bar cooldown. Safer, fewer trades.
Impact: Auto-scales risk to match style, making it foolproof for beginners.
Adaptive Stops and Take-Profits:
Logic: Stops = entry ± ATR * atr_mult (1.1–1.3x, down from 1.2–2.0x). Take-profits = entry ± ATR * take_mult (2x stop distance, 2:1 reward/risk). Longs: stop below entry, TP above; shorts: vice versa.
Impact: Tighter stops increase trade turnover while maintaining solid risk/reward, adapting to volatility.
Trade Cooldown:
Logic: Preset-driven (Aggressive/Balanced: 1 bar, Conservative: 2 bars vs. old user-input 2). Ensures bar_index - last_trade_bar >= cooldown.
Impact: Faster cooldowns (especially Aggressive/Balanced) allow more trades, balanced by VIX and strength filters.
Contract Sizing:
Logic: User sets contracts (default: 1, max: 10), no preset cap (unlike old 7/5/3 suggestion).
Impact: Flexible but risks over-leverage; beginners should stick to low contracts.
Built To Be Reliable and Consistent:
- Tighter stops and faster cooldowns make it a high-octane system without blowing up accounts.
- Preset-driven risk removes guesswork, letting newbies trade confidently.
- 2:1 TPs ensure profitable trades outweigh losses, even in volatile sessions like April 27, 2025 ES slippage.
4. Trade Entry and Exit Logic
The entry/exit rules are simple yet razor-sharp, now with VIX filtering and faster signals:
Entry Conditions:
Long Entry: buy_signal (fast EMA crosses above slow EMA, trend_dir = 1), no position (strategy.position_size = 0), cooldown passed (can_trade), and VIX < 20 (can_long). Enters with user-defined contracts.
Short Entry: sell_signal (fast EMA crosses below slow EMA, trend_dir = -1), no position, cooldown passed, can_short (always true).
Logic: Tracks last_entry_bar for visuals, last_trade_bar for cooldowns.
Exit Conditions:
Stop-Loss/Take-Profit: ATR-based stops (1.1–1.3x) and TPs (2x stop distance). Longs exit if price hits stop (below) or TP (above); shorts vice versa.
No Other Exits: Keeps it straightforward, relying on stops/TPs.
5. DAFE Visuals
The visuals are pure DAFE magic, blending clean function with informative metrics utilized by professionals, now enhanced by faster signals and a responsive breadth background:
EMA Plots:
Display: Fast EMA (blue, 2px), slow EMA (orange, 2px), using faster lengths (5–9/12–18).
Purpose: Highlights momentum shifts, with crossovers signaling entries.
Sector Breadth Background:
Display: Green (90% transparent) if breadth > 4, red (90%) if breadth < -4, else neutral.
Purpose: Faster breadth_sma_len (5–12 vs. 10–50) reflects sector shifts in real-time, reinforcing signal strength.
- Visuals are intuitive, turning complex signals into clear buy/sell cues.
- Faster breadth background reacts to market rotations (e.g., tech vs. energy), giving a pro-level edge.
6. Sector Breadth Dashboard
The new bottom-left dashboard is a game-changer, a 3x16 table (black/gray theme) that’s your market command center:
Metrics:
VIX: Current VIX (red if > 20, gray if not).
SPX: Trend as “UP” (green), “DOWN” (red), or “FLAT” (gray).
Trade Longs: “OK” (green) if VIX < 20, “BLOCK” (red) if not.
Sector Breadth: 10 sectors (Tech, Financial, etc.) with trend arrows (↑ green, ↓ red, - gray).
Placeholder Row: Empty for future metrics (e.g., ATR, breadth score).
Purpose: Consolidates regime, volatility, market trend, and sector data, making decisions a breeze.
- VIX and SPX metrics add context, helping beginners avoid bad trades (e.g., no longs if “BLOCK”).
Sector arrows show market health at a glance, like a cheat code for sentiment.
Key Features
Beginner-Ready: Preset modes and clear visuals make futures trading a breeze.
Sentiment-Driven: VIX filter, SPX trend, and sector breadth keep you in sync with the market.
High-Frequency: Faster EMAs, tighter stops, and short cooldowns boost trade volume.
Safe and Smart: Adaptive stops/TPs and cooldowns protect capital while maximizing wins.
Visual Mastery: DAFE’s clean flair, EMAs, dashboard—makes trading fun and clear.
Backtestable: Lean code and fixed qty ensure accurate historical testing.
How to Use
Add to Chart: Load on a 5min MNQ/ES chart in TradingView.
Pick Preset: Aggressive (scalping), Balanced (versatile), or Conservative (safe). Balanced is default.
Set Contracts: Default 1, max 10. Stick low for safety.
Check Dashboard: Bottom-left shows preset, VIX, SPX, and sectors. “OK” + green breadth = strong buy.
Backtest: Run in strategy tester to compare modes.
Live Trade: Connect to Tradovate or similar. Watch for slippage (e.g., April 27, 2025 ES issues).
Replay Test: Try April 28, 2025 NQ drop to see VIX filter and stops in action.
Why It’s Brilliant
The Dskyz (DAFE) Quantum Sentiment Flux - Beginners is a masterpiece of simplicity and power. It takes pro-level tools—momentum, VIX, sector breadth—and wraps them in a system anyone can run. Faster signals and tighter stops make it a trading machine, while the VIX filter and dashboard keep you ahead of market chaos. The DAFE visuals and bottom-left command center turn your chart into a futuristic cockpit, guiding you through every trade. For beginners, it’s a safe entry to futures; for pros, it’s a scalping beast with sentiment smarts. This strat doesn’t just trade—it transforms how you see the market.
Final Notes
This is more than a strategy—it’s your launchpad to mastering futures with Dskyz (DAFE) flair. The Quantum Sentiment Flux blends accessibility, speed, and market savvy to help you outsmart the game. Load it, watch those triangles glow, and let’s make the markets your canvas!
Official Statement from Pine Script Team
(see TradingView help docs and forums):
"This warning may appear when you call functions such as ta.sma inside a request.security in a loop. There is no runtime impact. If you need to loop through a dynamic list of tickers, this cannot be avoided in the present version... Values will still be correct. Ignore this warning in such contexts."
(This publishing will most likely be taken down do to some miscellaneous rule about properly displaying charting symbols, or whatever. Once I've identified what part of the publishing they want to pick on, I'll adjust and repost.)
Use it with discipline. Use it with clarity. Trade smarter.
**I will continue to release incredible strategies and indicators until I turn this into a brand or until someone offers me a contract.
Created by Dskyz, powered by DAFE Trading Systems. Trade fast, trade bold.

Multi-timeframe Moving Average Overlay w/ Sentiment Table🔍 Overview
This indicator overlays selected moving averages (MA) from multiple timeframes directly onto the chart and provides a dynamic sentiment table that summarizes the relative bullish or bearish alignment of short-, mid-, and long-term moving averages.
It supports seven moving average types — including traditional and advanced options like DEMA, TEMA, and HMA — and provides visual feedback via table highlights and alerts when strong momentum alignment is detected.
This tool is designed to support traders who rely on multi-timeframe analysis for trend confirmation, momentum filtering, and high-probability entry timing.
⚙️ Core Features
Multi-Timeframe MA Overlay:
Plot moving averages from 1-minute, 5-minute, 1-hour, 1-day, 1-week, and 1-month timeframes on the same chart for visual trend alignment.
Customizable MA Type:
Choose from:
EMA (Exponential Moving Average)
SMA (Simple Moving Average)
DEMA (Double EMA)
TEMA (Triple EMA)
WMA (Weighted MA)
VWMA (Volume-Weighted MA)
HMA (Hull MA)
Adjustable MA Length:
Change the length of all moving averages globally to suit your strategy (e.g. 9, 21, 50, etc.).
Sentiment Table:
Visually track trend sentiment across four key zones (Hourly, Daily, Weekly, Monthly). Each is based on the relative positioning of short-term and long-term MAs.
Sentiment Symbols Explained:
↑↑↑: Strong bullish momentum (short-term MAs stacked above longer-term MAs)
↑↑ / ↑: Moderate bullish bias
↓↓↓: Strong bearish momentum
↓↓ / ↓: Moderate bearish bias
Table Customization:
Choose the table’s position on the chart (bottom right, top right, bottom left, top left).
Style Customization:
Display MA lines as standard Line or Stepline format.
Color Customization:
Individual colors for each timeframe MA line for visual clarity.
Built-in Alerts:
Receive alerts when strong bullish (↑↑↑) or bearish (↓↓↓) sentiment is detected on any timeframe block.
📈 Use Cases
1. Trend Confirmation:
Use sentiment alignment across multiple timeframes to confirm the overall trend direction before entering a trade.
2. Entry Timing:
Wait for a shift from neutral to strong bullish or bearish sentiment to time entries during pullbacks or breakouts.
3. Momentum Filtering:
Only trade in the direction of the dominant multi-timeframe trend. For example, ignore long setups when all sentiment blocks show bearish alignment.
4. Swing & Intraday Scalping:
Use hourly and daily sentiment zones for swing trades, or rely on 1m/5m MAs for precise scalping decisions in fast-moving markets.
5. Strategy Layering:
Combine this overlay with support/resistance, RSI, or volume-based signals to enhance decision-making with multi-timeframe context.
⚠️ Important Notes
Lower-timeframe values (1m, 5m) may appear static on higher-timeframe charts due to resolution limits in TradingView. This is expected behavior.
The indicator uses MA stacking, not crossover events, to determine sentiment.

Directional Sentiment LineRepost with explanation and description:
This is a simple SMA based indicator that I have, for lack of a better term, called directional sentiment line.
How it works:
The ribbon/band:
The main band tracks 4 SMAs, the Open, High, Low and Close.
The user can input the length for lookback time, I do 75 and I have it defaulted at 75, however you can do whatever time frame you prefer.
The color of the indicator changes based on the overall trend. Green means an uptrend and red means a downtrend.
When the stock is trading within the band, you generally want to avoid a trend until you see a break out one way or the other. In the image below, you see the green arrow pointing to an area where it re-tests the band but the band remains green to affirm there is support. It then bounces off.
The red arrow, you see that the band is flashing red, meaning that it seems to be losing support and its best to wait for a break out one way or the other prior to taking the trade:
The outer lines:
You will see the two outer bands which generally appear blue while a stock is trading within them.
These are the SMAs of the highest high and lowest low in your defined period (default 75).
They can act as moving targets.
When the colour of one of them changes orange, it means the stock is trading above or below them. If the highest high turns orange, it means the stock is trading high above the bands and highest high SMA. Inverse for the lowest low. See the image below:
The purple arrows are pointing to these max band lines and show how they change colour depending on the location of the highest high.
How to use it:
So I made this simply to give me a reference point for day trades off open. However, looking at the large timeframes, I do see there is quite a lot of potential for larger timeframe analyses as well.
I recommend playing around with it and seeing what you like. But I can give you the rules I use for this as a day trading aid:
My Rules:
1. If stock opens below DSL, wait to see if it will retest. It naturally likes to continually make contact with the DSL line at random intervals:
2. If stock opens above DSL, again wait for re-test:
A hold above DSL = Bullish
A break and hold below DSL = bearish
3. When playing a breakout (sentiment shift from bearish to bullish or vice versa), wait for a retest of the line because frequently, there are fakeouts:
A re-test and bounce off the line confirms a breakout. A re-test and fails confirms a continuation of the predominate sentiment.
For further reference, I have done a tutorial video below:
Let me know your questions, comments and suggestions below!
Thanks!
Bias And Sentiment Strength (BASS) Indicator by mattzabBias And Sentiment Strength (BASS) Indicator is designed to be a quick visualization as to the market strength.
Pair with Alligator, MACD, or Moving Average lines on your chart for good results.
How to use this indicator:
Blue above 0 is positive sentiment, red below 0 is negative sentiment.
If you have blue above and red below, be cautious! The Bass is telling you that we have a battle between the Bulls and the Bears!
The purple bars are your volume bias. Volume bias can be positive or negative, despite the direction of the overall trend. Positive Volume Bias along with Bullish Blue Sentiment is a great sign! Go Long! If you have Bullish Sentiment and have a negative Volume Bias, be cautious! Price may not be moving with much conviction, and may be subject to reversal!
This is basically several different histograms overlaying one another, and they are blue above 0 and red below 0.
MACD Histogram - Standard MACD Histogram here.
RSI Histogram - This is a standard RSI. It has been adjusted to "oscillate" above and below zero, which would be the 50 line on a normal RSI chart.
Slow Stochastic Histogram - This is a slow stochastic with a 21 Period K, 14 Period D, and 14 Smoothing K. The "oscillator" histogram is formed by subtracting K from D.
Awesome Oscillator - This is a standard Awesome Oscillator
Alligator Oscillator - This is formed by adding (lips + teeth) + (teeth - jaw)
Volume Bias - The Volume Bias is displayed as purple bars, and is calculated by a highly sophisticated and complex algorithmic function called subtraction. It's just the 30 Period Volume-Weighted Moving Average Minus the 30 Simple Moving Average.
Enjoy!

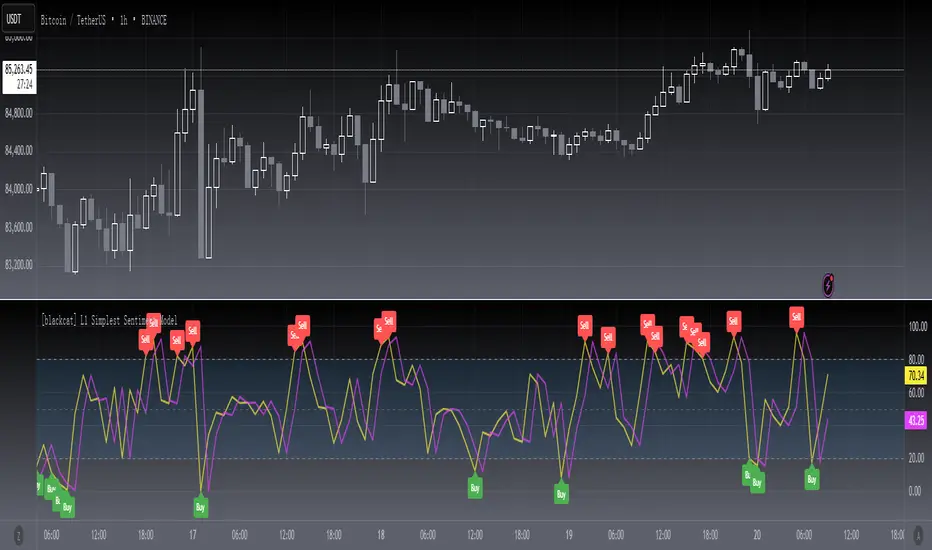
[blackcat] L1 Simplest Sentiment ModelLevel 1
Background
My market sentiment indicator system mainly includes collecting various statistical data and drawing. Again, it was fitted using the OHLC data. This belongs to the latter.
Function
Through a simple calculation, the ratio of high and low breakouts to the price range, we know the sentiment of funds. At the same time, a delay line is used as a trigger signal to judge the inflection point of emotions through the golden fork and the dead fork. Mood thresholds can be defined, such as 20 and 80. This is an oscillator model, but also the simplest indicator of sentiment.
Remarks
Feedbacks are appreciated.
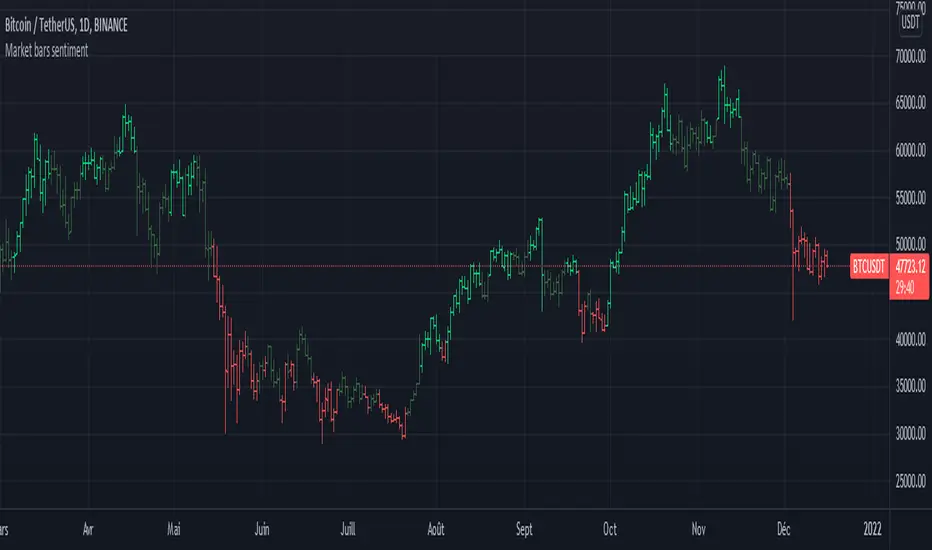
Market bars sentimentBonjour,
j'ai écrit cette indicateur des sentiments de pour avoir une rapide aperçu de marche
Voici le code couleurs:
-barres de couleur rouge signalons la vent panique( pour certain opportunité)
-barres de couleur vert fonce signalons la positivité, début de dominance des acheteurs au la stabilisation des cours âpres les achats euphorique
-barres de couleur lime signalons éphorie des acheteurs sur le marche.
L’indicateur est adopter pour étudier le marche de cryptomonnaie,Indice boursier au actions en particulier.
[blackcat] L3 Market Sentiment IndicatorLevel 3
Background
I've been thinking about trying out some technical indicators of market sentiment recently. Of course, this may not be limited to OHLC data, but requires more statistical data for analysis. However, I still wanted to try making a market sentiment indicator with OHLC. In this way, the difference between the two indicators can be compared later.
Function
This market sentiment indicator is functionally divided into two categories: the first is the sentiment line, which is a total of 3 lines. The first line is the yellow aggressive trader sentiment line, usually expressed as a 5-period moving average; the second line is the purple conservative trader interest line, which I used a slightly more complicated algorithm. The third line is the market sentiment line that takes the average of the first two. It is yellow when the market price is rising and purple when the price is falling.
The second type is the pressure line and the support line, a total of four, when they are support lines, the color is green; once they become resistance lines, the color will change from green to red, and show the current price of pressure or support.
Remarks
Feedbacks are appreciated.

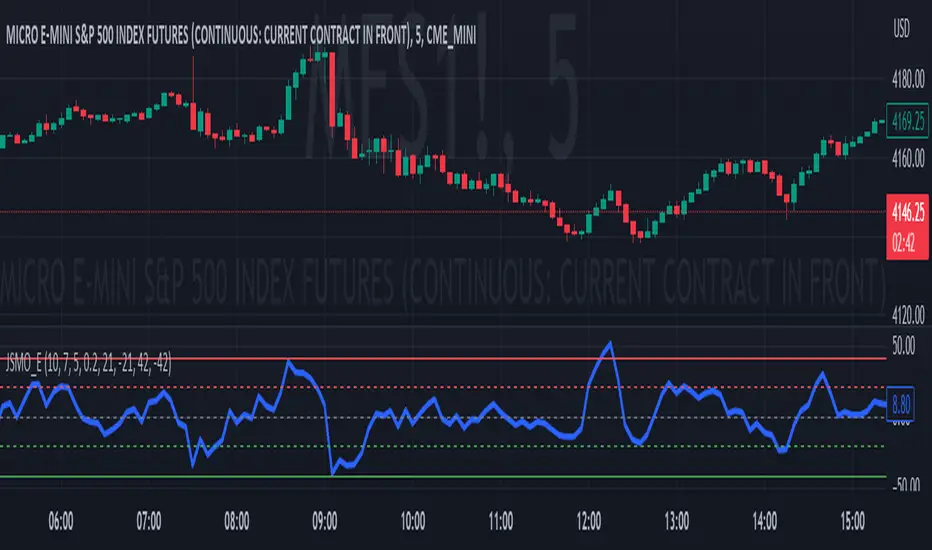
Jdawg Sentiment Momentum Oscillator EnhancedThe Jdawg Sentiment Momentum Oscillator Enhanced (JSMO_E) is a versatile technical analysis indicator designed to provide traders with insights into potential trend changes and overbought or oversold market conditions. JSMO_E combines the principles of the Relative Strength Index (RSI), the Simple Moving Average (SMA), and the Rate of Change (ROC) to create a comprehensive tool for assessing market sentiment and momentum.
The uniqueness of JSMO_E lies in its ability to integrate the RSI, SMA of RSI, and ROC of RSI, while also allowing users to customize the weight of the ROC component. This combination of features is not commonly found in other indicators, which increases its distinctiveness.
To effectively use JSMO_E, follow these steps:
Apply the JSMO_E indicator to the price chart of the asset you are analyzing.
Observe the plotted JSMO_E line in relation to the zero line, overbought, and oversold levels.
When the JSMO_E line crosses above the zero line, it may signal the beginning of an uptrend or bullish momentum. Conversely, when the JSMO_E line crosses below the zero line, it may indicate the start of a downtrend or bearish momentum.
Overbought and oversold levels, marked by the red and green dashed lines, respectively, can serve as a warning that a trend reversal may be imminent. When the JSMO_E line reaches or surpasses the overbought level, it might indicate that the asset is overvalued and could experience a price decline. Conversely, when the JSMO_E line reaches or goes below the oversold level, it can signal that the asset is undervalued and may experience a price increase.
Adjust the input parameters (RSI Period, SMA Period, ROC Period, and ROC Weight) as needed to optimize the indicator for the specific market and time frame you are analyzing.
The JSMO_E indicator is suitable for various markets, including stocks, forex, commodities, and cryptocurrencies. However, its effectiveness may vary depending on the market conditions and time frames used. It is recommended to use JSMO_E in conjunction with other technical analysis tools and methods to confirm potential trade setups and improve overall trading performance. Always conduct thorough backtesting and forward-testing before employing any indicator in a live trading environment.
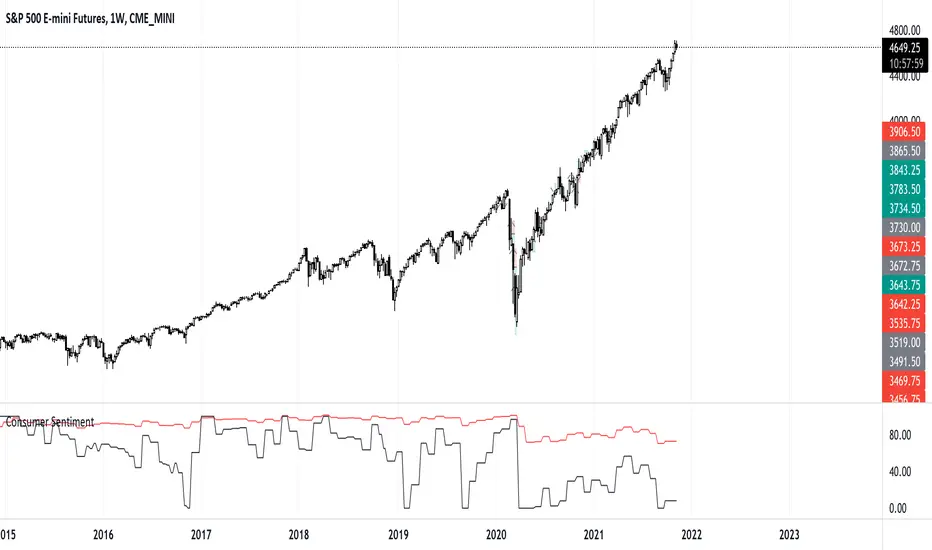
Michigan Consumer SentimentThis script pulls the Michigan Consumer Sentiment from Quandl
This script also indexes the sentiment score from 0-100 on a 1 year lookback to help visualise extreme highs and lows that may indicator turning points.
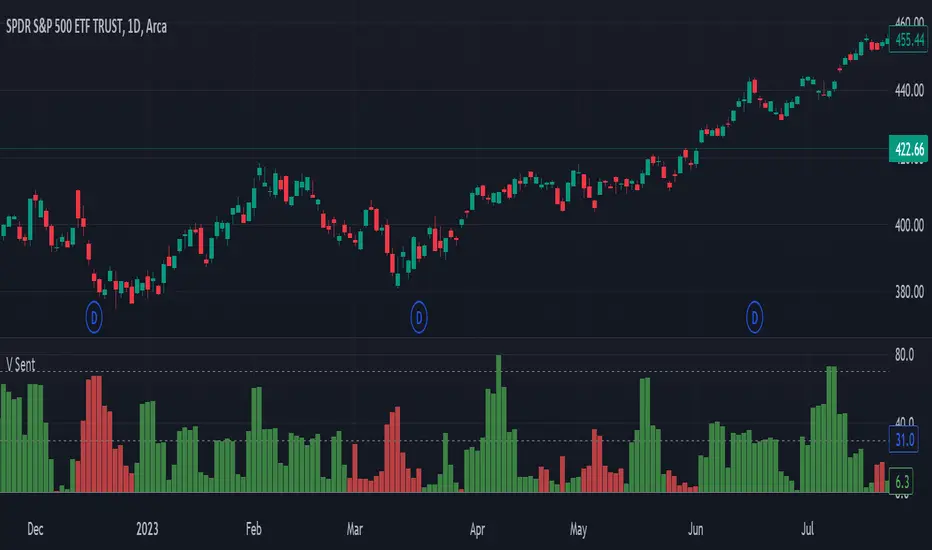
Momentum Sentiment Indicator by mattzabThis indicator uses 3 moving averages and includes volume to display sentiment and momentum.
By default, a 5, 8, and 13 SMA is displayed (black lines).
The colored bands are the corresponding volume weighted moving averages.
When the colored band is above the black line, sentiment is bullish.
Think of the color as being a show of volume, and the black lines as support and resistance.
When the lines are trending up, and colors are above the black lines, an uptrend is in progress.
When the colors are mixed above and below, and the lines are intertwined, it is a ranging market.
The lines operate similar to the Williams Alligator.

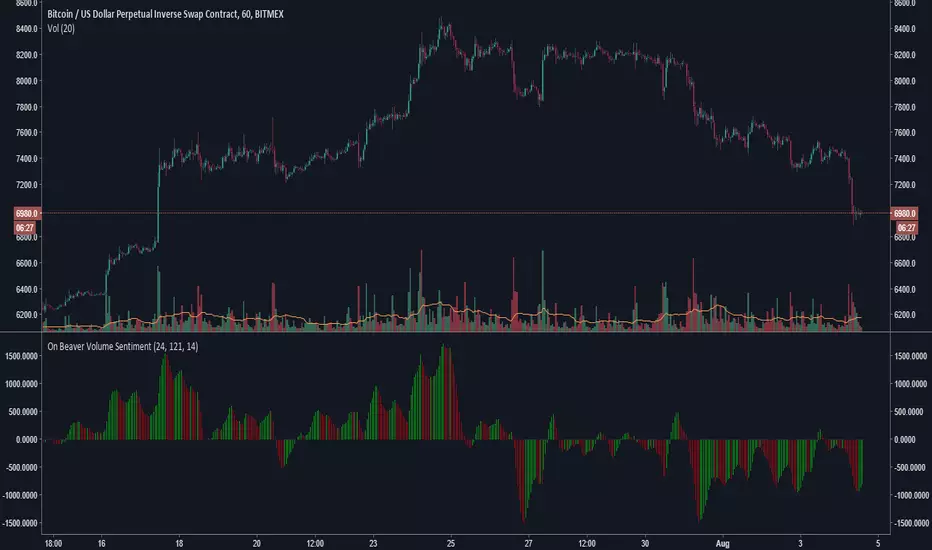
On Beaver Volume SentimentGeneral Market sentiment decoded from two Lazybear OBV's and a CCI.
Lots of strategies with this.
Main point is this indicator tries to be extra sensitive to relative volume changes but keep grounded in sentiment with the cci.
Let me know if you use this!
-Beaverman
Volume SentimentIn 1994 Tushar Chande and Stanley Kroll published a epic book of modern trading indicators called "The New Technical Trader". I highly recommend it. Two indicators that stood out was the Market Thrust and Thrust Oscillator. They suggested these as alternatives to the Arms Index. Rather than using the Advancing Stocks and their associated volume, I applied their logic to individual bars.
Bar Sentiment can be defined and the difference between the low and the close relative to the bar width. Smaller values are bearish and larger one are bullish. A bullish candle would close above its mid-point. Conversely, a close below the candle mid-point is considered bearish.
With that, this script sums the bullish or bearish (as defined above) volume over a user defined number of bars. It gives a unique indication of the volume compared to typical volume indicators. It also gives the user the option to set a "High Volume" alert when the total volume is greater than the moving average. This is helpful for identify increasing activity in your security.
Enjoy and happy trading!
BTC Sentiment analysis RSI 2xEMAThis is a CRYPTO correlation strategy, which is using BTC sentiment with BITFINEX long and short ratios.
WIth them we are making from one side 2 RSI, one for long and another for short. And from another side, we are going to make multiple EMA's, using the ratios for long and short.
Rules for entry
For this scenario I created a long only strategy.
The long entry condition is : we have a crossover of the rsi long ratio with rsi short ratio and long ratio from BITFINEX is above the long EMA and short ratio from BITFINEX is below short EMA.
We exit when we get the opposite condition, in this case we have a crossunder of the rsi long ratio with rsi short ratio and long ratio from BITFINEX is below the long EMA and short ratio from BITFINEX is above short EMA.
If you have any questions, let me know !

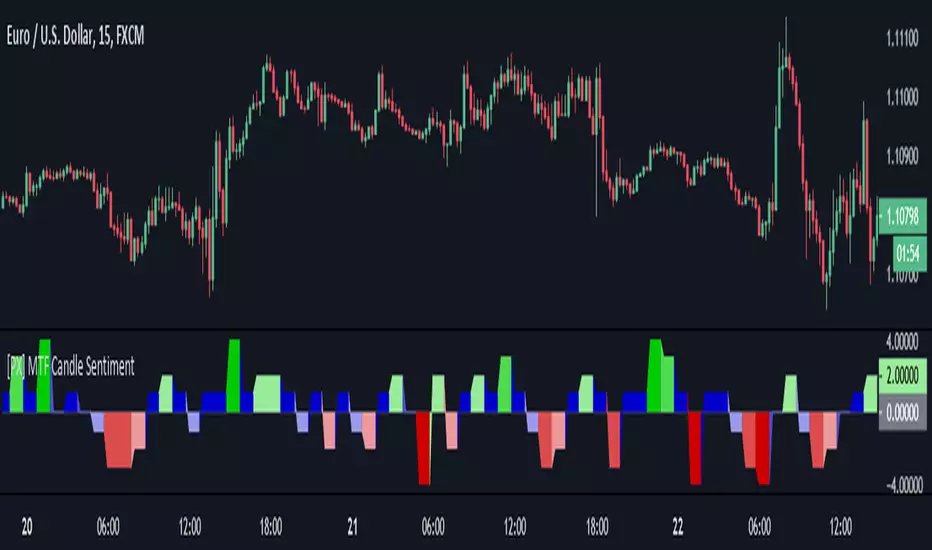
[PX] MTF Candle SentimentThis indicator calculates the candlestick sentiment for the selected timeframe. The calculation consists of two steps:
Step 1: Positioning of the closing price:
Upper Third = High Close
Mid Third = Mid Close
Lower Third = Low Close
Step 2: Positioning of the closing price in comparison to its previous candle:
Close above the high of the previous candle = Bull candle
Close within the range of the previous candle = Range candle
Close below the low of the previous candle = Bear candle
Those two steps create 9 possible scores, which will determine the color of the graph.
If you are looking for someone to develop your own indicator or trading strategy, don't hesitate to get in touch with me here on TradingView or below.
Contact:
www.pascal-simon.de
info@pascal-simon.de
Fear & Greed [theUltimator5]This indicator attempts to replicate CNN's Fear & Greed Index methodology to measure market sentiment on a scale from 0-100. It combines seven key market components into a single sentiment score, where lower values indicate fear and higher values indicate greed.
Note: It is impossible to perfectly replicate the true Fear & Greed indicator due to data limitations, so this indicator attempts to best replicate the output for each of the (7) components using available data.
The uniqueness of this indicator comes from the calculation methods for the 7 components as well as the visual representation of the data, which includes a table and selectable plots for each of the 7 components which make up the overall sentiment. Existing variants of the Fear & Greed Index have substantial flaws in the calculations of several of the components which result in warped final sentiment numbers. This indicator attempts to better track all 7 components and provide a closer model to the actual Fear & Greed index.
Here are the seven components and a brief description of how each are calculated:
1. Market Momentum
Calculation: S&P 500 current price vs. 125-day moving average
Measures how far the market has moved from its long-term trend
Uses CNN-style Z-score normalization over 252 trading days
Higher values indicate strong upward momentum (greed)
Lower values suggest declining momentum (fear)
2. Stock Strength
Calculation: S&P 500 RSI scaled to 252-day range
Uses 14-period RSI of the S&P 500 index
Normalizes RSI values based on their 252-day minimum and maximum
Measures overbought/oversold conditions relative to recent history
Higher values indicate overbought conditions (greed)
Lower values suggest oversold conditions (fear)
3. Price Breadth
Calculation: Modified McClellan Oscillator
Primary: Uses NYSE advancing vs. declining issues with 7-day smoothing
Fallback: Compares sector performance (QQQ, IWM vs. SPY)
Measures how many stocks participate in market moves
Broader participation indicates healthier trends
Narrow breadth suggests selective or weak trends
4. Put/Call Ratio
Calculation: Inverted CBOE Put/Call ratios
Primary: CBOE Equity-only Put/Call ratio (more sensitive)
Fallback: CBOE Total Put/Call ratio
Uses 5-day average and applies CNN normalization
Higher put/call ratios indicate fear (inverted to lower scores)
Lower put/call ratios suggest complacency (higher scores)
5. Market Volatility
Calculation: VIX relative to its 50-day average
Compares current VIX level to its 50-day moving average
Measures deviation from normal volatility expectations
Higher VIX relative to average indicates fear (lower scores)
Lower relative VIX suggests complacency (higher scores)
6. Safe Haven Demand
Calculation: Stock returns vs. bond yield changes
Compares 20-day smoothed S&P 500 returns to Treasury yield changes
When stocks outperform bonds, indicates risk appetite (higher scores)
When bonds outperform stocks, suggests risk aversion (lower scores)
Uses Treasury 10-year yields as the safe haven benchmark
7. Junk Bond Demand
Calculation: High-yield bond spread analysis
Measures yield spread between junk bonds (JNK ETF) and Treasuries
Compares current spread to its 5-day average
Narrowing spreads indicate risk appetite (higher scores)
Widening spreads suggest risk aversion (lower scores)
The combined sentiment is plotted as a single line which changes color based on the current sentiment value.
0-25: Extreme Fear (Red) - Market panic, oversold conditions
26-45: Fear (Orange) - Cautious sentiment, bearish bias
46-55: Neutral (Yellow) - Balanced market sentiment
56-75: Greed (Light Green) - Optimistic sentiment, bullish bias
76-100: Extreme Greed (Green) - Market euphoria, potentially overbought
There are dashed lines to represent the threshold values for each of the sentiments to better visualize transitions.
The table displays each of the (7) components of the index and their respective values. The table can be toggled on/off and the position can be moved.
An optional secondary line can be toggled on to display (1) of the (7) components as a unique color and the component name and value will highlight on the table. The secondary line can be used to dig into the main driving forces behind the overall index value.

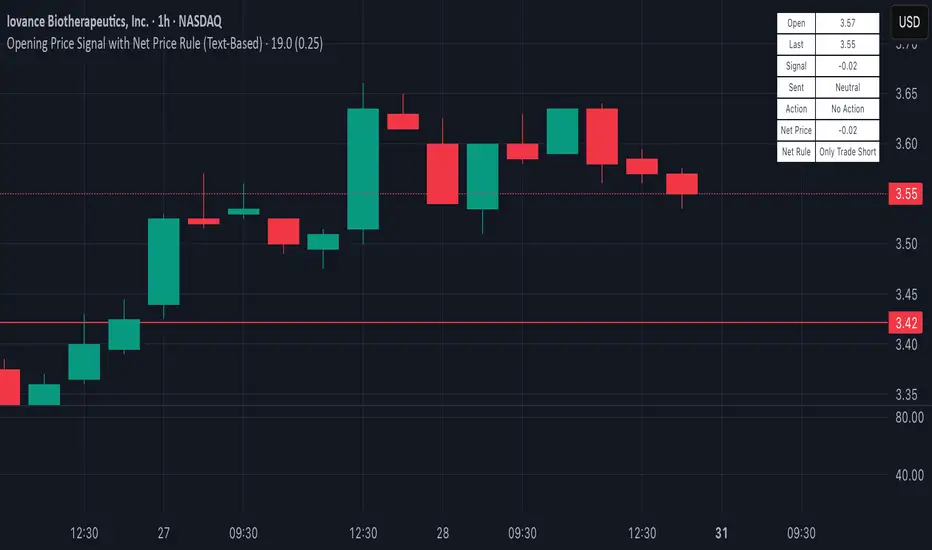
Opening Price Signal (Text-Based)Overview:
This simple yet powerful indicator quickly identifies the intraday trend direction by comparing the current price to the day’s opening price.
How it Works:
• Bullish Signal: Last price is at least +0.25 points above today’s open—suggests buying (Long).
• Bearish Signal: Last price is at least -0.25 points below today’s open—suggests selling (Short).
• Neutral: Price remains within ±0.25 points of today’s open—no trade recommended.
What’s Displayed:
• Open Price: Today’s opening price.
• Last Price: Current trading price.
• Signal: Difference between last price and today’s open.
• Sentiment: Clearly labeled as Bullish, Bearish, or Neutral.
• Action: Recommended trade direction (Long, Short, or None).
Recommended Timeframes:
• 5-Minute (ideal for precise intraday trading)
• 15-Minute (balanced clarity and noise reduction)
• 30-Minute (reduced noise, smoother signals)
Ideal Usage:
Perfect for day traders looking for a quick and clear gauge of intraday market sentiment. Use it to confirm momentum and trade confidently in the direction of the daily trend.
Happy trading! 📈✨