Gold Scalping BOS & CHoCHThis strategy is designed for scalping gold (XAU/USD) on the 3-minute timeframe, utilizing Break of Structure (BOS) and Change of Character (CHoCH) to identify high-probability trade setups. Unlike traditional SMA crossover strategies, this method focuses purely on price action and market structure shifts, allowing for early entries and better risk management.
Core Concepts:
Break of Structure (BOS) – Confirms a continuation of the trend when price breaks the last swing high (bullish) or last swing low (bearish).
Change of Character (CHoCH) – Detects possible trend reversals by identifying a shift in market momentum.
Dynamic Support & Resistance – Uses the last 10-bar highs and lows to determine adaptive stop-loss (SL) and take-profit (TP) levels.
Risk-to-Reward Ratio (1:2 RR) – Ensures trades are executed with a favorable risk/reward ratio.
Entry Conditions:
Buy Entry:
BOS (Bullish) confirmed (price breaks the previous swing high).
CHoCH (Bullish) confirms trend shift.
Price crosses back above the last swing low (confirmation of support).
Sell Entry:
BOS (Bearish) confirmed (price breaks the previous swing low).
CHoCH (Bearish) confirms trend shift.
Price crosses back below the last swing high (confirmation of resistance).
Exit Conditions:
Stop Loss (SL): Set at the most recent dynamic support (for buys) or resistance (for sells).
Take Profit (TP): 2x the risk (1:2 risk-reward ratio).
Advantages of This Strategy:
✅ No lagging indicators – Uses price action for real-time entries.
✅ High probability setups – Focuses only on strong structural breaks.
✅ Adaptive SL/TP – Uses real market structure instead of fixed values.
✅ Optimized for Scalping – Best suited for quick in-and-out trades.
Best Time to Trade:
🔹 London & New York Sessions (High volatility for gold).
ابحث في النصوص البرمجية عن "session high"

Trading SessionsTrading Sessions Indicator
Overview
Trading Sessions is a visually displays major trading sessions worldwide. It overlays the trading hours of four major markets - Sydney, Tokyo, London, and New York - on your chart.
Key Features
Simultaneous display of 4 trading sessions
Visual session dividers
Customizable session boxes
Session status display in top-right corner
Session Settings
Configuration Options per Session
Toggle visibility
Timezone configuration
Trading hours setting (Default: 08:00-17:00)
Background color setting (95% transparency)
Default Session Configuration
Sydney Session (Yellow)
Tokyo Session (Red)
London Session (Blue)
New York Session (Lime)
Session Divider Settings
Toggle divider visibility
Divider line position (top/bottom)
Session emoji position (top/bottom)
Customizable emoji per session
Sydney: 🦘
Tokyo: 🗼
London: 🚇
New York: 🗽
Overlay Settings
Force Overlay
When enabled: Forces session backgrounds behind candles
When disabled: Standard overlay display
Box Overlay
When enabled: Displays price range boxes during sessions
Shows session name at box top
Individual color settings per session
Display Features
1. Background Color Distinction
Each session shown in configured color
Visibility adjusted through transparency
2. Session Divider Display
Vertical line (|): Session start/end
Upper line (¯)/lower line (_): During session
Emoji: Session start
3. Status Display
Session status shown in top-right
Active sessions highlighted in corresponding colors
Inactive sessions shown in gray
Limitations
Timezones must conform to IANA Time Zone Database format

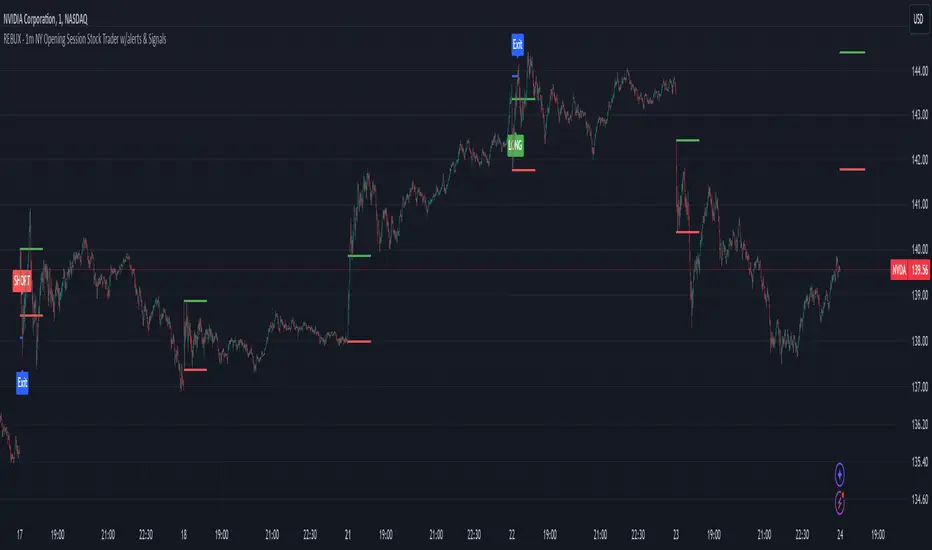
REBUX - 1m NY Opening Session Stock Trader w/alerts & SignalsREBUX - 1m NY Opening Session Stock Trader w/alerts & Signals
This closed-source indicator is designed to trade the volatile New York opening session on a 1-minute chart, offering traders a unique approach to scalping high-probability opportunities. What sets this script apart is its ability to dynamically detect key price ranges in real-time, then apply a percentage-based offset for precise trade entries, along with an automatic take-profit calculation based on the session’s volatility.
How It Works: The script monitors the first few minutes of the New York session to define a price range based on the session high and low. It then calculates entry levels using customizable percentage offsets. When the price crosses above or below these levels, the script triggers alerts for potential buy (LONG) or sell (SHORT) entries. Additionally, the script implements a take-profit level based on a percentage of the detected price range, automatically adjusting as volatility changes.
Key features include:
Customizable timing: Traders can configure the number of minutes after the session open to define the price range and when to stop trading for the day.
Dynamic price offsets: Entry points are calculated based on percentage offsets from the session’s range, ensuring flexibility in volatile markets.
Visual aids and alerts: The script plots visual labels on the chart for LONG and SHORT signals, and provides take-profit exit points, helping traders make informed decisions.
Originality and Usefulness: Unlike many open-source scalping scripts that rely on static strategies or traditional indicators, this script uses a session-specific approach, adapting to real-time price action and volatility. Its focus on the high-impact New York open and integration of automatic TP calculations make it an effective and unique tool for day traders who need to react quickly to market movements.
This script is particularly useful for traders who want to capitalize on the sharp price movements that occur at the NY session open, providing actionable alerts and visual signals to streamline the trading process.
Negroni Opening Range StrategyStrategy Summary:
This tool can be used to help identify breakouts from a range during a time-zone of your choosing. It plots a pre-market range, an opening range, it also includes moving average levels that can be used as confluence, as well as plotting previous day SESSION highs and lows.
There are several options on how you wish to close out the trades, all described in more detail below.
Back-testing Inputs:
You define your timezone.
You define how many trades to open on any given day.
You decide to go: long only, short only, or long & short (CAREFUL: "Long & Short" can open trades that effectively closes-out existing ones, for better AND worse!)
You define between which times the strategy will open trades.
You define when it closes any open trades (preventing overnight trades, or leaving trades open into US data times!!).
This hopefully helps make back-testing reflect YOUR trading hours.
NOTE: Renko or Heikin-Ashi charts
For ALL strategies, don’t use Renko or Heikin-Ashi charts unless you know EXACTLY the implications.
Specific to my strategy, using a renko chart can make this 85-90% profitable (I wish it was!!) Although they can be useful, renko charts don’t always capture real wicks, so the renko chart may show your trade up-only but your broker (who is not using renko!!) will have likely stopped you out on a wick somewhere along the line.
NOTE: TradingView ‘Deep backtesting’
For ALL strategies, be cynical of all backtesting (e.g. repainting issues etc) as well as ‘Deep backtesting’ results.
Specific to this strategy, the default settings here SHOULD BE OK, but unfortunately at the time of writing, we can’t see on the chart what exactly ‘deep backtesting’ is calculating. In the past I have noted a number of trades that were not closed at the end of the day, despite my ‘end of day’ trade closing being enabled, so there were big winners and losers that would not have materialized otherwise. As I say, this seems ok at these settings but just always be cynical!!
Opening Range Inputs
You define a pre-market range (example: 08:00 - 09:00).
You define an opening range (example: 09:00 - 09:30).
The strategy will give an update at the close of the opening range to let you know if the opening range has broken out the pre-market range (OR Breakout), or if it has remained inside (OR Inside). The label appears at the end of the opening range NOT at the bar that ‘broke-out’.
This is just a visual cue for you, it has no bearing on what the strategy will do.
The strategy default will trade off the pre-market range, but you can untick this if you prefer to trade off the opening range.
Opening Trades:
Strategy goes long when the bar (CLOSE) crosses-over the ‘pre-market’ high (not the ‘opening range’ high); and the time is within your trading session, and you have not maxed out your number of trades for the day!
Strategy goes short when the bar (CLOSE) crosses-under the ‘pre-market’ low (not the ‘opening range low); and the time is within your trading session, and you have not maxed out your number of trades for the day!
Remember, you can untick this if you prefer to trade off the opening range instead.
NOTES:
Using momentum indicators can help (RSI and MACD): especially to trade range plays in failed breakouts, when momentum shifts… but the strategy won’t do this for you!
Using an anchored vwap at the session open can also provide nice confluence, as well as take-profit levels at the upper/lower of 3x standard deviation.
CLOSING TRADES:
You have 6 take-profit (TP) options:
1) Full TP: uses ATR Multiplier - Full TP at the ATR parameters as defined in inputs.
2) Take Partial profits: ATR Multiplier - Takes partial profits based on parameters as defined in inputs (i.e close 40% of original trade at TP1, close another 40% of original trade at TP2, then the remainder at Full TP as set in option 1.).
3) Full TP: Trailing Stop - Applies a Trailing Stop at the number of points, as defined in inputs.
4) Full TP: MA cross - Takes profit when price crosses ‘Trend MA’ as defined in inputs.
5) Scalp: Points - closes at a set number of points, as defined in inputs.
6) Full TP: PMKT Multiplier - places a SL at opposite pre-market Hi/Low (we go long at a break-out of the pre-market high, 50% would place a SL at the pre-market range mid-point; 100% would place a SL at the pre-market low)'. This takes profit at the input set in option 1).

ICT KillZones Hunt [TradingFinder] 4 Sessions + OB + FVG + Alert🔵 Introduction
🟣 ICT
The "ICT" style is a subset of "Price Action" technical analysis. The primary goal of the ICT trading strategy is to merge "Price Action" with the "Smart Money" concept to pinpoint optimal trade entry points.
However, this approach's strength extends beyond merely finding entry points. It also helps traders gain a deeper understanding of price behavior and adapt their trading strategies to the market structure.
The most important concepts of "ICT" :
Order Block
Fair Value Gap(FVG)
Liquidity
🟣 Session
Financial markets are divided into several time periods, each featuring distinct characteristics and levels of activity. These periods, known as sessions, are active at different times during the day.
The primary active sessions in financial markets include :
Asian Session
European Session
New York Session
Based on the UTC time zone, the schedule for these key sessions is :
Asian Session: 23:00 to 06:00
European Session: 07:00 to 16:30
New York Session: 13:00 to 22:00
Note
To avoid session overlap and minimize interference during kill zones, the session times have been modified as follows :
Asian Session: 23:00 to 06:00
European Session: 07:00 to 14:25
New York Session: 14:30 to 22:55
🟣 KillZone
Kill zones are periods within a session where trader activity spikes. During these times, trading volume surges, and price movements become more pronounced.
The major kill zones, according to the UTC time zone, are as follows :
Asian Kill Zone: 23:00 to 03:55
European Kill Zone: 07:00 to 09:55
New York Morning Kill Zone: 14:30 to 16:55
New York Evening Kill Zone: 19:30 to 20:55
🔵 How to Use
🟣 Order Block
Order blocks are a distinct category of "Supply and Demand" zones, formed when a series of orders are grouped together. These blocks are often created by banks or other significant market participants.
Banks typically execute large orders in blocks during their trading sessions. If they were to enter the market with small quantities, substantial price movements would occur before the orders were fully executed, reducing potential profit.
To mitigate this, they divide their orders into smaller, more manageable positions. Traders should seek "buy" opportunities in "demand order blocks" and "sell" opportunities in "supply order blocks."
🟣 Fair Value Gap (FVG)
To pinpoint the "Fair Value Gap" on the chart, meticulous candle-by-candle analysis is essential. Pay close attention to candles with significant bodies, examining each candle alongside the one preceding it.
The candles flanking this central candle should exhibit elongated shadows, with bodies that do not intersect the body of the central candle. The span between the shadows of the first and third candles is referred to as the FVG range.
Note :
The origin of all Order Blocks and FVGs starts from inside a kill zone and extends up to the end of the same session.
🟣 Kill Zone Hunt
Following this strategy, after the conclusion of the kill zone and the stabilization of its high and low lines, if the price touches either of these lines within the same session and encounters a robust rejection, it presents an opportunity to enter a trade.
🔵 Setting
🟣 Global Setting
Show All Order Block :
If it is turned off, only the last Order Block will be displayed.
Show All FVG :
If it is turned off, only the last FVG will be displayed.
Show More Info Session :
If it is turned on, more information about kill zones (Trade Volume, Time, Number of Candles) will be displayed.
🟣 Logic Parameter
Pivot Period of Order Blocks Detector :
Enter the desired pivot period to identify the Order Block.
Order Block Validity Period (Bar) :
You can specify the maximum time the Order Block remains valid based on the number of candles from the origin.
Mitigation Level Order Block :
Determining the basic level of a block order. When the price hits the basic level, the order block due to mitigation.
🟣 Order Blocks Display
Demand Order Block :
Show or not show and specify color.
Supply order Block :
Show or not show and specify color.
🟣 Order Block Refinement
Refine Demand OB :
Enable or disable the refinement feature. Mode selection.
Refine Supply OB :
Enable or disable the refinement feature. Mode selection.
🟣 FVG
FVG Validity Period (Bar) :
You can specify the maximum time the FVG remains valid based on the number of candles from the origin.
Mitigation Level FVG :
Determining the basic level of a FVG. When the price hits the basic level, the FVG due to mitigation.
Show Demand FVG :
Show or not show and specify color.
Show Supply FVG :
Show or not show and specify color.
FVG Filter :
Enable or disable filtering of FVGs. Select filter mode.
🟣 Session
Show More Info Session Color
Asia Session, London Sesseion, New York am Session & New York pm Session :
Show or not show session and kill zones. Change the display color.
🟣 Alert
Send Alert When Touched Session high & Low :
On / Off
Alert Demand OB Mitigation :
On / Off
Alert Supply OB Mitigation :
On / Off
Alert Demand FVG Mitigation :
On / Off
Alert Supply FVG Mitigation :
On / Off
Message Frequency :
This string parameter defines the announcement frequency. Choices include: "All" (activates the alert every time the function is called), "Once Per Bar" (activates the alert only on the first call within the bar), and "Once Per Bar Close" (the alert is activated only by a call at the last script execution of the real-time bar upon closing). The default setting is "Once per Bar".
Show Alert Time by Time Zone :
The date, hour, and minute you receive in alert messages can be based on any time zone you choose. For example, if you want New York time, you should enter "UTC-4". This input is set to the time zone "UTC" by default.
Display More Info :
Displays information about the price range of the order blocks (Zone Price) and the date, hour, and minute under "Display More Info". If you do not want this information to appear in the received message along with the alert, you should set it to "Off".

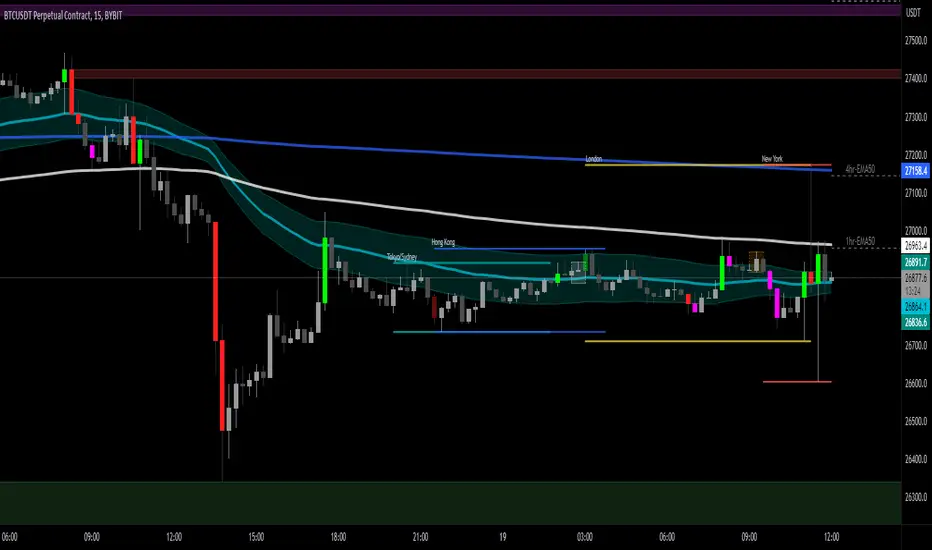
[DisDev] Tactical Analysis Part I: High-Volume Recovery🟩 Tactical Analysis Part I: High-Volume Recovery . Introducing the Tactical Analysis Indicator Suite , a comprehensive three-indicator system designed to provide traders with insights into high-volume candles, Induction Recovery Zones™, market sessions, and more. This versatile tool combines elements from PVSRA, Market Maker Method by Steve Mauro, and Tino from Traders Reality's Hybrid System, to enhance your trading performance.
⚡ OVERVIEW ⚡
Key Features 🔑
Induction Candles
Induction Recovery Zones™
Session - High & Low
Tactical Windows
EMA’s
Induction Table
Benefits 💸
Gain a better understanding of market dynamics through high-volume candle analysis.
Identify potential areas of liquidity and price recovery with Induction Recovery Zones™.
Keep track of major market sessions and their impact on price action.
Enhance your trading strategies with additional insights from Tactical Windows and EMA analysis.
Monitor the performance of top cryptocurrencies at a glance with the Induction Table.
⚙️ CONFIGURATION & SETTINGS ⚙️
Inputs 🔧
Customize the settings for Induction Candles, Induction Recovery Zones™, Session lines, Tactical Windows, and the Induction Table.
Adjust the EMA periods to match your preferred trading style.
Alerts 🔔
Set up alerts for Induction Candles and Induction Recovery Zone events.
Configure alerts for session openings and Tactical Windows to stay informed of market activity.
💡 USAGE & STRATEGY 💡
Trading Strategies 📈
Incorporate high-volume candle analysis into your existing trading strategies to better understand market conditions.
Use Induction Recovery Zones™ to identify potential price reversal areas and plan entries or exits accordingly.
Monitor market sessions, Tactical Windows, and the 4hr - 50 EMA to make informed decisions about trade timing.
Timeframes and Symbols ⌚
Recommended for use on timeframes of 30 minutes or lower for accurate session line representation.
Designed for all cryptocurrency markets. Forex and other major markets are currently under development.
🤖 DETAILS & METHODOLOGY 🤖
Algorithm and Calculation 🛡️
The algorithm identifies Induction Candles based on two conditions, taking into consideration volume and candle range.
Induction Recovery Zones™ are calculated based on the Induction Candles and their potential for price recovery.
📚 ADDITONAL RESOURCES 📚
Tutorials and Guides 📖
Our website provides comprehensive tutorials and guides to help users get the most out of this three-indicator suite.
Chart Examples 📊
London Tactical Window impulse break of the high, reversal
Induction Table - Monitor up to 12 other symbol’s Induction activity
EMA Crosses, Tactical Window, Future Sessions, Static EMA’s, and Recovery Zones
TA Part 1 and Part 2 integration
🚀 CONCLUSION 🚀
The Tactical Analysis Pt 1 - High Volume Recovery indicator offers a comprehensive and powerful toolset for traders, combining high-volume candle analysis, Induction Recovery Zones™, market session tracking, Tactical Windows, and EMA analysis. This unique combination of features is designed to help you make more informed trading decisions and enhance your overall trading performance. We encourage you to try out this indicator suite and experience the benefits it can bring to your trading journey.
The complete Tactical Analysis Indicator Suite
⚠️ DISCLAIMER ⚠️
This indicator is provided as a tool for traders and should not be used as the sole basis for making trading decisions. Always conduct your own research and consider your risk tolerance before entering any trades.
Market Sessions - By LeviathanA simple indicator to help you keep track of 4 market sessions (default: Tokyo, London, New York, Sydney) in 4 different visual forms (boxes, timeline, zones, colored candles) with many other useful tools.
You can choose between 4 different market sessions. The default ones are Tokyo, London, New York and Sydney but you can easily customize the times, names and colors to make the script plot any session you need. Sessions can be viewed in 4 different ways: boxes, zones, timelines, or just colored candles, all with customizable appearances. You can make your chart cleaner by merging sessions overlaps, choosing a custom lookback period and also picking between various additional settings such as viewing session High/Low or Open/Close change in % or pips, hiding weekends, viewing the Open/Close Line to identify session’s direction and 0.5 level to see session’s “Equilibrium” and much more. More updates with interesting tools will be added in the future.
Note: The script will plot the correct default Tokyo, London, New York and Sydney sessions automatically, your chart/Tradingview app timezone does not matter! If you wish to tweak the open/close times of sessions, just make sure you input them in UTC (but even this can be changed later in the settings)
Settings Overview
SESSIONS
- You can show/hide Tokyo Session, rename it, change the color and set up start/end time.
- You can show/hide London Session, rename it, change the color and set up start/end time.
- You can show/hide New York Session, rename it, change the color and set up start/end time.
- You can show/hide Sydney Session, rename it, change the color and set up start/end time.
* Keep in mind that you can fully change and customize these sessions and therefore create any other sessions or a zone you wish to display.
ADDITIONAL TOOLS AND SETTINGS
1. “Change (Pips)” - this will add the pip distance between Session High and Session Low or the pip distance between Session Open and Session Close to the session label.
2. “Change (%)” - this will add the percentage distance between Session High and Session Low or the percentage distance between Session Open and Session Close to the session label.
3. “Merge Overlaps” - this will merge the overlapping sessions and show only one at a time (end of Tokyo is moved to start of London, the end of London is moved to the start of New York, end of New York is moved to start of Sydney and end of Sydney is moved to start of Tokyo).
4. “Hide Weekends” - this will prevent the script from plotting sessions over the weekend when the markets are closed.
5. “Open/Close Line” - this will draw a line from the session open to the session close (or current price, if session is ongoing).
6. “Session 0.5 Level” - this will draw a horizontal line halfway between the session’s high and the session’s low.
7. “Color Candles” - this will color the bars/candlesticks with the color of the session in which they occurred.
8. Display Type” - Choose between three different ways of session visualization (Boxes, Zones and Candles).
9. “Lookback (Days)” - this input tells the script to only draw sessions for X days back (1 = one day).
10. “Change (%/Pips) Source) - this is where you choose the source of “Change (Pips)” and ”Change (%) ” labels. Picking “Session High/Low” will show you the change between Session High and Session Low and picking “Session Open/Close” will show you the change between Session Open and Session Close.
11. “Input Timezone” - this defines the timezone of the session start/end inputs (you don’t have to change this unless you know what you’re doing)
Make sure to read future update logs to keep track of the most recent additions and settings of this script.
Box generation code inspired by Jos(TradingCode), session box visuals inspired by @boitoki's FX Market Sessions

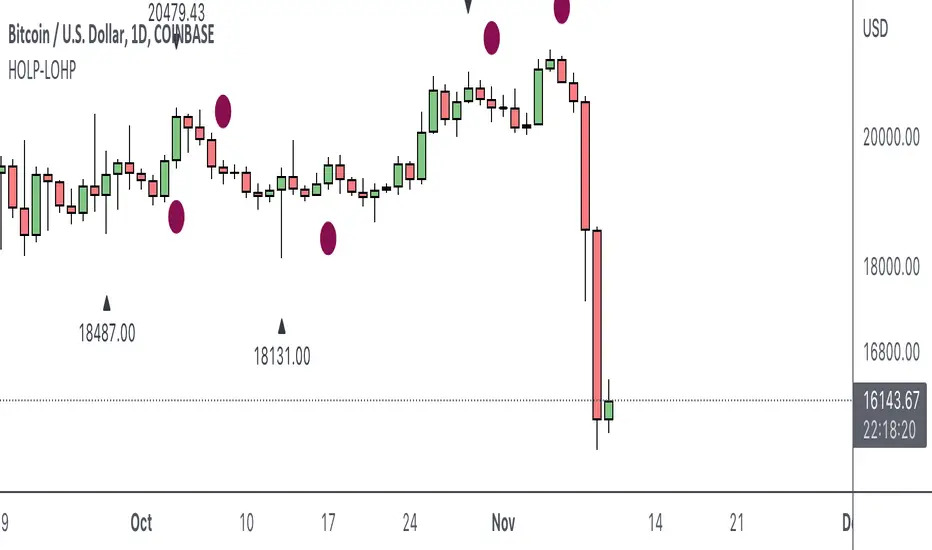
HOLP LOHP PivotCOINBASE:BTCUSD
HOLP and LOHP based on John Carter's Mastering the Trade.
HOLP stands for High Of the Low Period
LOHP stands for Low Of the High Period
This indicator is based on John Carter’s HOLP and LOHP from Mastering the Trade. The basic idea is to identify the session high and mark the low of the session high for a short entry, and vice versa for a long entry.
The default look back period is set to 10 here, albeit John Carter didn’t specify a hard coded number but rather the use of experience and common sense.
Option to turn on labels of the highs and lows of the pivots.
Opening Session High LowThis script shows the change from high price and low price of 1 bar in percent especially when you can highlight the distance from high and low in Sydney/Tokyo/London/Chicago opening.
With this you can quickly get an overview of historical distance from high price and low price.
Works good at 1 period of TPO = 30M
Examples of this script calculated distance of high price and low price when Tokyo Opening:
MM Future Session TimesThis script projects the Open/Close of the Asia, UK and US sessions highlighting the Gaps & Deadzone within the market Maker Model.
Dead Zone 5 - 8pm
Asia Gap - 8:00 - 8.30pm | Asia Open 08.30pm | Asia Close 3am
London Gap 3:00 - 3:30am | London Open 3.30am | London Close 9am
US Gap 09:00 - 9.30am | NY Open 9.30am | NY Close 5pm
Note this does not differentiate between the weekend and week day

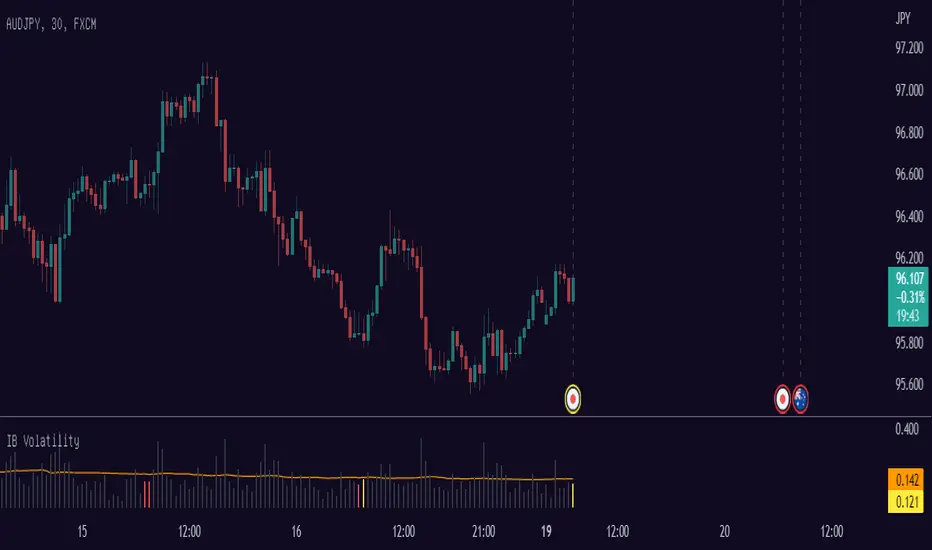
Sessions with High/Low DiffThe main purpose of this indicator is to facilitate backtesting, but it may also be useful for traders to easily identify the current
active/open trading sessions on lower-timeframe charts.
This indicator also tracks the session high/low difference and plots it as a label on the last candle of the session once the last
bar of that session has finished printing and a new candle opened. The position and direction of the label is based on the
session open and close - if the session open is greater than the session close (which would equate to the equivalent of a red candle),
the label will be printed UNDER the last candle, and vice versa if the session close is above the session open.
The number printed inside the label is the difference between the session high and the session low, scaled to the minimum tick value of the chart.
Note #1: There is a Pinescript maximum of 500 labels allowed on any chart. While I could have gotten fancy and done some wizardry with label arrays,
I didn't really see a point to it. If labels are enabled for all 4 sessions at the same time, that would still have them available for the past 125
sessions, which would be about 6 months (approx 252 trading days per year, and this would cover 125 of them). If you limit to 2 sessions, you double
your potential look-back to almost a year (250 days out of the 252 average trading days each year), and for a single session, you double it yet again
to just under 2 years.
Note #2: As this indicator tracks open, high, low, and close for each session, it can potentially be enhanced (or forked) to construct "session candles".
I'm not sure what use this would be to anyone, but the pieces are there should someone find a use for it.
While it would be easy to add alerts on sessions opening/closing, I didn't see a purpose or value in that as it would be little more than a
glorified alarm clock. If I get enough demand to add them, I will gladly consider it.

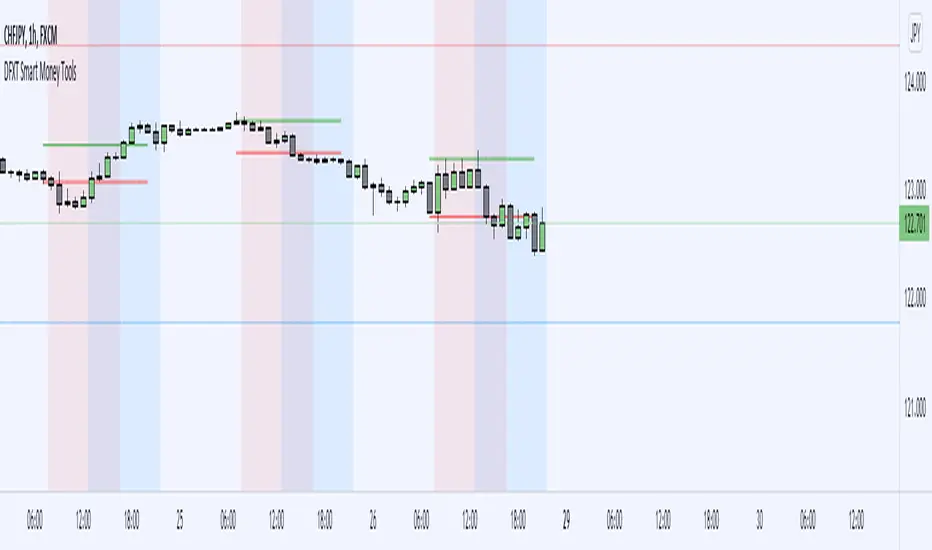
DFXT Smart Money ToolsAdded some additional features that may be useful for those trading smart money concepts.
~ Higher time frame candle Open, High, Low and close marker: for reference of where you are in price.
~ Asian Session High and Low marker: Can be used to clearly see runs on the Asian range.
~ Engulfing Candle detector: Marks engulfing candles in a colour of your choice.
~ Impulsive Candle detector: Marks Impulsive candles in a colour of your choice.
~ Quarter's Theory: Marks Quarter levels on the chart.
~ Doji Candle: Marks Doji candles in a colour of your choice.
~ Inside Bar detector: Marks Inside bars in a colour of your choice.
~ Imbalance detector: Marks Bullish and bearish imbalance in a colour of your choice.
~ Zig-Zag structure: Classic ZZ indicator that can be used to simplify the structure.
~ Liquidity Wicks: Wicks that take Liquidity then close back inside the range.
~ Session Marker: Markers the various trading sessions in a background colour of your choice.
Kviateq - Session PivotsFirst of all, I must say that this script wouldn't be possible without the help of one of the best script developers on TradingView - @ahancock (thanks a bunch for your help)
This script draws opening ranges for each of the sessions - Tokyo, London and New York and plots session high, low and pivot range of the previous session.
So if you trade London session - you would only take longs if we're above the Tokyo pivot range and vice versa for shorts.
Often times previous session's highs act as resistance and lows act as support, so careful trading around those levels.
It is obviously meant for lower timeframes, since each of the sessions only lasts a few hours.
Default settings are set to the exchange that I use and my timezone (GMT +7), so you might need to adjust the settings accordingly.
Tokyo - 12am GMT
London - 7am GMT
New York - 12pm GMT

Automatic Risk to Reward PivotsIn a nutshell I was tired of guestimating what my risk was between pivots when getting into trades I went to work on the basic math behind the relationship of the pivots to find their natural risk to reward ratios.
The natural risk to rewards span high and low...for example...you can go from the S3 --> R3 and that R:R is with a stop loss of the S4 is 7.4
But making all of those possibilities in code is excessive and for simplicity sake I price can only be between two pivot areas at any point in time.
So this auto risk to reward is limited to the 2:1 opportunities. If you by chance do the math for all of the possibilities as I have then it would be easy to change the Take Profit levels.
I use the fibonacci pivot points in this indicator but I include the mid levels and further extensions totaling 20 levels, 21 including the pivot.
Here they are...the generic plots are bolded...the additional levels are the other fib levels
R7 - 200%
R6 - 162%
R5 - 141%
R4 - 127%
R3 - 100%
R-C - 76%
R2 - 62%
R-B - 50%
R1 - 38%
R-A - 24%
Pivot
S-A - (24%)
S1 - (38%)
S-B - (50%)
S2 - (62%)
S-C - (76%)
S3 - (100%)
S4 - (127%)
S5 - (141%)
S6 - (162%)
S7 - (200%)
The indicator give you the setups for uptrends and downtrends based on the pivot point moving averages (ex. ema(hlc3, 34)) from a higher timeframe which you will be free to change yourself in the inputs.
For my setup, I trade from the daily pivots using the 10m or 5m chart so my next level up is the weekly pivots which I view using the 1H chart candles.
In the next iterations I will add the ability to change the MA lengths.
Pivot Point Moving average lengths
Weekly lengths - fast 34 : slow 55
Monthly lengths - fast 13 : slow 34
Yearly lengths - fast 13 : slow 34
Rules for Uptrends
Fast MA > Slow MA
Session high < r6
Rules for Downtrends
Fast MA < Slow MA
Session high > s6
Timeframes applicable are only those who have a higher pivot set above it
Monthly_SR = 240m, 300m, D
Weekly_SR = 26m, 30m, 60m
Daily_SR = 1m, 3m, 5m, 10m, 15m
Your take profit line will always populate where your risk will be 2:1
Your stop loss will always be one pivot level underneath or above your entry
Feel free to ask any questions. Trade well my friends!

PivotBoss Pivots & Camarilla - H,D,W, M timeframe & OHLC LabelsThis is the new pivotboss pivots calculations and also has Camarilla Pivots . User can define which time frame pivots they want to see starting from Hourly, Daily, weekly and monthly. Added labels for each levels. So that user can calculate potential profit targets. This script also includes Hourly and Daily OHLC with labels. Added Developing mid point of the current day. The script can calculate midpoint as and when new highs and lows are made through out the day
Abbrevations used in this script
yHI - Yesterday's session High
dOP - Days open
yCL - yesterday's session Close
yLO - yesterday's session Low
MP -- Developing midpoint of the day
TC - Top channel
P - Pivot Point
BC - Bottom Channel
R1 - R4 -- Resistance levels
S1 - S4 -- Support Levels


Dynamic PivotsShows various traditional pivots and hides the daily and weekly when you're watching in higher time frames. It also shows you the previous sessions highs and lows. In addition the developing pivots, high and low in the current session are also displayed.

NQ Lunch High Low First Sweep StrategyThis script identifies the FIRST liquidity sweep of the Lunch session high or low
after the Lunch session has ended, based on ICT / Killzone concepts.
Logic summary:
• Tracks Lunch session High and Low (New York time)
• After Lunch session closes, monitors the market on 5-minute timeframe
• Triggers ONLY on the first sweep:
– Price wicks beyond Lunch High and closes back below → SHORT signal
– Price wicks beyond Lunch Low and closes back above → LONG signal
• Generates an alert at the exact bar where entry is expected
• Designed specifically for Nasdaq (NQ) futures
• One trade per day – no overtrading
Notes:
• Intended for 5-minute charts only
• Uses New York session timing
• This script does NOT manage exits (TP/SL) – entry logic only
• Best used as a confluence tool, not a standalone system
Educational & discretionary use only.

Delta Strength (True TV Delta)Description
Delta Strength measures the intensity of aggressive trading activity using TradingView’s native Volume Delta engine (ta.requestVolumeDelta).
Volume Delta shows which side is aggressive (buyers or sellers).
Delta Strength answers a different question:
How strong is that aggression compared to recent market behavior?
This indicator converts true per-bar volume delta into a relative strength ratio, helping identify institutional participation, initiative moves, absorption, and potential traps at key price locations.
No candle-based approximation is used. The calculation relies on TradingView’s internal bid-ask volume classification from lower timeframes.
How It Is Calculated
• Per-bar delta is derived from the difference between cumulative delta at bar close and bar open
• Absolute delta is averaged over a user-defined lookback period
• Current delta is compared against this average to produce a normalized strength value
This makes the indicator adaptive across instruments, volatility regimes, and sessions.
How to Read Delta Strength
• Values below the lower threshold indicate normal or low-quality activity
• Rising values show increasing professional participation
• Very high values indicate strong imbalance or aggressive initiative orders
• Extreme values without price follow-through often signal absorption or trapping
Delta Strength measures intensity only, not direction.
How to Use (Important)
Always combine Delta Strength with price location and structure.
Best locations include:
• VWAP and VWAP bands
• Previous Day High / Low
• Session highs and lows
• Range boundaries or value edges
Interpretation logic:
• Strong delta with price acceptance supports continuation
• Strong delta with price rejection suggests absorption or exhaustion
What This Indicator Is NOT
• Not a directional signal
• Not a standalone entry tool
• Not a trend indicator
Using Delta Strength without context can lead to false conclusions.
Intended Use
This indicator is designed for:
• Order Flow Analysis
• Market microstructure study
• Institutional activity confirmation
• Advanced discretionary trading workflows
It works best when combined with Volume Delta, VWAP, and structure-based analysis.
Summary
Delta shows who is aggressive.
Delta Strength shows how aggressive they are.
Price reaction shows whether that aggression is accepted or absorbed.
Used together, they provide insight into market intent rather than just price movement.

Golden hour 1130 1230 Session LinesGolden Hour 11:30–12:30 Session Lines
Overview :
Calculate the session high and low between 11:30 AM and 12:30 PM and mark the lines.
Trading Rule
Once the price breaks either side (high or low), it will continue to move further in that direction.
Session Time : 11:30 AM – 12:30 PM
Key Levels : Session High & Session Low
Strategy : Breakout continuation in the direction of the break

Customer Short strategy A5.1 + Session + CBL SLFor my customer.
HalfTrend Directional Framework (A5.1)
Used for primary trend recognition and breakout validation.
Session-Based Volatility Windows
Trades only occur within specific high-liquidity windows (e.g., 08:30–12:30 and 12:30–16:30), improving fill quality and reducing noise.
Three-Bar Opening Range Model
The first three 5-minute bars define:
session high
session low
These become structural breakout levels:
price > range high → long-bias
price < range low → short-bias
CBL (Guppy Count-Back Line) Stop-Loss
Instead of using ATR or static percentage stops, Libra_S relies on CBL to:
avoid premature exits during healthy pullbacks
capture trend persistence
provide structure-based invalidation

Session H/L (Lumiere)This is the 2.0 version of ''Trading session High/Low''
Previous Day High & Low (PDH / PDL)
The script now draws:
PDH = previous day’s high
PDL = previous day’s low
They:
Are based on the daily timeframe (not your chart timeframe).
Look the same and sit in the same place on all timeframes.
Have their own color, width, and style in:
“Previous Day Levels” settings.
Clean PDH/PDL text instead of labels.
You can show/hide this text with: “Show PDH/PDL Text”
PDH/PDL also get dotted when swept.
Timezone handling is now flexible & DST-aware
Instead of a fixed "Etc/GMT+4" (which breaks during summer/winter time changes),
you now have a dropdown.

XXMonk Sequence Price Grid (Manual Origin + U)⭐ XXMonk Sequence Grid – Harmony Price Levels (1–144 Sequence Engine)
Algorithmic Sequence Mapping for Price Displacement
The XXMonk Sequence Grid is a precision mapping tool designed to project algorithmic price levels using harmonic numerical sequences derived from the ICT-inspired time/price symmetry concept.
This indicator takes a user-defined Origin (EQ level) and generates symmetrical expansion bands above and below price using any combination of the following sequence values:
These levels act as algorithmic rails that price frequently reacts to, respects, or expands toward — providing traders with a structural framework to interpret displacement, liquidity objectives, and sequence-based expansions.
🔷 Core Features
✔ Manual Origin (EQ Level)
Set any midpoint — daily open, session equilibrium, dealing range midpoint, your own anchor, etc.
✔ Manual U Value (Unit Size)
No restrictions. Enter any point value (ex: 0.25, 1, 5, 12.5, 25…) to scale the sequence to your instrument.
✔ Full Sequence Control
Toggle ON/OFF each individual harmonic sequence:
Micro ranges → 1, 3, 5
Intermediate → 8, 13, 21
Macro ranges → 34, 55, 89, 144
✔ Individual Line Colors
Every sequence level has its own color input for full customization.
✔ Static Lines (Do Not Move With Cursor)
Lines anchor from the first bar and extend infinitely to the right.
✔ Automatic Labels on Right Side
These levels often align with:
Liquidity pools
Displacement endpoints
PD array boundaries
Algorithmic expansion levels
Reversal zones
Session highs/lows
Volatility-based fractals
Price frequently travels sequence-to-sequence, creating a predictable harmonic structure.
