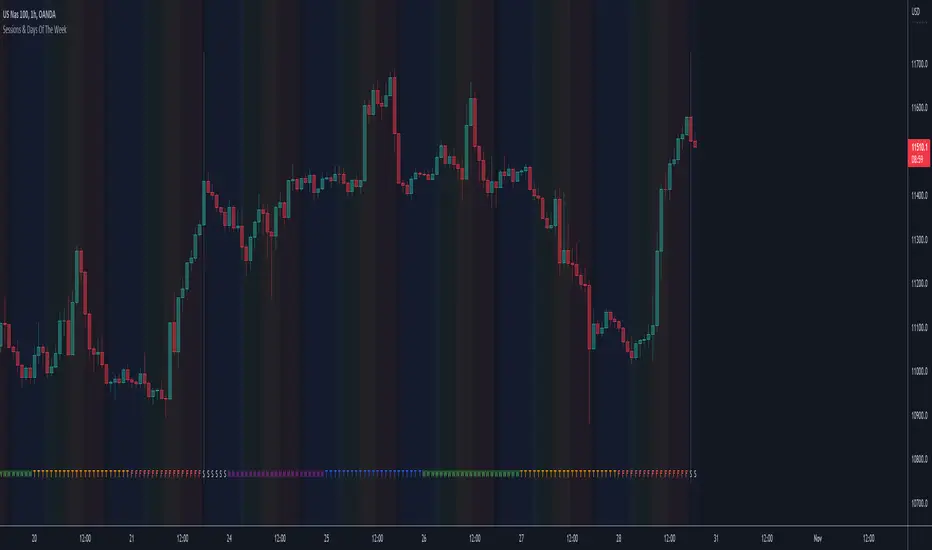
Sessions & Days Of The WeekTraders tend to focus their energy on specific sessions or time periods. This indicator will plot the days of the week, and also highlight the following sessions: Frankfurt (2:00am - 11:00am EST), London (3:00am - 12:00pm EST), New York (8:00am - 5:00pm EST), Sydney (5:00pm - 2:00am EST), Tokyo (7:00pm - 4:00am EST).
It’s important to be aware that Session Open and Close times will vary based on the time of year, as countries shift over to daylight savings time.
ابحث في النصوص البرمجية عن "session"
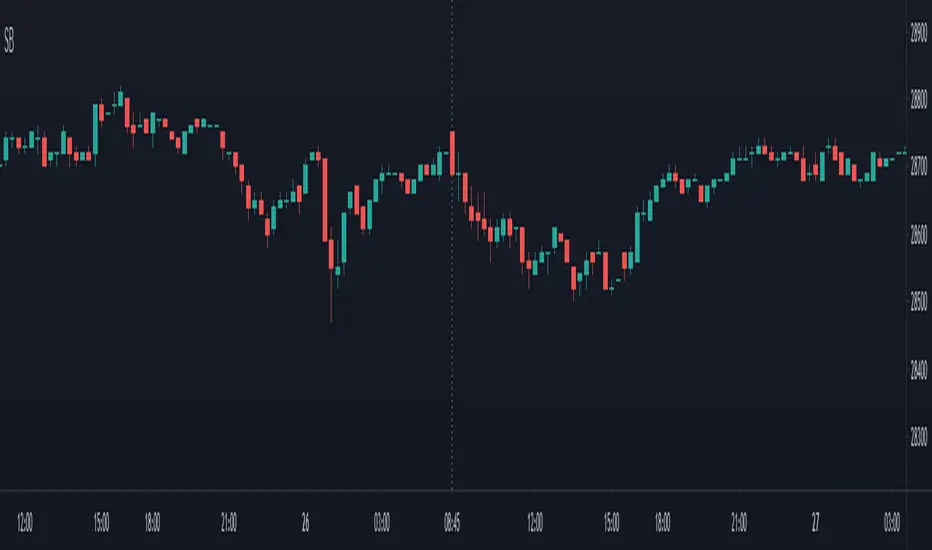
Session break 225The default session break line for the NIKKEI 225 INDEX FUTURES (NK225) is drawn at 16:30 (GMT+9), the start of the night session.
This indicator draws a vertical line at 8:45 a.m (GMT+9), the start of the day session.
It is also possible to change the time at which the vertical line is drawn.
Session LiquidityThe “Session Liquidity” TradingView indicator by Infinity Trading creates dynamic horizontal lines at the high and low points of a specified time span within the trading day. This indicator gives the user control of three separate time spans so the user can dynamically see the highs and lows of their favorite daily time spans.
Purpose
This indicator is similar to my TradingView indicator “Futures Exchange Sessions 3.0”. In that indicator the user gets control of dynamic price boxes. For me, these boxes made it difficult to spot ICT’s Orderblocks. So instead of boxes I made independently controllable lines and now I can spot ICT Orderblocks and easily identify Liquidity Pools.
Inputs and Style
Everything about the three dynamic lines can but independently configured. Start & End Times, Line Color, Line Style, Line Width, Text Characters, Text Size, Text Color can all be adjusted. The high and low lines as well as their text labels can be individually toggled on or off for maximum control.
Timezone
All of the start and end times are in EST. Additionally, each time span line needs a specific start of each day. This is controlled by a setting called “Line Start Day Timezone” where the user sets a timezone that corresponds with the start time. In general if a timespan resides within a particular Session pick the corresponding timezone. If the users line fits in the Asian Session then choose Asia/Shanghai. If the line is within the London Session then choose Europe/London. And the same goes for the New York Session.
Special Notes
If the Line Start Time is within one candle of the Start Day Timezone in the Settings, then the line/box won’t display. So choose the previous timezone
Lines only display when the timeframe is <= 30 minute
Gallery

Session Bar/Candle ColoringChange the color of candles within a user-defined trading session. Borders and wicks can be changed as well, not just the body color.
PREFACE
This script can be used an educational resource for those who are interested in learning Pine Script. Therefore, the script is published open source and is organized in a manner that follows the recommended Style Guide .
While the main premise of the indicator is rather simple, the script showcases various things that can be achieved such as conditional plotting, alignment of indicator settings, user input validation, script optimization, and more. The script also has examples of taking into consideration the chart timeframe and/or different chart types (Heikin Ashi, Renko, etc.) that a user might be running it on. Note: for complete beginners, I strongly suggest going through the Pine Script User Manual (possibly more than once).
FEATURES
Besides being able to select a specific time window, the indicator also provides additional color settings for changing the background color or changing the colors of neutral/indecisive candles, as shown in the image below.
This allows for a higher level of customization beyond the TradingView chart settings or other similar scripts that are currently available.
HOW TO USE
First, define the intraday trading session that will contain the candles to modify. The session can be limited to specific days of the week.
Next, select the parts of the candles that should be modified: Body, Borders, Wick, and/or Background.
For each of the candle parts that were enabled, you can select the colors that will be used depending on whether a candle is bullish (⇧), bearish (⇩), or neutral (⇆).
All other indicator settings will have a detailed tooltip to describe its usage and/or effect.
LIMITATIONS
The indicator is not intended to function on Daily or higher timeframes due to the intraday nature of session time windows.
The indicator cannot always automatically detect the chart type being used, therefore the user is requested to manually input the chart type via the " Chart Style " setting.
Depending on the available historical data and the selected choice for the " Portion of bar in session " setting, the indicator may not be able to update very old candles on the chart.
EXAMPLE USAGE
This section will show examples of different scenarios that the indicator can be used for.
Emphasizing a main trading session.
Defining a "Pre/post market hours background" like is available for some symbols (e.g., NASDAQ:AAPL ).
Highlighting in which bar the midnight candle occurs.
Hiding indecision bars (neutral candles).
Showing only "Regular Trading Hours" for a chart that does not have the option to toggle ETH/RTH. To achieve this, the actual chart data is hidden, and only the indicator is visible; alternatively, a 2nd instance of the indicator could change colors to match the chart background.
Using a combination of Bars and Japanese Candlesticks. Alternatively, this could be done by hiding the main chart data and using 2 instances of the indicator (one with " Chart Style " setting as Bars , and the other set to Candles ).
Using a combination of thin and thick bars on Range charts. Note: requires disabling the "Thin Bars" setting for Bar charts in the TradingView chart settings.
NOTES
If using more than one instance of this indicator on the same chart, you can use the TradingView "Save Indicator Template" feature to avoid having to re-configure the multiple indicators at a later time.
This indicator is intended to work "out-of-the-box" thanks to the behind_chart option introduced to Pine Script in October 2024. But you can always manually bring the indicator to the front just in case the color changes are not being seen (using the "More" option in the indicator status line: More > Visual Order > Bring to front ).
Many thanks to fikira for their help and inspiring me to create open source scripts.
Any feedback including bug reports or suggestions for improving the indicator (or source code itself) are always welcome in the comments section.

Sessions with High/Low DiffThe main purpose of this indicator is to facilitate backtesting, but it may also be useful for traders to easily identify the current
active/open trading sessions on lower-timeframe charts.
This indicator also tracks the session high/low difference and plots it as a label on the last candle of the session once the last
bar of that session has finished printing and a new candle opened. The position and direction of the label is based on the
session open and close - if the session open is greater than the session close (which would equate to the equivalent of a red candle),
the label will be printed UNDER the last candle, and vice versa if the session close is above the session open.
The number printed inside the label is the difference between the session high and the session low, scaled to the minimum tick value of the chart.
Note #1: There is a Pinescript maximum of 500 labels allowed on any chart. While I could have gotten fancy and done some wizardry with label arrays,
I didn't really see a point to it. If labels are enabled for all 4 sessions at the same time, that would still have them available for the past 125
sessions, which would be about 6 months (approx 252 trading days per year, and this would cover 125 of them). If you limit to 2 sessions, you double
your potential look-back to almost a year (250 days out of the 252 average trading days each year), and for a single session, you double it yet again
to just under 2 years.
Note #2: As this indicator tracks open, high, low, and close for each session, it can potentially be enhanced (or forked) to construct "session candles".
I'm not sure what use this would be to anyone, but the pieces are there should someone find a use for it.
While it would be easy to add alerts on sessions opening/closing, I didn't see a purpose or value in that as it would be little more than a
glorified alarm clock. If I get enough demand to add them, I will gladly consider it.

Session extensions [dani]Session Extension
Indicator Description
The Session Extensions indicator is a customizable tool designed to visually represent key price levels during a specified trading session. It calculates and displays the high, low, and midpoints of the session, along with extension levels based on user-defined multipliers. These extensions help traders identify potential support and resistance zones beyond the initial session range.
This indicator is particularly useful for intraday traders who rely on session-based analysis to make informed decisions. It overlays directly on the chart, ensuring seamless integration with price action.
Key Features
Session-Based Analysis : Tracks and highlights key price levels (high, low, midpoint) during a specific trading session.
Customizable Extension Levels : Allows users to define up to six extension levels (both above and below the session range) with unique multipliers, colors, styles, and widths.
Real-Time Updates : Automatically updates during the active session and resets at the start of a new session.
Usage Guidelines
Add the Indicator to Your Chart : Apply the Session Extensions indicator to your chart to visualize key session-based levels.
Intraday Focus : This indicator is optimized for intraday trading. Ensure that the chart's timeframe is set to an intraday interval (e.g., 1-minute, 5-minute).
Session Alignment : Verify that the session time aligns with your trading schedule and timezone. Misalignment may result in incorrect session detection. (This indicator use America - New York timezone)
Avoid Overcrowding : While the indicator supports multiple extension levels, enabling too many levels simultaneously may clutter the chart. Use discretion when configuring extension levels.
Customize Line Styles and Colors : Tailor the appearance of lines and labels to align with your trading style. Use solid, dashed, or dotted lines, and choose colors that enhance visibility without cluttering the chart.
Combine with Other Tools : Pair this indicator with other technical analysis tools (e.g., moving averages, volume profiles) to enhance decision-making.
Disclaimer & Chat
The Session Extensions indicator is intended for educational and analytical purposes only. It does not provide financial advice or guarantee trading success. Users are responsible for verifying the accuracy of session times and ensuring proper configuration before using the indicator in live trading. This indicator is not a trading signal generator.
Thank you for choosing this indicator! I hope it becomes a valuable part of your trading toolkit. Remember, trading is a journey, and having the right tools can make all the difference. Whether you're a seasoned trader or just starting out, this indicator is designed to help you stay organized and focused on what matters most—price action. Happy trading, and may your charts be ever in your favor! 😊
From, Dani.

Session min/max pointsAn improved version for minimum and maximum in a day trading session. You can choose the session resolution, it ranges from 1 minute to 1 week.
It works well for stocks and non-extended sessions due to security() function limitations.
Any suggestions, please leave a comment.
Happy trading.

Session AnchorsDescription
This indicator highlights the four main global trading sessions — London, New York AM, New York PM, and Asia — as color-coded boxes on the chart. Each session is defined by fixed start/end times (New York time) and dynamically updates with the evolving high and low during that interval. This provides a clear view of how volatility and structure shift as trading activity passes from one region to another.
How to use
• Works on any timeframe.
• Toggle sessions on/off based on your trading hours.
• Observe price behavior as one session closes and another opens.
• Use session boxes as context for liquidity, volatility, and structure analysis.
Originality
This script delivers a clean, customizable visualization of global market hours and session ranges, avoiding extra overlays so traders can isolate session-based behavior without distraction.
⚠️ Disclaimer
This indicator does not generate signals. It provides a structural mapping of global sessions for contextual analysis only.

Sessioned EMA - Frozen EMA in post market hoursWhy I develop this indicator?
In future indices, post market data with little volume distort the moving average seriously. This indicator is to eliminate the distortion of data during low volume post market hours.
How to use?
There is a time session setting in the indicator, you can set the cash hour time, moving average outside the session will be frozen.
What this indicator gives you
This indicator give you a more make sense ema pattern, the ema lines are more respected by the prices when you set the session properly.
Setup
1. Session setting
In US indices, such as NQ, ES etc, when there was data release at 0830 hr, huge volume transaction order appears, that makes the 0830 price data important that should be included in your ema trend line calculating. If that is the case, I will set the session begin from 0830, otherwise, I start the session at 0930. Golden rule : Price with huge volume counts.
2. Time zone
The coding is decided for GMT+8 time zone, you may amend the code to fit your timezone.

Session Opening Range Breakout (ORBO)This strategy automates a classic Opening Range Breakout (ORBO) approach: it builds a price range for the first minutes after the market opens, then looks for strong breakouts above or below that range to catch early directional moves.
Concept
The idea behind ORBO is simple:
The first minutes after the session open are often highly informative.
Price forms an “opening range” that acts as a mini support/resistance zone.
A clean breakout beyond this zone can lead to high-momentum moves.
This script turns that logic into a fully backtestable strategy in TradingView.
How the strategy works
Opening Range Session
Default session: 09:30–09:50 (exchange time)
During this window, the script tracks:
orHigh → highest high within the session
orLow → lowest low within the session
This forms your Opening Range for the day.
Breakout Logic (after the window ends)
Once the defined session ends:
Long Entry:
If the close crosses above the Opening Range High (orHigh),
→ strategy.entry("OR Long", strategy.long) is triggered.
Short Entry:
If the close crosses below the Opening Range Low (orLow),
→ strategy.entry("OR Short", strategy.short) is triggered.
Only one opening range per day is considered, which keeps the logic clean and easy to interpret.
Daily Reset
At the start of a new trading day, the script resets:
orHigh := na
orLow := na
A fresh Opening Range is then built using the next session’s 09:30–09:50 candles.
This ensures entries are always based on today’s structure, not yesterday’s.
Visuals & Inputs
Inputs:
Opening range session → default: "0930-0950"
Show OR levels → toggle visibility of OR High / Low lines
Fill range body → optional shaded zone between OR High and OR Low
Chart visuals:
A green line marks the Opening Range High.
A red line marks the Opening Range Low.
Optional yellow fill highlights the entire OR zone.
Background shading during the session shows when the range is currently being built.
These visuals make it easy to see:
Where the OR sits relative to current price
How clean / noisy the breakout was
How often price respects or rejects the opening zone
Backtesting & Optimization
Because this is written as a strategy():
You can use TradingView’s Strategy Tester to view:
Win rate
Net profit
Drawdown
Profit factor
Equity curve
Ideas to experiment with:
Change the session window (e.g., 09:15–09:45, 10:00–10:30)
Apply to different:
Markets: indices, FX, crypto, stocks
Timeframes: 1m / 5m / 15m
Add your own:
Stop Loss & Take Profit levels
Time filters (only trade certain days / times)
Volatility filters (e.g., ATR, range size thresholds)
Higher-timeframe trend filter (e.g., only take longs above 200 EMA)

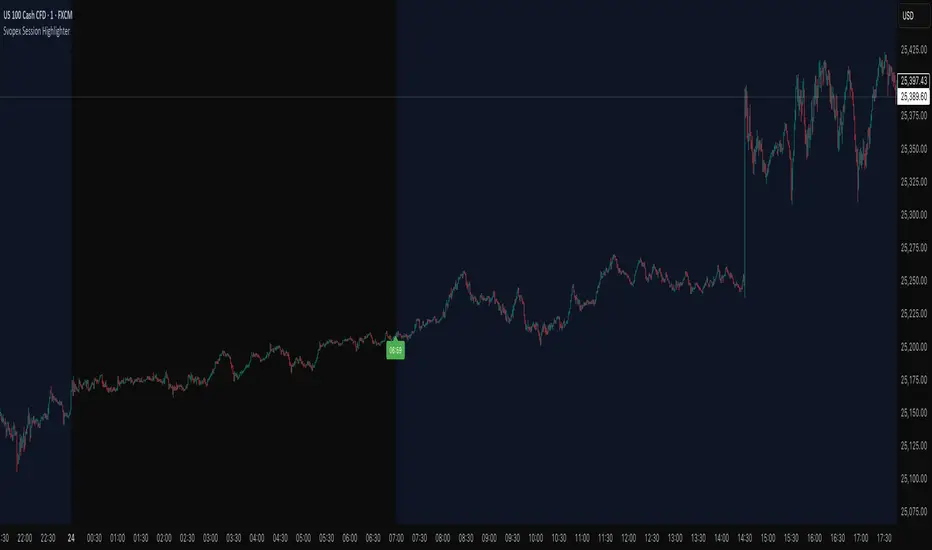
Svopex Session Highlighter# Session Highlighter
## Description
**Session Highlighter** is a powerful Pine Script indicator designed to visually identify and mark specific trading hours on your chart. This tool helps traders focus on their preferred trading sessions by highlighting the background during active hours and marking the session start with customizable visual markers.
## Key Features
- **📊 Session Background Highlighting**: Automatically shades the chart background during your defined trading hours (default: 7:00 - 23:00)
- **🎯 Smart Session Start Marker**: Places a marker on the last candle before session start, intelligently adapting to your timeframe:
- 1 Hour chart: Marker at 6:00
- 15 Minute chart: Marker at 6:45
- 5 Minute chart: Marker at 6:55
- 1 Minute chart: Marker at 6:59
- **🌍 Timezone Support**: Choose from multiple timezones (Europe/Prague, Europe/London, America/New_York, UTC)
- **🎨 5 Marker Styles**: Customize your session start indicator:
- Triangle
- Circle
- Diamond
- Label with time text
- Vertical line
- **⚙️ Fully Customizable**: Adjust start/end hours, timezone, and marker style through simple settings
## Settings
- **Start Hour**: Set your session start time (0-23)
- **End Hour**: Set your session end time (0-23)
- **Timezone**: Select your trading timezone
- **Marker Style**: Choose your preferred visual marker
## Use Cases
- Identify London/New York trading sessions
- Mark Asian session hours
- Highlight your personal trading windows
- Avoid trading during off-hours
- Perfect for day traders and scalpers
## Installation
1. Copy the Pine Script code
2. Open TradingView Pine Editor
3. Paste the code and click "Add to Chart"
4. Configure settings to match your trading schedule
Sessions[Lenny Kiruthu]The script below is designed to show up to 4 different trading sessions i.e. London, New York, Tokyo and Sydney sessions, it also displays the days each session is taking place in as well as two horizontal lines one for the previous days high and the other for the previous days low.
It also displays a table that shows the user the highest and lowest price for 4 different currency pairs the previous day as well as their current prices and below it a confirmation row that shows whether price is currently above, below or within yesterdays range. Note that it only states "High Broken" or "Low Broken" if the current close is above or below the lines.
What you can change
Your time zone for example GMT -4 or GMT +3
The session start and end time
The colors, border type and border width of the session ranges
Displaying the table
Ability to choose the 4 symbols to view on the table

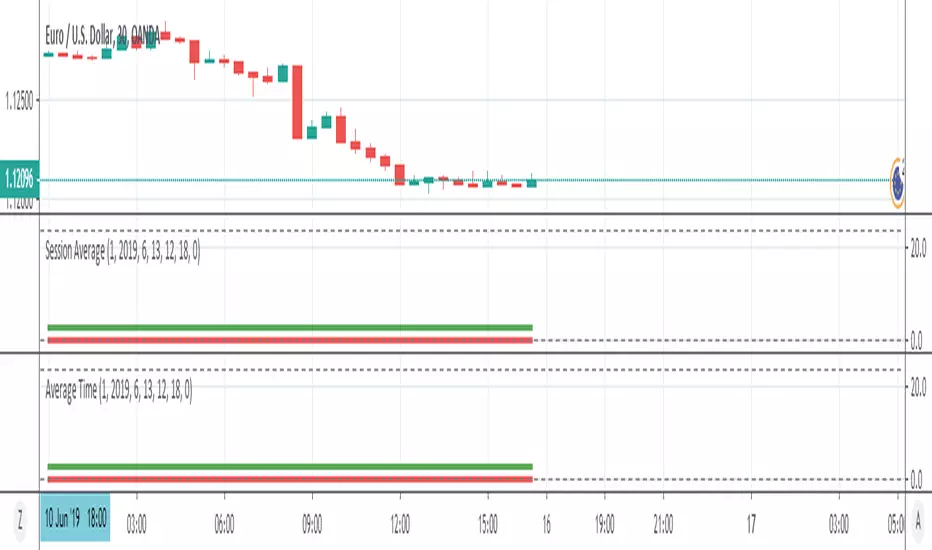
Session AverageThis indicator finds the average time of High or Low formed in sessions.
This is a request from trader @Salmanmahmood15 . You need permission from him to fully use it
Session Liquidity Trading PlanAmateurs trade on emotion. Professionals trade with a plan.
The Session Liquidity Trading Plan is a professional pre-trade checklist designed to help traders approach the market with structure, discipline, and consistency.
This tool acts as a decision-support panel, allowing you to manually confirm key liquidity-based conditions before executing a trade. Each confirmed condition contributes to a weighted trade score, giving you an instant view of setup quality.
Instead of chasing the market, this panel encourages patience and rule-based execution — two traits consistently found among profitable traders.
🔑 Key Features
• Clean top-right trading panel
• Manual confirmation checklist for maximum flexibility
• Weighted Trade Score (0–100) for setup grading
• Built for liquidity-based and session-focused traders
• Promotes disciplined, high-quality trade selection
• Works across all instruments and timeframes
📊 Checklist Includes:
✔ Asia High/Low Sweep
✔ 5/15 Minute Market Shift
✔ OTE Retracement
✔ Targeting Buy/Sell Side Liquidity
When all conditions align, traders gain confidence in the strength of their setup.

Session Liquidity Raid ModelSession Liquidity Raid Model
This indicator helps you understand what each market session is doing with liquidity — without guessing, predicting, or over-complicating things.
It tracks the Asia, London, and New York sessions and shows you:
Where each session’s highs and lows are
Whether those levels have been taken (raided) or are still untouched
When New York is likely cleaning up liquidity left by London
The basic idea (very simple)
If London moves price strongly without taking Asia’s opposite side, New York often comes back to raid London levels first before the real move happens.
This indicator makes that process visible at a glance.
What it shows on the chart
Asia High & Low
London High & Low
Whether each level is taken or not
A simple Bullish / Bearish / Neutral session bias
Clean horizontal lines for key session levels
No buy or sell signals.
No indicators stacked on top of each other.
Just context.
How to use it
Use it to avoid bad trades, not force trades
Wait for liquidity to be taken before looking for entries
Combine it with your own price action, structure, or FVGs
If you trade CME_MINI:NQ1! , this helps you stay aligned with what New York is actually doing, instead of reacting late.
Important note
This is not a trading strategy and it does not predict the future.
It simply shows which session still owes liquidity and which one has already been cleared.

Session Breaks by KrisWatersThis indicator draw vertical lines on session break dates. There are 1H, 4H, D, W, M, 3M, 12M options. You can change line colors and style as you wish.
If you are using this indicator please drop me comment and like also.

Session Breakout/Sweep with alertsThis indicator is based on popular London breakout strategy. but as I noticed that it don't work good with breakouts so I made it to be used as reversal entries as well. By default the timing is set for asian session but you can change it according to your need.
Use as breakout
Use as liquidity sweep
Note:
On some pairs the timing changes automatically (I don't know why), if you face this issue , go to settings and set the timing accordingly and save it as templet so that you don't have to change it every time you load the chart with timing issue.
I hope you guys find it useful. Do share your though and feedback in comments.

Session's First Bar RangeFirst Bar is crucial when there is gap up or gap down opening. It is recommended to use 15m Timeframe for better use.
Crossing this range signifies the absorption of existing buyers/sellers in the opening session and sometimes decide the trend onwards.

Sessions on ChartThis script shows the London and NY Sessions on your chart. Decided to publish it on demand for user yuan642 :D. Maybe other users may find it helpful.
Looking back on charts it can help to spot certain moves or patterns around certain Session open when high volumes enter the markets.
Session Liquidity Sweep + Trend ConfirmationThis strategy aims to capture high-probability intraday trades by combining liquidity sweeps with a trend confirmation filter. It is designed for traders who want a systematic approach to trade breakouts during specific market sessions while controlling risk with ATR-based stops.
How it Works:
Session Filter: Trades are only considered during a defined session (default 9:30 - 11:00). This helps avoid low-volume periods that can lead to false signals.
Trend Confirmation: The strategy uses a 50-period EMA to identify the market trend. Long trades are only taken in an uptrend, and short trades in a downtrend.
Liquidity Sweep Detection:
A long entry occurs when price dips below the prior N-bar low but closes back above it, indicating a potential liquidity sweep that stops being triggered before the trend continues upward.
A short entry occurs when price spikes above the prior N-bar high but closes below it, signaling a potential sweep of stops before the downward trend resumes.
ATR-Based Risk Management:
Stop loss is calculated using the Average True Range (ATR) multiplied by a configurable factor (default 1.5).
Take profit is set based on a risk-reward ratio (default 2.5x).
Position Sizing: Default position size is 5% of equity per trade, making it suitable for risk-conscious trading.
Inputs:
Session Start/End (HHMM)
Liquidity Lookback Period (number of bars to define prior high/low)
ATR Length for stop calculation
ATR Stop Multiplier
Risk-Reward Ratio
EMA Trend Filter Length
Visuals:
Prior Liquidity High (red)
Prior Liquidity Low (green)
EMA Trend (blue)
Why Use This Strategy:
Captures stop-hunt moves often triggered by larger market participants.
Only trades with trend confirmation, reducing false signals.
Provides automatic ATR-based stop loss and take profit for consistent risk management.
Easy to adjust session time, ATR, EMA length, and risk-reward to suit your trading style.
Important Notes:
Assumes 0.05% commission and 1-pip slippage. Adjust according to your broker.
Not financial advice; intended for educational, backtesting, or paper trading purposes.
Always test strategies thoroughly before applying to live accounts.

Session Lines + ATR AnalyticsDescription:
Overview:
A comprehensive trading tool that combines session visualization with real-time ATR analytics. Perfect for intraday traders who need precise timing and volatility measurements.
Features:
Session Markers
Visual indicators for Asia (00:00-08:00), London (07:00-15:00), and New York (13:00-21:00) trading sessions
Color-coded session bands at the bottom of the chart for quick identification
Fully customizable session times and colors
Hourly Vertical Lines
Automatic vertical lines drawn at the start of each hour (works on 1-minute charts)
Multiple line styles available: solid, dotted, dashed, arrows
Adjustable color and width settings
Helps identify exact timing of price movements
ATR Tool
Real-time candle range measurement
Modified ATR calculation (excludes current candle for accuracy)
Customizable ATR length and multiplier
Live countdown timer showing time remaining in current timeframe
Floating label with adjustable offset and styling
Date & Timeframe Display
Bottom-right watermark showing current date in LA timezone
Displays current timeframe with proper units (1m, 5m, 1H, etc.)
Useful for backtesting to confirm you're viewing the correct date
Best Used For:
Day trading and scalping (especially on 1-minute charts)
Session-based trading strategies
Volatility analysis using ATR
Time-based entry and exit planning
Settings:
All elements are fully customizable through the indicator settings panel, including colors, sizes, visibility toggles, and calculation parameters.

Sessions [New_ProfitEfex]This script is use for displaying session in a very attractive an clarity way
You can give it a try for free

Sessions Indicator [CodeDNL]A sessions indicator that doesn't cover the whole trading screen, and continues into the future.
Made to be easier on the eyes than existing solutions.
