UT Bot + Hull MA Confirmed Signal DelayOverview
This indicator is designed to detect high-probability reversal entry signals by combining "UT Bot Alerts" (UT Bot Alerts script adapted from QuantNomad - Originally developed by Yo_adriiiiaan and idea of original code for "UT Bot Alerts" from HPotter ) with confirmation from a Hull Moving Average (HMA) Developed by Alan Hull . It focuses on capturing momentum shifts that often precede trend reversals, helping traders identify potential entry points while filtering out false signals.
🔍 How It Works
This strategy operates in two stages:
1. UT Bot Momentum Trigger
The foundation of this script is the "UT Bot Alerts" , which uses an ATR-based trailing stop to detect momentum changes. Specifically:
The script calculates a dynamic stop level based on the Average True Range (ATR) multiplied by a user-defined sensitivity factor (Key Value).
When price closes above this trailing stop and the short-term EMA crosses above the stop, a potential buy setup is triggered.
Conversely, when price closes below the trailing stop and the short-term EMA crosses below, a potential sell setup is triggered.
These UT Bot alerts are designed to identify the initial shift in market direction, acting as the first filter in the signal process.
2. Hull MA Confirmation
To reduce noise and false triggers from the UT Bot alone, this script delays the entry signal until price confirms the move by crossing the Hull Moving Average (or its variants: HMA, THMA, EHMA) in the same direction as the UT Bot trigger:
A Buy Signal is generated only when:
A UT Bot Buy condition is active, and
The price closes above the Hull MA.
Or, if a UT Bot Buy condition was recently triggered but price hadn’t yet crossed above the Hull MA, a delayed buy is signaled when price finally breaks above it.
A Sell Signal is generated only when:
A UT Bot Sell condition is active, and
The price closes below the Hull MA.
Similarly, a delayed sell signal can occur if price breaks below the Hull MA shortly after a UT Bot Sell trigger.
This dual-confirmation process helps traders avoid premature entries and improves the reliability of reversal signals.
📈 Best Use Cases
Reversal Trading: This strategy is particularly well-suited for catching early trend reversals rather than trend continuations. It excels at identifying momentum pivots that occur after pullbacks or exhaustion moves.
Heikin Ashi Charts Recommended: The script offers a Heikin Ashi mode for smoothing out noise and enhancing visual clarity. Using Heikin Ashi candles can further reduce whipsaws and highlight cleaner shifts in trend direction.
MACD Alignment: For best results, trade in the direction of the MACD trend or use it as a filter to avoid counter-trend trades.
⚠️ Important Notes
Entry Signals Only: This indicator only plots entry points (Buy and Sell signals). It does not define exit strategies, so users should manage trades manually using trailing stops, profit targets, or other exit indicators.
No Signal = No Confirmation: You may see a UT Bot trigger without a corresponding Buy/Sell signal. This means the price did not confirm the move by crossing the Hull MA, and therefore the setup was considered too weak or incomplete.
⚙️ Customization
UT Bot Sensitivity: Adjust the “Key Value” and “ATR Period” to make the UT Bot more or less reactive to price action.
Use Heikin Ashi: Toggle between standard candles or Heikin Ashi in the indicator settings for a smoother trading experience.
The HMA length may also be modified in the indicator settings from its standard 55 length to increase or decrease the sensitivity of signal.
This strategy is best used by traders looking for a structured, logic-based way to enter early into reversals with added confirmation to reduce risk. By combining two independent systems—momentum detection (UT Bot) and trend confirmation (Hull MA)—it aims to provide high-confidence entries without overwhelming complexity.
Let the indicator guide your entries—you manage the exits.
Examples of use:
Futures:
Stock:
Crypto:
As shown in the snapshots this strategy, like most, works the best when price action has a sizeable ATR and works the least when price is choppy. Therefore it is always best to use this system when price is coming off known support or resistance levels and when it is seen to respect short term EMA's like the 9 or 15.
My personal preference to use this system is for day trading on a 3 or 5 minute chart. But it is valid for all timeframes and simply marks a high probability for a new trend to form.
Sources:
Quant Nomad - www.tradingview.com
Yo_adriiiiaan - www.tradingview.com
HPotter - www.tradingview.com
Hull Moving Average - alanhull.com
ابحث في النصوص البرمجية عن "signal"

Machine Learning | Adaptive Trend Signals [Bitwardex]⚙️🧠Machine Learning | Adaptive Trend Signals
🔷Overview
Machine Learning | Adaptive Trend Signals is a Pine Script™ v6 indicator designed to visualize market trends and generate signals through a combination of volatility clustering, Gaussian smoothing, and adaptive trend calculations. Built as an overlay indicator, it integrates advanced techniques inspired by machine learning concepts, such as K-Means clustering, to adapt to changing market conditions. The script is highly customizable, includes a backtesting module, and supports alert conditions, making it suitable for traders exploring trend-based strategies and developers studying volatility-driven indicator design.
🔷Functionality
The indicator performs the following core functions:
• Volatility Clustering: Uses K-Means clustering to categorize market volatility into high, medium, and low states, adjusting trend sensitivity accordingly.
• Trend Calculation: Computes adaptive trend lines (SmartTrend) based on volatility-adjusted standard deviation, smoothed RSI, and ADX filters.
• Signal Generation: Identifies potential buy and sell points through trend line crossovers and directional confirmation.
• Backtesting Module: Tracks trade outcomes based on the SmartTrend3 value, displaying win rate and total trades.
• Visualization: Plots trend lines with gradient colors and optional signal markers (bullish 🐮 and bearish 🐻).
• Alerts: Provides configurable alerts for trend shifts and volatility state changes.
🔷Technical Methodology
Volatility Clustering with K-Means
The indicator employs a K-Means clustering algorithm to classify market volatility, measured via the Average True Range (ATR), into three distinct clusters:
• Data Collection: Gathers ATR values over a user-defined training period (default: 100 bars).
• Centroid Initialization: Sets initial centroids at the highest, lowest, and midpoint ATR values within the training period.
• Iterative Clustering: Assigns ATR data points to the nearest centroid, recalculates centroid means, and repeats until convergence.
• Dynamic Adjustment: Assigns a volatility state (high, medium, or low) based on the closest centroid, adjusting the trend factor (e.g., tighter for high volatility, wider for low volatility).
This approach allows the indicator to adapt its sensitivity to varying market conditions, providing a data-driven foundation for trend calculations.
🔷Gaussian Smoothing
To enhance signal clarity and reduce noise, the indicator applies Gaussian kernel smoothing to:
• RSI: Smooths the Relative Strength Index (calculated from OHLC4) to filter short-term fluctuations.
• SmartTrend: Smooths the primary trend line for a more stable output.
The Gaussian kernel uses a sigma value derived from the user-defined smoothing length, ensuring mathematically consistent noise reduction.
🔷SmartTrend Calculation
The pineSmartTrend function is the core of the indicator, producing three trend lines:
• SmartTrend: The primary trend line, calculated using a volatility-adjusted standard deviation, smoothed RSI, and ADX conditions.
• SmartTrend2: A secondary trend line with a wider factor (base factor * 1.382) for signal confirmation.
SmartTrend3: The average of SmartTrend and SmartTrend2, used for plotting and backtesting.
Key components of the calculation include:
• Dynamic Standard Deviation: Scales based on ATR relative to its 50-period smoothed average, with multipliers (1.0 to 1.4) applied according to volatility thresholds.
• RSI and ADX Filters: Requires RSI > 50 for bullish trends or < 50 for bearish trends, alongside ADX > 15 and rising to confirm trend strength.
Volatility-Adjusted Bands: Constructs upper and lower bands around price action, adjusted by the volatility cluster’s dynamic factor.
🔷Signal Generation
The generate_signals function generates signals as follows:
• Buy Signal: Triggered when SmartTrend crosses above SmartTrend2 and the price is above SmartTrend, with directional confirmation.
• Sell Signal: Triggered when SmartTrend crosses below SmartTrend2 and the price is below SmartTrend, with directional confirmation.
Directional Logic: Tracks trend direction to filter out conflicting signals, ensuring alignment with the broader market context.
Signals are visualized as small circles with bullish (🐮) or bearish (🐻) emojis, with an option to toggle visibility.
🔷Backtesting
The get_backtest function evaluates signal outcomes using the SmartTrend3 value (rather than closing prices) to align with the trend-based methodology.
It tracks:
• Total Trades: Counts completed long and short trades.
• Win Rate: Calculates the percentage of trades where SmartTrend3 moves favorably (higher for longs, lower for shorts).
Position Management: Closes opposite positions before opening new ones, simulating a single-position trading system.
Results are displayed in a table at the top-right of the chart, showing win rate and total trades. Note that backtest results reflect the indicator’s internal logic and should not be interpreted as predictive of real-world performance.
🔷Visualization and Alerts
• Trend Lines: SmartTrend3 is plotted with gradient colors reflecting trend direction and volatility cluster, accompanied by a secondary line for visual clarity.
• Signal Markers: Optional buy/sell signals are plotted as small circles with customizable colors.
• Alerts: Supports alerts for:
• Bullish and bearish trend shifts (confirmed on bar close).
Transitions to high, medium, or low volatility states.
🔷Input Parameters
• ATR Length (default: 14): Period for ATR calculation, used in volatility clustering.
• Period (default: 21): Common period for RSI, ADX, and standard deviation calculations.
• Base SmartTrend Factor (default: 2.0): Base multiplier for volatility-adjusted bands.
• SmartTrend Smoothing Length (default: 10): Length for Gaussian smoothing of the trend line.
• Show Buy/Sell Signals? (default: true): Enables/disables signal markers.
• Bullish/Bearish Color: Customizable colors for trend lines and signals.
🔷Usage Instructions
• Apply to Chart: Add the indicator to any TradingView chart.
• Configure Inputs: Adjust parameters to align with your trading style or market conditions (e.g., shorter ATR length for faster markets).
• Interpret Output:
• Trend Lines: Use SmartTrend3’s direction and color to gauge market bias.
• Signals: Monitor bullish (🐮) and bearish (🐻) markers for potential entry/exit points.
• Backtest Table: Review win rate and total trades to understand the indicator’s behavior in historical data.
• Set Alerts: Configure alerts for trend shifts or volatility changes to support manual or automated trading workflows.
• Combine with Analysis: Use the indicator alongside other tools or market context, as it is designed to complement, not replace, comprehensive analysis.
🔷Technical Notes
• Data Requirements: Requires at least 100 bars for accurate volatility clustering. Ensure sufficient historical data is loaded.
• Market Suitability: The indicator is designed for trend detection and may perform differently in ranging or volatile markets due to its reliance on RSI and ADX filters.
• Backtesting Scope: The backtest module uses SmartTrend3 values, which may differ from price-based outcomes. Results are for informational purposes only.
• Computational Intensity: The K-Means clustering and Gaussian smoothing may increase processing time on lower timeframes or with large datasets.
🔷For Developers
The script is modular, well-commented, encouraging reuse and modification with proper attribution.
Key functions include:
• gaussianSmooth: Applies Gaussian kernel smoothing to any data series.
• pineSmartTrend: Computes adaptive trend lines with volatility and momentum filters.
• getDynamicFactor: Adjusts trend sensitivity based on volatility clusters.
• get_backtest: Evaluates signal performance using SmartTrend3.
Developers can extend these functions for custom indicators or strategies, leveraging the volatility clustering and smoothing methodologies. The K-Means implementation is particularly useful for adaptive volatility analysis.
🔷Limitations
• The indicator is not predictive and should be used as part of a broader trading strategy.
• Performance varies by market, timeframe, and parameter settings, requiring user experimentation.
• Backtest results are based on historical data and internal logic, not real-world trading conditions.
• Volatility clustering assumes sufficient historical data; incomplete data may affect accuracy.
🔷Acknowledgments
Developed by Bitwardex, inspired by machine learning concepts and adaptive trading methodologies. Community feedback is welcome via TradingView’s platform.
🔷 Risk Disclaimer
Trading involves significant risks, and most traders may incur losses. Bitwardex AI Algo is provided for informational and educational purposes only and does not constitute financial advice or a recommendation to buy or sell any financial instrument . The signals, metrics, and features are tools for analysis and do not guarantee profits or specific outcomes. Past performance is not indicative of future results. Always conduct your own due diligence and consult a financial advisor before making trading decisions.

Easy MA SignalsEasy MA Signals
Overview
Easy MA Signals is a versatile Pine Script indicator designed to help traders visualize moving average (MA) trends, generate buy/sell signals based on crossovers or custom price levels, and enhance chart analysis with volume-based candlestick coloring. Built with flexibility in mind, it supports multiple MA types, crossover options, and customizable signal appearances, making it suitable for traders of all levels. Whether you're a day trader, swing trader, or long-term investor, this indicator provides actionable insights while keeping your charts clean and intuitive.
Configure the Settings
The indicator is divided into three input groups for ease of use:
General Settings:
Candlestick Color Scheme: Choose from 10 volume-based color schemes (e.g., Sapphire Pulse, Emerald Spark) to highlight high/low volume candles. Select “None” for TradingView’s default colors.
Moving Average Length: Set the MA period (default: 20). Adjust for faster (lower values) or slower (higher values) signals.
Moving Average Type: Choose between SMA, EMA, or WMA (default: EMA).
Show Buy/Sell Signals: Enable/disable signal plotting (default: enabled).
Moving Average Crossover: Select a crossover type (e.g., MA vs VWAP, MA vs SMA50) for signals or “None” to disable.
Volume Influence: Adjust how volume impacts candlestick colors (default: 1.2). Higher values make thresholds stricter.
Signal Appearance Settings:
Buy/Sell Signal Shape: Choose shapes like triangles, arrows, or labels for signals.
Buy/Sell Signal Position: Place signals above or below bars.
Buy/Sell Signal Color: Customize colors for better visibility (default: green for buy, red for sell).
Custom Price Alerts:
Custom Buy/Sell Alert Price: Set specific price levels for alerts (default: 0, disabled). Enter a non-zero value to enable.
Set Up Alerts
To receive notifications (e.g., sound, popup, email) when signals or custom price levels are hit:
Click the Alert button (alarm clock icon) in TradingView.
Select Easy MA Signals as the condition and choose one of the four alert types:
MA Crossover Buy Alert: Triggers on MA crossover buy signals.
MA Crossover Sell Alert: Triggers on MA crossover sell signals.
Custom Buy Alert: Triggers when price crosses above the custom buy price.
Custom Sell Alert: Triggers when price crosses below the custom sell price.
Enable Play Sound and select a sound (e.g., “Bell”).
Set the frequency (e.g., Once Per Bar Close for confirmed signals) and create the alert.
Analyze the Chart
Moving Average Line: Displays the selected MA with color changes (green for bullish, red for bearish, gray for neutral) based on price position relative to the MA.
Buy/Sell Signals: Appear as shapes or labels when crossovers or custom price levels are hit.
Candlestick Colors: If a color scheme is selected, candles change color based on volume strength (high, low, or neutral), aiding in trend confirmation.
Why Use Easy MA Signals?
Easy MA Signals is designed to simplify technical analysis while offering advanced customization. It’s ideal for traders who want:
A clear visualization of MA trends and crossovers.
Flexible signal generation based on MA crossovers or custom price levels.
Volume-enhanced candlestick coloring to identify market strength.
Easy-to-use settings with tooltips for beginners and pros alike.
This script is particularly valuable because it combines multiple features into one indicator, reducing chart clutter and providing actionable insights without overwhelming the user.
Benefits of Easy MA Signals
Highly Customizable: Supports SMA, EMA, and WMA with adjustable lengths.
Offers multiple crossover options (VWAP, SMA10, SMA20, etc.) for tailored strategies.
Custom price alerts allow precise targeting of key levels.
Volume-Based Candlestick Coloring: 10 unique color schemes highlight volume strength, helping traders confirm trends.
Adjustable volume influence ensures adaptability to different markets.
Flexible Signal Visualization: Choose from various signal shapes (triangles, arrows, labels) and positions (above/below bars).
Customizable colors improve visibility on any chart background.
Alert Integration: Built-in alert conditions for crossovers and custom prices support sound, email, and app notifications.
Easy setup for real-time trading decisions.
User-Friendly Design: Organized input groups with clear tooltips make configuration intuitive.
Suitable for beginners and advanced traders alike.
Example Use Cases
Swing Trading with MA Crossovers:
Scenario: A trader wants to trade Bitcoin (BTC/USD) on a 4-hour chart using an EMA crossover strategy.
Setup:
Set Moving Average Type to EMA, Length to 20.
Set Moving Average Crossover to “MA vs SMA50”.
Enable Show Buy/Sell Signals and choose “arrowup” for buy, “arrowdown” for sell.
Select “Emerald Spark” for candlestick colors to highlight volume surges.
Usage: Buy when the EMA20 crosses above the SMA50 (green arrow appears) and volume is high (dark green candles). Sell when the EMA20 crosses below the SMA50 (red arrow). Set alerts for real-time notifications.
Scalping with Custom Price Alerts:
Scenario: A day trader monitors Tesla (TSLA) on a 5-minute chart and wants alerts at specific support/resistance levels.
Setup:
Set Custom Buy Alert Price to 150.00 (support) and Custom Sell Alert Price to 160.00 (resistance).
Use “labelup” for buy signals and “labeldown” for sell signals.
Keep Moving Average Crossover as “None” to focus on price alerts.
Usage: Receive a sound alert and label when TSLA crosses 150.00 (buy) or 160.00 (sell). Use volume-colored candles to confirm momentum before entering trades.
When NOT to Use Easy MA Signals
High-Frequency Trading: Reason: The indicator relies on moving averages and volume, which may lag in ultra-fast markets (e.g., sub-second trades). High-frequency traders may need specialized tools with real-time tick data.
Alternative: Use order book or market depth indicators for faster execution.
Low-Volatility or Sideways Markets:
Reason: MA crossovers and custom price alerts can generate false signals in choppy, range-bound markets, leading to whipsaws.
Alternative: Use oscillators like RSI or Bollinger Bands to trade within ranges.
This indicator is tailored more towards less experienced traders. And as always, paper trade until you are comfortable with how this works if you're unfamiliar with trading! We hope you enjoy this and have great success. Thanks for your interested in Easy MA Signals!

Falcon SignalsThis script is a TradingView Pine Script for a trading strategy called "Falcon Signals." It combines multiple technical indicators and strategies to generate buy and sell signals. Here’s a breakdown of what the script does:
1. Supertrend Indicator:
The script calculates the Supertrend indicator using the Average True Range (ATR) and a specified multiplier (factor). The Supertrend is used to define the trend direction, with a green line for an uptrend and a red line for a downtrend.
2. EMA (Exponential Moving Average):
Two EMAs are used: a fast EMA (9-period) and a slow EMA (21-period). The script checks for crossovers of the fast EMA above or below the slow EMA as a basis for buying and selling signals.
3. RSI (Relative Strength Index):
The RSI (14-period) is used to measure the momentum of the price. A buy signal is generated when the RSI is less than 70, while a sell signal is generated when it’s greater than 30.
4. Take Profit (TP) and Stop Loss (SL):
The script allows users to set custom percentages for take profit and stop loss. The take profit is set at a certain percentage above the entry price for buy signals, and the stop loss is set at a percentage below the entry price, and vice versa for sell signals.
5. Trailing Stop:
A trailing stop can be enabled, which dynamically adjusts the stop loss level as the price moves in the favorable direction. If the price moves against the position by a certain trailing percentage, the position will be closed.
6. Engulfing Patterns:
The script checks for bullish and bearish engulfing candlestick patterns, indicating potential reversals. A bullish engulfing pattern is marked with a teal label ("🔄 Reversal Up"), and a bearish engulfing pattern is marked with a fuchsia label ("🔄 Reversal Down").
7. Plotting:
The script plots various indicators and signals:
Entry line: Shows where the buy or sell signal is triggered.
Take profit and stop loss levels are plotted as lines.
EMA and Supertrend lines are plotted on the chart.
Trailing stop line, if enabled, is also plotted.
8. Buy and Sell Labels:
The script places labels on the chart when buy or sell signals are triggered, indicating the price at which the order should be placed.
9. Exit Line:
The script plots an exit line when the trailing stop is hit, signaling when a position should be closed.
10. Alerts:
Alerts are set for both buy and sell signals, notifying the trader when to act based on the strategy's conditions.
This strategy combines trend-following (Supertrend), momentum (RSI), and price action patterns (EMA crossovers and engulfing candlestick patterns) to generate trade signals. It also offers the flexibility of take profit, stop loss, and trailing stop features.

Neural Pulse System [Alpha Extract]Neural Pulse System (NPS)
The Neural Pulse System (NPS) is a custom technical indicator that analyzes price action through a probabilistic lens, offering a dynamic view of bullish and bearish tendencies.
Unlike traditional binary classification models, NPS employs Ordinary Least Squares (OLS) regression with dynamically computed coefficients to produce a smooth probability output ranging from -1 to 1.
Paired with ATR-based bands, this indicator provides an intuitive and volatility-aware approach to trend analysis.
🔶 CALCULATION
The Neural Pulse System utilizes OLS regression to compute probabilities of bullish or bearish price action while incorporating ATR-based bands for volatility context:
Dynamic Coefficients: Coefficients are recalculated in real-time and scaled up to ensure the regression adapts to evolving market conditions.
Ordinary Least Squares (OLS): Uses OLS regression instead of gradient descent for more precise and efficient coefficient estimation.
ATR Bands: Smoothed Average True Range (ATR) bands serve as dynamic boundaries, framing the regression within market volatility.
Probability Output: Instead of a binary result, the output is a continuous probability curve (-1 to 1), helping traders gauge the strength of bullish or bearish momentum.
Formula:
OLS Regression = Line of best fit minimizing squared errors
Probability Signal = Transformed regression output scaled to -1 (bearish) to 1 (bullish)
ATR Bands = Smoothed Average True Range (ATR) to frame price movements within market volatility
🔶 DETAILS
📊 Visual Features:
Probability Curve: Smooth probability signal ranging from -1 (bearish) to 1 (bullish)
ATR Bands: Price action is constrained within volatility bands, preventing extreme deviations
Color-Coded Signals:
Blue to Green: Increasing probability of bullish momentum
Orange to Red: Increasing probability of bearish momentum
Interpretation:
Bullish Bias: Probability output consistently above 0 suggests a bullish trend.
Bearish Bias: Probability output consistently below 0 indicates bearish pressure.
Reversals: Extreme values near -1 or 1, followed by a move toward 0, may signal potential trend reversals.
🔶 EXAMPLES
📌 Trend Identification: Use the probability output to gauge trend direction.
📌Example: On a 1-hour chart, NPS moves from -0.5 to 0.8 as price breaks resistance, signaling a bullish trend.
Reversal Signals: Watch for probability extremes near -1 or 1 followed by a reversal toward 0.
Example: NPS hits 0.9, price touches the upper ATR band, then both retreat—indicating a potential pullback.
📌 Example snapshots:
Volatility Context: ATR bands help assess whether price action aligns with typical market conditions.
Example: During low volatility, the probability signal hovers near 0, and ATR bands tighten, suggesting a potential breakout.
🔶 SETTINGS
Customization Options:
ATR Period – Defines lookback length for ATR calculation (shorter = more responsive, longer = smoother).
ATR Multiplier – Adjusts band width for better volatility capture.
Regression Length – Controls how many bars feed into the coefficient calculation (longer = smoother, shorter = more reactive).
Scaling Factor – Adjusts the strength of regression coefficients.
Output Smoothing – Option to apply a moving average for a cleaner probability curve

RSI with Bollinger Bands and Buy/Sell SignalsPurpose:
This indicator combines the Relative Strength Index (RSI) with Bollinger Bands to identify overbought and oversold conditions in the market. It also generates buy and sell signals based on the interaction between the RSI and the Bollinger Bands. It is particularly useful for traders looking for opportunities in volatile or trending markets.
How It Works:
RSI (Relative Strength Index):
The RSI measures the magnitude of recent price changes to evaluate whether an asset is overbought (values > 70) or oversold (values < 30).
In this indicator, horizontal lines at levels 70 (overbought) and 30 (oversold) are used as reference points.
Bollinger Bands:
Bollinger Bands are calculated around a smoothed moving average of the RSI. The upper band represents dynamic overbought levels, while the lower band indicates dynamic oversold levels.
These bands automatically adjust their width based on the volatility of the RSI, allowing them to adapt to different market conditions.
Buy and Sell Signals:
Buy Signal: A buy signal is generated when the RSI exceeds both the upper Bollinger Band and the overbought level (70). This suggests that the asset is in an extreme bullish phase.
Sell Signal: A sell signal is generated when the RSI falls below both the lower Bollinger Band and the oversold level (30). This suggests that the asset is in an extreme bearish phase.
Alerts:
The indicator includes automatic alerts to notify you when buy or sell signals are generated. This allows traders to act quickly on new opportunities.
Best Practices:
Confirmation in Lower Timeframes:
Although this indicator is powerful, it is recommended to confirm signals in lower timeframes before making trading decisions. For example:
If you receive a buy signal on a 4-hour chart, check if the RSI and Bollinger Bands on lower timeframes (such as 1 hour or 15 minutes) also show bullish signals.
This reduces the risk of false positives and increases the accuracy of your entries.
Use in Trends:
This indicator works best in markets with clear trends. In sideways or low-volatility markets, signals may be less reliable due to the lack of directional momentum.
Risk Management:
Always use stop-loss and take-profit to protect your positions. Buy and sell signals are just one tool for analysis; they do not guarantee results.
Combination with Other Indicators:
To improve accuracy, consider combining this indicator with others, such as MACD, Stochastic Oscillator, or Japanese candlestick patterns. This can provide additional confirmation before opening a position.
Summary:
The RSI + Bollinger Bands with Buy/Sell Signals indicator is an advanced tool designed to identify entry and exit points in the market based on extreme overbought and oversold conditions. However, to maximize its effectiveness, it is crucial to confirm signals in lower timeframes and use it in combination with other technical analysis tools. With proper risk management and careful interpretation of signals, this indicator can be a valuable ally in your trading strategy.

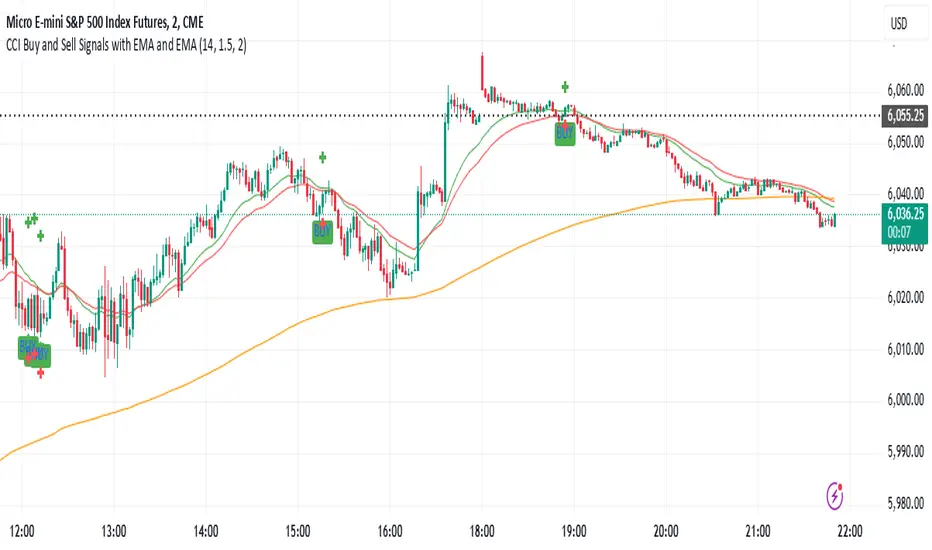
CCI Buy and Sell Signals with 20/30 EMACCI Buy and Sell Signals with EMA and ATR Stop Loss/Take Profit
This indicator is designed to identify buy and sell signals based on a combination of the Commodity Channel Index (CCI) and Exponential Moving Averages (EMA). It also includes an optional ATR-based stop loss and take profit system, which is useful for traders who want to manage their trades with dynamic risk levels.
Features:
CCI Buy and Sell Signals:
Buy Signal: A buy signal is triggered when the CCI crosses up through -100 (from an oversold condition), the 20-period EMA is above the 30-period EMA, and the price is above the 200-period EMA. This suggests that the market is entering an upward trend.
Sell Signal: A sell signal is triggered when the CCI crosses down through +100 (from an overbought condition), the 20-period EMA is below the 30-period EMA, and the price is below the 200-period EMA. This suggests that the market is entering a downward trend.
Exponential Moving Averages (EMA):
The script plots three EMAs:
20-period EMA (Green): Used to identify short-term trends.
30-period EMA (Red): Used to capture medium-term trends.
200-period EMA (Orange): A long-term trend filter, with the price above it generally indicating bullish conditions and below it indicating bearish conditions.
ATR-Based Stop Loss and Take Profit:
Optional Feature: The ATR (Average True Range) indicator can be used to set stop loss and take profit levels based on market volatility.
Stop Loss: Set at a multiple of the ATR below the entry price for long positions and above the entry price for short positions.
Take Profit: Set at a multiple of the ATR above the entry price for long positions and below the entry price for short positions.
Customizable: You can adjust the ATR length, Stop Loss Multiplier, and Take Profit Multiplier through the settings.
Dots: The stop loss and take profit levels are plotted as dots on the chart when the ATR feature is enabled.
Alert Conditions:
Buy Signal Alert: Triggered when a buy signal occurs based on CCI crossing up -100 and other conditions being met.
Sell Signal Alert: Triggered when a sell signal occurs based on CCI crossing down +100 and other conditions being met.
Any Signal Alert: This is a combined alert that triggers for either a buy or sell signal. It helps you stay updated on both types of signals simultaneously.
How to Use:
The indicator will plot buy and sell arrows on the chart, giving clear entry points for trades based on CCI and EMA conditions.
The ATR stop loss and take profit dots (when enabled) provide automatic risk management levels, adjusting dynamically with market volatility.
Traders can customize the ATR settings to fine-tune their stop loss and take profit levels, making this strategy adaptable to different trading styles and market conditions.
Triple Trend Indicator [BigBeluga]Triple Trend Indicator is a versatile trend-following tool designed to help traders identify trend strength and potential pullback levels using a three-band system. Each band represents a varying degree of price deviation from the mean, providing progressively stronger trend signals.
🔵 Key Features:
Three Adaptive Bands:
The indicator dynamically calculates three bands (1, 2, and 3) based on moving averages (SMA, EMA, WMA) and ATR multipliers.
Bands are positioned below the price in an uptrend and above the price in a downtrend, offering clear trend direction visualization.
Signal System:
Signals are generated when price interacts with the bands:
Signal 1: Triggered when the price touches Band 1, indicating a minor pullback within the trend.
Signal 2: Triggered at Band 2, showing a stronger price deviation and trend confirmation.
Signal 3: Triggered at Band 3, representing the most significant price deviation and strongest trend signal.
The further the price deviates from the mean, the stronger the trend signal, with Signal 3 being the most robust.
Color-Coded Bands:
Bands dynamically change color based on the trend direction:
Green bands signify an uptrend.
Brown bands signify a downtrend.
Dynamic Trend Line Changes:
Dashed lines highlight trend changes, helping traders visualize key turning points in the market.
🔵 Usage:
Use the bands to identify trend direction and strength.
Monitor the signal system to assess the level of price deviation and potential pullback strength.
Combine Signal 1, 2, and 3 to confirm trend momentum:
Signal 1 suggests a weaker pullback and continuation.
Signal 2 indicates a stronger trend confirmation.
Signal 3 highlights the strongest momentum and potential exhaustion points.
Utilize the color-coded bands for an intuitive understanding of current market conditions.
The Triple Trend Indicator is an ideal tool for trend traders looking for structured signals and dynamic support and resistance levels to optimize entries and exits.

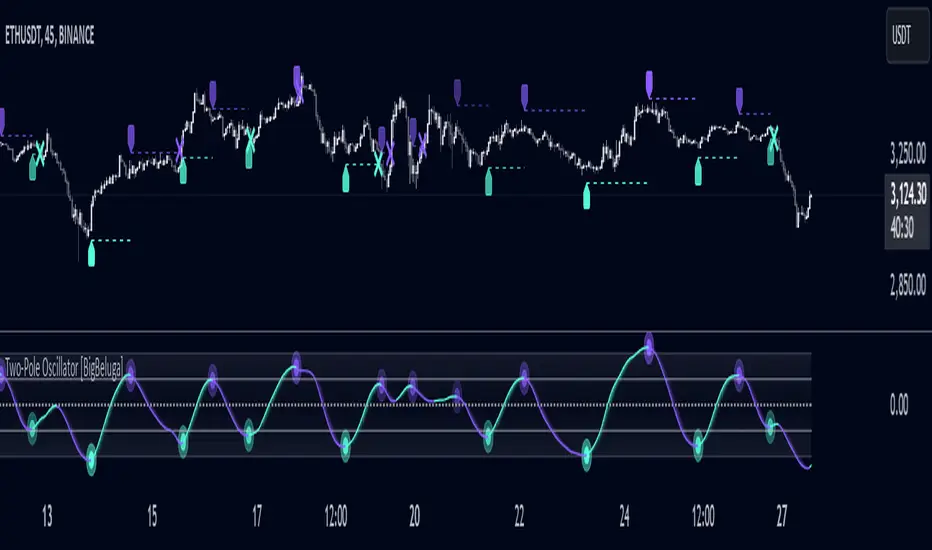
Two-Pole Oscillator [BigBeluga]
The Two-Pole Oscillator is an advanced smoothing oscillator designed to provide traders with precise market signals by leveraging deviation-based calculations combined with a unique two-pole filtering technique. It offers clear visual representation and actionable signals for smart trading decisions.
🔵Key Features:
Two-Pole Filtering: Smooths out the main oscillator signal to reduce noise, providing a cleaner and more reliable view of market momentum and trend strength.
// Two-pole smooth filter function
f_two_pole_filter(source, length) =>
var float smooth1 = na
var float smooth2 = na
alpha = 2.0 / (length + 1)
if na(smooth1)
smooth1 := source
else
smooth1 := (1 - alpha) * smooth1 + alpha * source
if na(smooth2)
smooth2 := smooth1
else
smooth2 := (1 - alpha) * smooth2 + alpha * smooth1
Deviation-Based Oscillator: Utilizes price deviations from the mean to generate dynamic signals, making it ideal for detecting overbought and oversold conditions.
float sma1 = ta.sma(close, 25)
float sma_n1 = ((close - sma1) - ta.sma(close - sma1, 25)) / ta.stdev(close - sma1, 25)
Signal Gradient Strength: Signals on the main oscillator line feature gradient coloring based on their proximity to the 0 level:
➔ Closer to 0: More transparent, indicating weaker signals.
➔ Closer to 1 or -1: Less transparent, highlighting stronger signals.
Level-Based Signal Validation: Parallel levels are plotted on the chart for each signal:
➔ If a level is crossed by price, the signal is invalidated, marked by an "X" at the invalidation point.
Trend Continuation
Invalidation Levels: Serve as potential stop-loss or trade-reversal zones, enabling traders to make more informed and disciplined trading decisions.
Dynamic Chart Plotting: Signals are plotted directly on the chart with corresponding levels, providing a comprehensive visual representation for easy interpretation.
🔵How It Works:
The oscillator calculates price deviation from a mean value and applies two-pole filtering to smooth the resulting signal.
Gradient-colored signals reflect their strength, with transparency indicating proximity to the 0 level on the oscillator scale.
Buy and sell signals are generated based on crossovers and crossunders of the oscillator line with a signal line.
If a level is crossed, the corresponding signal is marked with a "X" plotted on the chart at the crossover point.
🔵Use Cases:
Detecting overbought or oversold market conditions with a smoother, noise-free oscillator.
Using invalidation levels to set clear stop-loss or trade exit points.
Identifying strong momentum signals and filtering out weaker, less reliable ones.
Combining oscillator signals with price action for more precise trade entries and exits.
This indicator is perfect for traders seeking a refined approach to oscillator analysis, combining signal strength visualization with actionable invalidation levels to enhance trading precision and strategy.
TVMC - Composite Indicator with Technical RatingsDescription:
The TVMC (Trend, Volume, Momentum, Composite) indicator is a powerful multi-component tool designed to provide traders with a comprehensive understanding of market conditions. By combining four essential technical analysis components—trend, momentum, volume, and volatility—this indicator offers clear and actionable insights to assist in decision-making.
Key Features:
1. Trend Component (TC):
* Based on MACD (Moving Average Convergence Divergence), this component analyzes the relationship between two exponential moving averages (fast and slow) to determine the prevailing market trend.
* The MACD signal is normalized to a range of -1 to +1 for consistency and clarity.
2. Momentum Component (MC):
* Utilizes RSI (Relative Strength Index) to measure the strength and speed of price movements.
* This component highlights overbought or oversold conditions, which may indicate potential market reversals.
3. Volume Confirmation (VC):
* Compares the current trading volume to its moving average over a specified period.
* High volume relative to the average confirms the validity of the current trend.
4. Volatility Filter (VF):
* Uses ATR (Average True Range) to gauge market volatility.
* Adjusts and smooths signals to reduce noise during periods of high volatility.
5. Technical Ratings Integration:
* Incorporates TradingView’s Technical Ratings, allowing users to validate signals using moving averages, oscillators, or a combination of both.
* Users can choose their preferred source of ratings for enhanced signal confirmation.
How It Works:
The TVMC indicator combines the weighted contributions of the Trend, Momentum, and Volume components, further refined by the Volatility Filter. Each component plays a specific role:
* Trend: Identifies whether the market is bullish, bearish, or neutral.
* Momentum: Highlights the strength of price action.
* Volume: Confirms whether the current price action is supported by sufficient trading activity.
* Volatility: Filters out excessive noise in volatile market conditions, providing a smoother and more reliable output.
Visualization:
1. Bullish Signals:
* The indicator line turns green and remains above the zero line, indicating upward momentum.
2. Bearish Signals:
* The indicator line turns red and falls below the zero line, signaling downward momentum.
3. Neutral Signals:
* The line is orange and stays near zero, indicating a lack of strong trend or momentum.
4. Zones:
* Horizontal lines at +30 and -30 mark strong bullish and bearish zones, respectively.
* A zero line is included for clear separation between bullish and bearish signals.
Recommended Usage:
* Best Timeframes: The indicator is optimized for higher timeframes such as 4-hour (H4) and daily (D1) charts.
* Trading Style: Suitable for swing and positional trading.
* Customization: The indicator allows users to adjust all major parameters (e.g., MACD, RSI, volume, and ATR settings) to fit their trading preferences.
Customization Options:
* Adjustable weights for Trend, Momentum, and Volume components.
* Fully configurable settings for MACD, RSI, Volume SMA, and ATR periods.
* Timeframe selection for multi-timeframe analysis.
Important Notes:
1. Originality: The TVMC indicator combines multiple analysis methods into a unique framework. It does not replicate or minimally modify existing indicators.
2. Transparency: The description is detailed enough for users to understand the methodology without requiring access to the code.
3. Clarity: The indicator is explained in a way that is accessible even to users unfamiliar with complex technical analysis tools.
Compliance with TradingView Rules:
* The indicator is written in Pine Script version 5, adhering to TradingView’s language standards.
* The description is written in English to ensure accessibility to the global community, with a clear explanation of all components and functionality.
* No promotional content, links, or unrelated references are included.
* The chart accompanying the indicator is clean and demonstrates its intended use clearly, with no additional indicators unless explicitly explained.

Trend with ADX/EMA - Buy & Sell SignalsThis script is designed to help traders make buy and sell decisions based on trend analysis using two key methods: ADX (Average Directional Index) and EMA (Exponential Moving Averages). Here's a breakdown in simple terms:
What Does It Do?
Identifies the Trend's Strength and Direction:
Uses the ADX indicator to determine how strong the trend is.
Compares two lines (DI+ and DI−) to identify whether the trend is moving up or down.
Generates Buy and Sell Signals:
Uses two EMAs (a fast one and a slow one) to check when the price crosses key levels, signaling a possible buy or sell opportunity.
Plots visual indicators (arrows and labels) for easy interpretation.
Color-Codes the Chart:
Highlights the background in green when the trend is bullish (uptrend).
Highlights the background in red when the trend is bearish (downtrend).
Alerts the User:
Creates alerts when specific conditions for buying or selling are met.
Key Components:
1. ADX (Trend Strength & Direction)
What is ADX?
ADX measures how strong the trend is (not the direction). Higher ADX means a stronger trend.
It also calculates two lines:
DI+: Measures upward movement strength.
DI−: Measures downward movement strength.
How It Works in the Script:
If DI+ is greater than DI−, it’s a bullish trend (upward).
If DI− is greater than DI+, it’s a bearish trend (downward).
The background turns green for an uptrend and red for a downtrend.
2. EMA (Buy and Sell Decisions)
What is EMA?
EMA is a moving average that gives more weight to recent prices. It’s used to smooth out price fluctuations.
How It Works in the Script:
The script calculates two EMAs:
Fast EMA (short-term average): Reacts quickly to price changes.
Slow EMA (long-term average): Reacts slower and shows overall trends.
When the Fast EMA crosses above the Slow EMA, it’s a signal to Buy.
When the Fast EMA crosses below the Slow EMA, it’s a signal to Sell.
These signals are marked on the chart as "Buy" and "Sell" labels.
3. Buy and Sell Alerts
The script sets up alerts for the user:
Buy Alert: When a crossover indicates a bullish signal.
Sell Alert: When a crossunder indicates a bearish signal.
Visual Elements on the Chart:
Background Colors:
Green: When the DI+ line indicates an uptrend.
Red: When the DI− line indicates a downtrend.
EMA Lines:
Green Line: Fast EMA.
Red Line: Slow EMA.
Buy/Sell Labels:
"Buy" label: Shown when the Fast EMA crosses above the Slow EMA.
"Sell" label: Shown when the Fast EMA crosses below the Slow EMA.
Why Use This Script?
Trend Analysis: Helps you quickly identify the strength and direction of the market trend.
Buy/Sell Signals: Gives clear signals to enter or exit trades based on trend and EMA crossovers.
Custom Alerts: Ensures you never miss a trading opportunity by notifying you when conditions are met.
Visual Simplicity: Makes it easy to interpret trading signals with color-coded backgrounds and labeled arrows.

[blackcat] L3 Bullish Grab SignalOVERVIEW
The " L3 Bullish Grab Signal" indicator is designed to identify bullish trends and potential buying opportunities in the market. It uses a combination of moving averages and custom calculations to generate signals. The indicator is set to not overlay on the price chart, meaning it will have its own panel below the main chart, and it updates based on the specified timeframe.
FEATURES
Input Parameters:
shortEmaPeriod: Default value is 13, used for the shorter-term EMA.
longEmaPeriod: Default value is 34, used for the longer-term EMA.
signalEmaPeriod: Default value is 5, used to smooth the difference between the short and long EMAs.
lookbackPeriod: Default value is 60, used to look back over a certain number of bars for specific calculations.
Variable Calculations:
priceWeightedAverage: Calculated as (close * 2 + high + low) / 4 * 10, a custom price point.
shortEma: EMA of priceWeightedAverage over the short period.
longEma: EMA of priceWeightedAverage over the long period.
signalEma: EMA of the difference between shortEma and longEma, smoothed over the signalEmaPeriod.
oscillatorValue: Calculated as 2 * (shortEma - longEma - signalEma) * 5.5, a custom oscillator.
positiveOscillatorValue: Positive part of oscillatorValue, setting negative values to zero.
bullishSignal: True when positiveOscillatorValue increases and was previously negative.
confirmedBullishSignal: True when the bullish signal is confirmed by certain conditions involving the oscillator values and price increases.
priceIncreaseThreshold: Checks if the close price increased by more than 7% from the previous bar.
strongBullishSignal: Combines the bullish signal with the confirmed signal and the price increase threshold.
confirmedStrongBullishSignal: When all conditions for a strong bullish signal are met.
weakBullishSignal: Bullish signal that doesn't meet the strong criteria but still shows some strength.
Plotting:
Oscillator Value: Plots the raw oscillator value in white.
Positive Oscillator Value: Plots only the positive part of the oscillator value in white.
Strong Bullish Signal Stick: Plots a red candlestick when a strong bullish signal is confirmed, using the highest positive oscillator value over the lookback period.
Bullish Signal Stick: Plots a white candlestick for a bullish signal that isn't necessarily strong.
Weak Bullish Signal Stick: Plots a green candlestick for a weak bullish signal.
Positive Trend: Plots yellow candlesticks when the oscillator value is positive.
Negative Trend: Plots fuchsia candlesticks when the oscillator value is negative.
Numbers on Candles: Represents the breakout strength as a percentage change in price.
HOW TO USE
Install the Script: Add the script to your TradingView chart.
Customize Inputs:
Adjust the shortEmaPeriod, longEmaPeriod, signalEmaPeriod, and lookbackPeriod as needed.
Interpret the Charts:
Red Candles: Indicate a strong bullish trend, suggesting a potential buying opportunity.
White Candles: Indicate bullish signals that are not as strong but still suggest a buying opportunity.
Green Candles: Indicate weak bullish signals, suggesting a possible buying opportunity but with less confidence.
Yellow Candles: Indicate a positive trend, suggesting the market is in an uptrend.
Fuchsia Candles: Indicate a negative trend, suggesting the market is in a downtrend.
Numbers on Candles: Show the breakout strength as a percentage change in price.
Analyze Trends and Signals:
Use red candles to identify strong bullish signals, especially if the price has increased by more than 7% from the previous bar.
Monitor white and green candles for potential entries with lower confidence.
Avoid trading during fuchsia candles, as the market is in a downtrend.
MARKET MEANING AND TRADING USAGE
Strong Bullish Signal (Red Candles): Indicates a significant price increase and momentum, suggesting a strong buying opportunity.
Bullish Signal (White Candles): Suggests a buying opportunity but with less confidence compared to strong signals.
Weak Bullish Signal (Green Candles): Indicates a possible buying opportunity with even lower confidence.
Positive Trend (Yellow Candles): Suggests the market is in an uptrend.
Negative Trend (Fuchsia Candles): Suggests the market is in a downtrend.
Trading Strategy:
Buy: When a strong bullish signal is confirmed (red candle), especially if the price has increased by more than 7% from the previous bar.
Monitor: Watch for bullish signals (white candles) and weak bullish signals (green candles) for potential entries with lower confidence.
Avoid: During negative trends (fuchsia candles), as the market is in a downtrend.
LIMITATIONS
Simplicity: The implementation is based on a combination of moving averages and custom calculations, which might not capture all aspects of market dynamics.
Close Price Dependency: Uses close prices to determine trends and signals, which might not reflect intrabar price movements and trade imbalances accurately.
Historical Data: The script is based on historical data and does not guarantee future performance.
NOTES
Educational Tool: The script is designed for educational purposes and should not be considered financial advice.
Backtesting: Users are encouraged to backtest the strategy on a demo account before applying it to live trades.
Complementary Use: Best used in conjunction with other indicators and analysis methods for more accurate trading decisions.
THANKS
Special thanks to the TradingView community for their support and feedback.

Buy/Sell Signals (MACD + RSI) 1HThis is a Pine Script indicator for TradingView that plots Buy/Sell signals based on the combination of MACD and RSI indicators on a 1-hour chart.
Description of the Code:
Indicator Setup:
The script is set to overlay the Buy/Sell signals directly on the price chart (using overlay=true).
The indicator is named "Buy/Sell Signals (MACD + RSI) 1H".
MACD Settings:
The MACD (Moving Average Convergence Divergence) uses standard settings of:
Fast Length: 12
Slow Length: 26
Signal Line Smoothing: 9
The MACD line and the Signal line are calculated using the ta.macd() function.
RSI Settings:
The RSI (Relative Strength Index) is calculated with a 14-period setting using the ta.rsi() function.
Buy/Sell Conditions:
Buy Signal:
Triggered when the MACD line crosses above the Signal line (Golden Cross).
RSI value is below 50.
Sell Signal:
Triggered when the MACD line crosses below the Signal line (Dead Cross).
RSI value is above 50.
Signal Visualization:
Buy Signals:
Green "BUY" labels are plotted below the price bars where the Buy conditions are met.
Sell Signals:
Red "SELL" labels are plotted above the price bars where the Sell conditions are met.
Chart Timeframe:
While the code itself doesn't enforce a specific timeframe, the name indicates that this indicator is intended to be used on a 1-hour chart.
To use it effectively, apply the script on a 1-hour chart in TradingView.
How It Works:
This indicator combines MACD and RSI to generate Buy/Sell signals:
The MACD identifies potential trend changes or momentum shifts (via crossovers).
The RSI ensures that Buy/Sell signals align with broader momentum (e.g., Buy when RSI < 50 to avoid overbought conditions).
When the defined conditions for Buy or Sell are met, visual signals (labels) are plotted on the chart.
How to Use:
Copy the code into the Pine Script editor in TradingView.
Save and apply the script to your 1-hour chart.
Look for:
"BUY" signals (green): Indicating potential upward trends or buying opportunities.
"SELL" signals (red): Indicating potential downward trends or selling opportunities.
This script is simple and focuses purely on providing actionable Buy/Sell signals based on two powerful indicators, making it ideal for traders who prefer a clean chart without clutter. Let me know if you need further customization!

Sell Signals EMA+SMAIndicator Overview:
This indicator identifies sell signals based on candlestick patterns, volume conditions, and moving average confirmations. It also plots support and resistance levels based on pivot highs and pivot lows. You can configure different settings like pivot lengths, moving average periods, and candlestick pattern conditions for the sell signals.
Configurable Settings:
Pivot High Length: Defines the number of bars used to calculate the resistance levels (pivot highs).
Pivot Low Length: Defines the number of bars used to calculate the support levels (pivot lows).
Volume SMA Length: The period of the simple moving average (SMA) for volume. Used to filter signals based on high volume.
Close SMA Length: The period of the simple moving average (SMA) for the close price. Used for confirmation of sell signals.
Pin Bar High Ratio: The ratio for defining the size of the upper wick in a bearish pin bar.
Pin Bar Low Ratio: The ratio for defining the size of the lower wick in a bearish pin bar.
How It Works:
Support and Resistance:
The indicator plots red lines for resistance (pivot highs) and green lines for support (pivot lows).
These levels are updated as new pivot points are detected based on the configured pivot lengths.
Sell Signal Conditions:
Candlestick Patterns: The indicator checks for two bearish patterns:
Bearish Pin Bar: A candle with a large upper wick and small lower wick where the close is below the open.
Bearish Engulfing: A candle where the current close is lower than the previous low, and the current open is higher than the previous high.
Volume Condition: The volume must be above the configured simple moving average (SMA) of the volume.
Confirmation: A sell signal is confirmed only when the price crosses below the configured SMA for the close price.
Sell Signals:
If all the conditions (candlestick pattern, volume, and confirmation) are met, the indicator will plot a red "Sell" label above the candle.
Additionally, a blue triangle will appear above the candle to indicate that the sell signal has been confirmed.
How to Use:
Adjust the Settings:
Open the settings of the indicator and adjust the parameters like pivot lengths, moving average periods, and candlestick pattern ratios based on your preferences.
Identify Key Levels:
Watch the red resistance and green support lines to identify key levels where price may reverse.
Look for Sell Signals:
When a red "Sell" label appears, it indicates a possible sell opportunity.
Ensure that a blue triangle (confirmation) also appears to validate the sell signal.
Manage Risk:
Use the support and resistance levels along with the sell signals to define your entry, stop-loss, and take-profit levels.
This indicator helps you identify potential bearish reversal points with configurable settings for added flexibility.
Adaptive RSI-Stoch with Butterworth Filter [UAlgo]The Adaptive RSI-Stoch with Butterworth Filter is a technical indicator designed to combine the strengths of the Relative Strength Index (RSI), Stochastic Oscillator, and a Butterworth Filter to provide a smooth and adaptive momentum-based trading signal. This custom-built indicator leverages the RSI to measure market momentum, applies Stochastic calculations for overbought/oversold conditions, and incorporates a Butterworth Filter to reduce noise and smooth out price movements for enhanced signal reliability.
By utilizing these combined methods, this indicator aims to help traders identify potential market reversal points, momentum shifts, and overbought/oversold conditions with greater precision, while minimizing false signals in volatile markets.
🔶 Key Features
Adaptive RSI and Stochastic Oscillator: Calculates RSI using a configurable period and applies a dual-smoothing mechanism with Stochastic Oscillator values (K and D lines).
Helps in identifying momentum strength and potential trend reversals.
Butterworth Filter: An advanced signal processing filter that reduces noise and smooths out the indicator values for better trend identification.
The filter can be enabled or disabled based on user preferences.
Customizable Parameters: Flexibility to adjust the length of RSI, the smoothing factors for Stochastic (K and D values), and the Butterworth Filter period.
🔶 Interpreting the Indicator
RSI & Stochastic Calculations:
The RSI is calculated based on the closing price over the user-defined period, and further smoothed to generate Stochastic Oscillator values.
The K and D values of the Stochastic Oscillator provide insights into short-term overbought or oversold conditions.
Butterworth Filter Application:
What is Butterworth Filter and How It Works?
The Butterworth Filter is a type of signal processing filter that is designed to have a maximally flat frequency response in the passband, meaning it doesn’t distort the frequency components of the signal within the desired range. It is widely used in digital signal processing and technical analysis to smooth noisy data while preserving the important trends in the underlying data. In this indicator, the Butterworth Filter is applied to the trigger value, making the resulting signal smoother and more stable by filtering out short-term fluctuations or noise in price data.
Key Concepts Behind the Butterworth Filter:
Filter Design: The Butterworth filter works by calculating weighted averages of current and past inputs (price or indicator values) and outputs to produce a smooth output. It is characterized by the absence of ripple in the passband and a smooth roll-off after the cutoff frequency.
Cutoff Frequency: The period specified in the indicator acts as a control for the cutoff frequency. A higher period means the filter will remove more high-frequency noise and retain longer-term trends, while a lower period means it will respond more to short-term fluctuations in the data.
Smoothing Process: In this script, the Butterworth Filter is calculated recursively using the following formula,
butterworth_filter(series float input, int period) =>
float wc = math.tan(math.pi / period)
float k1 = 1.414 * wc
float k2 = wc * wc
float a0 = k2 / (1 + k1 + k2)
float a1 = 2 * a0
float a2 = a0
float b1 = 2 * (k2 - 1) / (1 + k1 + k2)
float b2 = (1 - k1 + k2) / (1 + k1 + k2)
wc: This is the angular frequency, derived from the period input.
k1 and k2: These are intermediate coefficients used in the filter calculation.
a0, a1, a2: These are the feedforward coefficients, which determine how much of the current and past input values will contribute to the filtered output.
b1, b2: These are feedback coefficients, which determine how much of the past output values will contribute to the current output, effectively allowing the filter to "remember" past behavior and smooth the signal.
Recursive Calculation: The filter operates by taking into account not only the current input value but also the previous two input values and the previous two output values. This recursive nature helps it smooth the signal by blending the recent past data with the current data.
float filtered_value = a0 * input + a1 * prev_input1 + a2 * prev_input2
filtered_value -= b1 * prev_output1 + b2 * prev_output2
input: The current input value, which could be the trigger value in this case.
prev_input1, prev_input2: The previous two input values.
prev_output1, prev_output2: The previous two output values.
This means the current filtered value is determined by the combination of:
A weighted sum of the current input and the last two inputs.
A correction based on the last two output values to ensure smoothness and remove noise.
In conclusion when filter is enabled, the Butterworth Filter smooths the RSI and Stochastic values to reduce market noise and highlight significant momentum shifts.
The filtered trigger value (post-Butterworth) provides a cleaner representation of the market's momentum.
Cross Signals for Trade Entries:
Buy Signal: A bullish crossover of the K value above the D value, particularly when the values are below 40 and when the Stochastic trigger is below 1 and the filtered trigger is below 35.
Sell Signal: A bearish crossunder of the K value below the D value, particularly when the values are above 60 and when the Stochastic trigger is above 99 and the filtered trigger is above 90.
These signals are plotted visually on the chart for easy identification of potential trading opportunities.
Overbought and Oversold Zones:
The indicator highlights the overbought zone when the filtered trigger surpasses a specific threshold (typically above 100) and the oversold zone when it drops below 0.
The color-coded fill areas between the Stochastic and trigger lines help visualize when the market may be overbought (likely a reversal down) or oversold (potential reversal up).
🔶 Disclaimer
Use with Caution: This indicator is provided for educational and informational purposes only and should not be considered as financial advice. Users should exercise caution and perform their own analysis before making trading decisions based on the indicator's signals.
Not Financial Advice: The information provided by this indicator does not constitute financial advice, and the creator (UAlgo) shall not be held responsible for any trading losses incurred as a result of using this indicator.
Backtesting Recommended: Traders are encouraged to backtest the indicator thoroughly on historical data before using it in live trading to assess its performance and suitability for their trading strategies.
Risk Management: Trading involves inherent risks, and users should implement proper risk management strategies, including but not limited to stop-loss orders and position sizing, to mitigate potential losses.
No Guarantees: The accuracy and reliability of the indicator's signals cannot be guaranteed, as they are based on historical price data and past performance may not be indicative of future results.

Uptrick: Momentum-Volatility Composite Signal### Title: Uptrick: Momentum-Volatility Composite Signal
### Overview
The "Uptrick: Momentum-Volatility Composite Signal" is an innovative trading tool designed to offer traders a sophisticated synthesis of momentum, volatility, volume flow, and trend detection into a single comprehensive indicator. This tool stands out by providing an integrated view of market dynamics, which is critical for identifying potential trading opportunities with greater precision and confidence. Its unique approach differentiates it from traditional indicators available on the TradingView platform, making it a valuable asset for traders aiming to enhance their market analysis.
### Unique Features
This indicator integrates multiple crucial elements of market behavior:
- Momentum Analysis : Utilizes Rate of Change (ROC) metrics to assess the speed and strength of market movements.
- Volatility Tracking : Incorporates Average True Range (ATR) metrics to measure market volatility, aiding in risk assessment.
- Volume Flow Analysis : Analyzes shifts in volume to detect buying or selling pressure, adding depth to market understanding.
- Trend Detection : Uses the difference between short-term and long-term Exponential Moving Averages (EMA) to detect market trends, providing insights into potential reversals or confirmations.
Customization and Inputs
The Uptrick indicator offers a variety of user-defined settings tailored to fit different trading styles and strategies, enhancing its adaptability across various market conditions:
Rate of Change Length (rocLength) : This setting defines the period over which momentum is calculated. Shorter periods may be preferred by day traders who need to respond quickly to market changes, while longer periods could be better suited for position traders looking at more extended trends.
ATR Length (atrLength) : Adjusts the timeframe for assessing volatility. A shorter ATR length can help day traders manage the quick shifts in market volatility, whereas longer lengths might be more applicable for swing or position traders who deal with longer-term market movements.
Volume Flow Length (volumeFlowLength): Determines the analysis period for volume flow to identify buying or selling pressure. Day traders might opt for shorter periods to catch rapid volume changes, while longer periods could serve swing traders to understand the accumulation or distribution phases better.
Short EMA Length (shortEmaLength): Specifies the period for the short-term EMA, crucial for trend detection. Shorter lengths can aid day traders in spotting immediate trend shifts, whereas longer lengths might help swing traders in identifying more sustainable trend changes.
Long EMA Length (longEmaLength): Sets the period for the long-term EMA, which is useful for observing longer-term market trends. This setting is particularly valuable for position traders who need to align with the broader market direction.
Composite Signal Moving Average Length (maLength): This parameter sets the smoothing period for the composite signal's moving average, helping to reduce noise in the signal output. A shorter moving average length can be beneficial for day traders reacting to market conditions swiftly, while a longer length might help swing and position traders in smoothing out less significant fluctuations to focus on significant trends.
These customization options ensure that traders can fine-tune the Uptrick indicator to their specific trading needs, whether they are scanning for quick opportunities or analyzing more prolonged market trends.
### Functionality Details
The indicator operates through a sophisticated algorithm that integrates multiple market dimensions:
1. Momentum and Volatility Calculation : Combines ROC and ATR to gauge the market’s momentum and stability.
2. Volume and Trend Analysis : Integrates volume data with EMAs to provide a comprehensive view of current market trends and potential shifts.
3. Signal Composite : Each component is normalized and combined into a composite signal, offering traders a nuanced perspective on when to enter or exit trades.
The indicator performs its calculations as follows:
Momentum and Volatility Calculation:
roc = ta.roc(close, rocLength)
atr = ta.atr(atrLength)
Volume and Trend Analysis:
volumeFlow = ta.cum(volume) - ta.ema(ta.cum(volume), volumeFlowLength)
emaShort = ta.ema(close, shortEmaLength)
emaLong = ta.ema(close, longEmaLength)
emaDifference = emaShort - emaLong
Composite Signal Calculation:
Normalizes each component (ROC, ATR, volume flow, EMA difference) and combines them into a composite signal:
rocNorm = (roc - ta.sma(roc, rocLength)) / ta.stdev(roc, rocLength)
atrNorm = (atr - ta.sma(atr, atrLength)) / ta.stdev(atr, atrLength)
volumeFlowNorm = (volumeFlow - ta.sma(volumeFlow, volumeFlowLength)) / ta.stdev(volumeFlow, volumeFlowLength)
emaDiffNorm = (emaDifference - ta.sma(emaDifference, longEmaLength)) / ta.stdev(emaDifference, longEmaLength)
compositeSignal = (rocNorm + atrNorm + volumeFlowNorm + emaDiffNorm) / 4
### Originality
The originality of the Uptrick indicator lies in its ability to merge diverse market metrics into a unified signal. This multi-faceted approach goes beyond traditional indicators by offering a deeper, more holistic analysis of market conditions, providing traders with insights that are not only based on price movements but also on underlying market dynamics.
### Practical Application
The Uptrick indicator excels in environments where understanding the interplay between volume, momentum, and volatility is crucial. It is especially useful for:
- Day Traders : Can leverage real-time data to make quick decisions based on sudden market changes.
- Swing Traders : Benefit from understanding medium-term trends to optimize entry and exit points.
- Position Traders : Utilize long-term market trend data to align with overall market movements.
### Best Practices
To maximize the effectiveness of the Uptrick indicator, consider the following:
- Combine with Other Indicators : Use alongside other technical tools like RSI or MACD for additional validation.
- Adapt Settings to Market Conditions : Adjust the indicator settings based on the asset and market volatility to improve signal accuracy.
- Risk Management : Implement robust risk management strategies, including setting stop-loss orders based on the volatility measured by the ATR.
### Practical Examples and Demonstrations
- Example for Day Trading : In a volatile market, a trader notices a sharp increase in the momentum score coinciding with a surge in volume but stable volatility, signaling a potential bullish breakout.
- Example for Swing Trading : On a 4-hour chart, the indicator shows a gradual alignment of decreasing volatility and increasing buying volume, suggesting a strengthening upward trend suitable for a long position.
### Alerts and Their Uses
- Alert Configurations : Set alerts for when the composite score crosses predefined thresholds to capture potential buy or sell events.
- Strategic Application : Use alerts to stay informed of significant market moves without the need to continuously monitor the markets, enabling timely and informed trading decisions.
Technical Notes
Efficiency and Compatibility: The indicator is designed for efficiency, running smoothly across different trading platforms including TradingView, and can be easily integrated with existing trading setups. It leverages advanced mathematical models for normalizing and smoothing data, ensuring consistent and reliable signal quality across different market conditions.
Limitations : The effectiveness of the Uptrick indicator can vary significantly across different market conditions and asset classes. It is designed to perform best in liquid markets where data on volume, volatility, and price trends are readily available and reliable. Traders should be aware that in low-liquidity or highly volatile markets, the signals might be less reliable and require additional confirmation.
Usage Recommendations : While the Uptrick indicator is a powerful tool, it is recommended to use it in conjunction with other analysis methods to confirm signals. Traders should also continuously monitor the performance and adjust settings as needed to align with their specific trading strategies and market conditions.
### Conclusion
The "Uptrick: Momentum-Volatility Composite Signal" is a revolutionary tool that offers traders an advanced methodology for analyzing market dynamics. By combining momentum, volatility, volume, and trend detection into a single, cohesive indicator, it provides a powerful, actionable insight into market movements, making it an indispensable tool for traders aiming to optimize their trading strategies.

Trend Signals with TP & SL [UAlgo] StrategyThe "Trend Signals with TP & SL Strategy" is a trading strategy designed to capture trend continuation signals while incorporating sophisticated risk management techniques. This strategy is tailored for traders who wish to capitalize on trending market conditions with precise entry and exit points, automatically calculating Take Profit (TP) and Stop Loss (SL) levels based on either Average True Range (ATR) or percentage values. The strategy aims to enhance trade management by preventing multiple simultaneous positions and dynamically adapting to changing market conditions.
This strategy is highly configurable, allowing traders to adjust sensitivity, the ATR calculation method, and the cloud moving average length. Additionally, the strategy can display buy and sell signals directly on the chart, along with visual representation of entry points, stop losses, and take profits. It also features a cloud-based trend analysis using a MACD-driven color fill that indicates the strength and direction of the trend.
🔶 Key Features
Configurable Trend Continuation Signals:
Source Selection: The strategy uses the midpoint of the high-low range as the default source, but it is adjustable.
Sensitivity: The sensitivity of the trend signals can be adjusted using a multiplier, ranging from 0.5 to 5.
ATR Calculation: The strategy allows users to choose between two ATR calculation methods for better adaptability to different market conditions.
Cloud Moving Average: Traders can adjust the cloud moving average length, which is used in conjunction with MACD to provide a visual trend indication.
Take Profit & Stop Loss Management:
ATR-Based or Percent-Based: The strategy offers flexibility in setting TP and SL levels, allowing traders to choose between ATR-based multipliers or fixed percentage values.
Dynamic Adjustment: TP and SL levels are dynamically adjusted according to the selected method, ensuring trades are managed based on real-time market conditions.
Prevention of Multiple Positions:
Single Position Control: To reduce risk and enhance strategy reliability, the strategy includes an option to prevent multiple positions from being opened simultaneously.
Visual Trade Indicators:
Buy/Sell Signals: Clearly displays buy and sell signals on the chart for easy interpretation.
Entry, SL, and TP Lines: Draws lines for entry price, stop loss, and take profit directly on the chart, helping traders to monitor trades visually.
Trend Cloud: A color-filled cloud based on MACD and the cloud moving average provides a visual cue of the trend’s direction and strength.
Performance Summary Table:
In-Chart Statistics: A table in the top right of the chart displays key performance metrics, including total trades, wins, losses, and win rate percentage, offering a quick overview of the strategy’s effectiveness.
🔶 Interpreting the Indicator
Trend Signals: The strategy identifies trend continuation signals based on price action relative to an ATR-based threshold. A buy signal is generated when the price crosses above a key level, indicating an uptrend. Conversely, a sell signal occurs when the price crosses below a level, signaling a downtrend.
Cloud Visualization: The cloud, derived from MACD and moving averages, changes color to reflect the current trend. A positive cloud in aqua suggests an uptrend, while a red cloud indicates a downtrend. The transparency of the cloud offers further nuance, with more solid colors denoting stronger trends.
Entry and Exit Management: Once a trend signal is generated, the strategy automatically sets TP and SL levels based on your chosen method (ATR or percentage). The stop loss and take profit lines will appear on the chart, showing where the strategy will exit the trade. If the price reaches either the SL or TP, the trade is closed, and the respective line is deleted from the chart.
Performance Metrics: The strategy’s performance is tracked in real-time with an in-chart table. This table provides essential information about the number of trades executed, the win/loss ratio, and the overall win rate. This information helps traders assess the strategy's effectiveness and make necessary adjustments.
This strategy is designed for those who seek to engage with trending markets, offering robust tools for entry, exit, and overall trade management. By understanding and leveraging these features, traders can potentially improve their trading outcomes and risk management.
🔷 Related Script
🔶 Disclaimer
Use with Caution: This indicator is provided for educational and informational purposes only and should not be considered as financial advice. Users should exercise caution and perform their own analysis before making trading decisions based on the indicator's signals.
Not Financial Advice: The information provided by this indicator does not constitute financial advice, and the creator (UAlgo) shall not be held responsible for any trading losses incurred as a result of using this indicator.
Backtesting Recommended: Traders are encouraged to backtest the indicator thoroughly on historical data before using it in live trading to assess its performance and suitability for their trading strategies.
Risk Management: Trading involves inherent risks, and users should implement proper risk management strategies, including but not limited to stop-loss orders and position sizing, to mitigate potential losses.
No Guarantees: The accuracy and reliability of the indicator's signals cannot be guaranteed, as they are based on historical price data and past performance may not be indicative of future results.

RSI Slope Filtered Signals [UAlgo]The "RSI Slope Filtered Signals " is a technical analysis tool designed to enhance the accuracy of RSI (Relative Strength Index) signals by incorporating slope analysis. This indicator not only considers the RSI value but also analyzes the slope of the RSI over a specified number of bars, providing a more refined signal that accounts for the momentum and trend strength. By utilizing both positive and negative slope arrays, the indicator dynamically adjusts its thresholds, ensuring that signals are responsive to changing market conditions. This tool is particularly useful for traders looking to identify overbought and oversold conditions with a higher degree of precision, filtering out noise and providing clear visual cues for potential market reversals.
🔶 Key Features
Dynamic Slope Analysis: Measures the slope of RSI over a customizable number of bars, offering insights into the momentum and trend direction.
Adaptive Thresholds: Uses historical slope data to calculate dynamic thresholds, adjusting signal sensitivity based on market conditions.
Normalized Slope Calculation: Normalizes the slope values to provide a consistent measure across different market conditions, making the indicator more versatile.
Clear Signal Visualization: The indicator plots both positive and negative normalized slopes with color gradients, visually representing the strength of the trend.
Overbought and Oversold Signals: Plots overbought and oversold signals directly on the chart when the calculated value reaches the user-specified threshold, helping traders identify potential reversal points.
Customizable Settings: Allows users to adjust the RSI length, slope measurement bars, and lookback periods, providing flexibility to tailor the indicator to different trading strategies.
🔶 Interpreting the Indicator
The "RSI Slope Filtered Signals " indicator is designed to be easy to interpret. Here's how you can use it:
Normalized Slope: The indicator plots the normalized slope of the RSI, with values above zero indicating positive momentum and values below zero indicating negative momentum. A higher positive slope suggests a strong upward trend, while a deeper negative slope indicates a strong downward trend.
Reversal Signals: The indicator plots several horizontal lines at different thresholds (+3, +2, +1, 0, -1, -2, -3). These levels are used to gauge the strength of the momentum based on the normalized slope. For example, a normalized slope crossing above the +2 threshold may indicate a strong bullish trend, while crossing below the -2 threshold may suggest a strong bearish trend. These thresholds help in understanding the intensity of the current trend and provide context for interpreting the indicator's signals.
This indicator generates overbought and oversold signals not solely based on the RSI entering extreme levels (above 70 for overbought and below 30 for oversold), but also by considering the behavior of the normalized slope relative to specific thresholds. Specifically, the Overbought Signal (🔽) is triggered when the RSI is above 70 and the normalized slope from the previous bar is greater than or equal to the upper threshold, with the current slope being lower than the previous slope, indicating a potential bearish reversal as momentum may be slowing down.
Similarly, the Oversold Signal (🔼) is generated when the RSI is below 30 and the normalized slope from the previous bar is less than or equal to the lower threshold, with the current slope being higher than the previous slope, signaling a potential bullish reversal as the downward momentum may be weakening.
Area Plots: The indicator also plots the positive and negative slopes as filled areas, providing a quick visual cue for the strength and direction of the trend. Green areas represent positive slopes (upward momentum), while red areas represent negative slopes (downward momentum).
By combining these elements, the "RSI Slope Filtered Signals " provides a comprehensive view of the market's momentum, helping traders make more informed decisions by filtering out false signals and focusing on the significant trends.
🔶 Disclaimer
Use with Caution: This indicator is provided for educational and informational purposes only and should not be considered as financial advice. Users should exercise caution and perform their own analysis before making trading decisions based on the indicator's signals.
Not Financial Advice: The information provided by this indicator does not constitute financial advice, and the creator (UAlgo) shall not be held responsible for any trading losses incurred as a result of using this indicator.
Backtesting Recommended: Traders are encouraged to backtest the indicator thoroughly on historical data before using it in live trading to assess its performance and suitability for their trading strategies.
Risk Management: Trading involves inherent risks, and users should implement proper risk management strategies, including but not limited to stop-loss orders and position sizing, to mitigate potential losses.
No Guarantees: The accuracy and reliability of the indicator's signals cannot be guaranteed, as they are based on historical price data and past performance may not be indicative of future results.

Dysmen signalsDysmen Signals Indicator
The "Dysmen Signals" indicator is designed to provide clear buy and sell signals based on the crossover of various Exponential Moving Averages (EMAs). This indicator employs a combination of short-term and long-term EMA crossovers to identify potential trading opportunities, while also highlighting significant market movements through specific signals such as the Golden Cross and Death Cross.
Indicator Components
1. Exponential Moving Averages (EMAs)
- EMA 14: A short-term EMA calculated over 14 periods.
- EMA 20: Another short-term EMA calculated over 20 periods.
- EMA 50: A mid-term EMA used as a trend filter.
- EMA 200: A long-term EMA representing the overall trend.
2. Buy and Sell Signals
- Buy Signal: This is triggered when the EMA 14 crosses above the EMA 20 and the closing price is above the EMA 50. This suggests a bullish trend in the market.
- Sell Signal: This is triggered when the EMA 14 crosses below the EMA 20 and the closing price is below the EMA 50. This indicates a bearish trend in the market.
3. Golden Cross and Death Cross
- Golden Cross (GC): Occurs when the EMA 50 crosses above the EMA 200. This is a strong bullish signal indicating a potential long-term upward trend.
- Death Cross (DC): Occurs when the EMA 50 crosses below the EMA 200. This is a strong bearish signal suggesting a potential long-term downward trend.
4. Signal Visualization
- Buy and Sell signals are marked on the chart with green and red triangles respectively. These signals help traders identify potential entry and exit points.
- Golden Cross and Death Cross signals are indicated with yellow and purple diamonds respectively, providing insight into major market trend shifts.
5. Candle Coloring
- Candles are colored green if a buy signal is active and red if a sell signal is active. This visual aid helps in quickly identifying the prevailing market sentiment.
6. EMA 200 Plotting
- The EMA 200 is plotted as a white, semi-thick line on the chart. This line serves as a reference for the overall long-term trend.
Detailed Code Explanation
- EMA Calculations: The script calculates the EMA for 14, 20, 50, and 200 periods using the ta.ema function.
- Crossover Conditions: It uses the ta.crossover and ta.crossunder functions to detect when the EMAs cross each other, triggering buy and sell signals.
- Plotting Signals: The plotshape function is utilized to display BUY and SELL signals as well as Golden Cross and Death Cross signals on the chart.
- Candle Coloring Logic: A variable direction is used to store the current market direction based on the latest signal, which then determines the candle colors using the barcolor function.
- EMA 200 Display: The plot function is used to draw the EMA 200 line on the chart with the specified color and thickness.
By employing this indicator, traders can gain valuable insights into potential market trends and make more informed trading decisions based on the crossover of key EMAs.

Alligator + Fractals + Divergent & Squat Bars + Signal AlertsThe indicator includes Williams Alligator, Williams Fractals, Divergent Bars, Market Facilitation Index, Highest and Lowest Bars, maximum and minimum peak of Awesome Oscillator, and signal alerts based on Bill Williams' Profitunity strategy.
MFI and Awesome Oscillator
According to the Market Facilitation Index Oscillator, the Squat bar is colored blue, all other bars are colored according to the Awesome Oscillator color, except for the Fake bars, colored with a lighter AO color. In the indicator settings, you can enable the display of "Green" bars (in the "Green Bars > Show" field). In the indicator style settings, you can disable changing the color of bars in accordance with the AO color (in the "AO bars" field), including changing the color for Fake bars (in the "Fake AO bars" field).
MFI is calculated using the formula: (high - low) / volume.
A Squat bar means that, compared to the previous bar, its MFI has decreased and at the same time its volume has increased, i.e. MFI < previous bar and volume > previous bar. A sign of a possible price reversal, so this is a particularly important signal.
A Fake bar is the opposite of a Squat bar and means that, compared to the previous bar, its MFI has increased and at the same time its volume has decreased, i.e. MFI > previous bar and volume < previous bar.
A "Green" bar means that, compared to the previous bar, its MFI has increased and at the same time its volume has increased, i.e. MFI > previous bar and volume > previous bar. A sign of trend continuation. But a more significant trend confirmation or warning of a possible reversal is the Awesome Oscillator, which measures market momentum by calculating the difference between the 5 Period and 34 Period Simple Moving Averages (SMA 5 - SMA 34) based on the midpoints of the bars (hl2). Therefore, by default, the "Green" bars and their opposite "Fade" bars are colored according to the color of the Awesome Oscillator.
According to Bill Williams' Profitunity strategy, using the Awesome Oscillator, the third Elliott wave is determined by the maximum peak of AO in the range from 100 to 140 bars. The presence of divergence between the maximum AO peak and the subsequent lower AO peak in this interval also warns of a possible correction, especially if the AO crosses the zero line between these AO peaks. Therefore, the chart additionally displays the prices of the highest and lowest bars, as well as the maximum or minimum peak of AO in the interval of 140 bars from the last bar. In the indicator settings, you can hide labels, lines, change the number of bars and any parameters for the AO indicator - method (SMA, Smoothed SMA, EMA and others), length, source (open, high, low, close, hl2 and others).
Bullish Divergent bar
🟢 A buy signal (Long) is a Bullish Divergent bar with a green circle displayed above it if such a bar simultaneously meets all of the following conditions:
The high of the bar is below all lines of the Alligator indicator.
The closing price of the bar is above its middle, i.e. close > (high + low) / 2.
The low of the bar is below the low of 2 previous bars or below the low of one previous bar, and the low of the second previous bar is a lower fractal (▼). By default, Divergent bars are not displayed, the low of which is lower than the low of only one previous bar and the low of the 2nd previous bar is not a lower fractal (▼), but you can enable the display of any Divergent bars in the indicator settings (by setting the value "no" in the " field Divergent Bars > Filtration").
The following conditions strengthen the Bullish Divergent bar signal:
The opening price of the bar, as well as the closing price, is higher than its middle, i.e. Open > (high + low) / 2.
The high of the bar is below all lines of the open Alligator indicator, i.e. the green line (Lips) is below the red line (Teeth) and the red line is below the blue line (Jaw). In this case, the color of the circle above the Bullish Divergent bar is dark green.
Squat Divergent bar.
The bar following the Bullish Divergent bar corresponds to the green color of the Awesome Oscillator.
Divergence on Awesome Oscillator.
Formation of the lower fractal (▼), in which the low of the Divergent bar is the peak of the fractal.
Bearish Divergent bar
🔴 A signal to sell (Short) is a Bearish Divergent bar under which a red circle is displayed if such a bar simultaneously meets all the following conditions:
The low of the bar is above all lines of the Alligator indicator.
The closing price of the bar is below its middle, i.e. close < (high + low) / 2.
The high of the bar is higher than the high of 2 previous bars or higher than the high of one previous bar, and the high of the second previous bar is an upper fractal (▲). By default, Divergent bars are not displayed, the high of which is higher than the high of only one previous bar and the high of the 2nd previous bar is not an upper fractal (▲), but you can enable the display of any Divergent bars in the indicator settings (by setting the value "no" in the " field Divergent Bars > Filtration").
The following conditions strengthen the Bearish Divergent bar signal:
The opening price of the bar, as well as the closing price, is below its middle, i.e. open < (high + low) / 2.
The low of the bar is above all lines of the open Alligator indicator, i.e. the green line (Lips) is above the red line (Teeth) and the red line is above the blue line (Jaw). In this case, the color of the circle under the Bearish Divergent bar is dark red.
Squat Divergent bar.
The bar following the Bearish Divergent bar corresponds to the red color of the Awesome Oscillator.
Divergence on Awesome Oscillator.
Formation of the upper fractal (▲), in which the high of the Divergent bar is the peak of the fractal.
Alligator lines crossing
Bars crossing the green line (Lips) of the open Alligator indicator is the first warning of a possible correction (price rollback) if one of the following conditions is met:
If the bar closed below the Lips line, which is above the Teeth line, and the Teeth line is above the Jaw line, while the closing price of the previous bar is above the Lips line.
If the bar closed above the Lips line, which is below the Teeth line, and the Teeth line is below the Jaw line, while the closing price of the previous bar is below the Lips line.
The intersection of all open Alligator lines by bars is a sign of a deep correction and a warning of a possible trend change.
Frequent intersection of Alligator lines with each other is a sign of a sideways trend (flat).
Signal Alerts
To receive notifications about signals when creating an alert, you must select the condition "Any alert() function is call", in which case notifications will arrive in the following format:
D — timeframe, for example: D, 4H, 15m.
🟢 BDB⎾ - a signal for a Bullish Divergent bar to buy (Long), triggers once after the bar closes and includes additional signals:
/// — if Alligator is open.
⏉ — if the opening price of the bar, as well as the closing price, is above its middle.
+ Squat 🔷 - Squat bar or + Green ↑ - "Green" bar or + Fake ↓ - Fake bar.
+ AO 🟩 - if after the Divergent bar closes, the oscillator color change for the next bar corresponds the green color of the Awesome Oscillator. ┴/┬ — AO above/below the zero line. ∇ — if there is divergence on AO in the interval of 140 bars from the last bar.
🔴 BDB⎿ - a signal for a Bearish Divergent bar to sell (Short), triggers once after the bar closes and includes additional signals:
/// — if Alligator is open.
⏊ — if the opening price of the bar, as well as the closing price, is below its middle.
+ Squat 🔷 - Squat bar or + Green ↑ - "Green" bar or + Fake ↓ - Fake bar.
+ AO 🟥 - if after the Divergent bar closes, the oscillator color change for the next bar corresponds to the red color of the Awesome Oscillator. ┴/┬ — AO above/below the zero line. ∇ — if there is divergence on AO in the interval of 140 bars from the last bar.
Alert for bars crossing the green line (Lips) of the open Alligator indicator (can be disabled in the indicator settings in the "Alligator > Enable crossing lips alerts" field):
🔴 Crossing Lips ↓ - if the bar closed below the Lips line, which is above than the other lines, while the closing price of the previous bar is above the Lips line.
🟢 Crossing Lips ↑ - if the bar closed above the Lips line, which is below the other lines, while the closing price of the previous bar is below the Lips line.
The fractal signal is triggered after the second bar closes, completing the formation of the fractal, if alerts about fractals are enabled in the indicator settings (the "Fractals > Enable alerts" field):
🟢 Fractal ▲ - upper (Bearish) fractal.
🔴 Fractal ▼ — lower (Bullish) fractal.
⚪️ Fractal ▲/▼ - both upper and lower fractal.
↳ (H=high - L=low) = difference.
If you redirect notifications to a webhook URL, for example, to a Telegram bot, then you need to set the notification template for the webhook in the indicator settings in the "Webhook > Message" field (contains a tooltip with an example), in which you just need to specify the text {{message}}, which will be automatically replaced with the alert text with a ticker and a link to TradingView.
‼️ A signal is not a call to action, but only a reason to analyze the chart to make a decision based on the rules of your strategy.
***
Индикатор включает в себя Williams Alligator, Williams Fractals, Дивергентные бары, Market Facilitation Index, самый высокий и самый низкий бары, максимальный и минимальный пик Awesome Oscillator, а также оповещения о сигналах на основе стратегии Profitunity Билла Вильямса.
MFI и Awesome Oscillator
В соответствии с осциллятором Market Facilitation Index Приседающий бар окрашен в синий цвет, все остальные бары окрашены в соответствии с цветом Awesome Oscillator, кроме Фальшивых баров, которые окрашены более светлым цветом AO. В настройках индикатора вы можете включить отображение "Зеленых" баров (в поле "Green Bars > Show"). В настройках стиля индикатора вы можете выключить изменение цвета баров в соответствии с цветом AO (в поле "AO bars"), в том числе изменить цвет для Фальшивых баров (в поле "Fake AO bars").
MFI рассчитывается по формуле: (high - low) / volume.
Приседающий бар означает, что по сравнению с предыдущим баром его MFI снизился и в тоже время вырос его объем, т.е. MFI < предыдущего бара и объем > предыдущего бара. Признак возможного разворота цены, поэтому это особенно важный сигнал.
Фальшивый бар является противоположностью Приседающему бару и означает, что по сравнению с предыдущим баром его MFI увеличился и в тоже время снизился его объем, т.е. MFI > предыдущего бара и объем < предыдущего бара.
"Зеленый" бар означает, что по сравнению с предыдущим баром его MFI увеличился и в тоже время вырос его объем, т.е. MFI > предыдущего бара и объем > предыдущего бара. Признак продолжения тренда. Но более значимым подтверждением тренда или предупреждением о возможном развороте является Awesome Oscillator, который измеряет движущую силу рынка путем вычисления разницы между 5 Периодной и 34 Периодной Простыми Скользящими Средними (SMA 5 - SMA 34) по средним точкам баров (hl2). Поэтому по умолчанию "Зеленые" бары и противоположные им "Увядающие" бары окрашены в соответствии с цветом Awesome Oscillator.
По стратегии Profitunity Билла Вильямса с помощью осциллятора Awesome Oscillator определяется третья волна Эллиота по максимальному пику AO в интервале от 100 до 140 баров. Наличие дивергенции между максимальным пиком AO и следующим за ним более низким пиком AO в этом интервале также предупреждает о возможной коррекции, особенно если AO переходит через нулевую линию между этими пиками AO. Поэтому на графике дополнительно отображаются цены самого высокого и самого низкого баров, а также максимальный или минимальный пик АО в интервале 140 баров от последнего бара. В настройках индикатора вы можете скрыть метки, линии, изменить количество баров и любые параметры для индикатора AO – метод (SMA, Smoothed SMA, EMA и другие), длину, источник (open, high, low, close, hl2 и другие).
Бычий Дивергентный бар
🟢 Сигналом на покупку (Long) является Бычий Дивергентный бар над которым отображается зеленый круг, если такой бар соответствует одновременно всем следующим условиям:
Максимум бара ниже всех линий индикатора Alligator.
Цена закрытия бара выше его середины, т.е. close > (high + low) / 2.
Минимум бара ниже минимума 2-х предыдущих баров или ниже минимума одного предыдущего бара, а минимум второго предыдущего бара является нижним фракталом (▼). По умолчанию не отображаются Дивергентные бары, минимум которых ниже минимума только одного предыдущего бара и минимум 2-го предыдущего бара не является нижним фракталом (▼), но вы можете включить отображение любых Дивергентных баров в настройках индикатора (установив значение "no" в поле "Divergent Bars > Filtration").
Усилением сигнала Бычьего Дивергентного бара являются следующие условия:
Цена открытия бара, как и цена закрытия, выше его середины, т.е. Open > (high + low) / 2.
Максимум бара ниже всех линий открытого индикатора Alligator, т.е. зеленая линия (Lips) ниже красной линии (Teeth) и красная линия ниже синей линии (Jaw). В этом случае цвет круга над Бычьим Дивергентным баром окрашен в темно-зеленый цвет.
Приседающий Дивергентный бар.
Бар, следующий за Бычьим Дивергентным баром, соответствует зеленому цвету Awesome Oscillator.
Дивергенция на Awesome Oscillator.
Образование нижнего фрактала (▼), у которого минимум Дивергентного бара является пиком фрактала.
Медвежий Дивергентный бар
🔴 Сигналом на продажу (Short) является Медвежий Дивергентный бар под которым отображается красный круг, если такой бар соответствует одновременно всем следующим условиям:
Минимум бара выше всех линий индикатора Alligator.
Цена закрытия бара ниже его середины, т.е. close < (high + low) / 2.
Максимум бара выше маскимума 2-х предыдущих баров или выше максимума одного предыдущего бара, а максимум второго предыдущего бара является верхним фракталом (▲). По умолчанию не отображаются Дивергентные бары, максимум которых выше максимума только одного предыдущего бара и максимум 2-го предыдущего бара не является верхним фракталом (▲), но вы можете включить отображение любых Дивергентных баров в настройках индикатора (установив значение "no" в поле "Divergent Bars > Filtration").
Усилением сигнала Медвежьего Дивергентного бара являются следующие условия:
Цена открытия бара, как и цена закрытия, ниже его середины, т.е. open < (high + low) / 2.
Минимум бара выше всех линий открытого индикатора Alligator, т.е. зеленая линия (Lips) выше красной линии (Teeth) и красная линия выше синей линии (Jaw). В этом случае цвет круга под Медвежьим Дивергентным Баром окрашен в темно-красный цвет.
Приседающий Дивергентный бар.
Бар, следующий за Медвежьим Дивергентным баром, соответствует красному цвету Awesome Oscillator.
Дивергенция на Awesome Oscillator.
Образование верхнего фрактала (▲), у которого максимум Дивергентного бара является пиком фрактала.
Пересечение линий Alligator
Пересечение барами зеленой линии (Lips) открытого индикатора Alligator является первым предупреждением о возможной коррекции (откате цены) при выполнении одного из следующих условий:
Если бар закрылся ниже линии Lips, которая выше линии Teeth, а линия Teeth выше линии Jaw, при этом цена закрытия предыдущего бара находится выше линии Lips.
Если бар закрылся выше линии Lips, которая ниже линии Teeth, а линия Teeth ниже линии Jaw, при этом цена закрытия предыдущего бара находится ниже линии Lips.
Пересечение барами всех линий открытого Alligator является признаком глубокой коррекции и предупреждением о возможной смене тренда.
Частое пересечение линий Alligator между собой является признаком бокового тренда (флэт).
Оповещения о сигналах
Для получения уведомлений о сигналах при создании оповещения необходимо выбрать условие "При любом вызове функции alert()", в таком случае уведомления будут приходить в следующем формате:
D — таймфрейм, например: D, 4H, 15m.
🟢 BDB⎾ — сигнал Бычьего Дивергентного бара на покупку (Long), срабатывает один раз после закрытия бара и включает дополнительные сигналы:
/// — если Alligator открыт.
⏉ — если цена открытия бара, как и цена закрытия, выше его середины.
+ Squat 🔷 — Приседающий бар или + Green ↑ — "Зеленый" бар или + Fake ↓ — Фальшивый бар.
+ AO 🟩 — если после закрытия Дивергентного бара, изменение цвета осциллятора для следующего бара соответствует зеленому цвету Awesome Oscillator. ┴/┬ — AO выше/ниже нулевой линии. ∇ — если есть дивергенция на AO в интервале 140 баров от последнего бара.
🔴 BDB⎿ — сигнал Медвежьего Дивергентного бара на продажу (Short), срабатывает один раз после закрытия бара и включает дополнительные сигналы:
/// — если Alligator открыт.
⏊ — если цена открытия бара, как и цена закрытия, ниже его середины.
+ Squat 🔷 — Приседающий бар или + Green ↑ — "Зеленый" бар или + Fake ↓ — Фальшивый бар.
+ AO 🟥 — если после закрытия Дивергентного бара, изменение цвета осциллятора для следующего бара соответствует красному цвету Awesome Oscillator. ┴/┬ — AO выше/ниже нулевой линии. ∇ — если есть дивергенция на AO в интервале 140 баров от последнего бара.
Сигнал пересечения барами зеленой линии (Lips) открытого индикатора Alligator (можно отключить в настройках индикатора в поле "Alligator > Enable crossing lips alerts"):
🔴 Crossing Lips ↓ — если бар закрылся ниже линии Lips, которая выше остальных линий, при этом цена закрытия предыдущего бара находится выше линии Lips.
🟢 Crossing Lips ↑ — если бар закрылся выше линии Lips, которая ниже остальных линий, при этом цена закрытия предыдущего бара находится ниже линии Lips.
Сигнал фрактала срабатывает после закрытия второго бара, завершающего формирование фрактала, если оповещения о фракталах включены в настройках индикатора (поле "Fractals > Enable alerts"):
🟢 Fractal ▲ — верхний (Медвежий) фрактал.
🔴 Fractal ▼ — нижний (Бычий) фрактал.
⚪️ Fractal ▲/▼ — одновременно верхний и нижний фрактал.
↳ (H=high - L=low) = разница.
Если вы перенаправляете оповещения на URL вебхука, например, в бота Telegram, то вам необходимо установить шаблон оповещения для вебхука в настройках индикатора в поле "Webhook > Message" (содержит подсказку с примером), в котором в качестве текста сообщения достаточно указать текст {{message}}, который будет автоматически заменен на текст оповещения с тикером и ссылкой на TradingView.
‼️ Сигнал — это не призыв к действию, а лишь повод проанализировать график для принятия решения на основе правил вашей стратегии.

RSI and MACD Crossover SignalsBest for Short-Term/Intraday Trading on SPY, TSLA, NVDA
Strategy Concept:
This strategy is designed for short-term trading across various assets and timeframes (Recommend: 1min, 5min, 15min, 1hr, 4hr, 1day). It leverages the Relative Strength Index (RSI) and Moving Average Convergence Divergence (MACD) to identify potential buy and sell signals. The strategy aims to capture moments where the asset's price is likely to experience a reversal or a significant momentum shift.
By combining the RSI and MACD indicators, the strategy seeks to increase the accuracy of identifying potential trend reversals or continuations, taking into account both the momentum and the trend direction of the asset.
RSI (Relative Strength Index) Parameters:
The RSI period is set to 14
Overbought and oversold levels are set at 70 and 30, respectively
The RSI is used to identify potential reversal points when the asset is overbought or oversold
MACD (Moving Average Convergence Divergence) Parameters:
The MACD settings are configured with a fast length of 8, a slow length of 34, and a signal smoothing of 8
The MACD line crossing over or under the signal line is used to confirm the potential buy or sell signals indicated by the RSI
Signal Generation Logic:
Buy Signal:
Triggered when the RSI crosses above the oversold level (30).
Confirmed if the MACD line crosses above the signal line within a delay period of up to 4 candles after the RSI signal.
Sell Signal:
Triggered when the RSI crosses below the overbought level (70).
Confirmed if the MACD line crosses below the signal line within a delay period of up to 4 candles after the RSI signal.
Additional Features:
The script includes a notification system that alerts the trader when either a buy or sell signal is detected. The alert signal is combined with both the buy and sell signal in 1 so people without premium can be alerted when any signal appears.
Buy signals are visually represented on the chart below the price bars with a green "BUY" label.
Sell signals are indicated above the price bars with a red "SELL" label.
Usage and Application:
This strategy is versatile and recommended to be played with scalps and day trades. I prefer SPY 0DTE on the 1 and 5 minute timeframe and looking for bigger trend reversals on the 1hr, 4hr, and 1 day timeframe.
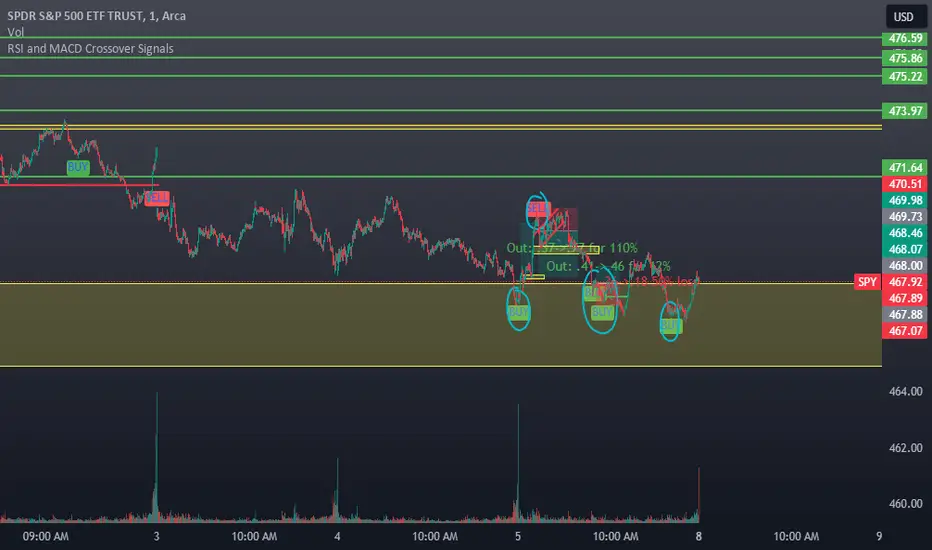
Ruth Buy/Sell Signal for Day Trade and Swing TradeRuth is based on the most known technical indicators and designed for intraday traders. Ruth's aim is to find the best Buy/Sell points and decide to stop loss point with minimum Loss also Ruth tries to find multiple Profit points as TP1/TP2/TP3/TP4/TP5. Ruth was designed based on the heat map colors to be user-friendly and easy to read. While cold color preferred for Short positions, warm colors preferred for Long positions. The most important feature of Ruth is that after the signal is generated, the candles in which the profitable levels are painted one by one with their own special color codes, so that even the most inexperienced users can understand where they should close their positions.
There are two types of signal Ruth can produce for fast trade.
Short Signal: These signals means market tends to be move to down.
Short Stop Loss Point: This is the maximum risk for the position. Shown with single red line inside of the signal.
Short Entry Point: This is the best entry price for short side position. Shown with single baby blue line inside of the signal.
Short Take Profit (TP1): This level represents the profit level the signal is most likely to reach. Shown with single blue line inside of the signal.
Short Take Profit (TP2): This level represents the profit level with a high probability of the signal occurring. Shown with single light purple line inside of the signal.
Short Take Profit (TP3): This level represents the profit level with an intermediate probability of the signal occurring. Shown with single dark purple line inside of the signal.
Short Take Profit (TP4): This level represents the profit level with a low probability of the signal occurring. Shown with single light lilac line inside of the signal.
Short Take Profit (TP5): This level represents the profit level with a tight probability of the signal occurring. Shown with single dark lilac line inside of the signal.
Long Signal: These signals means market tends to be move to up.
Long Stop Loss Point: This is the maximum risk for the position. Shown with single red line inside of the signal.
Long Entry Point: This is the best entry price for short side position. Shown with single baby blue line inside of the signal.
Long Take Profit (TP1): This level represents the profit level the signal is most likely to reach. Shown with single greenish yellow line inside of the signal.
Long Take Profit (TP2): This level represents the profit level with a high probability of the signal occurring. Shown with yellow purple line inside of the signal.
Long Take Profit (TP3): This level represents the profit level with an intermediate probability of the signal occurring. Shown with single dark yellow line inside of the signal.
Long Take Profit (TP4): This level represents the profit level with a low probability of the signal occurring. Shown with single orange line inside of the signal.
Long Take Profit (TP5): This level represents the profit level with a tight probability of the signal occurring. Shown with single dark orange line inside of the signal.
Timeframe: In general best and fastest results occurred in shorter timeframes like 1 min / 5 mins / 15 mins but feel free to try higher timeframes.
Tips & Tricks:
1) Gray line drawn ot the graph represents Dema, we suggests you to go on Short Singals under gray line and go on Long Signals upper gray line.
2) Mostly, Signals easily reach their TP2 / TP3 levels and then generally there is reaction or take profit desire so commodity price turns the opposite direction. If in short time price won't turn to Signal direction close position.
3) Don't forget, every positions has own risks and profits but trade in main trend is crucial.
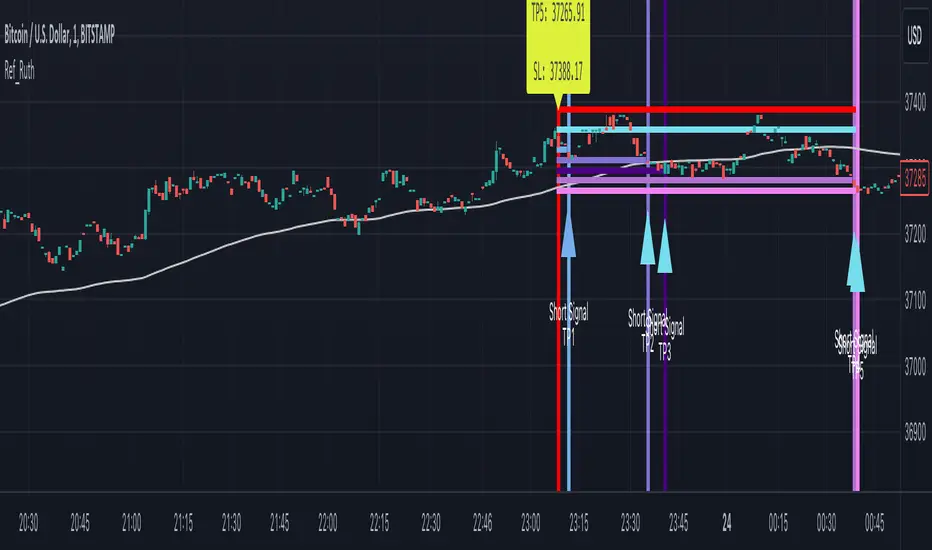
Trend Gazer: Unified ICT Trading System with Signals# Trend Gazer User Guide (English)
## 📖 Table of Contents
1. (#about-this-indicator)
2. (#quick-start-guide-3-steps)
3. (#detailed-usage)
4. (#settings-customization)
5. (#why-combine-multiple-features)
6. (#faq)
---
## About This Indicator
**Trend Gazer** is an integrated trading system designed to read institutional order flow like professional traders.
### 🎯 3 Problems This Indicator Solves
#### ❌ Problem 1: Too Many Indicators = Information Overload
```
Normal: RSI + MACD + Moving Average + Bollinger Bands... → Cluttered chart
Solution: All integrated into ONE indicator → Clean & Clear
```
#### ❌ Problem 2: Single Indicators Give False Signals
```
Normal: Enter based on RSI alone → Frequent stop-outs
Solution: Structure × Zone × Momentum multi-angle confirmation → Higher win rate
```
#### ❌ Problem 3: Unclear Entry Timing
```
Normal: Know the trend but don't know WHERE to enter
Solution: LS Bounce Signal shows EXACT entry points
```
---
## Quick Start Guide (3 Steps)
### 🚀 STEP 1: Confirm Trend Direction
**Look for CHoCH (Change of Character)**
```
📍 (1.CHoCH) label = Uptrend starting
📍 (a.CHoCH) label = Downtrend starting
```
**Important**: Wait for CHoCH! No direction without it.
---
### 🎯 STEP 2: Find Entry Points
**Wait for LS Bounce Signal (green/red labels)**
```
🟢 "Long@ HL only" label → LONG (buy) candidate
🔴 "Short@ LH only" label → SHORT (sell) candidate
```
**Label text color meaning**:
- **White text**: Clean trend (high confidence)
- **Yellow text**: Trend transition (moderate caution)
---
### 🛡️ STEP 3: Final Confirmation with Bar Color
**Bar color shows market state**
```
🔴 Red bar: BUY zone (buying is favored)
🟢 Green bar: SELL zone (selling is favored)
⚪ White bar: Neutral (wait and see)
```
---
## Detailed Usage
### 📊 Understanding the Chart
#### 1. Labels (Market Structure Changes)
```
(1.CHoCH) / (a.CHoCH) : Trend reversal
(2.SiMS) / (b.SiMS) : Momentum confirmation
(3.BoMS) / (c.BoMS) : Trend continuation
```
#### 2. Boxes (Institutional Order Zones)
```
📦 Blue boxes: Bullish OB (buy orders accumulated)
📦 Red boxes: Bearish OB (sell orders accumulated)
📦 Black transparent boxes: Liquidity Sweep
```
**How to use Order Blocks**:
- Function as support/resistance
- Signals within OB have higher reliability
- Use for stop-loss placement
#### 3. Lines (Trends and Support/Resistance)
```
━━━ Red lines: EMA20, EMA50, EMA100 (short to mid-term trends)
━━━ Blue lines: 60min NPR/BB bands (support/resistance)
```
#### 4. Bar Colors (Filter 6)
```
Bar color = Real-time market state
🔴 Red: Buying is favored
🟢 Green: Selling is favored
⚪ White: Neutral
```
---
### 🎯 Practical Trading Flow
#### 📍 Preparation Phase
```
1. Open chart (recommended: 5min or 15min)
2. Add Trend Gazer to chart
3. Start in observation mode (don't enter yet)
```
#### 📍 Entry Decision
```
✅ CHoCH confirms direction → Uptrend starting
✅ LS Bounce Signal "Long@ HL only" appears
→ Entry point candidate
✅ Bar turns red → Market supports buying
→ Entry decision 🎯
✅ Place stop below nearest Order Block (blue box)
```
#### 📍 Exit Decision
```
🔴 Opposite LS Bounce Signal "Short@ LH only" appears
→ Consider taking profit
🔴 Bar turns green
→ Potential trend reversal, review position
🔴 Stop loss hit
→ Exit with loss
```
---
### 💡 Tips for Higher Win Rate
#### ✅ DO's
```
1. Enter AFTER CHoCH appears
2. Prioritize white-text LS Bounce Signals
3. Check higher timeframe (1H or Daily) trend
4. Emphasize signals within Order Blocks
5. Use bar color as final confirmation
```
#### ❌ DON'Ts
```
1. Enter before CHoCH → No clear direction
2. Enter only on yellow text → Unstable transition period
3. Ignore bar color → Trading against market state
4. Don't check Order Blocks → Unclear support/resistance
5. Enter same direction consecutively → Overtrading
```
---
## Settings Customization
### 🔧 How to Open Settings
```
1. Right-click on indicator name on chart
2. Select "Settings..."
3. Settings panel opens
```
---
### 📋 Recommended Setting Profiles
#### 🔰 Beginner Settings (Simple)
**Goal**: Reduce noise, show only important signals
```
【FILTERS】
✅ Bonus Filter: ON
✅ Filter 6 (OB/BB/NPR Zone Filter): ON
❌ Direction Filter: OFF
❌ Liquidation Reversal Filter: OFF
❌ ICT Market Structure Filter: OFF
❌ EMA Trend Filter: OFF
❌ OB/FVG Filter 1: OFF
❌ OB/FVG Filter 2: OFF
【SIGNALS】
✅ Signal 0 (Bonus): ON
✅ Signal 1 (VWC Change): ON
✅ Signal 2 (Liq Rev): ON
❌ Signal 3 (LS): OFF (complex alone)
❌ Signal 4 (LS Break): OFF
❌ Signal 5 (OB+LS NPR): OFF
❌ Signal 6 (OB+LS EMA): OFF
【LS BOUNCE SIGNAL】
✅ Exclude EMA50 from touch detection: OFF
❌ Only show when EMA fills are mixed: OFF
```
**What happens with this setup**:
- Only Bonus (black background) signals display
- LS Bounce Signals clearly visible
- Noisy signals filtered out
---
#### 💪 Intermediate Settings (Balanced)
**Goal**: Enable key filters for better accuracy
```
【FILTERS】
✅ Bonus Filter: ON
✅ Filter 6 (OB/BB/NPR Zone Filter): ON
✅ ICT Market Structure Filter: ON
❌ Direction Filter: OFF
❌ Liquidation Reversal Filter: OFF
❌ EMA Trend Filter: OFF
❌ OB/FVG Filter 1: OFF
❌ OB/FVG Filter 2: OFF
【SIGNALS】
✅ Signal 0 (Bonus): ON
✅ Signal 1 (VWC Change): ON
✅ Signal 2 (Liq Rev): ON
✅ Signal 3 (LS): ON
❌ Signal 4 (LS Break): OFF
❌ Signal 5 (OB+LS NPR): OFF
❌ Signal 6 (OB+LS EMA): OFF
【LS BOUNCE SIGNAL】
✅ Exclude EMA50 from touch detection: OFF
❌ Only show when EMA fills are mixed: OFF
```
**What happens with this setup**:
- Signals only after CHoCH (trend confirmed)
- Filter 6 changes bar colors
- Liquidity Sweeps also displayed
---
#### 🚀 Advanced Settings (Full Utilization)
**Goal**: Master all features
```
【FILTERS】
✅ Bonus Filter: ON
✅ Filter 6 (OB/BB/NPR Zone Filter): ON
✅ ICT Market Structure Filter: ON
✅ Direction Filter: ON
✅ EMA Trend Filter: ON
❌ Liquidation Reversal Filter: OFF (optional)
✅ OB/FVG Filter 1: ON
✅ OB/FVG Filter 2: ON
【SIGNALS】
✅ All ON
【LS BOUNCE SIGNAL】
✅ Exclude EMA50 from touch detection: ON (reduce EMA50 noise)
✅ Only show when EMA fills are mixed: ON (show only transition zones)
```
**What happens with this setup**:
- Fewer signals (precision-focused)
- Multiple confirmations greatly reduce false signals
- Only signals confirmed by trend, momentum, and zones
---
### 🎨 Display Customization
#### Change Label Size
```
【BUY/SELL SIGNAL APPEARANCE】
→ "BUY/SELL Label Size"
→ Choose from: tiny / small / normal / large / huge
Recommended: small (default)
```
#### Order Block Display Settings
```
【ORDER BLOCK (OB) SETTINGS】
✅ Show Current TF OB: Current timeframe OB
✅ Show 1min OB: 1-minute OB
✅ Show 5min OB: 5-minute OB
✅ Show 15min OB: 15-minute OB
Recommended: Only 15min OB ON (simple)
```
#### Liquidity Sweep Display
```
【LIQUIDITY SWEEPS SETTINGS】
→ "Sweep Length": Sensitivity (small=frequent, large=selective)
→ "Sweep Option": Standard / Maximum
Recommended: Length=40, Option=Standard
```
#### NPR/BB Bands Display
```
【NPR (NON-REPAINT STDEV) SETTINGS】
✅ Display 60min NPR Bands: 60-minute support/resistance
❌ Display Current TF NPR Bands: Current timeframe (optional)
Recommended: Only 60min ON
```
---
### ⚙️ Advanced Settings
#### Fine-tune Filter 6
```
【FINAL FILTERS】
→ "Enable Filter 6 (OB/BB/NPR Zone Filter)"
When ON:
- Bars color-coded red/green/white
- Behavior at OB, NPR/BB touches controlled
```
#### LS Bounce Signal Adjustments
```
【LS BOUNCE SIGNAL】
→ "Exclude EMA50 from touch detection"
OFF: Detect NPR/BB/EMA50 (all 3)
ON: Detect NPR/BB only (exclude EMA50)
→ "Only show when EMA fills are mixed"
OFF: Show all LS Bounce Signals
ON: Show only transition zone signals (yellow text)
```
#### MTF (Multi-Timeframe) Control
```
【ORDER BLOCK (OB) SETTINGS】
→ "Disable MTF on 1hr+ Charts"
ON: Disable MTF on 1H+ (save memory)
OFF: MTF enabled on all timeframes
Recommended: ON (unnecessary on larger timeframes)
```
---
### 🎯 Purpose-Based Configuration Guide
#### 🔍 Goal 1: Reduce Signal Count
```
✅ Bonus Filter: ON
✅ ICT Market Structure Filter: ON
✅ Filter 6: ON
✅ All Signals OFF, only Signal 0 ON
```
#### 🔍 Goal 2: Get More Signals
```
❌ All Filters OFF
✅ All Signals ON
```
#### 🔍 Goal 3: Trend Following Only
```
✅ ICT Market Structure Filter: ON
✅ Direction Filter: ON
✅ EMA Trend Filter: ON
```
#### 🔍 Goal 4: Counter-Trend Trading
```
✅ LS Bounce Signal: ON
✅ Filter 6: ON
❌ ICT Market Structure Filter: OFF
```
#### 🔍 Goal 5: Day Trading (5-15min charts)
```
✅ Show 15min OB: ON
✅ Display 60min NPR Bands: ON
✅ LS Bounce Signal: ON
❌ Show 1min/5min OB: OFF
```
#### 🔍 Goal 6: Scalping (1-5min charts)
```
✅ Show 5min OB: ON
✅ Show 15min OB: ON
✅ Display 60min NPR Bands: ON
✅ All Signals: ON
```
---
### 💾 Saving and Loading Settings
#### Save Settings
```
1. Click "..." in top-right of Settings screen
2. Select "Save as default"
→ Same settings auto-applied next time
```
#### Reset Settings
```
1. Click "..." in top-right of Settings screen
2. Select "Reset settings"
→ Return to default settings
```
---
## Why Combine Multiple Features?
### 🎯 Problem: Single Indicator Limitations
Common trader problems:
```
❌ RSI alone → Trade against trend, lose
❌ Moving Average alone → Late entry timing
❌ Support/Resistance alone → Caught by false breakouts
```
**Markets are complex**. One angle isn't enough.
---
### 💡 Solution: Multi-Angle Integrated Approach
#### 1️⃣ Structure × Zone × Momentum
```
📐 Structure (ICT CHoCH)
→ "Which direction is likely?"
📦 Zone (OB/NPR/BB)
→ "Where will price react?"
💨 Momentum (EMA/VWC)
→ "Is there momentum now?"
```
**When all 3 align = Highest win-rate timing**
---
#### 2️⃣ Multi-Timeframe Analysis
```
Big picture: Confirm Daily direction
Medium-term: Check 1H Order Blocks
Short-term: Time entry on 5min
```
**Short-term entries aligned with higher timeframes = Better win rate**
---
#### 3️⃣ Understanding Liquidity
```
🎣 Institutional strategy:
1. Intentionally move price opposite to stop out retail
2. Then, move in real direction
💡 Liquidity Sweep = Visualize this "trap"
→ Read institutional order flow
```
---
### 🧠 Integration Examples
#### Case 1: RSI Alone vs Integrated System
**Scenario**: RSI at 30 (oversold)
```
❌ RSI-only decision:
→ "Buy!"
→ But downtrend continues, loss 😢
✅ Trend Gazer:
CHoCH check → Still downtrend ❌
Order Block → In Bearish OB ❌
LS Bounce → SHORT signal only ❌
→ Skip or SHORT
→ Avoid loss ✅
```
**Result**: Multiple filters block wrong entry
---
#### Case 2: LS Bounce Signal 2-Stage Logic
**Scenario**: Price touches 60min NPR lower band
```
🔍 Traditional method:
Touched → Buy!
→ But price continues down 😢
✅ Trend Gazer:
Stage 1: NPR touch + red bar → Flag ON
Stage 2: EMA20 crosses above EMA50 → Confirm bounce
→ Now "Long@ HL only" displays
→ Entry → Success ✅
```
**Result**: Not just "touch" but "touch + bounce confirmation" improves accuracy
---
### 🎓 Progressive Learning Design
This indicator is designed for **beginners to advanced**:
```
📖 Beginner (Month 1):
Use only CHoCH + LS Bounce Signal
→ Learn trend and entry points
📖 Intermediate (Months 2-3):
Add Order Block + Bar Color
→ Learn support/resistance and filtering
📖 Advanced (Month 6+):
Master all features
→ Read institutional order flow
```
**Ultimate goal**: Indicator becomes confirmation tool. Your market sense becomes primary.
---
### 🔬 Technical Advantages
#### 1. Non-Repaint STDEV (NPR)
```
Normal Bollinger Bands:
→ Past data changes (repaints)
→ Inaccurate backtesting
NPR:
→ Past data doesn't change (non-repaint)
→ Reliable verification possible
```
#### 2. 2-Stage Signal Logic
```
Traditional: Condition met → Immediate signal
→ Many false signals
Trend Gazer: Condition1 → Flag ON → Condition2 → Signal
→ Confirmation step improves accuracy
```
#### 3. Alternating Filter
```
Problem: Same-direction signals spam
→ Overtrading
Solution: LONG → SHORT → LONG alternating only
→ Prevent unnecessary entries
```
---
### 💎 Conclusion: Why Integration?
```
Single indicator = "Partial truth"
Integrated system = "3D market perspective"
```
**Markets are multifaceted**. One angle isn't enough.
Trend Gazer **integrates multiple screens pros watch simultaneously into ONE**,
allowing beginners to read charts with institutional perspective.
---
## FAQ
### ❓ Q1: Which timeframe is best?
**A**: Depends on trading style
```
Scalping: 1min ~ 5min
Day Trading: 5min ~ 15min
Swing: 1H ~ 4H
```
**Important**: LS Bounce Signal only works on 30min and below.
---
### ❓ Q2: Too many signals, confused
**A**: Enable filters
```
【Recommended Settings】
✅ Bonus Filter: ON
✅ Filter 6: ON
✅ ICT Market Structure Filter: ON
→ Show only Signal 0
```
This significantly reduces signal count.
---
### ❓ Q3: No CHoCH appearing, what to do?
**A**: Wait or check higher timeframe
```
Method 1: Wait for CHoCH (recommended)
Method 2: Check higher timeframe (e.g., Daily) for trend
Method 3: Disable ICT Filter (not recommended)
```
**When trend is unclear, sitting out is also strategy**.
---
### ❓ Q4: LS Bounce Signal not appearing
**A**: Checkpoints
```
1. Are you on 30min or below chart?
→ Doesn't show on 1H+
2. Are NPR/BB bands displayed?
→ Check Settings "Display 60min NPR Bands"
3. Is EMA50 excluded?
→ If "Exclude EMA50" is ON, EMA50 signals won't show
```
---
### ❓ Q5: Bar color not changing?
**A**: Check Filter 6
```
Settings → FINAL FILTERS
→ Confirm "Enable Filter 6 (OB/BB/NPR Zone Filter)" is ON
If ON but still not changing:
→ Current price may be outside OB/NPR/BB zones
```
---
### ❓ Q6: Too many Order Blocks, hard to see
**A**: Narrow down displayed OBs
```
Settings → ORDER BLOCK (OB) SETTINGS
Recommended:
❌ Show Current TF OB: OFF
❌ Show 1min OB: OFF
❌ Show 5min OB: OFF
✅ Show 15min OB: ON (only this)
```
---
### ❓ Q7: How to improve win rate?
**A**: Thorough multiple confirmations
```
Checklist:
✅ CHoCH appeared
✅ LS Bounce Signal (white text)
✅ Bar color matches (red bar=LONG, green bar=SHORT)
✅ Signal within Order Block
✅ Aligns with higher timeframe trend
Enter ONLY when all align
```
---
### ❓ Q8: Want to practice on demo
**A**: Recommended practice method
```
Week 1: Observation only
→ Watch signals and chart movement
→ Resist entering
Weeks 2-3: Keep records
→ Screenshot when signal appears
→ Record subsequent movement
Week 4+: Start demo trading
→ Start with small amounts
→ Continue keeping records
```
---
### ❓ Q9: Are there alert features?
**A**: Yes, multiple alerts available
```
Setup method:
1. Right-click indicator on chart
2. Select "Add Alert..."
3. Choose from:
- ANY ALERT: BUY/SELL Signals
- BUY ONLY ALERT
- SELL ONLY ALERT
- MS UP / MS DOWN
- BAR COLOR: RED / LIME
- LS BOUNCE: LONG / SHORT Signal
```
---
### ❓ Q10: Works on other markets?
**A**: Yes, works on all markets
```
✅ Cryptocurrency (BTC, ETH, etc.)
✅ Forex (EUR/USD, USD/JPY, etc.)
✅ Stocks (individual stocks, indices)
✅ Futures (oil, gold, etc.)
```
Works on any market with price and volume data.
---
## 📋 Disclaimer
### ⚠️ Important Notice
This indicator is for **educational and informational purposes only**.
```
❌ NOT investment advice
❌ Does NOT guarantee profits
❌ Past results do NOT guarantee future performance
```
### Risk Warning
```
⚠️ Trading involves substantial risk
⚠️ Only trade with funds you can afford to lose
⚠️ Practice extensively on demo account before live trading
⚠️ Make your own informed decisions and act at your own risk
```
---
## 📞 Support
### Feedback & Questions
Feel free to ask questions in TradingView comments section.
### Bug Reports
Please report with specific details (timeframe, symbol, screenshots).
---
**Author**: rasukaru666
**License**: Mozilla Public License 2.0
**Last Updated**: December 2025
**Version**: Latest
---
**Thank you for using Trend Gazer!**
**Happy Trading! 📈**
---------------
