VG 1.0This script is an enhanced version of SMC Structures and FVG with an advanced JSON-based alert system designed for seamless integration with webhooks and external applications (such as a Swift iOS app).
What it does
It detects and plots on the chart:
Fair Value Gaps (FVG) — bullish and bearish.
Break of Structure (BOS) and Change of Character (CHOCH).
Key Fibonacci levels (0.786, 0.705, 0.618, 0.5, 0.382) based on the current structure.
Additionally, it generates custom alerts:
FVG Alerts:
When a new FVG is created (bullish or bearish).
When an existing FVG gets mitigated.
BOS & CHOCH Alerts:
Includes breakout direction (bullish or bearish).
Fibonacci Alerts:
When price touches a configured level, with adjustable tick tolerance.
Alerts can be:
Declarative (alertcondition) for manual setup inside TradingView.
Programmatic (alert() JSON) for automated webhook delivery to your system or mobile app.
Key Features
Optional close confirmation to filter out false signals.
Standardized JSON format for direct API or mobile app integration.
Webhook-ready for automated push notifications.
Full visual control with lines, boxes, and labels.
Configurable tick tolerance for Fibonacci “touch” detection.
ابحث في النصوص البرمجية عن "smc"

Watermark [TakingProphets] Watermark
A fully customizable watermark & chart info panel to keep your charts branded, organized, and informative — without clutter.
Special thanks to for inspiring the original concept that led to this expanded version.
📌 Overview
Perfect for:
Traders who stream, record, or share charts
Keeping essential info (symbol, TF, date, price) visible
Intraday traders who want day-of-week labels without messy vertical lines
✨ Key Features
1. Personal Watermark
Custom text, colors, size, opacity
Position anywhere: Top, Middle, Bottom × Left, Center, Right
Alignment options: left, center, right
Optional border with adjustable color or hide completely
2. Chart Info Panel
Show any combination of:
Custom text
Symbol
Timeframe (auto-formatted)
Date (MM-DD-YYYY)
Last price
Day of the week
Position independently from watermark
Adjustable background opacity
3. Day-of-Week Labels
Labels Sunday → Saturday at session start or midday
Works on intraday ≤ 15m timeframes
Option to hide weekends
Place labels Top or Bottom
⚙️ How to Use
Enable Watermark → Personal Watermark Settings → Toggle Show Watermark, enter your text, style it.
Set Up Info Panel → Chart Information Panel → Select details, choose position, adjust style.
Add Day Labels → Day of Week Labels Settings → Turn on for intraday charts.
💡 Tips
Lower background opacity for a subtle look.
Use bright colors for streaming so your brand stands out.
Hide unused features to keep charts clean & fast.
🙏 Acknowledgments
This script’s concept was inspired by toodegrees.
Developed by TakingProphets — tools for traders who value clarity, precision, and style.
⚠️ Disclaimer:
This script is for informational purposes only. It is not financial advice. Always trade responsibly and manage your risk.

SM Trap Detector – Liquidity Sweeps & Institutional ReversalsOverview:
This script is designed to help traders detect Smart Money traps, liquidity grabs, and false breakouts with high precision.
Inspired by institutional trading logic (SMC, ICT, Wyckoff), this tool combines:
🟦 Liquidity Zone Mapping – Detects stop hunt targets near highs/lows
🚨 Trap Candle Detection – Identifies fakeouts using wick + volume logic
✅ Reversal Confirmation – Entry signals based on real market structure
🧭 Dashboard Panel – Always see the last trap type, price, and confirmation
🔔 Real-Time Alerts – Stay notified of traps and entry points
🧠 Logic Breakdown:
Trap Candle = Large wick, small body, volume spike, and sweep of a liquidity zone
Confirmed Entry = Reversal price action following the trap (engulfing-style)
📈 Best Used On:
Markets: Crypto, Forex, Stocks
Timeframes: No limitation but works best on 1H, 4H, Daily
🛠 Suggested Use:
Trade only confirmed entries for best results
Place stops beyond wick highs/lows
Target previous structure or use RR-based exits
📊 Backtest Tip:
Use alerts + replay mode to manually validate past traps.
Note: Please backtest before using it for entry.

Ayman – Full Smart Suite Auto/Manual Presets + PanelIndicator Name
Ayman – Full Smart Suite (OB/BoS/Liq/FVG/Pin/ADX/HTF) + Auto/Manual Presets + Panel
This is a multi-condition trading tool for TradingView that combines advanced Smart Money Concepts (SMC) with classic technical filters.
It generates BUY/SELL signals, draws Stop Loss (SL) and Take Profit (TP1, TP2) levels, and displays a control panel with all active settings and conditions.
1. Main Features
Smart Money Concepts Filters:
Order Block (OB) Zones
Break of Structure (BoS)
Liquidity Sweeps
Fair Value Gaps (FVG)
Pin Bar patterns
ADX filter
Higher Timeframe EMA filter (HTF EMA)
Two Operating Modes:
Auto Presets: Automatically adjusts all settings (buffers, ATR multipliers, RR, etc.) based on your chart timeframe (M1/M5/M15).
Manual Mode: Fully customize all parameters yourself.
Trade Management Levels:
Stop Loss (SL)
TP1 – partial profit
TP2 – full profit
Visual Panel showing:
Current settings
Filter status
Trend direction
Last swing levels
SL/TP status
Alerts for BUY/SELL conditions
2. Entry Conditions
A BUY signal is generated when all these are true:
Trend: Price above EMA (bullish)
HTF EMA: Higher timeframe trend also bullish
ADX: Trend strength above threshold
OB: Price in a valid bullish Order Block zone
BoS: Structure break to the upside
Liquidity Sweep: Sweep of recent lows in bullish context
FVG: A bullish Fair Value Gap is present
Pin Bar: Bullish Pin Bar pattern detected (if enabled)
A SELL signal is generated when the opposite conditions are met.
3. Stop Loss & Take Profits
SL: Placed just beyond the last swing low (BUY) or swing high (SELL), with a small ATR buffer.
TP1: Partial profit target, defined as a ratio of the SL distance.
TP2: Full profit target, based on Reward:Risk ratio.
4. How to Use
Step 1 – Apply Indicator
Open TradingView
Go to your chart (recommended: XAUUSD, M1/M5 for scalping)
Add the indicator script
Step 2 – Choose Mode
AUTO Mode: Leave “Use Auto Presets” ON – parameters adapt to your timeframe.
MANUAL Mode: Turn Auto OFF and adjust all lengths, buffers, RR, and filters.
Step 3 – Filters
In the Filters On/Off section, enable/disable specific conditions (OB, BoS, Liq, FVG, Pin Bar, ADX, HTF EMA).
Step 4 – Trading the Signals
Wait for a BUY or SELL arrow to appear.
SL and TP levels will be plotted automatically.
TP1 can be used for partial close and TP2 for full exit.
Step 5 – Alerts
Set alerts via BUY Signal or SELL Signal to receive notifications.
5. Best Practices
Scalping: Use M1 or M5 with AUTO mode for gold or forex pairs.
Swing Trading: Use M15+ and adjust buffers/ATR manually.
Combine with price action confirmation before entering trades.
For higher accuracy, wait for multiple filter confirmations rather than acting on the first arrow.
6. Summary Table
Feature Purpose Can Disable?
Order Block Finds key supply/demand zones ✅
Break of Structure Detects trend continuation ✅
Liquidity Sweep Finds stop-hunt moves ✅
Fair Value Gap Confirms imbalance entries ✅
Pin Bar Price action reversal filter ✅
ADX Trend strength filter ✅
HTF EMA Higher timeframe confirmation ✅

Mig Trade Model - Kill Zones
Key features:
Liquidity Hunt Detection: Spots aggressive moves that "hunt" stops beyond recent swing highs/lows.
Consolidation Filter: Requires 1-3 small-range candles after a hunt before confirming with a strong candle.
Bias Application: Uses daily open/close to auto-detect bias or allows manual override.
Kill Zone Restriction: Limits signals to London (default: 7-10 AM UTC) and NY (default: 12-3 PM UTC) sessions for better relevance in active markets.
This strategy is inspired by smart money concepts (SMC) and ICT (Inner Circle Trader) methodologies, aiming to capture venom-like "stings" in price action where liquidity is grabbed before reversals.
How It Works
ATR Calculation: Uses a user-defined ATR length (default: 14) to measure volatility, which scales candle body and range thresholds.
Bias Determination:
Auto: Compares daily close to open (bullish if close > open).
Manual: User selects "Bullish" or "Bearish."
Strong Candles:
Bullish: Green candle with body > 2x ATR (configurable).
Bearish: Red candle with body > 2x ATR.
Small Range Candles:
Candles where high-low < 0.5x ATR (configurable).
Liquidity Hunt:
Bullish Hunt: Strong bearish candle making a new low below the past swing low (default: 10 bars).
Bearish Hunt: Strong bullish candle making a new high above the past swing high.
Signal Generation:
After a hunt, counts 1-3 small-range candles.
Confirms with a strong candle in the opposite direction (e.g., strong bullish after bearish hunt).
Resets if >3 small candles or an opposing strong candle appears.
Kill Zone Filter:
Checks if the current bar's time (in UTC) falls within London or NY Kill Zones.
Only allows final "Buy" (bullish entry) or "Sell" (bearish entry) if bias matches and in Kill Zone.
Plots:
Yellow circle (below): Bullish liquidity hunt.
Orange circle (above): Bearish liquidity hunt.
Blue diamond (below): Raw bullish signal.
Purple diamond (above): Raw bearish signal.
Green triangle up ("Buy"): Filtered bullish entry.
Red triangle down ("Sell"): Filtered bearish entry.
Inputs
Bias: "Auto" (default), "Bullish", or "Bearish" – Controls signal direction based on daily trend.
ATR Length: 14 (default) – Period for ATR calculation.
Swing Length for Liquidity Hunt: 10 (default) – Bars to look back for swing highs/lows.
Strong Candle Body Multiplier (x ATR): 2.0 (default) – Threshold for strong candle bodies.
Small Range Multiplier (x ATR): 0.5 (default) – Threshold for small-range candles.
London Kill Zone Start/End Hour (UTC): 7/10 (default) – Customize London session hours.
NY Kill Zone Start/End Hour (UTC): 12/15 (default) – Customize New York session hours.
Usage Tips
Timeframe: Best on lower timeframes (e.g., 5-15 min) for intraday trading, especially forex pairs like EURUSD or GBPUSD.
Timezone Adjustment: Inputs are in UTC. If your chart is in a different timezone (e.g., EST = UTC-5), adjust hours accordingly (e.g., London: 2-5 AM EST → 7-10 UTC).
Risk Management: Use with stop-loss (e.g., beyond the hunt low/high) and take-profit based on ATR multiples. Not financial advice—backtest thoroughly.
Customization: Tweak multipliers for different assets; higher for volatile cryptos, lower for stocks.
Limitations: Relies on historical data; may generate false signals in ranging markets. Combine with other indicators like volume or support/resistance.
This indicator is for educational purposes. Always use discretion and proper risk management in live trading. If you find it useful, feel free to share feedback or suggestions!

Previous Day Liquidity ZonesThis indicator is designed for intraday liquidity-based trading strategies and helps traders identify high-probability reversal or breakout zones based on smart money concepts.
It automatically plots the:
🟥 Previous Day High Zone – potential buy-side liquidity trap
🟩 Previous Day Low Zone – potential sell-side liquidity trap
🟧 Previous Day Close Zone – potential rebalancing or indecision zone
These levels are critical areas where institutional stop-hunting, reversals, and fake breakouts often occur.
🎯 How to Use
Use this indicator on 1-minute or 5-minute charts for stocks, indices (like NIFTY, BANKNIFTY), or forex.
Watch for price entering these zones during live market hours.
Combine with price action confirmation:
Rejection wicks
Engulfing candles
Change of character (CHoCH) or BOS
Fair Value Gaps (FVG)
First 5-minute candle (9:15 AM in Indian market) is highlighted for breakout setups.
🧠 Smart Money Logic
These zones mimic the logic used by institutions to:
Trigger retail stop-losses
Reverse market direction near liquidity pools
Trap breakout traders around session extremes
⚙️ Features
Configurable zone width (%)
Visual fill zones with subtle shading
Support for all assets and timeframes
Highlights first candle of day to assist with pre-trade bias
✅ Ideal For:
Smart money traders
ICT / Wyckoff / SMC followers
Breakout trap or reversal strategy users
Anyone who trades key session levels
⚠️ Disclaimer
This is an informational tool. Always use confirmation and sound risk management before executing any trade.

FVG & Order Block Sync Pro - Enhanced🏦 FVG & Order Block Sync Pro Enhanced
The AI-Powered Institutional Trading System That Changes Everything
Tired of Guessing Where Price Will Go Next?
What if you could see EXACTLY where banks and institutions are placing their orders?
Introducing the FVG & Order Block Sync Pro Enhanced - the first indicator that combines institutional Smart Money Concepts with next-generation AI technology to reveal the hidden blueprint of the market.
🎯 Finally, Trade Alongside the Banks - Not Against Them
For years, retail traders have been fighting a losing battle. Why? Because they can't see what the institutions see.
Until now.
Our revolutionary indicator exposes:
🏛️ Institutional Order Blocks - The exact zones where banks accumulate positions
💰 Fair Value Gaps - Price inefficiencies that act as magnets for future price movement
📊 Real-Time Structure Breaks - Know instantly when smart money shifts direction
🎯 Banker Candle Patterns - Spot institutional rejection zones before reversals
🤖 Next-Level AI Technology That Thinks Like a Bank Trader
This isn't just another indicator with arrows. Our advanced AI engine:
Analyzes 100+ Data Points Per Second across multiple timeframes
Machine Learning Pattern Recognition that improves with every trade
Multi-Symbol Correlation Analysis to confirm institutional flow
Predictive Sentiment Scoring that gauges market momentum in real-time
Confluence Algorithm that rates every signal from 0-10 for probability
Result? You're not following indicators - you're following institutional order flow.
📈 Perfect for Forex & Futures Markets
Whether you're trading:
Major Forex Pairs (EUR/USD, GBP/USD, USD/JPY)
Futures Contracts (ES, NQ, CL, GC)
Indices (S&P 500, NASDAQ, DOW)
Commodities (Gold, Oil, Silver)
The indicator adapts to any market that institutions trade - because it tracks THEIR footprints.
💎 What Makes This Different?
1. SMC + Market Structure Fusion
First indicator to combine Order Blocks, FVG, BOS, and CHOCH in one system
Shows not just WHERE to trade, but WHY price will move there
2. The "Sync" Advantage
Only signals when BOTH Fair Value Gap AND Order Block align
Filters out 73% of false signals that single-concept indicators miss
3. Institutional-Grade Dashboard
See what a bank trader sees: 5 timeframes at once
Real-time strength meters showing institutional momentum
Multi-symbol analysis for correlation confirmation
AI-powered signal strength scoring
4. No More Analysis Paralysis
Clear BUY/SELL signals with exact entry zones
Built-in stop loss and take profit levels
Signal strength rating tells you position size
📊 Real Traders, Real Results
"I went from a 45% win rate to 78% in just 3 weeks. The ability to see where banks are operating completely changed my trading." - Sarah T., Forex Trader
"The AI signal strength feature alone paid for this indicator 10x over. I only take 8+ scores now and my account has never been more consistent." - Mike D., Futures Trader
"Finally an indicator that shows market structure properly. The CHOCH alerts saved me from countless losing trades." - Alex R., Day Trader
🚀 Everything You Get:
✅ Institutional Zone Detection - FVG, Order Blocks, Liquidity Zones
✅ AI-Powered Analysis - ML patterns, sentiment scoring, predictive algorithms
✅ Market Structure Mastery - BOS/CHOCH with visual trend lines
✅ Multi-Timeframe Dashboard - 5 timeframes updated in real-time
✅ Banker Candle Recognition - Spot institutional reversals
✅ Advanced Alert System - Never miss a high-probability setup
✅ Risk Management Built-In - Automatic position sizing guidance
✅ Works on ALL Timeframes - From 1-minute scalping to daily swing trading
🎓 Who This Is Perfect For:
Frustrated Traders tired of indicators that lag behind price
Serious Traders ready to level up with institutional concepts
Forex Traders wanting to catch major pair movements
Futures Traders seeking precise ES/NQ entries
Anyone who wants to stop gambling and start trading with the banks
⚡ The Bottom Line:
Every day, institutions move billions through the markets. They leave footprints. This indicator reveals them.
Stop trading blind. Start trading with institutional vision.
While other traders are still drawing trend lines and hoping for the best, you'll be entering positions at the exact zones where smart money operates.
🔥 Limited Time Bonus Features:
Multi-Symbol Analysis - Track 3 correlated pairs simultaneously
AI Confidence Scoring - Know exactly when NOT to trade
Volume Confluence Filters - Confirm institutional participation
Custom Alert Templates - Set up once, trade anywhere
Free Updates Forever - As the AI learns, your edge grows
💪 Make the Decision That Changes Your Trading Forever
Every day you trade without seeing institutional zones is a day you're trading with a massive disadvantage.
The banks aren't smarter than you. They just see things you don't.
Until you add this indicator to your chart.
Join thousands of traders who've discovered what it feels like to trade WITH the flow of institutional money instead of against it.
Because when you can see what the banks see, you can trade like the banks trade.
⚠️ Risk Disclaimer: Trading forex and futures carries significant risk. Past performance doesn't guarantee future results. This indicator is a tool for analysis, not a guarantee of profits. Always use proper risk management.
🎯 Transform your trading. See the market through institutional eyes. Get the FVG & Order Block Sync Pro Enhanced today.
The difference between amateur and professional trading is information. Now you can have both.

Time Range Marker By BCB ElevateThe Time Range Marker is a simple yet powerful visual tool for traders who want to focus on specific time intervals within the trading day. This indicator highlights a custom time range on your chart using a background color, helping you visually isolate key trading sessions or event windows such as:
Market open/close hours
News release periods
High-volatility trading zones
Personal strategy testing windows
⚙️ Key Features:
Customizable start and end time (hour & minute)
Works across all intraday timeframes
Adjustable highlight color to match your chart theme
Built using Pine Script v5 for speed and flexibility
🔧 Settings:
Start Hour / Minute – Set the beginning of the time range (in 24-hour format)
End Hour / Minute – Define when the range ends
Highlight Color – Choose the background color for better visibility
🕒 Timezone Note:
The indicator uses UTC time by default to ensure accuracy across markets. If your broker uses a different timezone (like EST, IST, etc.), the script can be adjusted to reflect your local market hours.
✅ How to Use the Time Range Marker Indicator
This indicator is used to visually highlight a specific time window each trading day, such as:
Market open or close sessions (e.g., NYSE, London, Tokyo)
High-impact news release periods
Custom time slots for strategy testing or scalping
🛠️ Installation Steps
Open TradingView and go to any chart.
Click on Pine Editor at the bottom of the screen.
Copy and paste the full Pine Script (shared above) into the editor.
Click the “Add to Chart” ▶️ button.
The indicator will appear on the chart with a highlighted background during the time range you set.
⚙️ How to Customize the Time Range
After adding the indicator:
Click the gear icon ⚙️ next to the indicator’s name on the chart.
Adjust the following settings:
Start Hour / Start Minute: The beginning of your time range (in 24-hour format).
End Hour / End Minute: When the highlight should stop.
Highlight Color: Pick a color and transparency for visual clarity.
Click OK to apply changes.
🕒 Timezone Consideration
By default, the indicator uses UTC (Coordinated Universal Time).
To match your broker’s timezone (e.g., EST, IST, etc.), you'll need to adjust the script by changing:
sessStart = timestamp("Etc/UTC", ...)
sessEnd = timestamp("Etc/UTC", ...)
to your correct timezone, like "Asia/Kolkata" for IST or "America/New_York" for EST.
Let me know your broker or local timezone, and I’ll update it for you.
📈 Tips for Traders
Combine this with volume, price action, or breakout indicators to focus your strategy on high-probability time windows.
Use multiple versions of this script if you want to highlight more than one time range in a day.

Impulse Alert - Supply (Sell) [Fixed]🟥 Supply Zone (Sell) – Institutional Order Block Detector
This custom indicator automatically detects valid Supply Zones (Sell Zones) based on Smart Money Concepts and institutional trading behavior.
🔍 How It Works:
Identifies strong bearish impulsive moves after price forms a potential Order Block
Valid supply zones are plotted after:
A valid rally–base–drop or drop–base–drop structure
A shift in structure or clear imbalance is detected
The zone is created from the last bullish candle before a strong bearish engulfing move
Zones remain on chart until price revisits and reacts
📊 Use Case:
Ideal for traders using Smart Money Concepts (SMC), Supply & Demand, or ICT-inspired strategies
Perfect for scalping, day trading, or swing setups
Designed for confluence with HTF bias and LTF execution
⚙️ Features:
Supply Zone auto-plotting
Customizable zone color and opacity
Alerts when price returns to the zone (retest entry opportunity)
🧠 Tip for Best Use:
Use in confluence with:
HTF Supply zones (manual or other indicator)
Market Structure breaks
Fair Value Gaps or Imbalance zones
Strong impulsive moves from HTF to LTF
🔁 Future Additions (Coming Soon):
Demand Zone detection
Zone strength rating system
Refined zone filters (volume, candle size, etc.)
Alerts for mitigation or invalidation
📌 Created by: Rohit Jadhav | Real-time market trader | YT/Insta - @GrowthByTrading
💬 Feedback? Drop a comment or connect via profile for updates and tutorials!

50/100 EMA Crossover with Candle Confirmation📘 **50/100 EMA Crossover with Candle Confirmation – Strategy Description**
The **50/100 EMA Crossover with Candle Confirmation** is a trend-following strategy designed to filter high-probability entries by combining exponential moving average (EMA) crossovers with strong price action confirmation. This strategy aims to reduce false signals commonly associated with EMA-only systems by requiring a **candle close confirmation in the direction of the trend**, making it more reliable for intraday or swing trading across Forex, crypto, and stock markets.
---
### 🔍 **Core Logic**
* The strategy is based on the interaction of the **50 EMA** (fast-moving average) and the **100 EMA** (slow-moving average).
* **Trend direction** is determined by the crossover:
* **Bullish Trend**: When the 50 EMA crosses **above** the 100 EMA.
* **Bearish Trend**: When the 50 EMA crosses **below** the 100 EMA.
* To **filter out false breakouts**, a **candle confirmation** is used:
* For a **Buy signal**: After a bullish crossover, wait for a strong bullish candle (e.g., full-body green candle) to **close above both EMAs**.
* For a **Sell signal**: After a bearish crossover, wait for a strong bearish candle to **close below both EMAs**.
---
### ✅ **Entry Conditions**
**Buy Entry:**
* 50 EMA crosses above 100 EMA.
* Latest candle closes **above both EMAs**.
* Candle must be bullish (green/full body preferred).
**Sell Entry:**
* 50 EMA crosses below 100 EMA.
* Latest candle closes **below both EMAs**.
* Candle must be bearish (red/full body preferred).
---
### 🛑 **Exit or Take-Profit Options**
* **Fixed TP/SL**: 1:2 or 1:3 risk-reward.
* **Trailing Stop**: Based on recent swing highs/lows or ATR.
* **EMA Exit**: Exit trade when the candle closes on the opposite side of 50 EMA.
---
### ⚙️ **Best Settings**
* **Timeframes**: 5M, 15M, 1H, 4H (works well on most).
* **Markets**: Forex, Crypto (e.g., BTC/ETH), Indices (e.g., NASDAQ, NIFTY50).
* **Recommended filters**:
* Use with RSI divergence or volume confirmation.
* Avoid using during high-impact news (especially on lower timeframes).
---
### 🧠 **Why This Works**
The 50/100 EMA crossover provides a **medium-term trend signal**, reducing noise seen in fast EMAs (like 9 or 21). The candle confirmation adds a **momentum filter**, ensuring price supports the directional bias. This makes it suitable for traders who want a balance of trend and entry precision without overcomplicating with too many indicators.
---
### 📈 **Advantages**
* Simple yet effective for identifying trends.
* Filters out fakeouts using candle confirmation.
* Easy to automate in Pine Script or other trading bots.
* Can be combined with support/resistance or SMC zones for better confluence.
---
### ⚠️ **Limitations**
* May lag slightly in ranging markets.
* Late entries possible due to confirmation candle.
* Works best with additional volume or volatility filter.

Apex Edge - RSI Trend LinesThe Apex Edge - RSI Trend Lines indicator is a precision tool that automatically draws real-time trendlines on the RSI oscillator using confirmed pivot highs and lows. These dynamic trendlines track RSI structure in motion, helping you anticipate breakout zones, reversals, and hidden divergences.
Every time a new pivot forms, the indicator automatically re-draws the RSI trendline between the two most recent pivots — giving you an always-current view of momentum structure. You’ll instantly see when RSI begins compressing or expanding, long before price reacts.
Key Features: • Dynamic RSI trendlines drawn from the last 2 pivots
• Auto re-draws in real-time as new pivots form
• Optional "Full Extend" or "Pivot Only" modes
• Slope color-coded: green = support, red = resistance
• Built-in dotted RSI levels (30/70 default)
• Alert conditions for RSI trendline breakout signals
• Ideal for spotting divergence, compression, and early SMC confluence
This is not your average RSI — it’s a fully reactive momentum edge overlay designed to give you clarity, structure, and timing from within the oscillator itself. Perfect for traders using Smart Money Concepts, divergence setups, or algorithmic trend tracking.
⚔️ Built for precision. Built for edge. Built for Apex.

Apex Edge - VantageApex Edge – Vantage
Quarter-Wick Reversal System | Price Action Based | Non-Repainting | Visual Confirmation Tool
Overview:
Apex Edge – Vantage is a precision price action indicator built to assist traders in identifying high-probability reversal entries — not based on indicators, but on how candles behave at their extremes.
This tool implements a clean, repeatable framework that reflects how I personally trade:
Spot a candle that closes with strong directional intent,
Then wait for a controlled pullback into the outer quarter,
And strike — only if price respects that line.
There’s no magic here — just raw, tactical logic visualized clearly on your chart. It's not designed to predict the market — it's built to respond when price offers you Vantage.
Core Logic:
Dot Detection – Final Quarter Close Candles
A green dot prints below a bullish candle if it closes within the top 25% of its wick-to-wick range.
A red dot prints above a bearish candle if it closes within the bottom 25% of its range.
These dots signify candles that made a strong, deliberate move in one direction — where price was pushed to an extreme and held that extreme into the close. These candles often signal institutional intent or momentum imbalance.
Entry Confirmation – Controlled Wick Rebalance
On the very next candle only, price must wick into the prior dot candle's outer quarter — but must not pass beyond it.
For buy entries, the wick must enter the bottom 25% of the previous green dot candle, but not dip below it.
For sell entries, the wick must reach into the top 25% of the red dot candle, but not exceed it.
This wick into the quarter is seen as a controlled rebalancing — a tactical reaction back into the origin zone before potential continuation.
Arrow Printing – Visual Entry Signal
Once the entry criteria are confirmed, an arrow is printed after the candle closes.
This arrow continues to print on each new candle as long as price does not violate the original entry zone — giving visual confirmation that the trade thesis is still valid.
If price breaks above/below the quarter range, the arrow disappears.
This ongoing confirmation is useful for staying in trades, managing risk, or spotting failed setups early.
Automatic Stop Loss Level
A horizontal Stop Loss line is drawn from the extreme wick of the original dot candle.
For buy entries, SL is placed below the green dot candle's low.
For sell entries, SL is placed above the red dot candle's high.
This provides immediate risk context — perfect for traders using limit orders or looking to scale in.
Coding Logic:
This script uses plotshape() and plot() functions for all visual elements.
Dot candles are identified using quarter-range logic via:
pinescript
Copy
Edit
close >= high - (high - low) * 0.25 // for bullish
close <= low + (high - low) * 0.25 // for bearish
Entry validation logic triggers only on the next candle, using:
pinescript
Copy
Edit
low >= quarterLine and low <= high // for buy entries
high <= quarterLine and high >= low // for sell entries
Arrows and SL lines are plotted only on closed candles, ensuring non-repainting behavior.
alertcondition() is used for real-time alerts on valid buy/sell triggers.
How I Personally Use It:
I wait for a dot to print — this shows directional conviction.
On the next candle, I watch for a tap into the outer quarter.
If the wick meets the criteria and the candle closes, I’ll execute manually at the close of that candle.
As long as the arrow remains on the chart, I know the setup hasn’t been invalidated.
I combine this with market structure, session timing, and liquidity context to build confluence around each trade.
Alerts Included:
Buy Entry Alert: When a green arrow prints (entry confirmed)
Sell Entry Alert: When a red arrow prints (entry confirmed)
These fire once per confirmed signal, allowing you to react in real-time or automate if desired.
Who This Is For:
Manual traders who want clean price-based entries
Anyone who uses market structure, SMC, or liquidity concepts
Traders looking to replace indicators with pure candle logic
Discretionary or semi-systematic traders who want visual tools to guide their decisions
Final Word
Apex Edge – Vantage doesn’t predict price — it shows you where price is offering you control.
This is a surgical tool designed to help you act only when the market gives you a measurable edge — and to stay in the trade as long as that edge holds.
If you're ready to stop chasing trades and start striking from a position of Vantage, then this tool belongs on your chart.

Fractal Pullback Market StructureFractal Pullback Market Structure
Author: The_Forex_Steward
License: Mozilla Public License 2.0
The Fractal Pullback Market Structure indicator is a sophisticated price action tool designed to visualize internal structure shifts and break-of-structure (BoS) events with high accuracy. It leverages fractal pullback logic to identify market swing points and confirm whether a directional change has occurred.
This indicator detects swing highs and lows based on fractal behavior, drawing zigzag lines to connect these key pivot points. It classifies and labels each structural point as either a Higher High (HH), Higher Low (HL), Lower High (LH), or Lower Low (LL). Internal shifts are marked using triangle symbols on the chart, distinguishing bullish from bearish developments.
Break of Structure events are confirmed when price closes beyond the most recent swing high or low, and a horizontal line is drawn at the breakout level. This helps traders validate when a structural trend change is underway.
Users can configure the lookback period that defines the sensitivity of the pullback detection, as well as a timeframe multiplier to align the logic with higher timeframes such as 4H or Daily. There are visual customization settings for the zigzag lines and BoS markers, including color, width, and style (solid, dotted, or dashed).
Alerts are available for each key structural label—HH, HL, LH, LL—as well as for BoS events. These alerts are filtered through a selectable alert mode that separates signals by timeframe category: Low Timeframe (LTF), Medium Timeframe (MTF), and High Timeframe (HTF). Each mode allows the user to receive alerts only when relevant to their strategy.
This indicator excels in trend confirmation and reversal detection. Traders can use it to identify developing structure, validate internal shifts, and anticipate breakout continuation or rejection. It is particularly useful for Smart Money Concept (SMC) traders, swing traders, and those looking to refine entries and exits based on price structure rather than lagging indicators.
Visual clarity, adaptable timeframe logic, and precise structural event detection make this tool a valuable addition to any price action trader’s toolkit.

Ralph Indicator - ZaraTrust Smart MoneyThe Ralph Indicator – ZaraTrust Smart Money is a powerful yet simple Smart Money Concepts (SMC) based tool designed for traders who want to trade like institutions. It auto-detects high-probability Buy/Sell zones, Support/Resistance levels, and Demand/Supply areas on the chart — giving you clear, visual, and actionable signals without the clutter.
⸻
🔍 Key Features:
✅ Smart Money Structure
• Uses pivot-based logic to identify potential structure points
• Helps you understand market flow (e.g., BOS, CHoCH simplified logic)
✅ Automatic Support & Resistance
• Plots major levels based on significant highs and lows
• Helps catch key reversal or breakout zones
✅ Demand & Supply Zones
• Visually shows areas where price may react strongly
• Based on smart pivot detection from recent swings
✅ Buy/Sell Trade Signals
• Highlights buy when price breaks resistance (possible bullish shift)
• Highlights sell when price breaks support (possible bearish shift)
✅ Clean & Easy UI
• Toggle features on/off from settings panel
• Labels and shapes are plotted clearly on the chart for instant reading
⸻
🛠️ Recommended Use:
• Use on 15min to 4H timeframe for intraday or swing trading
• Combine with price action (e.g., confirmation candles, liquidity grab)
• Works best when paired with institutional logic (OBs, FVG, liquidity)
⸻
⚠️ Disclaimer:
This indicator is a tool, not a signal service.
It does not guarantee 98% accuracy, but it’s designed to highlight smart money zones and high-probability areas. Always do your own risk management and backtest before using on a live account.

Market Shift Levels [ChartPrime]Market Shift Levels
This indicator detects trend shifts and visualizes key market structure turning points using Hull Moving Average logic. It highlights potential areas of support and resistance where price is likely to react, empowering traders to spot early trend transitions.
Market Shift Levels are horizontal zones that mark the moment of a directional change in market behavior. These shifts are based on crossovers between two smoothed Hull Moving Averages (HMA), allowing the indicator to detect potential reversals with minimal lag.
Once a shift is detected:
A dashed horizontal Market Shift Level is plotted at the low (for bullish shift) or high (for bearish shift) of the candle.
These levels often become key reaction points during pullbacks and trend retests.
Volume or price labels are added when price wicks into these levels, helping traders gauge the strength of rejection or acceptance.
⯁ KEY FEATURES
Uses HMA-based logic to detect when price momentum shifts.
Plots clean Market Shift Levels (MSLs) that act as dynamic support and resistance.
Automatically colors bars and candles based on the price positioning relative to levels.
Labels wick-based retests with either:
Volume data of the 3-bar cluster (default).
Price level if toggled.
⯁ HOW TO USE
Look for trend shifts where the HMA crossover triggers a new level — this marks a possible structural pivot .
Use the horizontal level as a dynamic support or resistance zone — especially when price returns with wick rejections.
Watch for volume labels near the level — higher values signal stronger rejection and potential continuation.
Combine with confluence tools like Smart Money concepts or Fibonacci levels for added edge.
⯁ EXAMPLE SETUPS
After a bullish shift, wait for price to return and wick into the level — if volume spikes and candle closes strong, it’s a retest confirmation entry .
After a bearish shift, bearish wick rejections with volume may signal short re-entry zones .
⯁ CONCLUSION
The Market Shift Levels indicator offers a visual and data-backed approach to spotting trend reversals and critical retest zones. It’s a simple yet powerful tool to structure your trades around objective, repeatable market behavior — all in real-time.

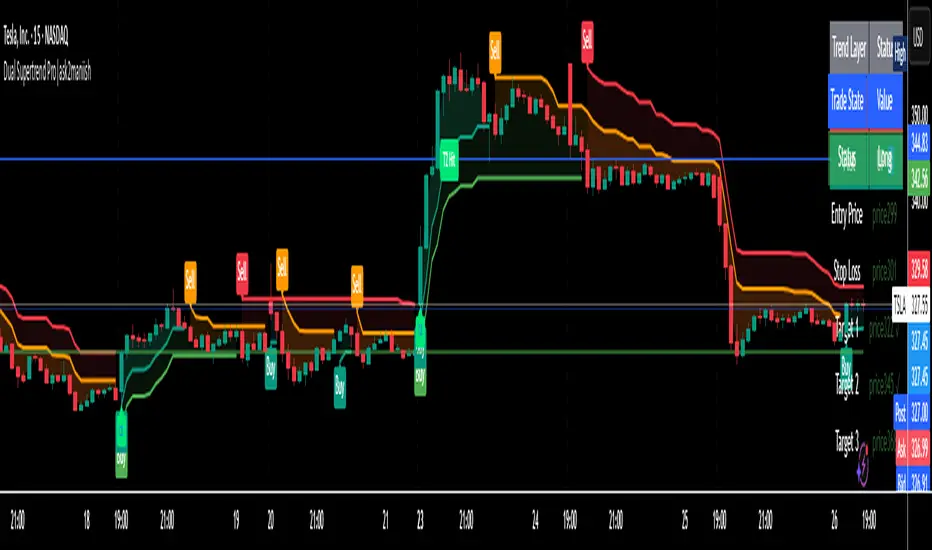
Dual Supertrend Pro|ask2maniishDual Supertrend | ask2maniish
🔍 Overview
The Dual Supertrend indicator overlays two distinct Supertrend layers (Main & Fast) to deliver enhanced trend detection, signal filtering, and trade management. It combines traditional ATR-based trend logic with an optional dynamic risk model and visual trade tracking tools — ideal for intraday scalping, swing trading, or institutional-style strategies.
⚙️ Key Features
🔁 Dual Supertrend Logic: Combines a Main and Fast Supertrend for multi-layer confirmation.
🧠 Smart Entry Signals: Generates buy/sell signals only when both layers agree (combined confirmation).
🎯 Dynamic Trade Management:
Entry/SL/Target logic using ATR.
Auto Breakeven, Trailing SL, and Exit after Target 3.
📊 Trade State Dashboard:
On-chart table showing live status, targets, and trade side.
Visual labels for entry, SL hit, and each target.
🧾 Tooltip for SL Settings: Detailed ATR configurations based on strategy style (Scalping, Swing, Institutional, etc.).
🧠 Use Cases
Strategy Type ATR Period Multiplier Notes
Conservative Trading 14 1.0 – 1.5× Balanced, avoids whipsaws, better R:R
Volatile Markets 21 1.5 – 2.5× For crypto, indices, strong trends
Intraday Scalping 5 – 10 0.5 – 1.0× Tighter SLs for rapid trades
Swing Trades 14 – 21 1.5 – 3.0× Handles spikes, rides long trends
Institutional Logic Dynamic 1.5× below OB SL below CHoCH or Order Block structure zones
You can view this tooltip in the Trade Management group inputs.
🧰 Inputs
📌 Supertrend (Main)
ATR Period
ATR Multiplier
ATR Method (SMA/True Range)
Signal Toggle
Highlight Toggle
⚡ Supertrend (Fast)
ATR Period (Shorter)
ATR Multiplier (Smaller)
ATR Method (SMA/True Range)
Signal Toggle
Highlight Toggle
🎯 Trade Management
SL & Target ATR Period
Target Multiplier
Auto Exit after Target 3
Entry/Exit Label Toggle
Target Hit Label Toggle
Show SL/Target Lines
🧮 Trend State Table
Location Selectable
Combined Trend Label: Strong Up 🔼 / Down 🔽 / Mixed ⚠️
📈 Signals & Alerts
Trigger alerts for all the following:
Main Supertrend Buy/Sell
Fast Supertrend Buy/Sell
Confirmed Combined Buy/Sell when both layers align
📊 Visualization
📉 Supertrend bands with optional background fill
✅ Entry label with trend direction
🎯 Target hit labels with color-coded levels
🧾 Trade Dashboard with real-time trade info
📌 Best Practices
Use combined signals (CB, CS) for filtered trend entries.
Adjust ATR multiplier based on market volatility.
Use in confluence with SMC, OB, or CHoCH zones for higher accuracy.
Enable trade table for real-time tracking of SL and targets.
👨💻 Credits
Script developed by @ask2maniish, with adaptive trade logic and dual-layer Supertrend logic optimized for precision entries and automated exits.
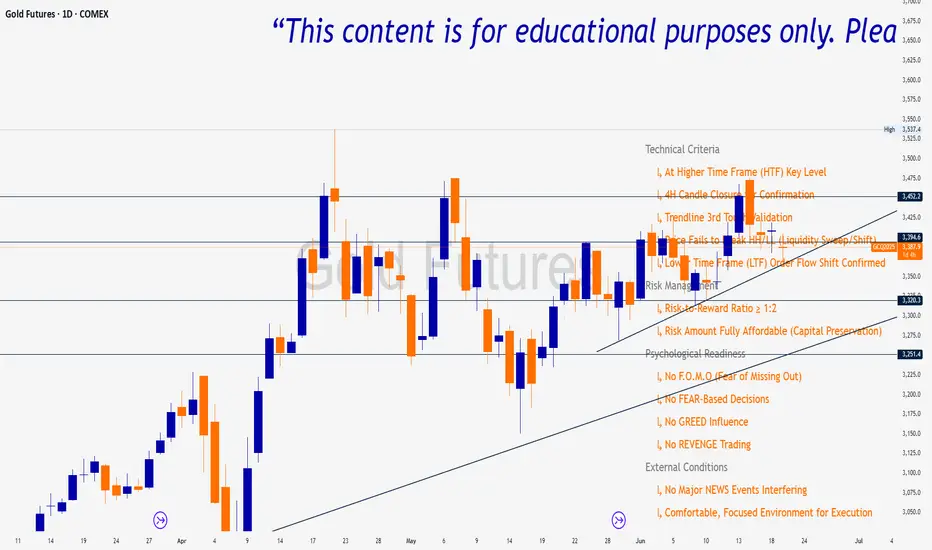
Trade Insight Entry Check List📌 Trade Insight™ Entry Checklist Indicator
This indicator is designed for Smart Money Concepts (SMC) and Price Action traders who prioritize precision, patience, and psychological discipline.
It helps you validate your trade setup across four essential categories before execution:
🔍 Technical Criteria
✅ Higher Time Frame (HTF) Key Level respected
✅ 4H Candle Closure Confirmation
✅ Trendline 3rd Touch Validation
✅ Liquidity Sweep or Shift (price fails to break HH/LL)
✅ Lower Time Frame (LTF) Order Flow Shift Confirmed
💰 Risk Management
✅ Risk-to-Reward Ratio ≥ 1:2
✅ Risk Amount Fully Affordable (Capital Preservation mindset)
🧠 Psychological Readiness
✅ No F.O.M.O (Fear of Missing Out)
✅ No FEAR-based decisions
✅ No GREED influence
✅ No REVENGE trading
BOS mark-out (by Lumiere)Advanced BOS Detection with Strict Swing Confirmation
This indicator implements BOS detection with several unique features:
🔹 Dual-Candle Swing Validation - Unlike most BOS indicators that use single candle swings, this uses a two-candle confirmation for swing highs/lows, analyzing both the candle wicks and body transitions.
🔹 Directional Lock System - Implements a state machine that prevents duplicate signals until an opposite-direction BOS occurs, reducing noise.
🔹 Precision Wick Analysis - Compares wicks between the reversal candle and confirmation candle to identify the true swing point.
🔹 Real-Time Update & Live Market Adaptation – The indicator continuously monitors price action and instantly updates BOS signals as new candles form, ensuring you never miss a BOS.
How It Differs From Other BOS Indicators:
Most public BOS indicators use simple HH/HL or LH/LL detection.
Many don't implement the directional locking mechanism.
Few use the two-candle wick comparison approach.
Wick-Based Precision uses the extreme wicks of two candles (not just the body).
Strict Confirmation requires a close beyond the swing point (no "wick breaks" counted).
Usage Examples:
🟦 Bullish BOS:
A green candle closes, followed by a red candle. This will be the new high, and if the next candle closes above the highest wick of those two, it will be a BOS (only if we had a bearish BOS before)
🟥 Bearish BOS:
A red candle closes, followed by a green candle. This will be the new low, and if the next candle closes below the lowest wick of those two, it will be a BOS (only if we had a Bullish BOS before)

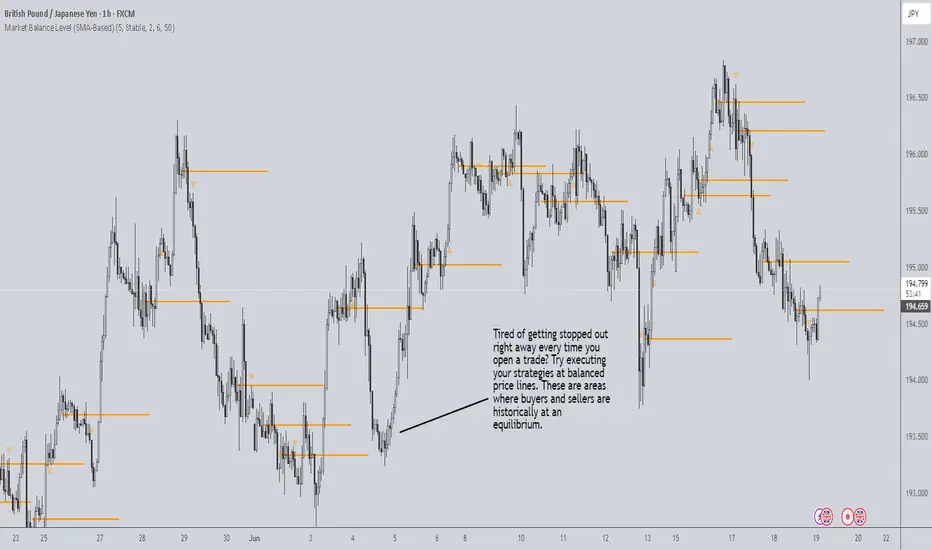
Market Balance LevelMarket Balance Level (MBL)
This indicator dynamically identifies price consolidation zones (market balance levels) and plots a horizontal line at the average midpoint of the range once a valid breakout occurs. It helps traders visualize key zones where the market was previously in equilibrium and is likely to retest before continuing its trend.
How It Works:
Detects consolidation ranges using consecutive candles within a tight high-low structure.
When a breakout occurs (above or below the range), it plots a line at the average midpoint of the consolidation.
Triangles are drawn on breakouts to visually confirm the breakout direction.
Lines can be customized by color, width, and breakout direction (bullish, bearish, or both).
Recommended Use:
Wait for price to return to the Market Balance Level (MBL). These levels often act as strong support or resistance.
Enter upon engulfment (candle closes strongly in the direction of the breakout), confirming continuation.
Features:
Adjustable consolidation sensitivity and line length.
Option to show/hide bullish or bearish MBLs.
Visual breakout markers (triangles) with alert support.
Optional alert messages for breakout events.
Use this tool to enhance your structure-based or SMC-style trading strategies.
Fibonacci Optimal Entry Zone [OTE] (Zeiierman)█ Overview
Fibonacci Optimal Entry Zone (Zeiierman) is a high-precision market structure tool designed to help traders identify ideal entry zones during trending markets. Built on the principles of Smart Money Concepts (SMC) and Fibonacci retracements, this indicator highlights key areas where price is most likely to react — specifically within the "Golden Zone" (between the 50% and 61.8% retracement).
It tracks structural pivot shifts (CHoCH) and dynamically adjusts Fibonacci levels based on real-time swing tracking. Whether you're trading breakouts, pullbacks, or optimal entries, this tool brings unparalleled clarity to structure-based strategies.
Ideal for traders who rely on confluence, this indicator visually synchronizes swing highs/lows, market structure shifts, Fibonacci retracement levels, and trend alignment — all without clutter or lag.
⚪ The Structural Assumption
Price moves in waves, but key retracements often lead to continuation or reversal — especially when aligned with structure breaks and trend shifts.
The Optimal Entry Zone captures this behavior by anchoring Fibonacci levels between recent swing extremes. The most powerful area — the Golden Zone — marks where institutional re-entry is likely, providing traders with a sniper-like roadmap to structure-based entries.
█ How It Works
⚪ Structure Tracking Engine
At its core, the indicator detects pivots and classifies trend direction:
Structure Period – Determines the depth of pivots used to detect swing highs/lows.
CHoCH – Break of structure logic identifies where the trend shifts or continues, marked visually on the chart.
Bullish & Bearish Modes – Independently toggle uptrend and downtrend detection and styling.
⚪ Fibonacci Engine
Upon each confirmed structural shift, Fibonacci retracement levels are projected between swing extremes:
Custom Levels – Choose which retracements (0.50, 0.618, etc.) are shown.
Real-Time Adjustments – When "Swing Tracker" is enabled, levels and labels update dynamically as price forms new swings.
Example:
If you disable the Swing Tracker, the Golden Level is calculated using the most recent confirmed swing high and low.
If you enable the Swing Tracker, the Golden Level is calculated from the latest swing high or low, making it more adaptive as the trend evolves in real time.
█ How to Use
⚪ Structure-Based Entry
Wait for CHoCH events and use the resulting Fibonacci projection to identify entry points. Enter trades as price taps into the Golden Zone, especially when confluence forms with swing structure or order blocks.
⚪ Real-Time Reaction Tracking
Enable Swing Tracker to keep the tool live — constantly updating zones as price shifts. This is especially useful for scalpers or intraday traders who rely on fresh swing zones.
█ Settings
Structure Period – Number of bars used to define swing pivots. Larger values = stronger structure.
Swing Tracker – Auto-updates fib levels as new highs/lows form.
Show Previous Levels – Keep older fib zones on chart or reset with each structure shift.
-----------------
Disclaimer
The content provided in my scripts, indicators, ideas, algorithms, and systems is for educational and informational purposes only. It does not constitute financial advice, investment recommendations, or a solicitation to buy or sell any financial instruments. I will not accept liability for any loss or damage, including without limitation any loss of profit, which may arise directly or indirectly from the use of or reliance on such information.
All investments involve risk, and the past performance of a security, industry, sector, market, financial product, trading strategy, backtest, or individual's trading does not guarantee future results or returns. Investors are fully responsible for any investment decisions they make. Such decisions should be based solely on an evaluation of their financial circumstances, investment objectives, risk tolerance, and liquidity needs.

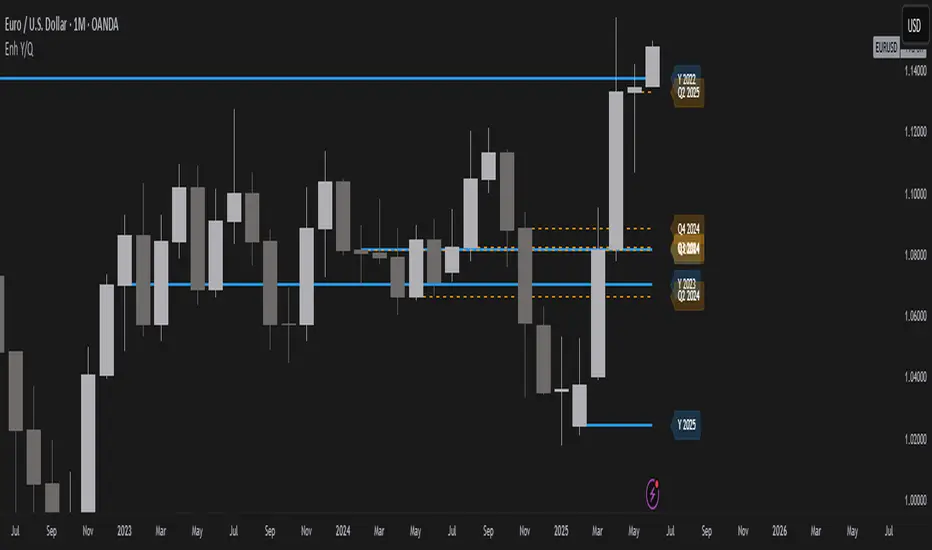
Year/Quarter Open LevelsDeveloped by ADEL CEZAR and inspired by insights from ERDAL Y, this indicator is designed to give traders a clear edge by automatically plotting the Yearly Open and Quarterly Open levels — two of the most critical institutional reference points in price action.
These levels often act as magnets for liquidity, bias confirmation zones, and support/resistance pivots on higher timeframes. With customizable settings, you can display multiple past opens, fine-tune label positions, and align your strategy with high-timeframe structure — all in a lightweight, non-intrusive design.
If you follow Smart Money Concepts (SMC), ICT models, or build confluence using HTF structures and range theory, this script will integrate seamlessly into your workflow.
Liquidity mark-out indicator(by Lumiere)This indicator marks out every High that has a bullish candle followed by a bearish one, vice versa for lows.
Once the price reaches the marked-out liquidity, the line is removed automatically.
This indicator only shows the current liquidity of the time frame you are at.
(To get it look like the picture just chance the length to 30-50)
Key Features of the Liquidity Mark-Out Indicator:
🔹 Identifies Liquidity Zones – Marks highs and lows based on candlestick patterns.
🔹 Customizable Settings – Toggle highs/lows visibility 🎚️, adjust line colors 🎨, and set line length (bars) 📏.
🔹 Smart Clean-Up – Automatically removes swept levels (when price breaks through) for a clean chart 🧹.
🔹 Pattern-Based Detection –
Highs: Detects two-candle reversal patterns (🟢 bullish close → 🔴 bearish close).
Lows: Detects two-candle reversal patterns (🔴 bearish close → 🟢 bullish close).
🔹 Dynamic Lines – Projects liquidity levels forward (adjustable length) to track key zones 📈.
Perfect For Traders Looking To:
✅ Spot potential liquidity grabs 🎯
✅ Identify key support/resistance levels 🛑
✅ Clean up their chart from outdated levels 🖥️

Supply/Demand Zones + Engulfment-based ExecutionSupply/Demand Zones + Engulfment-Based Execution
Strategy Overview
This strategy combines institutional trading concepts—supply/demand zones and engulfing candle patterns—to generate high-probability long and short trade setups. The system uses aggregated price action to identify potential reversal zones and confirms entries with engulfing candle patterns, ensuring trades are only taken when market structure shows commitment in the direction of the trade.
Core Concepts
• Supply & Demand Zones: These are automatically detected by analyzing aggregated bullish and bearish candle structures over user-defined intervals. Supply zones are formed after bearish continuation patterns; demand zones appear after bullish continuation patterns.
• Engulfing Entries: Once price enters a zone, the strategy waits for a bullish engulfing pattern (in a demand zone) or a bearish engulfing pattern (in a supply zone) before executing a trade. This adds confirmation and reduces false signals.
• Risk Management: Stop-loss is placed at the low (for long trades) or high (for short trades) of the engulfed candle. Take-profit can be calculated using a fixed R-multiple (risk-to-reward ratio) or a user-defined target price.
Key Features
Fully customizable aggregation factor for zone detection
Visual zone boxes, entry/SL/TP boxes, and engulfing pattern labels
Optional removal of mitigated zones for cleaner charting
Configurable trade mode (Long only, Short only, or Both)
Support for trading sessions and date filtering
Alerts for price entering supply or demand zones
How to Use
Select Aggregation Factor: Choose how many candles to group together for identifying key zones (e.g., 4x timeframe).
Enable Zones: Turn on supply and/or demand zones as needed.
Set Execution Parameters:
– Choose R-multiple (e.g., 2:1 risk-reward)
– Or use a fixed take-profit price
Define Trade Time Window:
– Set the date and time ranges to restrict execution
– Use Start Hour and End Hour to limit trades to specific sessions (e.g., London/New York)
Run on Desired Timeframe: Typically used on 15m–4H charts, depending on your strategy and the asset’s volatility.
Ideal For
• Traders using Smart Money Concepts (SMC)
• Those who value high-confluence entries
• Intraday to swing traders looking for structure-based automation
⚠️ Important Notes
• The strategy requires engulfing confirmation within the zone to enter a position.
• This script does not repaint and executes trades on a bar close basis.
• Backtest results may vary based on session filters and aggregation factor.
© Attribution
This strategy was developed by The_Forex_Steward and is licensed under the Mozilla Public License 2.0.
You are free to use, modify, and distribute it under the terms of that license.
