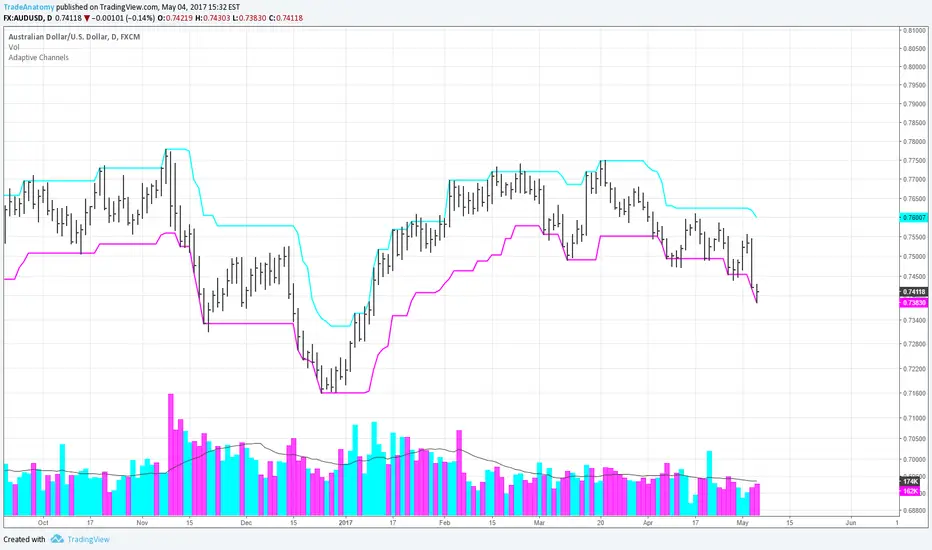
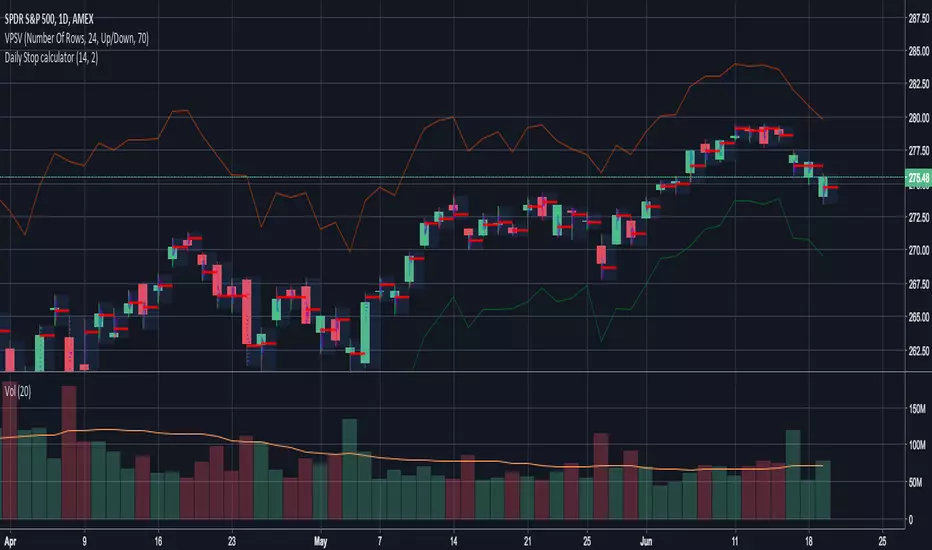
Adaptive Channels for for initial stop lossThe Adaptive Channels provide an initial stop loss value when a new trade is executed either long or short. They can also be used to enter and exit the trade.
ابحث في النصوص البرمجية عن "stop loss"
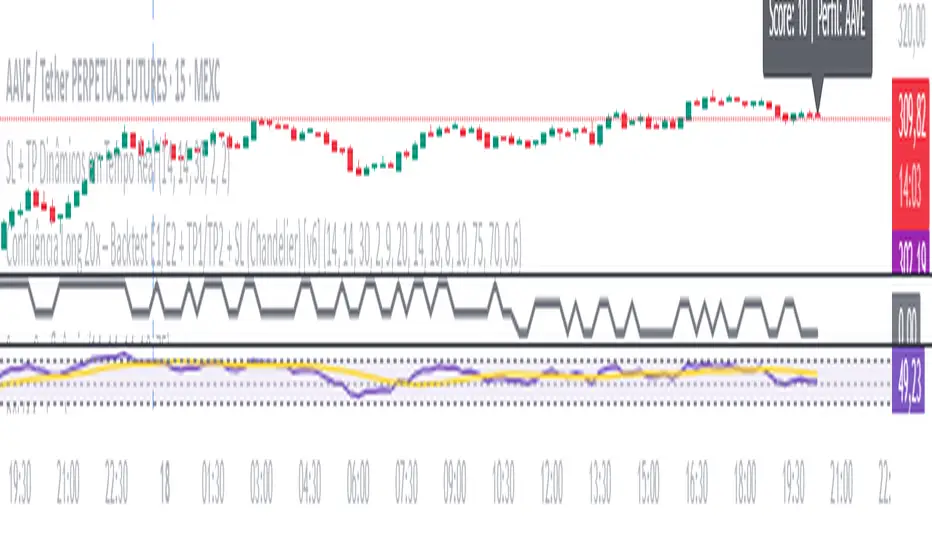
SL + TP Dynamics - By M.LolasStop Loss e Take Profit dinâmicos para operações semiautomatizadas.
By M.Lolas
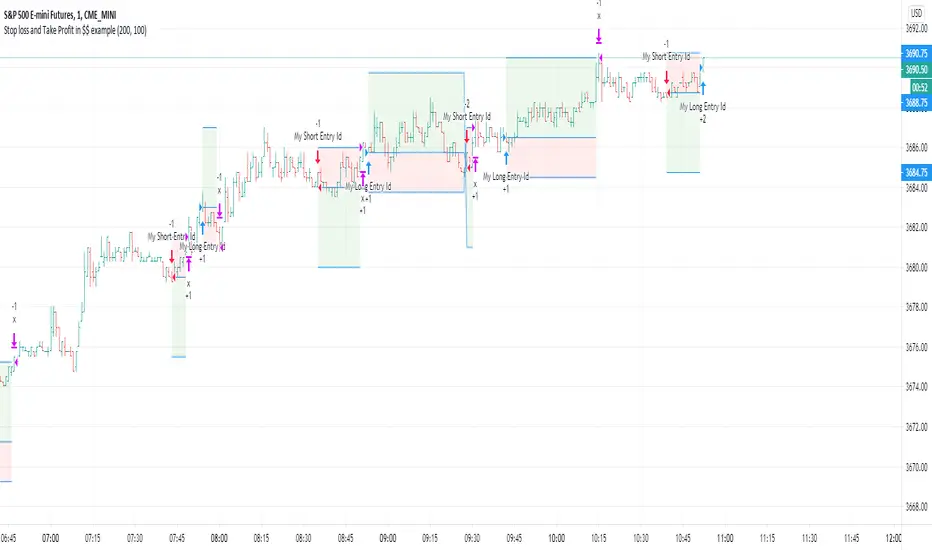
Stop loss and Take Profit in $$ exampleThis is a simple exit example in $$ (symbol's currency) for educational purpose .
STOP-LOSS-RSI with Edge-Preserving Filter Strategy V2Modified RSI strategy with entry and exit points.
I have allowed for High and Low risk for anyone interested in using it (NO GUARANTEES. DO YOUR OWN RESEARCH).
I will later consider incorporating the standard RSI for exit points. I am sure returns will increase based on current test runs :)
Returns look good based on the strategy result.

11// This Pine Script® code is subject to the terms of the Mozilla Public License 2.0 at mozilla.org
// © gilanns
//@version=5
//
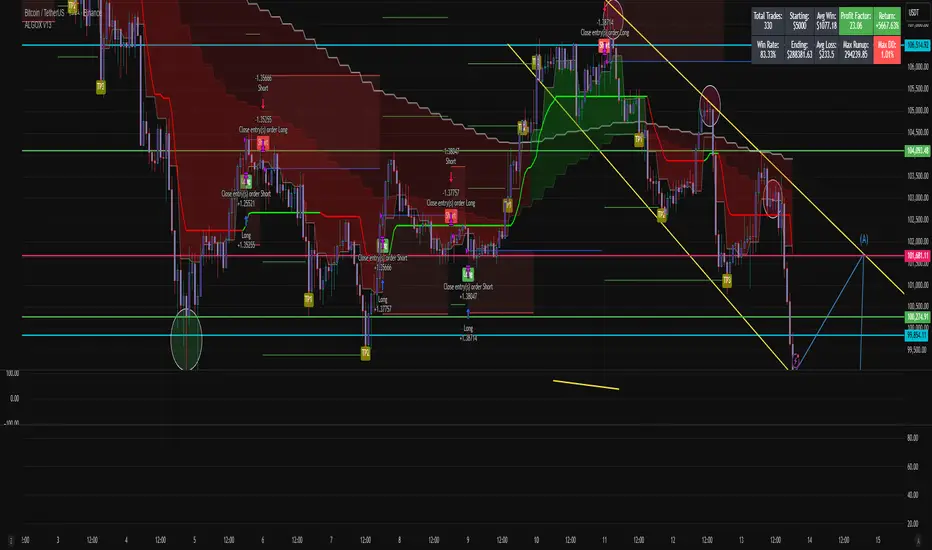
VERSION = 'v13'// 2024.3.20
strategy(
'ALGOX',
shorttitle = 'ALGOX ' + VERSION,
overlay = true,
explicit_plot_zorder = true,
pyramiding = 0,
default_qty_type = strategy.percent_of_equity,
default_qty_value = 50,
calc_on_every_tick = false,
process_orders_on_close = true,
max_bars_back = 500,
initial_capital = 5000,
commission_type = strategy.commission.percent,
commission_value = 0.02
)
//Truncate Function
truncate(number, decimals) =>
factor = math.pow(10, decimals)
int(number * factor) / factor
//
// === INPUTS ===
TPSType = input.string('Trailing', 'What TPS should be taken : ', options = )
setupType = input.string('Open/Close', title='What Trading Setup should be taken : ', options= )
scolor = input(true, title='Show coloured Bars to indicate Trend?')
almaRibbon = input(false, title='Enable Ribbon?')
//tradeType = input.string('BOTH', title='What trades should be taken : ', options= )
// === /INPUTS ===
// Display the probabilities in a table
//text01_ = str.tostring(timeframe.multiplier * intRes, '####')
//t = timenow + math.round(ta.change(time) * 25)
//var label lab01 = na
//label.delete(lab01)
//lab01 := label.new(t, close, text=text01_, style=label.style_label_left, yloc=yloc.price, xloc=xloc.bar_time, textalign=text.align_left, textcolor=color.white)
// Constants colours that include fully non-transparent option.
green100 = #008000FF
lime100 = #00FF00FF
red100 = #FF0000FF
blue100 = #0000FFFF
aqua100 = #00FFFFFF
darkred100 = #8B0000FF
gray100 = #808080FF
/////////////////////////////////////////////
// Create non-repainting security function
rp_security(_symbol, _res, _src) =>
request.security(_symbol, _res, _src )
//
f_tfInMinutes() =>
_tfInMinutes = timeframe.period == '1' ? '3' : timeframe.period == '3' ? '5' : timeframe.period == '5' ? '15' : timeframe.period == '15' ? '30' : timeframe.period == '30' ? '60' : timeframe.period == '60' ? '240' : 'D'
_tfInMinutes
my_time1 = f_tfInMinutes()
tfmult = 18 //input.int(18, "Input Timeframe Multiplier")
f_resInMinutes() =>
_resInMinutes = timeframe.multiplier * (
timeframe.isseconds ? 1. / 60. :
timeframe.isminutes ? 1. :
timeframe.isdaily ? 1440. :
timeframe.isweekly ? 10080. :
timeframe.ismonthly ? 43800. : na)
my_time = str.tostring(f_resInMinutes()*tfmult)
useSource = close //input.string('Close', 'What Source to be used?', options = )
enableFilter = input(true, "Enable Backtesting Range Filtering")
fromDate = input.time(timestamp("01 Jan 2023 00:00 +0300"), "Start Date")
toDate = input.time(timestamp("31 Dec 2099 00:00 +0300"), "End Date")
tradeDateIsAllowed = not enableFilter or (time >= fromDate and time <= toDate)
filter1 = 'Filter with Atr'
filter2 = 'Filter with RSI'
filter3 = 'Atr or RSI'
filter4 = 'Atr and RSI'
filter5 = 'No Filtering'
filter6 = 'Entry Only in sideways market(By ATR or RSI)'
filter7 = 'Entry Only in sideways market(By ATR and RSI)'
typefilter = input.string(filter5, title='Sideways Filtering Input', options= , group='Strategy Options')
RSI = truncate(ta.rsi(close, input.int(7, group='RSI Filterring')), 2)
toplimitrsi = input.int(45, title='TOP Limit', group='RSI Filterring')
botlimitrsi = input.int(10, title='BOT Limit', group='RSI Filterring')
//ST = input.bool(true, title='Show Supertrend?', group='Supertrend Indicator')
//period = input.int(1440, group='Supertrend Indicator')
//mult = input.float(2.612, group='Supertrend Indicator')
atrfiltLen = 5 //input.int(5, minval=1, title='atr Length', group='Sideways Filtering Input')
atrMaType = 'EMA' //input.string('EMA', options= , group='Sideways Filtering Input', title='atr Moving Average Type')
atrMaLen = 5 //input.int(5, minval=1, title='atr MA Length', group='Sideways Filtering Input')
//filtering
atra = request.security(syminfo.tickerid, '', ta.atr(atrfiltLen))
atrMa = atrMaType == 'EM' ? ta.ema(atra, atrMaLen) : ta.sma(atra, atrMaLen)
updm = ta.change(high)
downdm = -ta.change(low)
plusdm = na(updm) ? na : updm > downdm and updm > 0 ? updm : 0
minusdm = na(downdm) ? na : downdm > updm and downdm > 0 ? downdm : 0
cndSidwayss1 = atra >= atrMa
cndSidwayss2 = RSI > toplimitrsi or RSI < botlimitrsi
cndSidways = cndSidwayss1 or cndSidwayss2
cndSidways1 = cndSidwayss1 and cndSidwayss2
Sidwayss1 = atra <= atrMa
Sidwayss2 = RSI < toplimitrsi and RSI > botlimitrsi
Sidways = Sidwayss1 or Sidwayss2
Sidways1 = Sidwayss1 and Sidwayss2
trendType = typefilter == filter1 ? cndSidwayss1 : typefilter == filter2 ? cndSidwayss2 : typefilter == filter3 ? cndSidways : typefilter == filter4 ? cndSidways1 : typefilter == filter5 ? RSI > 0 : typefilter == filter6 ? Sidways : typefilter == filter7 ? Sidways1 : na
// === /INPUTS ===
tf = my_time //input('15')
r = ticker.heikinashi(syminfo.tickerid)
openSeriesAlt = request.security(r, tf, open, lookahead=barmerge.lookahead_on)
closeSeriesAlt = request.security(r, tf, close, lookahead=barmerge.lookahead_on)
//openP = plot(almaRibbon ? openSeriesAlt : na, color=color.new(color.lime, 0), linewidth=3)
//closeP = plot(almaRibbon ? closeSeriesAlt : na, color=color.new(color.red, 0), linewidth=3)
BUYOC = ta.crossover(closeSeriesAlt, openSeriesAlt) and setupType == "Open/Close" and trendType
SELLOC = ta.crossunder(closeSeriesAlt, openSeriesAlt) and setupType == "Open/Close" and trendType
//strategy.entry('sell', direction=strategy.short, qty=trade_size, comment='sell', when=sel_entry)
//strategy.entry('buy', direction=strategy.long, qty=trade_size, comment='buy', when=buy_entry)
//trendColour = closeSeriesAlt > openSeriesAlt ? color.green : color.red
//bcolour = closeSeriesAlt > openSeriesAlt ? lime100 : red100
//barcolor(scolor ? bcolour : na, title='Bar Colours')
//closeP = plot(almaRibbon ? closeSeriesAlt : na, title='Close Series', color=color.new(trendColour, 20), linewidth=2, style=plot.style_line)
//openP = plot(almaRibbon ? openSeriesAlt : na, title='Open Series', color=color.new(trendColour, 20), linewidth=2, style=plot.style_line)
//fill(closeP, openP, color=color.new(trendColour, 80))
//
//rt = input(true, title="ATR Based REnko is the Default, UnCheck to use Traditional ATR?")
atrLen = 3 //input.int(3, title="RENKO_ATR", group = "Renko Settings")
isATR = true //input.bool(true, title="RENKO_USE_RENKO_ATR", group = "Renko Settings")
tradLen1 = 1000 //input.int(1000, title="RENKO_TRADITIONAL", group = "Renko Settings")
//Code to be implemented in V2
//mul = input(1, "Number Of minticks")
//value = mul * syminfo.mintick
tradLen = tradLen1 * 1
param = isATR ? ticker.renko(syminfo.tickerid, "ATR", atrLen) : ticker.renko(syminfo.tickerid, "Traditional", tradLen)
renko_close = request.security(param, my_time, close, lookahead=barmerge.lookahead_on)
renko_open = request.security(param, my_time, open, lookahead=barmerge.lookahead_on)
//============================================
//Sniper------------------------------------------------------------------------------------------------------------------------------------- // Signal 2
//============================================
//============================================
//EMA_CROSS-------------------------------------------------------------------------------------------------------------------------------- // Signal 4
//============================================
EMA1_length=input.int(2, "EMA1_length", group = "Renko Settings")
EMA2_length=input.int(10, "EMA2_length", group = "Renko Settings")
a = ta.ema(renko_close, EMA1_length)
b = ta.ema(renko_close, EMA2_length)
//BUY = ta.cross(a, b) and a > b and renko_open < renko_close
//SELL = ta.cross(a, b) and a < b and renko_close < renko_open
///////////////////////////////
// Determine long and short conditions
BUYR = ta.crossover(a, b) and setupType == "Renko" and trendType
SELLR = ta.crossunder(a, b) and setupType == "Renko" and trendType
sel_color = setupType == "Open/Close" ? closeSeriesAlt < openSeriesAlt : setupType == "Renko" ? renko_close < renko_open : na
buy_color = setupType == "Open/Close" ? closeSeriesAlt > openSeriesAlt : setupType == "Renko" ? renko_close > renko_open : na
sel_entry = setupType == "Open/Close" ? SELLOC : setupType == "Renko" ? SELLR : na
buy_entry = setupType == "Open/Close" ? BUYOC : setupType == "Renko" ? BUYR : na
trendColour = buy_color ? color.green : color.red
bcolour = buy_color ? lime100 : red100
barcolor(scolor ? bcolour : na, title='Bar Colours')
p11=plot(almaRibbon and setupType == "Open/Close" ? closeSeriesAlt : almaRibbon and setupType == "Renko" ? renko_close : na, style=plot.style_circles, linewidth=1, color=color.new(trendColour, 80), title="RENKO_1")
p22=plot(almaRibbon and setupType == "Open/Close" ? openSeriesAlt : almaRibbon and setupType == "Renko" ? renko_open : na, style=plot.style_circles, linewidth=1, color=color.new(trendColour, 80), title="RENKO_2")
fill(p11, p22, color=color.new(trendColour, 50), title="RENKO_fill")
//
lxTrigger = false
sxTrigger = false
leTrigger = buy_entry
seTrigger = sel_entry
// === /ALERT conditions.
buy = leTrigger //ta.crossover(closeSeriesAlt, openSeriesAlt)
sell = seTrigger //ta.crossunder(closeSeriesAlt, openSeriesAlt)
varip wasLong = false
varip wasShort = false
if barstate.isconfirmed
wasLong := false
else
if buy
wasLong := true
if barstate.isconfirmed
wasShort := false
else
if sell
wasShort := true
plotshape(wasLong, color = color.yellow)
plotshape(wasShort, color = color.yellow)
//plotshape(almaRibbon ? buy : na, title = "Buy", text = 'Buy', style = shape.labelup, location = location.belowbar, color= #39ff14, textcolor = #FFFFFF, size = size.tiny)
//plotshape(almaRibbon ? sell : na, title = "Exit", text = 'Exit', style = shape.labeldown, location = location.abovebar, color= #ff1100, textcolor = #FFFFFF, size = size.tiny)
// === STRATEGY ===
i_alert_txt_entry_long = "Short Exit" //input.text_area(defval = "Short Exit", title = "Long Entry Message", group = "Alerts")
i_alert_txt_exit_long = "Long Exit" //input.text_area(defval = "Long Exit", title = "Long Exit Message", group = "Alerts")
i_alert_txt_entry_short = "Go Short" //input.text_area(defval = "Go Short", title = "Short Entry Message", group = "Alerts")
i_alert_txt_exit_short = "Go Long" //input.text_area(defval = "Go Long", title = "Short Exit Message", group = "Alerts")
// Entries and Exits with TP/SL
//tradeType
if buy and TPSType == "Trailing" and tradeDateIsAllowed
strategy.close("Short" , alert_message = i_alert_txt_exit_short)
strategy.entry("Long" , strategy.long , alert_message = i_alert_txt_entry_long)
if sell and TPSType == "Trailing" and tradeDateIsAllowed
strategy.close("Long" , alert_message = i_alert_txt_exit_long)
strategy.entry("Short" , strategy.short, alert_message = i_alert_txt_entry_short)
//tradeType
if buy and TPSType == "Options" and tradeDateIsAllowed
// strategy.close("Short" , alert_message = i_alert_txt_exit_short)
strategy.entry("Long" , strategy.long , alert_message = i_alert_txt_entry_long)
if sell and TPSType == "Options" and tradeDateIsAllowed
strategy.close("Long" , alert_message = i_alert_txt_exit_long)
// strategy.entry("Short" , strategy.short, alert_message = i_alert_txt_entry_short)
G_RISK = '■ ' + 'Risk Management'
//#region ———— <↓↓↓ G_RISK ↓↓↓> {
//ATR SL Settings
atrLength = 20 //input.int(20, minval=1, title='ATR Length')
profitFactor = 2.5 //input(2.5, title='Take Profit Factor')
stopFactor = 1 //input(1.0, title='Stop Loss Factor')
// Calculate ATR
tpatrValue = ta.atr(atrLength)
// Calculate take profit and stop loss levels for buy signals
takeProfit1_buy = 1 * profitFactor * tpatrValue //close + profitFactor * atrValue
takeProfit2_buy = 2 * profitFactor * tpatrValue //close + 2 * profitFactor * atrValue
takeProfit3_buy = 3 * profitFactor * tpatrValue //close + 3 * profitFactor * atrValue
stopLoss_buy = close - takeProfit1_buy //stopFactor * tpatrValue
// Calculate take profit and stop loss levels for sell signals
takeProfit1_sell = 1 * profitFactor * tpatrValue //close - profitFactor * atrValue
takeProfit2_sell = 2 * profitFactor * tpatrValue //close - 2 * profitFactor * atrValue
takeProfit3_sell = 3 * profitFactor * tpatrValue //close - 3 * profitFactor * atrValue
stopLoss_sell = close + takeProfit1_sell //stopFactor * tpatrValue
// ———————————
//Tooltip
T_LVL = '(%) Exit Level'
T_QTY = '(%) Adjust trade exit volume'
T_MSG = 'Paste JSON message for your bot'
//Webhook Message
O_LEMSG = 'Long Entry'
O_LXMSGSL = 'Long SL'
O_LXMSGTP1 = 'Long TP1'
O_LXMSGTP2 = 'Long TP2'
O_LXMSGTP3 = 'Long TP3'
O_LXMSG = 'Long Exit'
O_SEMSG = 'Short Entry'
O_SXMSGSL = 'Short SL'
O_SXMSGA = 'Short TP1'
O_SXMSGB = 'Short TP2'
O_SXMSGC = 'Short TP3'
O_SXMSGX = 'Short Exit'
// on whole pips) for forex currency pairs.
pip_size = syminfo.mintick * (syminfo.type == "forex" ? 10 : 1)
// On the last historical bar, show the instrument's pip size
//if barstate.islastconfirmedhistory
// label.new(x=bar_index + 2, y=close, style=label.style_label_left,
// color=color.navy, textcolor=color.white, size=size.large,
// text=syminfo.ticker + "'s pip size is:\n" +
// str.tostring(pip_size))
// ——————————— | | | Line length guide |
i_lxLvlTP1 = leTrigger ? takeProfit1_buy : seTrigger ? takeProfit1_sell : na //input.float (1, 'Level TP1' , group = G_RISK, tooltip = T_LVL)
i_lxQtyTP1 = input.float (50, 'Qty TP1' , group = G_RISK, tooltip = T_QTY)
i_lxLvlTP2 = leTrigger ? takeProfit2_buy : seTrigger ? takeProfit2_sell : na //input.float (1.5, 'Level TP2' , group = G_RISK, tooltip = T_LVL)
i_lxQtyTP2 = input.float (30, 'Qty TP2' , group = G_RISK, tooltip = T_QTY)
i_lxLvlTP3 = leTrigger ? takeProfit3_buy : seTrigger ? takeProfit3_sell : na //input.float (2, 'Level TP3' , group = G_RISK, tooltip = T_LVL)
i_lxQtyTP3 = input.float (20, 'Qty TP3' , group = G_RISK, tooltip = T_QTY)
i_lxLvlSL = leTrigger ? takeProfit1_buy : seTrigger ? takeProfit1_sell : na //input.float (0.5, 'Stop Loss' , group = G_RISK, tooltip = T_LVL)
i_sxLvlTP1 = i_lxLvlTP1
i_sxQtyTP1 = i_lxQtyTP1
i_sxLvlTP2 = i_lxLvlTP2
i_sxQtyTP2 = i_lxQtyTP2
i_sxLvlTP3 = i_lxLvlTP3
i_sxQtyTP3 = i_lxQtyTP3
i_sxLvlSL = i_lxLvlSL
G_MSG = '■ ' + 'Webhook Message'
i_leMsg = O_LEMSG //input.string (O_LEMSG ,'Long Entry' , group = G_MSG, tooltip = T_MSG)
i_lxMsgSL = O_LXMSGSL //input.string (O_LXMSGSL ,'Long SL' , group = G_MSG, tooltip = T_MSG)
i_lxMsgTP1 = O_LXMSGTP1 //input.string (O_LXMSGTP1,'Long TP1' , group = G_MSG, tooltip = T_MSG)
i_lxMsgTP2 = O_LXMSGTP2 //input.string (O_LXMSGTP2,'Long TP2' , group = G_MSG, tooltip = T_MSG)
i_lxMsgTP3 = O_LXMSGTP3 //input.string (O_LXMSGTP3,'Long TP3' , group = G_MSG, tooltip = T_MSG)
i_lxMsg = O_LXMSG //input.string (O_LXMSG ,'Long Exit' , group = G_MSG, tooltip = T_MSG)
i_seMsg = O_SEMSG //input.string (O_SEMSG ,'Short Entry' , group = G_MSG, tooltip = T_MSG)
i_sxMsgSL = O_SXMSGSL //input.string (O_SXMSGSL ,'Short SL' , group = G_MSG, tooltip = T_MSG)
i_sxMsgTP1 = O_SXMSGA //input.string (O_SXMSGA ,'Short TP1' , group = G_MSG, tooltip = T_MSG)
i_sxMsgTP2 = O_SXMSGB //input.string (O_SXMSGB ,'Short TP2' , group = G_MSG, tooltip = T_MSG)
i_sxMsgTP3 = O_SXMSGC //input.string (O_SXMSGC ,'Short TP3' , group = G_MSG, tooltip = T_MSG)
i_sxMsg = O_SXMSGX //input.string (O_SXMSGX ,'Short Exit' , group = G_MSG, tooltip = T_MSG)
i_src = close
G_DISPLAY = 'Display'
//
i_alertOn = true //input.bool (true, 'Alert Labels On/Off' , group = G_DISPLAY)
i_barColOn = true //input.bool (true, 'Bar Color On/Off' , group = G_DISPLAY)
// ———————————
// @function Calculate the Take Profit line, and the crossover or crossunder
f_tp(_condition, _conditionValue, _leTrigger, _seTrigger, _src, _lxLvlTP, _sxLvlTP)=>
var float _tpLine = 0.0
_topLvl = _src + _lxLvlTP //TPSType == "Fixed %" ? _src + (_src * (_lxLvlTP / 100)) : _src + _lxLvlTP
_botLvl = _src - _lxLvlTP //TPSType == "Fixed %" ? _src - (_src * (_sxLvlTP / 100)) : _src - _sxLvlTP
_tpLine := _condition != _conditionValue and _leTrigger ? _topLvl :
_condition != -_conditionValue and _seTrigger ? _botLvl :
nz(_tpLine )
// @function Similar to "ta.crossover" or "ta.crossunder"
f_cross(_scr1, _scr2, _over)=>
_cross = _over ? _scr1 > _scr2 and _scr1 < _scr2 :
_scr1 < _scr2 and _scr1 > _scr2
// ———————————
//
var float condition = 0.0
var float slLine = 0.0
var float entryLine = 0.0
//
entryLine := leTrigger and condition <= 0.0 ? close :
seTrigger and condition >= 0.0 ? close : nz(entryLine )
//
slTopLvl = TPSType == "Fixed %" ? i_src + (i_src * (i_lxLvlSL / 100)) : i_src + i_lxLvlSL
slBotLvl = TPSType == "Fixed %" ? i_src - (i_src * (i_sxLvlSL / 100)) : i_src - i_lxLvlSL
slLine := condition <= 0.0 and leTrigger ? slBotLvl :
condition >= 0.0 and seTrigger ? slTopLvl : nz(slLine )
slLong = f_cross(low, slLine, false)
slShort = f_cross(high, slLine, true )
//
= f_tp(condition, 1.2,leTrigger, seTrigger, i_src, i_lxLvlTP3, i_sxLvlTP3)
= f_tp(condition, 1.1,leTrigger, seTrigger, i_src, i_lxLvlTP2, i_sxLvlTP2)
= f_tp(condition, 1.0,leTrigger, seTrigger, i_src, i_lxLvlTP1, i_sxLvlTP1)
tp3Long = f_cross(high, tp3Line, true )
tp3Short = f_cross(low, tp3Line, false)
tp2Long = f_cross(high, tp2Line, true )
tp2Short = f_cross(low, tp2Line, false)
tp1Long = f_cross(high, tp1Line, true )
tp1Short = f_cross(low, tp1Line, false)
switch
leTrigger and condition <= 0.0 => condition := 1.0
seTrigger and condition >= 0.0 => condition := -1.0
tp3Long and condition == 1.2 => condition := 1.3
tp3Short and condition == -1.2 => condition := -1.3
tp2Long and condition == 1.1 => condition := 1.2
tp2Short and condition == -1.1 => condition := -1.2
tp1Long and condition == 1.0 => condition := 1.1
tp1Short and condition == -1.0 => condition := -1.1
slLong and condition >= 1.0 => condition := 0.0
slShort and condition <= -1.0 => condition := 0.0
lxTrigger and condition >= 1.0 => condition := 0.0
sxTrigger and condition <= -1.0 => condition := 0.0
longE = leTrigger and condition <= 0.0 and condition == 1.0
shortE = seTrigger and condition >= 0.0 and condition == -1.0
longX = lxTrigger and condition >= 1.0 and condition == 0.0
shortX = sxTrigger and condition <= -1.0 and condition == 0.0
longSL = slLong and condition >= 1.0 and condition == 0.0
shortSL = slShort and condition <= -1.0 and condition == 0.0
longTP3 = tp3Long and condition == 1.2 and condition == 1.3
shortTP3 = tp3Short and condition == -1.2 and condition == -1.3
longTP2 = tp2Long and condition == 1.1 and condition == 1.2
shortTP2 = tp2Short and condition == -1.1 and condition == -1.2
longTP1 = tp1Long and condition == 1.0 and condition == 1.1
shortTP1 = tp1Short and condition == -1.0 and condition == -1.1
// ——————————— {
//
if strategy.position_size <= 0 and longE and TPSType == "ATR" and tradeDateIsAllowed
strategy.entry( 'Long', strategy.long, alert_message = i_leMsg, comment = 'LE')
if strategy.position_size > 0 and condition == 1.0 and TPSType == "ATR" and tradeDateIsAllowed
strategy.exit( id = 'LXTP1', from_entry = 'Long', qty_percent = i_lxQtyTP1, limit = tp1Line, stop = slLine, comment_profit = 'LXTP1', comment_loss = 'SL', alert_profit = i_lxMsgTP1, alert_loss = i_lxMsgSL)
if strategy.position_size > 0 and condition == 1.1 and TPSType == "ATR" and tradeDateIsAllowed
strategy.exit( id = 'LXTP2', from_entry = 'Long', qty_percent = i_lxQtyTP2, limit = tp2Line, stop = slLine, comment_profit = 'LXTP2', comment_loss = 'SL', alert_profit = i_lxMsgTP2, alert_loss = i_lxMsgSL)
if strategy.position_size > 0 and condition == 1.2 and TPSType == "ATR" and tradeDateIsAllowed
strategy.exit( id = 'LXTP3', from_entry = 'Long', qty_percent = i_lxQtyTP3, limit = tp3Line, stop = slLine, comment_profit = 'LXTP3', comment_loss = 'SL', alert_profit = i_lxMsgTP3, alert_loss = i_lxMsgSL)
if longX and tradeDateIsAllowed
strategy.close( 'Long', alert_message = i_lxMsg, comment = 'LX')
//
if strategy.position_size >= 0 and shortE and TPSType == "ATR" and tradeDateIsAllowed
strategy.entry( 'Short', strategy.short, alert_message = i_leMsg, comment = 'SE')
if strategy.position_size < 0 and condition == -1.0 and TPSType == "ATR" and tradeDateIsAllowed
strategy.exit( id = 'SXTP1', from_entry = 'Short', qty_percent = i_sxQtyTP1, limit = tp1Line, stop = slLine, comment_profit = 'SXTP1', comment_loss = 'SL', alert_profit = i_sxMsgTP1, alert_loss = i_sxMsgSL)
if strategy.position_size < 0 and condition == -1.1 and TPSType == "ATR" and tradeDateIsAllowed
strategy.exit( id = 'SXTP2', from_entry = 'Short', qty_percent = i_sxQtyTP2, limit = tp2Line, stop = slLine, comment_profit = 'SXTP2', comment_loss = 'SL', alert_profit = i_sxMsgTP2, alert_loss = i_sxMsgSL)
if strategy.position_size < 0 and condition == -1.2 and TPSType == "ATR" and tradeDateIsAllowed
strategy.exit( id = 'SXTP3', from_entry = 'Short', qty_percent = i_sxQtyTP3, limit = tp3Line, stop = slLine, comment_profit = 'SXTP3', comment_loss = 'SL', alert_profit = i_sxMsgTP3, alert_loss = i_sxMsgSL)
if shortX and tradeDateIsAllowed
strategy.close( 'Short', alert_message = i_sxMsg, comment = 'SX')
// ———————————
c_tp = leTrigger or seTrigger ? na :
condition == 0.0 ? na : color.green
c_entry = leTrigger or seTrigger ? na :
condition == 0.0 ? na : color.blue
c_sl = leTrigger or seTrigger ? na :
condition == 0.0 ? na : color.red
p_tp1Line = plot ( condition == 1.0 or condition == -1.0 ? tp1Line : na, title = "TP Line 1", color = c_tp, linewidth = 1, style = plot.style_linebr)
p_tp2Line = plot ( condition == 1.0 or condition == -1.0 or condition == 1.1 or condition == -1.1 ? tp2Line : na, title = "TP Line 2", color = c_tp, linewidth = 1, style = plot.style_linebr)
p_tp3Line = plot ( condition == 1.0 or condition == -1.0 or condition == 1.1 or condition == -1.1 or condition == 1.2 or condition == -1.2 ? tp3Line : na, title = "TP Line 3", color = c_tp, linewidth = 1, style = plot.style_linebr)
p_entryLine = plot ( condition >= 1.0 or condition <= -1.0 ? entryLine : na, title = "Entry Line", color = c_entry, linewidth = 1, style = plot.style_linebr)
p_slLine = plot ( condition == 1.0 or condition == -1.0 or condition == 1.1 or condition == -1.1 or condition == 1.2 or condition == -1.2 ? slLine : na, title = "SL Line", color = c_sl, linewidth = 1, style = plot.style_linebr)
//fill( p_tp3Line, p_entryLine, color = leTrigger or seTrigger ? na :color.new(color.green, 90))
fill( p_entryLine, p_slLine, color = leTrigger or seTrigger ? na :color.new(color.red, 90))
//
plotshape( i_alertOn and longE, title = 'Long', text = 'Long', textcolor = color.white, color = color.green, style = shape.labelup, size = size.tiny, location = location.belowbar)
plotshape( i_alertOn and shortE, title = 'Short', text = 'Short', textcolor = color.white, color = color.red, style = shape.labeldown, size = size.tiny, location = location.abovebar)
plotshape( i_alertOn and (longX or shortX) ? close : na, title = 'Close', text = 'Close', textcolor = color.white, color = color.gray, style = shape.labelup, size = size.tiny, location = location.absolute)
l_tp = i_alertOn and (longTP1 or shortTP1) ? close : na
plotshape( l_tp, title = "TP1 Cross", text = "TP1", textcolor = color.white, color = color.olive, style = shape.labelup, size = size.tiny, location = location.absolute)
plotshape( i_alertOn and (longTP2 or shortTP2) ? close : na, title = "TP2 Cross", text = "TP2", textcolor = color.white, color = color.olive, style = shape.labelup, size = size.tiny, location = location.absolute)
plotshape( i_alertOn and (longTP3 or shortTP3) ? close : na, title = "TP3 Cross", text = "TP3", textcolor = color.white, color = color.olive, style = shape.labelup, size = size.tiny, location = location.absolute)
plotshape( i_alertOn and (longSL or shortSL) ? close : na, title = "SL Cross", text = "SL", textcolor = color.white, color = color.maroon, style = shape.labelup, size = size.tiny, location = location.absolute)
//
plot( na, title = "─── ───", editable = false, display = display.data_window)
plot( condition, title = "condition", editable = false, display = display.data_window)
plot( strategy.position_size * 100, title = ".position_size", editable = false, display = display.data_window)
//#endregion }
// ——————————— <↑↑↑ G_RISK ↑↑↑>
//#region ———— <↓↓↓ G_SCRIPT02 ↓↓↓> {
// @function Queues a new element in an array and de-queues its first element.
f_qDq(_array, _val) =>
array.push(_array, _val)
_return = array.shift(_array)
_return
var line a_slLine = array.new_line(1)
var line a_entryLine = array.new_line(1)
var line a_tp3Line = array.new_line(1)
var line a_tp2Line = array.new_line(1)
var line a_tp1Line = array.new_line(1)
var label a_slLabel = array.new_label(1)
var label a_tp3label = array.new_label(1)
var label a_tp2label = array.new_label(1)
var label a_tp1label = array.new_label(1)
var label a_entryLabel = array.new_label(1)
newEntry = longE or shortE
entryIndex = 1
entryIndex := newEntry ? bar_index : nz(entryIndex )
lasTrade = bar_index >= entryIndex
l_right = 10
if TPSType == "ATR"
line.delete( f_qDq(a_slLine, line.new( entryIndex, slLine, last_bar_index + l_right, slLine, style = line.style_solid, color = c_sl)))
if TPSType == "ATR"
line.delete( f_qDq(a_entryLine, line.new( entryIndex, entryLine, last_bar_index + l_right, entryLine, style = line.style_solid, color = color.blue)))
if TPSType == "ATR"
line.delete( f_qDq(a_tp3Line, line.new( entryIndex, tp3Line, last_bar_index + l_right, tp3Line, style = line.style_solid, color = c_tp)))
if TPSType == "ATR"
line.delete( f_qDq(a_tp2Line, line.new( entryIndex, tp2Line, last_bar_index + l_right, tp2Line, style = line.style_solid, color = c_tp)))
if TPSType == "ATR"
line.delete( f_qDq(a_tp1Line, line.new( entryIndex, tp1Line, last_bar_index + l_right, tp1Line, style = line.style_solid, color = c_tp)))
if TPSType == "ATR"
label.delete( f_qDq(a_slLabel, label.new( last_bar_index + l_right, slLine, 'SL: ' + str.tostring(slLine, '##.###'), style = label.style_label_left, textcolor = color.white, color = c_sl)))
if TPSType == "ATR"
label.delete( f_qDq(a_entryLabel, label.new( last_bar_index + l_right, entryLine, 'Entry: ' + str.tostring(entryLine, '##.###'), style = label.style_label_left, textcolor = color.white, color = color.blue)))
if TPSType == "ATR"
label.delete( f_qDq(a_tp3label, label.new( last_bar_index + l_right, tp3Line, 'TP3: ' + str.tostring(tp3Line, '##.###') + " - Target Pips : - " + str.tostring(longE ? tp3Line - entryLine : entryLine - tp3Line, "#.##"), style = label.style_label_left, textcolor = color.white, color = c_tp)))
if TPSType == "ATR"
label.delete( f_qDq(a_tp2label, label.new( last_bar_index + l_right, tp2Line, 'TP2: ' + str.tostring(tp2Line, '##.###'), style = label.style_label_left, textcolor = color.white, color = c_tp)))
if TPSType == "ATR"
label.delete( f_qDq(a_tp1label, label.new( last_bar_index + l_right, tp1Line, 'TP1: ' + str.tostring(tp1Line, '##.###'), style = label.style_label_left, textcolor = color.white, color = c_tp)))
//#endregion }
// ——————————— <↑↑↑ G_SCRIPT02 ↑↑↑>
c_barCol = close > open ? color.rgb(120, 9, 139) : color.rgb(69, 155, 225)
barcolor(
i_barColOn ? c_barCol : na)
// ———————————
//
if longE or shortE or longX or shortX
alert(message = 'Any Alert', freq = alert.freq_once_per_bar_close)
if longE
alert(message = 'Long Entry', freq = alert.freq_once_per_bar_close)
if shortE
alert(message = 'Short Entry', freq = alert.freq_once_per_bar_close)
if longX
alert(message = 'Long Exit', freq = alert.freq_once_per_bar_close)
if shortX
alert(message = 'Short Exit', freq = alert.freq_once_per_bar_close)
//#endregion }
// ——————————— <↑↑↑ G_SCRIPT03 ↑↑↑>
// This source code is subject to the terms of the Mozilla Public License 2.0 at mozilla.org
// © TraderHalai
// This script was born out of my quest to be able to display strategy back test statistics on charts to allow for easier backtesting on devices that do not natively support backtest engine (such as mobile phones, when I am backtesting from away from my computer). There are already a few good ones on TradingView, but most / many are too complicated for my needs.
//
//Found an excellent display backtest engine by 'The Art of Trading'. This script is a snippet of his hard work, with some very minor tweaks and changes. Much respect to the original author.
//
//Full credit to the original author of this script. It can be found here: www.tradingview.com
//
// This script can be copied and airlifted onto existing strategy scripts of your own, and integrates out of the box without implementation of additional functions. I've also added Max Runup, Average Win and Average Loss per trade to the orignal script.
//
//Will look to add in more performance metrics in future, as I further develop this script.
//
//Feel free to use this display panel in your scripts and strategies.
//Thanks and enjoy! :)
//@version=5
//strategy("Strategy BackTest Display Statistics - TraderHalai", overlay=true, default_qty_value= 5, default_qty_type = strategy.percent_of_equity, initial_capital=10000, commission_type=strategy.commission.percent, commission_value=0.1)
//DEMO basic strategy - Use your own strategy here - Jaws Mean Reversion from my profile used here
//source = input(title = "Source", defval = close)
///////////////////////////// --- BEGIN TESTER CODE --- ////////////////////////
// COPY below into your strategy to enable display
////////////////////////////////////////////////////////////////////////////////
// Declare performance tracking variables
drawTester = input.bool(true, "Strategy Performance", group='Dashboards', inline="Show Dashboards")
var balance = strategy.initial_capital
var drawdown = 0.0
var maxDrawdown = 0.0
var maxBalance = 0.0
var totalWins = 0
var totalLoss = 0
// Prepare stats table
var table testTable = table.new(position.top_right, 5, 2, border_width=1)
f_fillCell(_table, _column, _row, _title, _value, _bgcolor, _txtcolor) =>
_cellText = _title + "\n" + _value
table.cell(_table, _column, _row, _cellText, bgcolor=_bgcolor, text_color=_txtcolor)
// Custom function to truncate (cut) excess decimal places
//truncate(_number, _decimalPlaces) =>
// _factor = math.pow(10, _decimalPlaces)
// int(_number * _factor) / _factor
// Draw stats table
var bgcolor = color.new(color.black,0)
if drawTester and tradeDateIsAllowed
if barstate.islastconfirmedhistory
// Update table
dollarReturn = strategy.netprofit
f_fillCell(testTable, 0, 0, "Total Trades:", str.tostring(strategy.closedtrades), bgcolor, color.white)
f_fillCell(testTable, 0, 1, "Win Rate:", str.tostring(truncate((strategy.wintrades/strategy.closedtrades)*100,2)) + "%", bgcolor, color.white)
f_fillCell(testTable, 1, 0, "Starting:", "$" + str.tostring(strategy.initial_capital), bgcolor, color.white)
f_fillCell(testTable, 1, 1, "Ending:", "$" + str.tostring(truncate(strategy.initial_capital + strategy.netprofit,2)), bgcolor, color.white)
f_fillCell(testTable, 2, 0, "Avg Win:", "$"+ str.tostring(truncate(strategy.grossprofit / strategy.wintrades, 2)), bgcolor, color.white)
f_fillCell(testTable, 2, 1, "Avg Loss:", "$"+ str.tostring(truncate(strategy.grossloss / strategy.losstrades, 2)), bgcolor, color.white)
f_fillCell(testTable, 3, 0, "Profit Factor:", str.tostring(truncate(strategy.grossprofit / strategy.grossloss,2)), strategy.grossprofit > strategy.grossloss ? color.green : color.red, color.white)
f_fillCell(testTable, 3, 1, "Max Runup:", str.tostring(truncate(strategy.max_runup, 2 )), bgcolor, color.white)
f_fillCell(testTable, 4, 0, "Return:", (dollarReturn > 0 ? "+" : "") + str.tostring(truncate((dollarReturn / strategy.initial_capital)*100,2)) + "%", dollarReturn > 0 ? color.green : color.red, color.white)
f_fillCell(testTable, 4, 1, "Max DD:", str.tostring(truncate((strategy.max_drawdown / strategy.equity) * 100 ,2)) + "%", color.red, color.white)
// --- END TESTER CODE --- ///////////////
// This Pine Script™ code is subject to the terms of the Mozilla Public License 2.0 at mozilla.org
// © niceGear68734
//@version=5
//strategy("Table to filter trades per day", overlay=true, use_bar_magnifier = true, initial_capital = 5000, calc_on_every_tick = true, calc_on_order_fills = true, commission_type = strategy.commission.cash_per_contract)
//~ ___________________________________________________________________________
//~ !!!!!!!!!!!!!!!!!!!!!!!!!!!!!!!!!!!!!!!!!!!!!!!!!!!!!!!!!!!!!!!!!!!!!!!!!!!
//~ !!!!!!!!!!!!!!!_________________ START _________________!!!!!!!!!!!!!!!!!
i_showweeklyPerformance = input.bool(false, 'Weekly Performance', group='Dashboards', inline="Show Dashboards")
//__________________________ User Inputs ___________________________________
var const string g_table = "Table Settings"
i_table_pos = "Top Left" //input.string(defval = "Top Left", title = "Position", options = , group = g_table, inline = "1", tooltip = "It sets the location of the table")
i_text_size = "Normal" //input.string(defval = "Normal", title = "Set the size of text", options = , tooltip = "This option is used to change the size of the text in the table")
var const string g_general = "General Settings"
i_check_open_close = "Opened" //input.string("Opened", "Check when the trade :", , group = g_general, tooltip = "This parameter defines what to check for. If opened is selected, the results will show the trades that opened on that day. If closed is selected, the results will show the trades that closed on that day")
i_timezone = "Exchange" //input.string("Exchange", title = "Set the Timezone", options = , group = g_general, tooltip = "You can use this setting whenever you want to change the time that the trade has closed/opened")
//~_____________________________ Switches ___________________________________
table_pos = switch i_table_pos
"Bottom Right" => position.bottom_right
"Bottom Left" => position.bottom_left
"Top Right" => position.top_right
"Top Left" => position.top_left
timezone_setting = i_timezone == "Exchange" ? syminfo.timezone : i_timezone
text_size = switch i_text_size
"Small" => size.small
"Normal" => size.normal
"Large" => size.large
//__________________________ Array Declaration _____________________________
var string t_column_names = array.from( "", "Sun", "Mon", "Tue", "Wed", "Thur", "Fri", "Sat") // Columns header names
var string t_row_names = array.from("", "Total Trades", "Loss", "Win", "Win Rate" ) // Rows header names
var t_column_size = array.size(t_column_names)
var t_row_size = array.size(t_row_names)
var string a_closed_trades = array.new_string() // Save the total number of trades
var string a_loss_trades = array.new_string() // Save the number of losing trades
var string a_win_trades = array.new_string() // Save the number of winning trades
var _a_day_week = array.new_int() // Save the day of the week to split data
// __________________________ Custom Functions ________________________________
//~ create a counter so that it gives a number to strategy.closed_trades.entry_time(counter)
var trade_number = -1
if strategy.closedtrades > strategy.closedtrades
trade_number += 1
f_strategy_closedtrades_hour() =>
switch
i_check_open_close =="Closed" => dayofweek(strategy.closedtrades.exit_time(trade_number), timezone_setting)
i_check_open_close =="Opened" => dayofweek(strategy.closedtrades.entry_time(trade_number), timezone_setting)
f_data(_i) =>
var _closed_trades = 0
var _loss_trades = 0
var _win_trades = 0
var _txt_closed_trades = ""
var _txt_loss_trades = ""
var _txt_win_trades = ""
if strategy.closedtrades > strategy.closedtrades and f_strategy_closedtrades_hour() == _i
_closed_trades += 1
_txt_closed_trades := str.tostring(_closed_trades)
if strategy.losstrades > strategy.losstrades and f_strategy_closedtrades_hour() == _i
_loss_trades += 1
_txt_loss_trades := str.tostring(_loss_trades)
if strategy.wintrades > strategy.wintrades and f_strategy_closedtrades_hour() == _i
_win_trades += 1
_txt_win_trades := str.tostring(_win_trades)
//__________________________
var string array1 = array.new_string(5)
var string array2 = array.new_string(5)
var string array3 = array.new_string(5)
var string array4 = array.new_string(5)
var string array5 = array.new_string(5)
var string array6 = array.new_string(5)
var string array7 = array.new_string(5)
f_pass_data_to_array(_i, _array) =>
= f_data(_i)
array.set(_array,1 , cl)
array.set(_array,2,loss)
array.set(_array,3,win)
if cl != ""
array.set(_array,4,str.tostring(str.tonumber(win) / str.tonumber(cl) * 100 , "##") + " %")
if cl != "" and win == ""
array.set(_array,4,"0 %")
for i = 1 to 7
switch
i == 1 => f_pass_data_to_array(i,array1)
i == 2 => f_pass_data_to_array(i,array2)
i == 3 => f_pass_data_to_array(i,array3)
i == 4 => f_pass_data_to_array(i,array4)
i == 5 => f_pass_data_to_array(i,array5)
i == 6 => f_pass_data_to_array(i,array6)
i == 7 => f_pass_data_to_array(i,array7)
f_retrieve_data_to_table(_i, _j) =>
switch
_i == 1 => array.get(array1, _j)
_i == 2 => array.get(array2, _j)
_i == 3 => array.get(array3, _j)
_i == 4 => array.get(array4, _j)
_i == 5 => array.get(array5, _j)
_i == 6 => array.get(array6, _j)
_i == 7 => array.get(array7, _j)
//~ ___________________________ Create Table ________________________________
create_table(_col, _row, _txt) =>
var table _tbl = table.new(position = table_pos, columns = t_column_size , rows = t_row_size, border_width=1)
color _color = _row == 0 or _col == 0 ? color.rgb(3, 62, 106) : color.rgb(2, 81, 155)
table.cell(_tbl, _col, _row, _txt, bgcolor = _color, text_color = color.white, text_size = text_size)
//~___________________________ Fill With Data _______________________________
if barstate.islastconfirmedhistory and i_showweeklyPerformance and tradeDateIsAllowed
for i = 0 to t_column_size - 1 by 1
for j = 0 to t_row_size - 1 by 1
_txt = ""
if i >= 0 and j == 0
_txt := array.get(t_column_names, i)
if j >= 0 and i == 0
_txt := array.get(t_row_names, j)
if i >= 1 and j >= 1 and j <= 5
_txt := f_retrieve_data_to_table( i , j)
create_table(i ,j , _txt)
//~ ___________________________ Notice ______________________________________
if timeframe.in_seconds() > timeframe.in_seconds("D")
x = table.new(position.middle_center,1,1,color.aqua)
table.cell_set_text(x,0,0,"Please select lower timeframes (Daily or lower)")
//~ !!!!!!!!!!!!!!!_________________ STOP _________________!!!!!!!!!!!!!!!!!!
//~ !!!!!!!!!!!!!!!!!!!!!!!!!!!!!!!!!!!!!!!!!!!!!!!!!!!!!!!!!!!!!!!!!!!!!!!!!!!
//~ ___________________________________________________________________________
// Global Dashboard Variables
// ░░░░░░░░░░░░░░░░░░░░░░░░░░░░░░░░░░░░░░░░░░░░░░░░░░░░░░░░░░░░░░░░░░░░░░░░░░░░░░░░░░░░░░░░░░░░░░░░░░░░░░░░░░░░░░░░░░░░░░░░░░░░░░░░░░░░░░░░░░░░░░░░░░
// Dashboard Table Text Size
i_tableTextSize = "Normal" //input.string(title="Dashboard Size", defval="Normal", options= , group="Dashboards")
table_text_size(s) =>
switch s
"Auto" => size.auto
"Huge" => size.huge
"Large" => size.large
"Normal" => size.normal
"Small" => size.small
=> size.tiny
tableTextSize = table_text_size(i_tableTextSize)
// Monthly Table Performance Dashboard By @QuantNomad
// ░░░░░░░░░░░░░░░░░░░░░░░░░░░░░░░░░░░░░░░░░░░░░░░░░░░░░░░░░░░░░░░░░░░░░░░░░░░░░░░░░░░░░░░░░░░░░░░░░░░░░░░░░░░░░░░░░░░░░░░░░░░░░░░░░░░░░░░░░░░░░░░░░░
i_showMonthlyPerformance = input.bool(false, 'Monthly Performance', group='Dashboards', inline="Show Dashboards")
i_monthlyReturnPercision = 2
if i_showMonthlyPerformance and tradeDateIsAllowed
new_month = month(time) != month(time )
new_year = year(time) != year(time )
eq = strategy.equity
bar_pnl = eq / eq - 1
cur_month_pnl = 0.0
cur_year_pnl = 0.0
// Current Monthly P&L;
cur_month_pnl := new_month ? 0.0 :
(1 + cur_month_pnl ) * (1 + bar_pnl) - 1
// Current Yearly P&L;
cur_year_pnl := new_year ? 0.0 :
(1 + cur_year_pnl ) * (1 + bar_pnl) - 1
// Arrays to store Yearly and Monthly P&Ls;
var month_pnl = array.new_float(0)
var month_time = array.new_int(0)
var year_pnl = array.new_float(0)
var year_time = array.new_int(0)
last_computed = false
if (not na(cur_month_pnl ) and (new_month or barstate.islastconfirmedhistory))
if (last_computed )
array.pop(month_pnl)
array.pop(month_time)
array.push(month_pnl , cur_month_pnl )
array.push(month_time, time )
if (not na(cur_year_pnl ) and (new_year or barstate.islastconfirmedhistory))
if (last_computed )
array.pop(year_pnl)
array.pop(year_time)
array.push(year_pnl , cur_year_pnl )
array.push(year_time, time )
last_computed := barstate.islastconfirmedhistory ? true : nz(last_computed )
// Monthly P&L; Table
var monthly_table = table(na)
if (barstate.islastconfirmedhistory)
monthly_table := table.new(position.bottom_right, columns = 14, rows = array.size(year_pnl) + 1, border_width = 1)
table.cell(monthly_table, 0, 0, "", bgcolor = #cccccc, text_size=tableTextSize)
table.cell(monthly_table, 1, 0, "Jan", bgcolor = #cccccc, text_size=tableTextSize)
table.cell(monthly_table, 2, 0, "Feb", bgcolor = #cccccc, text_size=tableTextSize)
table.cell(monthly_table, 3, 0, "Mar", bgcolor = #cccccc, text_size=tableTextSize)
table.cell(monthly_table, 4, 0, "Apr", bgcolor = #cccccc, text_size=tableTextSize)
table.cell(monthly_table, 5, 0, "May", bgcolor = #cccccc, text_size=tableTextSize)
table.cell(monthly_table, 6, 0, "Jun", bgcolor = #cccccc, text_size=tableTextSize)
table.cell(monthly_table, 7, 0, "Jul", bgcolor = #cccccc, text_size=tableTextSize)
table.cell(monthly_table, 8, 0, "Aug", bgcolor = #cccccc, text_size=tableTextSize)
table.cell(monthly_table, 9, 0, "Sep", bgcolor = #cccccc, text_size=tableTextSize)
table.cell(monthly_table, 10, 0, "Oct", bgcolor = #cccccc, text_size=tableTextSize)
table.cell(monthly_table, 11, 0, "Nov", bgcolor = #cccccc, text_size=tableTextSize)
table.cell(monthly_table, 12, 0, "Dec", bgcolor = #cccccc, text_size=tableTextSize)
table.cell(monthly_table, 13, 0, "Year", bgcolor = #999999, text_size=tableTextSize)
for yi = 0 to array.size(year_pnl) - 1
table.cell(monthly_table, 0, yi + 1, str.tostring(year(array.get(year_time, yi))), bgcolor = #cccccc, text_size=tableTextSize)
y_color = array.get(year_pnl, yi) > 0 ? color.new(color.teal, transp = 40) : color.new(color.gray, transp = 40)
table.cell(monthly_table, 13, yi + 1, str.tostring(math.round(array.get(year_pnl, yi) * 100, i_monthlyReturnPercision)), bgcolor = y_color, text_color=color.new(color.white, 0),text_size=tableTextSize)
for mi = 0 to array.size(month_time) - 1
m_row = year(array.get(month_time, mi)) - year(array.get(year_time, 0)) + 1
m_col = month(array.get(month_time, mi))
m_color = array.get(month_pnl, mi) > 0 ? color.new(color.teal, transp = 40) : color.new(color.maroon, transp = 40)
table.cell(monthly_table, m_col, m_row, str.tostring(math.round(array.get(month_pnl, mi) * 100, i_monthlyReturnPercision)), bgcolor = m_color, text_color=color.new(color.white, 0), text_size=tableTextSize)
hide = timeframe.isintraday
// Input for EMA period
emaPeriod = 48 //input.int(48, title="EMA Period")
emaPeriod2 = 2 //input.int(2, title="EME Period 2")
emaPeriod3 = 21 //input.int(21, title="EMA Period")
// Input to toggle EMA Cloud
showcloud = input.bool(true, title="Plot EMA?", group='EMA & ATR', inline="Show EMA's & ATR")
useHTF = input.bool(true, title = "Use Higher Time Frame?")
matimeframe = useHTF ? my_time1 : ''
// EMA calculations
ema = request.security(syminfo.tickerid, matimeframe, ta.ema(close, emaPeriod))
ema2 = request.security(syminfo.tickerid, matimeframe, ta.ema(close,emaPeriod2))
ema3 = request.security(syminfo.tickerid, matimeframe,ta.ema(close, emaPeriod3))
emaColor = close > ema3 ? color.new(color.rgb(56, 142, 60, 63), 50) : color.new(color.rgb(147, 40, 51, 38), 50)
// Plotting EMA's
plot_ema1 = plot(hide ? ema : na, style=plot.style_line, color=color.new(color.rgb(255, 255, 255, 100), 50), title="EMA", linewidth=2)
plot_ema2 = plot(hide ? ema2 : na, style=plot.style_line, color=color.new(color.rgb(255, 255, 255, 100), 50), title="EMA", linewidth=1)
plot_ema3 = plot(ema3, style=plot.style_line, color=emaColor, title="EMA", linewidth=1)
// EMA Cloud
cloudColor = ema2 > ema ? color.new(#0f8513, 80) : color.new(#a81414, 80)
cloudColor2 = ema2 > ema3 ? color.new(#0f8513, 50) : color.new(#a81414, 50)
cloudColor := showcloud ? cloudColor : na
fill(plot_ema1, plot_ema2, color=cloudColor, title="EMA Cloud")
fill(plot_ema3, plot_ema2, color=cloudColor, title="EMA Cloud")
/////////////////////////////////////////////////////////////// © BackQuant ///////////////////////////////////////////////////////////////
// This Pine Script™ code is subject to the terms of the Mozilla Public License 2.0 at mozilla.org
// © BackQuant
import TradingView/ta/4 as ta
//@version=5
//indicator(
// title="DEMA Adjusted Average True Range ",
// shorttitle = "DEMA ATR ",
// overlay=true,
// timeframe="",
// timeframe_gaps=true
// )
// Define User Inputs
simple bool showAtr = input.bool(true, "Plot Dema?", group='EMA & ATR', inline="Show EMA's & ATR")
simple bool haCandles = true //input.bool(true, "Use HA Candles?")
simple int periodDema = 7 //input.int(7, "Dema Period", group = "Dema Atr")
series float sourceDema = close //input.source(close, "Calculation Source", group = "Dema Atr")
simple int periodAtr = 14 //input.int(14, "Period", group = "Dema Atr")
simple float factorAtr = 1.7 //input.float(1.7, "Factor", step = 0.01, group = "Dema Atr")
simple color longColour = #00ff00
simple color shortColour = #ff0000
/////////////////////////////////////////////////////////////// © BackQuant ///////////////////////////////////////////////////////////////
// Use HA Candles?
heikinashi_close = request.security(
symbol = ticker.heikinashi(syminfo.tickerid),
timeframe = timeframe.period,
expression = close,
gaps = barmerge.gaps_off,
lookahead = barmerge.lookahead_on
)
var series float source = close
if haCandles == true
source := heikinashi_close
if haCandles == false
source := sourceDema
/////////////////////////////////////////////////////////////// © BackQuant ///////////////////////////////////////////////////////////////
// Function
DemaAtrWithBands(periodDema, source, lookback, atrFactor)=>
ema1 = ta.ema(source, periodDema)
ema2 = ta.ema(ema1, periodDema)
demaOut = 2 * ema1 - ema2
atr = ta.atr(lookback)
trueRange = atr * atrFactor
DemaAtr = demaOut
DemaAtr := nz(DemaAtr , DemaAtr)
trueRangeUpper = demaOut + trueRange
trueRangeLower = demaOut - trueRange
if trueRangeLower > DemaAtr
DemaAtr := trueRangeLower
if trueRangeUpper < DemaAtr
DemaAtr := trueRangeUpper
DemaAtr
// Function Out
DemaAtr = DemaAtrWithBands(periodDema, source, periodAtr, factorAtr)
/////////////////////////////////////////////////////////////// © BackQuant ///////////////////////////////////////////////////////////////
// Conditions
DemaAtrLong = DemaAtr > DemaAtr
DemaAtrShort = DemaAtr < DemaAtr
// Colour Condtions
var color Trendcolor = #ffffff
if DemaAtrLong
Trendcolor := longColour
if DemaAtrShort
Trendcolor := shortColour
// Plotting
plot( showAtr ? DemaAtr : na, "ATR", color=Trendcolor, linewidth = 2 )
// ==========================================================================================
SMA Stufen-TP Strategie (200/100/50/25) mit ReentryStrategy Description for TradingView: Multi-SMA Momentum & Reentry System
This Pine Script strategy, named "SMA Stufen-TP Strategie (200/100/50/25) mit Reentry," is a Long-Only trend-following system designed to capitalize on upward momentum and capture significant gains while incorporating sophisticated logic for reentry after corrections.
The system relies on four Simple Moving Averages (SMAs): SMA 200, SMA 100, SMA 50, and SMA 25. These indicators are used to define the trend structure, trigger entries, and set dynamic, layered Take-Profit (TP) levels.
Entry Rules
The strategy has one main entry and two specific reentry triggers:
Main Entry (Standard Trend): A long position is opened when the price crosses above the SMA 200. This acts as the initial signal for a strong, long-term uptrend.
Reentry 1 (Medium Correction): This reentry is sought after an official exit (Stop Loss or Take Profit). It is permitted if the SMA 100 is above the SMA 200 and two conditions are met: the price previously dipped below the SMA 100 during the correction, and it now closes two consecutive bars above the SMA 100. This targets a confirmed bounce within an overall bullish structure.
Reentry 2 (Deep Correction/Momentum Shift): This triggers during a deep correction where all shorter SMAs (100, 50, 25) are below the SMA 200. Reentry occurs when the SMA 25 crosses above the SMA 50, signaling a powerful short-term momentum shift that precedes a larger recovery.
Exit and Take-Profit Logic
Exits are governed by a prioritized system including a fixed Stop Loss and three dynamic Take-Profit stages.
A. Stop Loss (Highest Priority)
The primary risk control is a fixed Stop Loss at -10% below the entry price. This is always the first exit condition checked.
B. Layered Take-Profits (TP)
Profits are secured using a step-wise mechanism that trails the price using the shorter SMAs, but only after specific profit thresholds are met. This ensures that the strategy provides ample room for a strong rally while securing gains as the trend matures.
TP Stage 1: Activated when the price first crosses above the SMA 100. The position is closed if the profit reaches 10% or more and the price closes two consecutive bars below the SMA 100.
TP Stage 2: Activated when the price first crosses above the SMA 50. The position is closed if the profit reaches 20% or more and the price closes two consecutive bars below the SMA 50.
TP Stage 3: Activated when the price first crosses above the SMA 25. The position is closed if the profit reaches 40% or more and the price closes two consecutive bars below the SMA 25.
The exit priority ensures that the tightest active stop is used: Stop Loss takes precedence, followed by TP 3 (the highest profit and tightest trail), then TP 2, and finally TP 1.

Range Oscillator Strategy + Stoch Confirm🔹 Short summary
This is a free, educational long-only strategy built on top of the public “Range Oscillator” by Zeiierman (used under CC BY-NC-SA 4.0), combined with a Stochastic timing filter, an EMA-based exit filter and an optional risk-management layer (SL/TP and R-multiple exits). It is NOT financial advice and it is NOT a magic money machine. It’s a structured framework to study how range-expansion + momentum + trend slope can be combined into one rule-based system, often with intentionally RARE trades.
────────────────────────
0. Legal / risk disclaimer
────────────────────────
• This script is FREE and public. I do not charge any fee for it.
• It is for EDUCATIONAL PURPOSES ONLY.
• It is NOT financial advice and does NOT guarantee profits.
• Backtest results can be very different from live results.
• Markets change over time; past performance is NOT indicative of future performance.
• You are fully responsible for your own trades and risk.
Please DO NOT use this script with money you cannot afford to lose. Always start in a demo / paper trading environment and make sure you understand what the logic does before you risk any capital.
────────────────────────
1. About default settings and risk (very important)
────────────────────────
The script is configured with the following defaults in the `strategy()` declaration:
• `initial_capital = 10000`
→ This is only an EXAMPLE account size.
• `default_qty_type = strategy.percent_of_equity`
• `default_qty_value = 100`
→ This means 100% of equity per trade in the default properties.
→ This is AGGRESSIVE and should be treated as a STRESS TEST of the logic, not as a realistic way to trade.
TradingView’s House Rules recommend risking only a small part of equity per trade (often 1–2%, max 5–10% in most cases). To align with these recommendations and to get more realistic backtest results, I STRONGLY RECOMMEND you to:
1. Open **Strategy Settings → Properties**.
2. Set:
• Order size: **Percent of equity**
• Order size (percent): e.g. **1–2%** per trade
3. Make sure **commission** and **slippage** match your own broker conditions.
• By default this script uses `commission_value = 0.1` (0.1%) and `slippage = 3`, which are reasonable example values for many crypto markets.
If you choose to run the strategy with 100% of equity per trade, please treat it ONLY as a stress-test of the logic. It is NOT a sustainable risk model for live trading.
────────────────────────
2. What this strategy tries to do (conceptual overview)
────────────────────────
This is a LONG-ONLY strategy designed to explore the combination of:
1. **Range Oscillator (Zeiierman-based)**
- Measures how far price has moved away from an adaptive mean.
- Uses an ATR-based range to normalize deviation.
- High positive oscillator values indicate strong price expansion away from the mean in a bullish direction.
2. **Stochastic as a timing filter**
- A classic Stochastic (%K and %D) is used.
- The logic requires %K to be below a user-defined level and then crossing above %D.
- This is intended to catch moments when momentum turns up again, rather than chasing every extreme.
3. **EMA Exit Filter (trend slope)**
- An EMA with configurable length (default 70) is calculated.
- The slope of the EMA is monitored: when the slope turns negative while in a long position, and the filter is enabled, it triggers an exit condition.
- This acts as a trend-protection exit: if the medium-term trend starts to weaken, the strategy exits even if the oscillator has not yet fully reverted.
4. **Optional risk-management layer**
- Percentage-based Stop Loss and Take Profit (SL/TP).
- Risk/Reward (R-multiple) exit based on the distance from entry to SL.
- Implemented as OCO orders that work *on top* of the logical exits.
The goal is not to create a “holy grail” system but to serve as a transparent, configurable framework for studying how these concepts behave together on different markets and timeframes.
────────────────────────
3. Components and how they work together
────────────────────────
(1) Range Oscillator (based on “Range Oscillator (Zeiierman)”)
• The script computes a weighted mean price and then measures how far price deviates from that mean.
• Deviation is normalized by an ATR-based range and expressed as an oscillator.
• When the oscillator is above the **entry threshold** (default 100), it signals a strong move away from the mean in the bullish direction.
• When it later drops below the **exit threshold** (default 30), it can trigger an exit (if enabled).
(2) Stochastic confirmation
• Classic Stochastic (%K and %D) is calculated.
• An entry requires:
- %K to be below a user-defined “Cross Level”, and
- then %K to cross above %D.
• This is a momentum confirmation: the strategy tries to enter when momentum turns up from a pullback rather than at any random point.
(3) EMA Exit Filter
• The EMA length is configurable via `emaLength` (default 70).
• The script monitors the EMA slope: it computes the relative change between the current EMA and the previous EMA.
• If the slope turns negative while the strategy holds a long position and the filter is enabled, it triggers an exit condition.
• This is meant to help protect profits or cut losses when the medium-term trend starts to roll over, even if the oscillator conditions are not (yet) signalling exit.
(4) Risk management (optional)
• Stop Loss (SL) and Take Profit (TP):
- Defined as percentages relative to average entry price.
- Both are disabled by default, but you can enable them in the Inputs.
• Risk/Reward Exit:
- Uses the distance from entry to SL to project a profit target at a configurable R-multiple.
- Also optional and disabled by default.
These exits are implemented as `strategy.exit()` OCO orders and can close trades independently of oscillator/EMA conditions if hit first.
────────────────────────
4. Entry & Exit logic (high level)
────────────────────────
A) Time filter
• You can choose a **Start Year** in the Inputs.
• Only candles between the selected start date and 31 Dec 2069 are used for backtesting (`timeCondition`).
• This prevents accidental use of tiny cherry-picked windows and makes tests more honest.
B) Entry condition (long-only)
A long entry is allowed when ALL the following are true:
1. `timeCondition` is true (inside the backtest window).
2. If `useOscEntry` is true:
- Range Oscillator value must be above `entryLevel`.
3. If `useStochEntry` is true:
- Stochastic condition (`stochCondition`) must be true:
- %K < `crossLevel`, then %K crosses above %D.
If these filters agree, the strategy calls `strategy.entry("Long", strategy.long)`.
C) Exit condition (logical exits)
A position can be closed when:
1. `timeCondition` is true AND a long position is open, AND
2. At least one of the following is true:
- If `useOscExit` is true: Oscillator is below `exitLevel`.
- If `useMagicExit` (EMA Exit Filter) is true: EMA slope is negative (`isDown = true`).
In that case, `strategy.close("Long")` is called.
D) Risk-management exits
While a position is open:
• If SL or TP is enabled:
- `strategy.exit("Long Risk", ...)` places an OCO stop/limit order based on the SL/TP percentages.
• If Risk/Reward exit is enabled:
- `strategy.exit("RR Exit", ...)` places an OCO order using a projected R-multiple (`rrMult`) of the SL distance.
These risk-based exits can trigger before the logical oscillator/EMA exits if price hits those levels.
────────────────────────
5. Recommended backtest configuration (to avoid misleading results)
────────────────────────
To align with TradingView House Rules and avoid misleading backtests:
1. **Initial capital**
- 10 000 (or any value you personally want to work with).
2. **Order size**
- Type: **Percent of equity**
- Size: **1–2%** per trade is a reasonable starting point.
- Avoid risking more than 5–10% per trade if you want results that could be sustainable in practice.
3. **Commission & slippage**
- Commission: around 0.1% if that matches your broker.
- Slippage: a few ticks (e.g. 3) to account for real fills.
4. **Timeframe & markets**
- Volatile symbols (e.g. crypto like BTCUSDT, or major indices).
- Timeframes: 1H / 4H / **1D (Daily)** are typical starting points.
- I strongly recommend trying the strategy on **different timeframes**, for example 1D, to see how the behaviour changes between intraday and higher timeframes.
5. **No “caution warning”**
- Make sure your chosen symbol + timeframe + settings do not trigger TradingView’s caution messages.
- If you see warnings (e.g. “too few trades”), adjust timeframe/symbol or the backtest period.
────────────────────────
5a. About low trade count and rare signals
────────────────────────
This strategy is intentionally designed to trade RARELY:
• It is **long-only**.
• It uses strict filters (Range Oscillator threshold + Stochastic confirmation + optional EMA Exit Filter).
• On higher timeframes (especially **1D / Daily**) this can result in a **low total number of trades**, sometimes WELL BELOW 100 trades over the whole backtest.
TradingView’s House Rules mention 100+ trades as a guideline for more robust statistics. In this specific case:
• The **low trade count is a conscious design choice**, not an attempt to cherry-pick a tiny, ultra-profitable window.
• The goal is to study a **small number of high-conviction long entries** on higher timeframes, not to generate frequent intraday signals.
• Because of the low trade count, results should NOT be interpreted as statistically strong or “proven” – they are only one sample of how this logic would have behaved on past data.
Please keep this in mind when you look at the equity curve and performance metrics. A beautiful curve with only a handful of trades is still just a small sample.
────────────────────────
6. How to use this strategy (step-by-step)
────────────────────────
1. Add the script to your chart.
2. Open the **Inputs** tab:
- Set the backtest start year.
- Decide whether to use Oscillator-based entry/exit, Stochastic confirmation, and EMA Exit Filter.
- Optionally enable SL, TP, and Risk/Reward exits.
3. Open the **Properties** tab:
- Set a realistic account size if you want.
- Set order size to a realistic % of equity (e.g. 1–2%).
- Confirm that commission and slippage are realistic for your broker.
4. Run the backtest:
- Look at Net Profit, Max Drawdown, number of trades, and equity curve.
- Remember that a low trade count means the statistics are not very strong.
5. Experiment:
- Tweak thresholds (`entryLevel`, `exitLevel`), Stochastic settings, EMA length, and risk params.
- See how the metrics and trade frequency change.
6. Forward-test:
- Before using any idea in live trading, forward-test on a demo account and observe behaviour in real time.
────────────────────────
7. Originality and usefulness (why this is more than a mashup)
────────────────────────
This script is not intended to be a random visual mashup of indicators. It is designed as a coherent, testable strategy with clear roles for each component:
• Range Oscillator:
- Handles mean vs. range-expansion states via an adaptive, ATR-normalized metric.
• Stochastic:
- Acts as a timing filter to avoid entering purely on extremes and instead waits for momentum to turn.
• EMA Exit Filter:
- Trend-slope-based safety net to exit when the medium-term direction changes against the position.
• Risk module:
- Provides practical, rule-based exits: SL, TP, and R-multiple exit, which are useful for structuring risk even if you modify the core logic.
It aims to give traders a ready-made **framework to study and modify**, not a black box or “signals” product.
────────────────────────
8. Limitations and good practices
────────────────────────
• No single strategy works on all markets or in all regimes.
• This script is long-only; it does not short the market.
• Performance can degrade when market structure changes.
• Overfitting (curve fitting) is a real risk if you endlessly tweak parameters to maximise historical profit.
Good practices:
- Test on multiple symbols and timeframes.
- Focus on stability and drawdown, not only on how high the profit line goes.
- View this as a learning tool and a basis for your own research.
────────────────────────
9. Licensing and credits
────────────────────────
• Core oscillator idea & base code:
- “Range Oscillator (Zeiierman)”
- © Zeiierman, licensed under CC BY-NC-SA 4.0.
• Strategy logic, Stochastic confirmation, EMA Exit Filter, and risk-management layer:
- Modifications by jokiniemi.
Please respect both the original license and TradingView House Rules if you fork or republish any part of this script.
────────────────────────
10. No payments / no vendor pitch
────────────────────────
• This script is completely FREE to use on TradingView.
• There is no paid subscription, no external payment link, and no private signals group attached to it.
• If you have questions, please use TradingView’s comment system or private messages instead of expecting financial advice.
Use this script as a tool to learn, experiment, and build your own understanding of markets.
────────────────────────
11. Example backtest settings used in screenshots
────────────────────────
To avoid any confusion about how the results shown in screenshots were produced, here is one concrete example configuration:
• Symbol: BTCUSDT (or similar major BTC pair)
• Timeframe: 1D (Daily)
• Backtest period: from 2018 to the most recent data
• Initial capital: 10 000
• Order size type: Percent of equity
• Order size: 2% per trade
• Commission: 0.1%
• Slippage: 3 ticks
• Risk settings: Stop Loss and Take Profit disabled by default, Risk/Reward exit disabled by default
• Filters: Range Oscillator entry/exit enabled, Stochastic confirmation enabled, EMA Exit Filter enabled
If you change any of these settings (symbol, timeframe, risk per trade, commission, slippage, filters, etc.), your results will look different. Please always adapt the configuration to your own risk tolerance, market, and trading style.

TraderDemircan Auto Fibonacci RetracementDescription:
What This Indicator Does:This indicator automatically identifies significant swing high and swing low points within a customizable lookback period and draws comprehensive Fibonacci retracement and extension levels between them. Unlike the manual Fibonacci tool that requires you to constantly redraw levels as price action evolves, this automated version continuously updates the Fibonacci grid based on the most recent major swing points, ensuring you always have current and relevant support/resistance zones displayed on your chart.Key Features:
Automatic Swing Detection: Continuously scans the specified lookback period to find the most significant high and low points, eliminating manual drawing errors
Comprehensive Level Coverage: Plots 16 Fibonacci levels including 7 retracement levels (0.0 to 1.0) and 9 extension levels (1.115 to 3.618)
Top-Down Methodology: Draws from swing high to swing low (right-to-left), following the traditional Fibonacci retracement convention where 100% is at the top
Dual Labeling System: Shows both exact price values and Fibonacci percentages for easy reference
Complete Customization: Individual toggle controls and color selection for each of the 16 levels
Flexible Display Options: Adjust line thickness (1-5), style (solid/dashed/dotted), and extension direction (left/right/both)
Visual Swing Markers: Red diamond at the swing high (starting point) and green diamond at the swing low (ending point)
Optional Trend Line: Connects the two swing points to visualize the overall price movement direction
How It Works:The indicator employs a sophisticated swing point detection algorithm that operates in two stages:Stage 1 - Find the Swing Low (Support Base):
Scans the entire lookback period to identify the lowest low, which becomes the anchor point (0.0 level in traditional retracement terms, though displayed at the bottom of the grid).Stage 2 - Find the Swing High (Resistance Peak):
After identifying the swing low, searches for the highest high that occurred after that low point, establishing the swing range. This creates a valid price movement range for Fibonacci analysis.Fibonacci Calculation Method:
The indicator uses the top-down approach where:
1.0 Level = Swing High (100% retracement, the top)
0.0 Level = Swing Low (0% retracement, the bottom)
Retracement Levels (0.236 to 0.786) = Potential support zones during pullbacks from the high
Extension Levels (1.115 to 3.618) = Potential target zones below the swing low
Formula: Price = SwingHigh - (SwingHigh - SwingLow) × FibonacciLevelThis ensures that 0.0 is at the bottom and extensions (>1.0) plot below the swing low, following standard Fibonacci retracement convention.Fibonacci Levels Explained:Retracement Levels (0.0 - 1.0):
0.0 (Gray): Swing low - the base support level
0.236 (Red): Shallow retracement, first minor support
0.382 (Orange): Moderate retracement, commonly watched support
0.5 (Purple): Psychological midpoint, significant support/resistance
0.618 (Blue - Golden Ratio): The most important retracement level, high-probability reversal zone
0.786 (Cyan): Deep retracement, last defense before full reversal
1.0 (Gray): Swing high - the initial resistance level
Extension Levels (1.115 - 3.618):
1.115 (Green): First extension, minimal downside target
1.272 (Light Green): Minor extension, common profit target
1.414 (Yellow-Green): Square root of 2, mathematical significance
1.618 (Gold - Golden Extension): Primary downside target, most watched extension level
2.0 (Orange-Red): 200% extension, psychological round number
2.382 (Pink): Secondary extension target
2.618 (Purple): Deep extension, major target zone
3.272 (Deep Purple): Extreme extension level
3.618 (Blue): Maximum extension, rare but powerful target
How to Use:For Retracement Trading (Buying Pullbacks in Uptrends):
Wait for price to make a significant move up from swing low to swing high
When price starts pulling back, watch for reactions at key Fibonacci levels
Most common entry zones: 0.382, 0.5, and especially 0.618 (golden ratio)
Enter long positions when price shows reversal signals (candlestick patterns, volume increase) at these levels
Place stop loss below the next Fibonacci level
Target: Return to swing high or higher extension levels
For Extension Trading (Profit Targets):
After price breaks below the swing low (0.0 level), use extensions as profit targets
First target: 1.272 (conservative)
Primary target: 1.618 (golden extension - most commonly reached)
Extended target: 2.618 (for strong trends)
Extreme target: 3.618 (only in powerful trending moves)
For Counter-Trend Trading (Fading Extremes):
When price reaches deep retracements (0.786 or below), look for exhaustion signals
Watch for divergences between price and momentum indicators at these levels
Enter reversal trades with tight stops below the swing low
Target: 0.5 or 0.382 levels on the bounce
For Trend Continuation:
In strong uptrends, shallow retracements (0.236 to 0.382) often hold
Use these as low-risk entry points to join the existing trend
Failure to hold 0.5 suggests weakening momentum
Breaking below 0.618 often indicates trend reversal, not just retracement
Multi-Timeframe Strategy:
Use daily timeframe Fibonacci for major support/resistance zones
Use 4H or 1H Fibonacci for precise entry timing within those zones
Confluence between multiple timeframe Fibonacci levels creates high-probability zones
Example: Daily 0.618 level aligning with 4H 0.5 level = strong support
Settings Guide:Lookback Period (10-500):
Short (20-50): Captures recent swings, more frequent updates, suited for day trading
Medium (50-150): Balanced approach, good for swing trading (default: 100)
Long (150-500): Identifies major market structure, suited for position trading
Higher values = more stable levels but slower to adapt to new trends
Pivot Sensitivity (1-20):
Controls how many candles are required to confirm a swing point
Low (1-5): More sensitive, identifies minor swings (default: 5)
High (10-20): Less sensitive, only major swings qualify
Use higher sensitivity on lower timeframes to filter noise
Individual Level Toggles:
Enable only the levels you actively trade to reduce chart clutter
Common minimalist setup: Show only 0.382, 0.5, 0.618, 1.0, 1.618, 2.618
Comprehensive setup: Enable all levels for maximum information
Visual Customization:
Line Thickness: Thicker lines (3-5) for presentation, thinner (1-2) for trading
Line Style: Solid for primary levels (0.5, 0.618, 1.618), dashed/dotted for secondary
Price Labels: Essential for knowing exact entry/exit prices
Percent Labels: Helpful for quickly identifying which Fibonacci level you're looking at
Extension Direction: Extend right for forward-looking analysis, left for historical context
What Makes This Original:While Fibonacci indicators are common on TradingView, this script's originality comes from:
Intelligent Two-Stage Detection: Unlike simple high/low finders, this uses a sequential approach (find low first, then find the high that occurred after it), ensuring logical price flow representation
Comprehensive Level Set: Includes 16 levels spanning from retracement to extreme extensions, more than most Fibonacci tools
Top-Down Methodology: Properly implements the traditional Fibonacci retracement convention (high to low) rather than the reverse
Automatic Range Validation: Only draws Fibonacci when both swing points are valid and in the correct temporal order
Dual Extension Options: Separate controls for extending lines left (historical context) and right (forward projection)
Smart Label Positioning: Places percentage labels on the left and price labels on the right for clarity
Visual Swing Confirmation: Diamond markers at swing points help users understand why levels are positioned where they are
Important Considerations:
Historical Nature: Fibonacci retracements are based on past price swings; they don't predict future moves, only suggest potential support/resistance
Self-Fulfilling Prophecy: Fibonacci levels work partly because many traders watch them, creating actual support/resistance at those levels
Not All Levels Hold: In strong trends, price may slice through multiple Fibonacci levels without pausing
Context Matters: Fibonacci works best when aligned with other support/resistance (previous highs/lows, moving averages, trendlines)
Volume Confirmation: The most reliable Fibonacci reversals occur with volume spikes at key levels
Dynamic Updates: The levels will redraw as new swing highs/lows form, so don't rely solely on static screenshots
Best Practices:
Don't Trade Blindly: Fibonacci levels are zones, not exact prices. Look for confirmation (candlestick patterns, indicators, volume)
Combine with Price Action: Watch for pin bars, engulfing candles, or doji at key Fibonacci levels
Use Stop Losses: Place stops beyond the next Fibonacci level to give trades room but limit risk
Scale In/Out: Consider entering partial positions at 0.5 and adding more at 0.618 rather than all-in at one level
Check Multiple Timeframes: Daily Fibonacci + 4H Fibonacci convergence = high-probability zone
Respect the 0.618: This golden ratio level is historically the most reliable for reversals
Extensions Need Strong Trends: Don't expect extensions to be hit unless there's clear momentum beyond the swing low
Optimal Timeframes:
Scalping (1-5 minutes): Lookback 20-30, watch 0.382, 0.5, 0.618 only
Day Trading (15m-1H): Lookback 50-100, all retracement levels important
Swing Trading (4H-Daily): Lookback 100-200, focus on 0.5, 0.618, 0.786, and extensions
Position Trading (Daily-Weekly): Lookback 200-500, all levels relevant for long-term planning
Common Fibonacci Trading Mistakes to Avoid:
Wrong Swing Selection: Choosing insignificant swings produces meaningless levels
Premature Entry: Entering as soon as price touches a Fibonacci level without confirmation
Ignoring Trend: Fighting the main trend by buying deep retracements in downtrends
Over-Reliance: Using Fibonacci in isolation without confirming with other technical factors
Static Analysis: Not updating your Fibonacci as market structure evolves
Arbitrary Lookback: Using the same lookback period for all assets and timeframes
Integration with Other Tools:Fibonacci + Moving Averages:
When 0.618 level aligns with 50 or 200 EMA, confluence creates stronger support
Price bouncing from both Fibonacci and MA simultaneously = high-probability trade
Fibonacci + RSI/Stochastic:
Oversold indicators at 0.618 or deeper retracements = strong buy signal
Overbought indicators at swing high (1.0) = potential reversal warning
Fibonacci + Volume Profile:
High-volume nodes aligning with Fibonacci levels create robust support/resistance
Low-volume areas near Fibonacci levels may see rapid price movement through them
Fibonacci + Trendlines:
Fibonacci retracement level + ascending trendline = double support
Breaking both simultaneously confirms trend change
Technical Notes:
Uses ta.lowest() and ta.highest() for efficient swing detection across the lookback period
Implements dynamic line and label arrays for clean redraws without memory leaks
All calculations update in real-time as new bars form
Extension options allow customization without modifying core code
Format.mintick ensures price labels match the symbol's minimum price increment
Tooltip on swing markers shows exact price values for precision

[STRATEGY] Moving Average CrossoverHello friends,
This is a comprehensive backtesting engine for Moving Average crossover strategies, supporting over 63 types of moving averages and filters. It allows you to test, compare, and optimize crossover behaviors between any two moving averages with flexible profit and risk management tools.
Built upon the Moving Average Crossover foundation, this advanced version lets you manually backtest more than 4096 combinations of moving average types. When combined with customizable periods, take-profits, and stop-loss levels, the total number of possible configurations becomes virtually unlimited.
🛠 How It Works
The system tests crossovers between two selected moving averages, with full control over their types, lengths, and trading direction. Integrated bracket settings enable dynamic take-profit, stop-loss, and trailing-stop management using units such as % , ATR , points , pips , or ticks .
You can restrict backtesting to a custom date range for focused performance evaluation or run it across the instrument’s full history.
🔥 Key Features
Supports 63+ moving average and filter types — including algorithms by Ehlers , Jurik , Kaufman , Apirine , Tillson , and Dürschner
Customizable MA types, periods, and strategy direction
Full-featured bracket control: TP, SL, and TSL in ATR, %, points, pips, or ticks
Backtest window customization (start, end, or range)
Direction filter: Longs only, Shorts only, or Both
Dynamic trade labeling and color-coded visualization
Option to exit only at TP, SL, or TSL
If you'd like access or have any questions, feel free to reach out to me directly via DM.
👋 Good luck and happy trading!
Paid script

Titan Investments|Quantitative THEMIS|Pro|BINANCE:BTCUSDTP:4hInvestment Strategy (Quantitative Trading)
| 🛑 | Watch "LIVE" and 'COPY' this strategy in real time:
🔗 Link: www.tradingview.com
Hello, welcome, feel free 🌹💐
Since the stone age to the most technological age, one thing has not changed, that which continues impress human beings the most, is the other human being!
Deep down, it's all very simple or very complicated, depends on how you look at it.
I believe that everyone was born to do something very well in life.
But few are those who have, let's use the word 'luck' .
Few are those who have the 'luck' to discover this thing.
That is why few are happy and successful in their jobs and professions.
Thank God I had this 'luck' , and discovered what I was born to do well.
And I was born to program. 👨💻
📋 Summary : Project Titan
0️⃣ : 🦄 Project Titan
1️⃣ : ⚖️ Quantitative THEMIS
2️⃣ : 🏛️ Titan Community
3️⃣ : 👨💻 Who am I ❔
4️⃣ : ❓ What is Statistical/Probabilistic Trading ❓
5️⃣ : ❓ How Statistical/Probabilistic Trading works ❓
6️⃣ : ❓ Why use a Statistical/Probabilistic system ❓
7️⃣ : ❓ Why the human brain is not prepared to do Trading ❓
8️⃣ : ❓ What is Backtest ❓
9️⃣ : ❓ How to build a Consistent system ❓
🔟 : ❓ What is a Quantitative Trading system ❓
1️⃣1️⃣ : ❓ How to build a Quantitative Trading system ❓
1️⃣2️⃣ : ❓ How to Exploit Market Anomalies ❓
1️⃣3️⃣ : ❓ What Defines a Robust, Profitable and Consistent System ❓
1️⃣4️⃣ : 🔧 Fixed Technical
1️⃣5️⃣ : ❌ Fixed Outputs : 🎯 TP(%) & 🛑SL(%)
1️⃣6️⃣ : ⚠️ Risk Profile
1️⃣7️⃣ : ⭕ Moving Exits : (Indicators)
1️⃣8️⃣ : 💸 Initial Capital
1️⃣9️⃣ : ⚙️ Entry Options
2️⃣0️⃣ : ❓ How to Automate this Strategy ❓ : 🤖 Automation : 'Third-Party Services'
2️⃣1️⃣ : ❓ How to Automate this Strategy ❓ : 🤖 Automation : 'Exchanges
2️⃣2️⃣ : ❓ How to Automate this Strategy ❓ : 🤖 Automation : 'Messaging Services'
2️⃣3️⃣ : ❓ How to Automate this Strategy ❓ : 🤖 Automation : '🧲🤖Copy-Trading'
2️⃣4️⃣ : ❔ Why be a Titan Pro 👽❔
2️⃣5️⃣ : ❔ Why be a Titan Aff 🛸❔
2️⃣6️⃣ : 📋 Summary : ⚖️ Strategy: Titan Investments|Quantitative THEMIS|Pro|BINANCE:BTCUSDTP:4h
2️⃣7️⃣ : 📊 PERFORMANCE : 🆑 Conservative
2️⃣8️⃣ : 📊 PERFORMANCE : Ⓜ️ Moderate
2️⃣9️⃣ : 📊 PERFORMANCE : 🅰 Aggressive
3️⃣0️⃣ : 🛠️ Roadmap
3️⃣1️⃣ : 🧻 Notes ❕
3️⃣2️⃣ : 🚨 Disclaimer ❕❗
3️⃣3️⃣ : ♻️ ® No Repaint
3️⃣4️⃣ : 🔒 Copyright ©️
3️⃣5️⃣ : 👏 Acknowledgments
3️⃣6️⃣ : 👮 House Rules : 📺 TradingView
3️⃣7️⃣ : 🏛️ Become a Titan Pro member 👽
3️⃣8️⃣ : 🏛️ Be a member Titan Aff 🛸
0️⃣ : 🦄 Project Titan
This is the first real, 100% automated Quantitative Strategy made available to the public and the pinescript community for TradingView.
You will be able to automate all signals of this strategy for your broker , centralized or decentralized and also for messaging services : Discord, Telegram or Twitter .
This is the first strategy of a larger project, in 2023, I will provide a total of 6 100% automated 'Quantitative' strategies to the pinescript community for TradingView.
The future strategies to be shared here will also be unique , never before seen, real 'Quantitative' bots with real, validated results in real operation.
Just like the 'Quantitative THEMIS' strategy, it will be something out of the loop throughout the pinescript/tradingview community, truly unique tools for building mutual wealth consistently and continuously for our community.
1️⃣ : ⚖️ Quantitative THEMIS : Titan Investments|Quantitative THEMIS|Pro|BINANCE:BTCUSDTP:4h
This is a truly unique and out of the curve strategy for BTC /USD .
A truly real strategy, with real, validated results and in real operation.
A unique tool for building mutual wealth, consistently and continuously for the members of the Titan community.
Initially we will operate on a monthly, quarterly, annual or biennial subscription service.
Our goal here is to build a great community, in exchange for an extremely fair value for the use of our truly unique tools, which bring and will bring real results to our community members.
With this business model it will be possible to provide all Titan users and community members with the purest and highest degree of sophistication in the market with pinescript for tradingview, providing unique and truly profitable strategies.
My goal here is to offer the best to our members!
The best 'pinescript' tradingview service in the world!
We are the only Start-Up in the world that will decentralize real and full access to truly real 'quantitative' tools that bring and will bring real results for mutual and ongoing wealth building for our community.
2️⃣ : 🏛️ Titan Community : 👽 Pro 🔁 Aff 🛸
Become a Titan Pro 👽
To get access to the strategy: "Quantitative THEMIS" , and future Titan strategies in a 100% automated way, along with all tutorials for automation.
Pro Plans: 30 Days, 90 Days, 12 Months, 24 Months.
👽 Pro 🅼 Monthly
👽 Pro 🆀 Quarterly
👽 Pro🅰 Annual
👽 Pro👾Two Years
You will have access to a truly unique system that is out of the curve .
A 100% real, 100% automated, tested, validated, profitable, and in real operation strategy.
Become a Titan Affiliate 🛸
By becoming a Titan Affiliate 🛸, you will automatically receive 50% of the value of each new subscription you refer .
You will receive 50% for any of the above plans that you refer .
This way we will encourage our community to grow in a fair and healthy way, because we know what we have in our hands and what we deliver real value to our users.
We are at the highest level of sophistication in the market, the consistency here and the results here speak for themselves.
So growing our community means growing mutual wealth and raising collective conscience.
Wealth must be created not divided.
And here we are creating mutual wealth on all ends and in all ways.
A non-zero sum system, where everybody wins.
3️⃣ : 👨💻 Who am I ❔
My name is FilipeSoh I am 26 years old, Technical Analyst, Trader, Computer Engineer, pinescript Specialist, with extensive experience in several languages and technologies.
For the last 4 years I have been focusing on developing, editing and creating pinescript indicators and strategies for Tradingview for people and myself.
Full-time passionate workaholic pinescript developer with over 10,000 hours of pinescript development.
• Pinescript expert ▬Tradingview.
• Specialist in Automated Trading
• Specialist in Quantitative Trading.
• Statistical/Probabilistic Trading Specialist - Mark Douglas Scholl.
• Inventor of the 'Classic Forecast' Indicators.
• Inventor of the 'Backtest Table'.
4️⃣ : ❓ What is Statistical/Probabilistic Trading ❓
Statistical/probabilistic trading is the only way to get a positive mathematical expectation regarding the market and consequently that is the only way to make money consistently from it.
I will present below some more details about the Quantitative THEMIS strategy, it is a real strategy, tested, validated and in real operation, 'Skin in the Game' , a consistent way to make money with statistical/probabilistic trading in a 100% automated.
I am a Technical Analyst , I used to be a Discretionary Trader , today I am 100% a Statistical Trader .
I've gotten rich and made a lot of money, and I've also lost a lot with 'leverage'.
That was a few years ago.
The book that changed everything for me was "Trading in The Zone" by Mark Douglas.
That's when I understood that the market is just a game of statistics and probability, like a casino!
It was then that I understood that the human brain is not prepared for trading, because it involves triggers and mental emotions.
And emotions in trading and in making trading decisions do not go well together, not in the long run, because you always have the burden of being wrong with the outcome of that particular position.
But remembering that the market is just a statistical game!
5️⃣ : ❓ How Statistical/Probabilistic Trading works ❓
Let's use a 'coin' as an example:
If we toss a 'coin' up 10 times.
Do you agree that it is impossible for us to know exactly the result of the 'plays' before they actually happen?
As in the example above, would you agree, that we cannot "guess" the outcome of a position before it actually happens?
As much as we cannot "guess" whether the coin will drop heads or tails on each flip.
We can analyze the "backtest" of the 10 moves made with that coin:
If we analyze the 10 moves and count the number of times the coin fell heads or tails in a specific sequence, we then have a percentage of times the coin fell heads or tails, so we have a 'backtest' of those moves.
Then on the next flip we can now assume a point or a favorable position for one side, the side with the highest probability .
In a nutshell, this is more or less how probabilistic statistical trading works.
As Statistical Traders we can never say whether such a Trader/Position we take will be a winner or a loser.
But still we can have a positive and consistent result in a "sequence" of trades, because before we even open a position, backtests have already been performed so we identify an anomaly and build a system that will have a positive statistical advantage in our favor over the market.
The advantage will not be in one trade itself, but in the "sequence" of trades as a whole!
Because our system will work like a casino, having a positive mathematical expectation relative to the players/market.
Design, develop, test models and systems that can take advantage of market anomalies, until they change.
Be the casino! - Mark Douglas
6️⃣ : ❓ Why use a Statistical/Probabilistic system ❓
In recent years I have focused and specialized in developing 100% automated trading systems, essentially for the cryptocurrency market.
I have developed many extremely robust and efficient systems, with positive mathematical expectation towards the market.
These are not complex systems per se , because here we want to avoid 'over-optimization' as much as possible.
As Da Vinci said: "Simplicity is the highest degree of sophistication".
I say this because I have tested, tried and developed hundreds of systems/strategies.
I believe I have programmed more than 10,000 unique indicators/strategies, because this is my passion and purpose in life.
I am passionate about what I do, completely!
I love statistical trading because it is the only way to get consistency in the long run!
This is why I have studied, applied, developed, and specialized in 100% automated cryptocurrency trading systems.
The reason why our systems are extremely "simple" is because, as I mentioned before, in statistical trading we want to exploit the market anomaly to the maximum, that is, this anomaly will change from time to time, usually we can exploit a trading system efficiently for about 6 to 12 months, or for a few years, that is; for fixed 'scalpers' systems.
Because at some point these anomalies will be identified , and from the moment they are identified they will be exploited and will stop being anomalies .
With the system presented here; you can even copy the indicators and input values shared here;
However; what I have to offer you is: it is me , our team , and our community !
That is, we will constantly monitor this system, for life , because our goal here is to create a unique , perpetual , profitable , and consistent system for our community.
Myself , our team and our community will keep this script periodically updated , to ensure the positive mathematical expectation of it.
So we don't mind sharing the current parameters and values , because the real value is also in the future updates that this system will receive from me and our team , guided by our culture and our community of real users !
As we are hosted on 'tradingview', all future updates for this strategy, will be implemented and updated automatically on your tradingview account.
What we want here is: to make sure you get gains from our system, because if you get gains , our ecosystem will grow as a whole in a healthy and scalable way, so we will be generating continuous mutual wealth and raising the collective consciousness .
People Need People: 3️⃣🅿
7️⃣ : ❓ Why the human brain is not prepared to do Trading ❓
Today my greatest skill is to develop statistically profitable and 100% automated strategies for 'pinescript' tradingview.
Note that I said: 'profitable' because in fact statistical trading is the only way to make money in a 'consistent' way from the market.
And consequently have a positive wealth curve every cycle, because we will be based on mathematics, not on feelings and news.
Because the human brain is not prepared to do trading.
Because trading is connected to the decision making of the cerebral cortex.
And the decision making is automatically linked to emotions, and emotions don't match with trading decision making, because in those moments, we can feel the best and also the worst sensations and emotions, and this certainly affects us and makes us commit grotesque mistakes!
That's why the human brain is not prepared to do trading.
If you want to participate in a fully automated, profitable and consistent trading system; be a Titan Pro 👽
I believe we are walking an extremely enriching path here, not only in terms of financial returns for our community, but also in terms of knowledge about probabilistic and automated statistical trading.
You will have access to an extremely robust system, which was built upon very strong concepts and foundations, and upon the world's main asset in a few years: Bitcoin .
We are the tip of the best that exists in the cryptocurrency market when it comes to probabilistic and automated statistical trading.
Result is result! Me being dressed or naked.
This is just the beginning!
But there is a way to consistently make money from the market.
Being the Casino! - Mark Douglas
8️⃣ : ❓ What is Backtest ❓
Imagine the market as a purely random system, but even in 'randomness' there are patterns.
So now imagine the market and statistical trading as follows:
Repeating the above 'coin' example, let's think of it as follows:
If we toss a coin up 10 times again.
It is impossible to know which flips will have heads or tails, correct?
But if we analyze these 10 tosses, then we will have a mathematical statistic of the past result, for example, 70 % of the tosses fell 'heads'.
That is:
7 moves fell on "heads" .
3 moves fell on "tails" .
So based on these conditions and on the generic backtest presented here, we could adopt " heads " as our system of moves, to have a statistical and probabilistic advantage in relation to the next move to be performed.
That is, if you define a system, based on backtests , that has a robust positive mathematical expectation in relation to the market you will have a profitable system.
For every move you make you will have a positive statistical advantage in your favor over the market before you even make the move.
Like a casino in relation to all its players!
The casino does not have an advantage over one specific player, but over all players, because it has a positive mathematical expectation about all the moves that night.
The casino will always have a positive statistical advantage over its players.
Note that there will always be real players who will make real, million-dollar bankrolls that night, but this condition is already built into the casino's 'strategy', which has a pre-determined positive statistical advantage of that night as a whole.
Statistical trading is the same thing, as long as you don't understand this you will keep losing money and consistently.
9️⃣ : ❓ How to build a Consistent system ❓
See most traders around the world perform trades believing that that specific position taken will make them filthy rich, because they simply believe faithfully that the position taken will be an undoubted winner, based on a trader's methodology: 'trading a trade' without analyzing the whole context, just using 'empirical' aspects in their system.
But if you think of trading, as a sequence of moves.
You see, 'a sequence' !
When we think statistically, it doesn't matter your result for this , or for the next specific trade , but the final sequence of trades as a whole.
As the market has a random system of results distribution , if your system has a positive statistical advantage in relation to the market, at the end of that sequence you'll have the biggest probability of having a winning bank.
That's how you do real trading!
And with consistency!
Trading is a long term game, but when you change the key you realize that it is a simple game to make money in a consistent way from the market, all you need is patience.
Even more when we are based on Bitcoin, which has its 'Halving' effect where, in theory, we will never lose money in 3 to 4 years intervals, due to its scarcity and the fact that Bitcoin is the 'discovery of digital scarcity' which makes it the digital gold, we believe in this thesis and we follow Satoshi's legacy.
So align Bitcoin with a probabilistic statistical trading system with a positive mathematical expectation of the market and 100% automated with the long term, and all you need is patience, and you will become rich.
In fact Bitcoin by itself is already a path, buy, wait for each halving and your wealth will be maintained.
No inflation, unlike fiat currencies.
This is a complete and extremely robust strategy, with the most current possible and 'not possible' techniques involved and applied here.
Today I am at another level in developing 100% automated 'quantitative' strategies.
I was born for this!
🔟 : ❓ What is a Quantitative Trading system ❓
In addition to having access to a revolutionary strategy you will have access to disruptive 100% multifunctional tables with the ability to perform 'backtests' for better tracking and monitoring of your system on a customized basis.
I would like to emphasize one thing, and that is that you keep this in mind.
Today my greatest skill in 'pinescript' is to build indicators, but mainly strategies, based on statistical and probabilistic trading, with a postive mathematical expectation in relation to the market, in a 100% automated way.
This with the goal of building a consistent and continuous positive equity curve through mathematics using data, converting it into statistical / probabilistic parameters and applying them to a Quantitative model.
Before becoming a Quantitative Trader , I was a Technical Analyst and a Discretionary Trader .
First as a position trader and then as a day trader.
Before becoming a Trader, I trained myself as a Technical Analyst , to masterly understand the shape and workings of the market in theory.
But everything changed when I met 'Mark Douglas' , when I got to know his works, that's when my head exploded 🤯, and I started to understand the market for good!
The market is nothing more than a 'random' system of distributing results.
See that I said: 'random' .
Do yourself a mental exercise.
Is there really such a thing as random ?
I believe not, as far as we know maybe the 'singularity'.
So thinking this way, to translate, the market is nothing more than a game of probability, statistics and pure mathematics.
Like a casino!
What happens is that most traders, whenever they take a position, take it with all the empirical certainty that such position will win or lose, and do not take into consideration the total sequence of results to understand their place in the market.
Understanding your place in the market gives you the ability to create and design systems that can exploit the present market anomaly, and thus make money statistically, consistently, and 100% automated.
Thinking of it this way, it is easy to make money from the market.
There are many ways to make money from the market, but the only consistent way I know of is through 'probabilistic and automated statistical trading'.
1️⃣1️⃣ : ❓ How to build a Quantitative Trading system ❓
There are some fundamental points that must be addressed here in order to understand what makes up a system based on statistics and probability applied to a quantitative model.
When we talk about 'discretionary' trading, it is a trading system based on human decisions after the defined 'empirical' conditions are met.
It is quite another thing to build a fully automated system without any human interference/interaction .
That said:
Building a statistically profitable system is perfectly possible, but this is a high level task , but with possible high rewards and consistent gains.
Here you will find a real "Skin In The Game" strategy.
With all due respect, but the vast majority of traders who post strategies on TradingView do not understand what they are doing.
Most of them do not understand the minimum complexity involved in the main variable for the construction of a real strategy, the mother variable: "strategy".
I say this by my own experience, because I have analyzed practically all the existing publications of TradingView + 200,000 indicators and strategies.
I breathe pinescript, I eat pinescript, I sleep pinescript, I bathe pinescript, I live TradingView.
But the main advantage for the TradingView users, is that all entry and exit orders made by this strategy can be checked and analyzed thoroughly, to validate and prove the veracity of this strategy, because this is a 100% real strategy.
Here there is a huge world of possibilities, but only one way to build a 'pinescript strategy' that will work correctly aligned to the real world with real results .
There are some fundamental points to take into consideration when building a profitable trading system:
The most important of these for me is: 'DrawDown' .
Followed by: 'Hit Rate' .
And only after that we use the parameter: 'Profit'.
See, this is because here, we are dealing with the 'imponderable' , and anything can happen in this scenario.
But there is one thing that makes us sleep peacefully at night, and that is: controlling losses .
That is, in other words: controlling the DrawDown .
The amateur is concerned with 'winning', the professional is concerned with conserving capital.
If we have the losses under control, then we can move on to the other two parameters: hit rate and profit.
See, the second most important factor in building a system is the hit rate.
I say this from my own experience.
I have worked with many systems with a 'low hit rate', but extremely profitable.
For example: systems with hit rates of 40 to 50%.
But as much as statistically and mathematically the profit is rewarding, operating systems with a low hit rate is always very stressful psychologically.
That's why there are two big reasons why when I build an automated trading system, I focus on the high hit rate of the system, they are
1 - To reduce psychological damage as much as possible .
2 - And more important , when we create a system with a 'high hit rate' , there is a huge intrinsic advantage here, that most statistic traders don't take in consideration.
That is: knowing more quickly when the system stops being functional.
The main advantage of a system with a high hit rate is: to identify when the system stops being functional and stop exploiting the market's anomaly.
Look: When we are talking about trading and random distribution of results on the market, do you agree that when we create a trading system, we are focused on exploring some anomaly of that market?
When that anomaly is verified by the market, it will stop being functional with time.
That's why trading systems, 'scalpers', especially for cryptocurrencies, need constant monitoring, quarterly, semi-annually or annually.
Because market movements change from time to time.
Because we go through different cycles from time to time, such as congestion cycles, accumulation , distribution , volatility , uptrends and downtrends .
1️⃣2️⃣ : ❓ How to Exploit Market Anomalies ❓
You see there is a very important point that must be stressed here.
As we are always trying to exploit an 'anomaly' in the market.
So the 'number' of indicators/tools that will integrate the system is of paramount importance.
But most traders do not take this into consideration.
To build a professional, robust, consistent, and profitable system, you don't need to use hundreds of indicators to build your setup.
This will actually make it harder to read when the setup stops working and needs some adjustment.
So focusing on a high hit rate is very important here, this is a fundamental principle that is widely ignored , and with a high hit rate, we can know much more accurately when the system is no longer functional much faster.
As Darwin said: "It is not the strongest or the most intelligent that wins the game of life, it is the most adapted.
So simple systems, as contradictory as it may seem, are more efficient, because they help to identify inflection points in the market much more quickly.
1️⃣3️⃣ : ❓ What Defines a Robust, Profitable and Consistent System ❓
See I have built, hundreds of thousands of indicators and 'pinescript' strategies, hundreds of thousands.
This is an extremely professional, robust and profitable system.
Based on the currency pairs: BTC /USDT
There are many ways and avenues to build a profitable trading setup/system.
And actually this is not a difficult task, taking in consideration, as the main factor here, that our trading and investment plan is for the long term, so consequently we will face scenarios with less noise.
He who is in a hurry eats raw.
As mentioned before.
Defining trends in pinescript is technically a simple task, the hardest task is to determine congestion zones with low volume and volatility, it's in these moments that many false signals are generated, and consequently is where most setups face their maximum DrawDown.
That's why this strategy was strictly and thoroughly planned, built on a very solid foundation, to avoid as much noise as possible, for a positive and consistent equity curve in each market cycle, 'Consistency' is our 'Mantra' around here.
1️⃣4️⃣ : 🔧 Fixed Technical
• Strategy: Titan Investments|Quantitative THEMIS|Pro|BINANCE:BTCUSDTP:4h
• Pair: BTC/USDTP
• Time Frame: 4 hours
• Broker: Binance (Recommended)
For a more conservative scenario, we have built the Quantitative THEMIS for the 4h time frame, with the main focus on consistency.
So we can avoid noise as much as possible!
1️⃣5️⃣ : ❌ Fixed Outputs : 🎯 TP(%) & 🛑SL(%)
In order to build a 'perpetual' system specific to BTC/USDT, it took a lot of testing, and more testing, and a lot of investment and research.
There is one initial and fundamental point that we can address to justify the incredible consistency presented here.
That fundamental point is our exit via Take Profit or Stop Loss percentage (%).
🎯 Take Profit (%)
🛑 Stop Loss (%)
See, today I have been testing some more advanced backtesting models for some cryptocurrency systems.
In which I perform 'backtest of backtest', i.e. we use a set of strategies each focused on a principle, operating individually, but they are part of something unique, i.e. we do 'backtests' of 'backtests' together.
What I mean is that we do a lot of backtesting around here.
I can assure you, that always the best output for a trading system is to set fixed output values!
In other words:
🎯 Take Profit (%)
🛑 Stop Loss (%)
This happens because statistically setting fixed exit structures in the vast majority of times, presents a superior result on the capital/equity curve, throughout history and for the vast majority of setups compared to other exit methods.
This is due to a mathematical principle of simplicity, 'avoiding more noise'.
Thus whenever the Quantitative THEMIS strategy takes a position it has a target and a defined maximum stop percentage.
1️⃣6️⃣ : ⚠️ Risk Profile
The strategy, currently has 3 risk profiles ⚠️ patterns for 'fixed percentage exits': Take Profit (%) and Stop Loss (%) .
They are: ⚠️ Rich's Profiles
✔️🆑 Conservative: 🎯 TP=2.7 % 🛑 SL=2.7 %
❌Ⓜ️ Moderate: 🎯 TP=2.8 % 🛑 SL=2.7 %
❌🅰 Aggressive: 🎯 TP=1.6 % 🛑 SL=6.9 %
You will be able to select and switch between the above options and profiles through the 'input' menu of the strategy by navigating to the "⚠️ Risk Profile" menu.
You can then select, test and apply the Risk Profile above that best suits your risk management, expectations and reality , as well as customize all the 'fixed exit' values through the TP and SL menus below.
1️⃣7️⃣ : ⭕ Moving Exits : (Indicators)
The strategy currently also has 'Moving Exits' based on indicator signals.
These are Moving Exits (Indicators)
📈 LONG : (EXIT)
🧃 (MAO) Short : true
📉 SHORT : (EXIT)
🧃 (MAO) Long: false
You can select and toggle between the above options through the 'input' menu of the strategy by navigating to the "LONG : Exit" and "SHORT : Exit" menu.
1️⃣8️⃣ : 💸 Initial Capital
By default the "Initial Capital" set for entries and backtests of this strategy is: 10000 $
You can set another value for the 'Starting Capital' through the tradingview menu under "properties" , and edit the value of the "Initial Capital" field.
This way you can set and test other 'Entry Values' for your trades, tests and backtests.
1️⃣9️⃣ : ⚙️ Entry Options
By default the 'order size' set for this strategy is 100 % of the 'initial capital' on each new trade.
You can set and test other entry options like : contracts , cash , % of equity
You should make these changes directly in the input menu of the strategy by navigating to the menu "⚙️ Properties : TradingView" below.
⚙️ Properties : (TradingView)
📊 Strategy Type: strategy.position_size != 1
📝💲 % Order Type: % of equity
📝💲 % Order Size: 100
Leverage: 1
So you can define and test other 'Entry Options' for your trades, tests and backtests.
2️⃣0️⃣ : ❓ How to Automate this Strategy ❓ : 🤖 Automation : 'Third-Party Services'
It is possible to automate the signals of this strategy for any centralized or decentralized broker, as well as for messaging services: Discord, Telegram and Twitter.
All in an extremely simple and uncomplicated way through the tutorials available in PDF /VIDEO for our Titan Pro 👽 subscriber community.
With our tutorials in PDF and Video it will be possible to automate the signals of this strategy for the chosen service in an extremely simple way with less than 10 steps only.
Tradingview naturally doesn't count with native integration between brokers and tradingview.
But it is possible to use 'third party services' to do the integration and automation between Tradingview and your centralized or decentralized broker.
Here are the standard, available and recommended 'third party services' to automate the signals from the 'Quantitative THEMIS' strategy on the tradingview for your broker:
1) Wundertrading (Recommended):
2) 3commas:
3) Zignaly:
4) Aleeert.com (Recommended):
5) Alertatron:
Note! 'Third party services' cannot perform 'withdrawals' via their key 'API', they can only open positions, so your funds will always be 'safe' in your brokerage firm, being traded via the 'API', when they receive an entry and exit signal from this strategy.
2️⃣1️⃣ : ❓ How to Automate this Strategy ❓ : 🤖 Automation : 'Exchanges
You can automate this strategy for any of the brokers below, through your broker's 'API' by connecting it to the 'third party automation services' for tradingview available and mentioned in the menu above:
1) Binance (Recommended)
2) Bitmex
3) Bybit
4) KuCoin
5) Deribit
6) OKX
7) Coinbase
8) Huobi
9) Bitfinex
10) Bitget
11) Bittrex
12) Bitstamp
13) Gate. io
14) Kraken
15) Gemini
16) Ascendex
17) VCCE
2️⃣2️⃣ : ❓ How to Automate this Strategy ❓ : 🤖 Automation : 'Messaging Services'
You can also automate and monitor the signals of this strategy much more efficiently by sending them to the following popular messaging services:
1) Discord
2) Telegram
3) Twitter
2️⃣3️⃣ : ❓ How to Automate this Strategy ❓ : 🤖 Automation : '🧲🤖Copy-Trading'
It will also be possible to copy/replicate the entries and exits of this strategy to your broker in an extremely simple and agile way, through the available copy-trader services.
This way it will be possible to replicate the signals of this strategy at each entry and exit to your broker through the API connecting it to the integrated copy-trader services available through the tradingview automation services below:
1) Wundetrading:
2) Zignaly:
2️⃣4️⃣ : ❔ Why be a Titan Pro 👽❔
I believe that today I am at another level in 'pinescript' development.
I consider myself today a true unicorn as a pinescript developer, someone unique and very rare.
If you choose another tool or another pinescript service, this tool will be just another one, with no real results.
But if you join our Titan community, you will have access to a unique tool! And you will get real results!
I already earn money consistently with statistical and automated trading and as an expert pinescript developer.
I am here to evolve my skills as much as possible, and one day become a pinescript 'Wizard'.
So excellence, quality and professionalism will always be my north here.
You will never find a developer like me, and who will take so seriously such a revolutionary project as this one. A Maverick! ▬ The man never stops!
Here you will find the highest degree of sophistication and development in the market for 'pinescript'.
You will get the best of me and the best of pinescript possible.
Let me show you how a professional in my field does it.
Become a Titan Pro Member 👽 and get Full Access to this strategy and all the Automation Tutorials.
Be the Titan in your life!
2️⃣5️⃣ : ❔ Why be a Titan Aff 🛸❔
Get financial return for your referrals, Decentralize the World, and raise the collective consciousness.
2️⃣6️⃣ : 📋 Summary : ⚖️ Strategy: Titan Investments|Quantitative THEMIS|Pro|BINANCE:BTCUSDTP:4h
® Titan Investimentos | Quantitative THEMIS ⚖️ | Pro 👽 2.6 | Dev: © FilipeSoh 🧙 | 🤖 100% Automated : Discord, Telegram, Twitter, Wundertrading, 3commas, Zignaly, Aleeert, Alertatron, Uniswap-v3 | BINANCE:BTCUSDTPERP 4h
🛒 Subscribe this strategy ❗️ Be a Titan Member 🏛️
🛒 Titan Pro 👽 🏛️ Titan Pro 👽 Version with ✔️100% Integrated Automation 🤖 and 📚 Automation Tutorials ✔️100% available at: (PDF/VIDEO)
🛒 Titan Affiliate 🛸 🏛️ Titan Affiliate 🛸 (Subscription Sale) 🔥 Receive 50% commission
📋 Summary : QT THEMIS ⚖️
🕵️♂️ Check This Strategy..................................................................0
🦄 ® Titan Investimentos...............................................................1
👨💻 © Developer..........................................................................2
📚 Signal Automation Tutorials : (PDF/VIDEO).......................................3
👨🔧 Revision...............................................................................4
📊 Table : (BACKTEST)..................................................................5
📊 Table : (INFORMATIONS).............................................................6
⚙️ Properties : (TRADINGVIEW)........................................................7
📆 Backtest : (TRADINGVIEW)..........................................................8
⚠️ Risk Profile...........................................................................9
🟢 On 🔴 Off : (LONG/SHORT).......................................................10
📈 LONG : (ENTRY)....................................................................11
📉 SHORT : (ENTRY)...................................................................12
📈 LONG : (EXIT).......................................................................13
📉 SHORT : (EXIT)......................................................................14
🧩 (EI) External Indicator.............................................................15
📡 (QT) Quantitative...................................................................16
🎠 (FF) Forecast......................................................................17
🅱 (BB) Bollinger Bands................................................................18
🧃 (MAP) Moving Average Primary......................................................19
🧃 (MAP) Labels.........................................................................20
🍔 (MAQ) Moving Average Quaternary.................................................21
🍟 (MACD) Moving Average Convergence Divergence...............................22
📣 (VWAP) Volume Weighted Average Price........................................23
🪀 (HL) HILO..........................................................................24
🅾 (OBV) On Balance Volume.........................................................25
🥊 (SAR) Stop and Reverse...........................................................26
🛡️ (DSR) Dynamic Support and Resistance..........................................27
🔊 (VD) Volume Directional..........................................................28
🧰 (RSI) Relative Momentum Index.................................................29
🎯 (TP) Take Profit %..................................................................30
🛑 (SL) Stop Loss %....................................................................31
🤖 Automation Selected...............................................................32
📱💻 Discord............................................................................33
📱💻 Telegram..........................................................................34
📱💻 Twitter...........................................................................35
🤖 Wundertrading......................................................................36
🤖 3commas............................................................................37
🤖 Zignaly...............................................................................38
🤖 Aleeert...............................................................................39
🤖 Alertatron...........................................................................40
🤖 Uniswap-v3..........................................................................41
🧲🤖 Copy-Trading....................................................................42
♻️ ® No Repaint........................................................................43
🔒 Copyright ©️..........................................................................44
🏛️ Be a Titan Member..................................................................45
Nº Active Users..........................................................................46
⏱ Time Left............................................................................47
| 0 | 🕵️♂️ Check This Strategy
🕵️♂️ Version Demo: 🐄 Version with ❌non-integrated automation 🤖 and 📚 Tutorials for automation ❌not available
🕵️♂️ Version Pro: 👽 Version with ✔️100% Integrated Automation 🤖 and 📚 Automation Tutorials ✔️100% available at: (PDF/VIDEO)
| 1 | 🦄 ® Titan Investimentos
Decentralizing the World 🗺
Raising the Collective Conscience 🗺
🦄Site:
🦄TradingView: www.tradingview.com
🦄Discord:
🦄Telegram:
🦄Youtube:
🦄Twitter:
🦄Instagram:
🦄TikTok:
🦄Linkedin:
🦄E-mail:
| 2 | 👨💻 © Developer
🧠 Developer: @FilipeSoh🧙
📺 TradingView: www.tradingview.com
☑️ Linkedin:
✅ Fiverr:
✅ Upwork:
🎥 YouTube:
🐤 Twitter:
🤳 Instagram:
| 3 | 📚 Signal Automation Tutorials : (PDF/VIDEO)
📚 Discord: 🔗 Link: 🔒Titan Pro👽
📚 Telegram: 🔗 Link: 🔒Titan Pro👽
📚 Twitter: 🔗 Link: 🔒Titan Pro👽
📚 Wundertrading: 🔗 Link: 🔒Titan Pro👽
📚 3comnas: 🔗 Link: 🔒Titan Pro👽
📚 Zignaly: 🔗 Link: 🔒Titan Pro👽
📚 Aleeert: 🔗 Link: 🔒Titan Pro👽
📚 Alertatron: 🔗 Link: 🔒Titan Pro👽
📚 Uniswap-v3: 🔗 Link: 🔒Titan Pro👽
📚 Copy-Trading: 🔗 Link: 🔒Titan Pro👽
| 4 | 👨🔧 Revision
👨🔧 Start Of Operations: 01 Jan 2019 21:00 -0300 💡 Start Of Operations (Skin in the game) : Revision 1.0
👨🔧 Previous Review: 01 Jan 2022 21:00 -0300 💡 Previous Review : Revision 2.0
👨🔧 Current Revision: 01 Jan 2023 21:00 -0300 💡 Current Revision : Revision 2.6
👨🔧 Next Revision: 28 May 2023 21:00 -0300 💡 Next Revision : Revision 2.7
| 5 | 📊 Table : (BACKTEST)
📊 Table: true
🖌️ Style: label.style_label_left
📐 Size: size_small
📏 Line: defval
🎨 Color: #131722
| 6 | 📊 Table : (INFORMATIONS)
📊 Table: false
🖌️ Style: label.style_label_right
📐 Size: size_small
📏 Line: defval
🎨 Color: #131722
| 7 | ⚙️ Properties : (TradingView)
📊 Strategy Type: strategy.position_size != 1
📝💲 % Order Type: % of equity
📝💲 % Order Size: 100 %
🚀 Leverage: 1
| 8 | 📆 Backtest : (TradingView)
🗓️ Mon: true
🗓️ Tue: true
🗓️ Wed: true
🗓️ Thu: true
🗓️ Fri: true
🗓️ Sat: true
🗓️ Sun: true
📆 Range: custom
📆 Start: UTC 31 Oct 2008 00:00
📆 End: UTC 31 Oct 2030 23:45
📆 Session: 0000-0000
📆 UTC: UTC
| 9 | ⚠️ Risk Profile
✔️🆑 Conservative: 🎯 TP=2.7 % 🛑 SL=2.7 %
❌Ⓜ️ Moderate: 🎯 TP=2.8 % 🛑 SL=2.7 %
❌🅰 Aggressive: 🎯 TP=1.6 % 🛑 SL=6.9 %
| 10 | 🟢 On 🔴 Off : (LONG/SHORT)
🟢📈 LONG: true
🟢📉 SHORT: true
| 11 | 📈 LONG : (ENTRY)
📡 (QT) Long: true
🧃 (MAP) Long: false
🅱 (BB) Long: false
🍟 (MACD) Long: false
🅾 (OBV) Long: false
| 12 | 📉 SHORT : (ENTRY)
📡 (QT) Short: true
🧃 (MAP) Short: false
🅱 (BB) Short: false
🍟 (MACD) Short: false
🅾 (OBV) Short: false
| 13 | 📈 LONG : (EXIT)
🧃 (MAP) Short: true
| 14 | 📉 SHORT : (EXIT)
🧃 (MAP) Long: false
| 15 | 🧩 (EI) External Indicator
🧩 (EI) Connect your external indicator/filter: false
🧩 (EI) Connect your indicator here (Study mode only): close
🧩 (EI) Connect your indicator here (Study mode only): close
| 16 | 📡 (QT) Quantitative
📡 (QT) Quantitative: true
📡 (QT) Market: BINANCE:BTCUSDTPERP
📡 (QT) Dice: openai
| 17 | 🎠 (FF) Forecast
🎠 (FF) Include current unclosed current candle: true
🎠 (FF) Forecast Type: flat
🎠 (FF) Nº of candles to use in linear regression: 3
| 18 | 🅱 (BB) Bollinger Bands
🅱 (BB) Bollinger Bands: true
🅱 (BB) Type: EMA
🅱 (BB) Period: 20
🅱 (BB) Source: close
🅱 (BB) Multiplier: 2
🅱 (BB) Linewidth: 0
🅱 (BB) Color: #131722
| 19 | 🧃 (MAP) Moving Average Primary
🧃 (MAP) Moving Average Primary: true
🧃 (MAP) BarColor: false
🧃 (MAP) Background: false
🧃 (MAP) Type: SMA
🧃 (MAP) Source: open
🧃 (MAP) Period: 100
🧃 (MAP) Multiplier: 2.0
🧃 (MAP) Linewidth: 2
🧃 (MAP) Color P: #42bda8
🧃 (MAP) Color N: #801922
| 20 | 🧃 (MAP) Labels
🧃 (MAP) Labels: true
🧃 (MAP) Style BUY ZONE: shape.labelup
🧃 (MAP) Color BUY ZONE: #42bda8
🧃 (MAP) Style SELL ZONE: shape.labeldown
🧃 (MAP) Color SELL ZONE: #801922
| 21 | 🍔 (MAQ) Moving Average Quaternary
🍔 (MAQ) Moving Average Quaternary: true
🍔 (MAQ) BarColor: false
🍔 (MAQ) Background: false
🍔 (MAQ) Type: SMA
🍔 (MAQ) Source: close
🍔 (MAQ) Primary: 14
🍔 (MAQ) Secondary: 22
🍔 (MAQ) Tertiary: 44
🍔 (MAQ) Quaternary: 16
🍔 (MAQ) Linewidth: 0
🍔 (MAQ) Color P: #42bda8
🍔 (MAQ) Color N: #801922
| 22 | 🍟 (MACD) Moving Average Convergence Divergence
🍟 (MACD) Macd Type: EMA
🍟 (MACD) Signal Type: EMA
🍟 (MACD) Source: close
🍟 (MACD) Fast: 12
🍟 (MACD) Slow: 26
🍟 (MACD) Smoothing: 9
| 23 | 📣 (VWAP) Volume Weighted Average Price
📣 (VWAP) Source: close
📣 (VWAP) Period: 340
📣 (VWAP) Momentum A: 84
📣 (VWAP) Momentum B: 150
📣 (VWAP) Average Volume: 1
📣 (VWAP) Multiplier: 1
📣 (VWAP) Diviser: 2
| 24 | 🪀 (HL) HILO
🪀 (HL) Type: SMA
🪀 (HL) Function: Maverick🧙
🪀 (HL) Source H: high
🪀 (HL) Source L: low
🪀 (HL) Period: 20
🪀 (HL) Momentum: 26
🪀 (HL) Diviser: 2
🪀 (HL) Multiplier: 1
| 25 | 🅾 (OBV) On Balance Volume
🅾 (OBV) Type: EMA
🅾 (OBV) Source: close
🅾 (OBV) Period: 16
🅾 (OBV) Diviser: 2
🅾 (OBV) Multiplier: 1
| 26 | 🥊 (SAR) Stop and Reverse
🥊 (SAR) Source: close
🥊 (SAR) High: 1.8
🥊 (SAR) Mid: 1.6
🥊 (SAR) Low: 1.6
🥊 (SAR) Diviser: 2
🥊 (SAR) Multiplier: 1
| 27 | 🛡️ (DSR) Dynamic Support and Resistance
🛡️ (DSR) Source D: close
🛡️ (DSR) Source R: high
🛡️ (DSR) Source S: low
🛡️ (DSR) Momentum R: 0
🛡️ (DSR) Momentum S: 2
🛡️ (DSR) Diviser: 2
🛡️ (DSR) Multiplier: 1
| 28 | 🔊 (VD) Volume Directional
🔊 (VD) Type: SMA
🔊 (VD) Period: 68
🔊 (VD) Momentum: 3.8
🔊 (VD) Diviser: 2
🔊 (VD) Multiplier: 1
| 29 | 🧰 (RSI) Relative Momentum Index
🧰 (RSI) Type UP: EMA
🧰 (RSI) Type DOWN: EMA
🧰 (RSI) Source: close
🧰 (RSI) Period: 29
🧰 (RSI) Smoothing: 22
🧰 (RSI) Momentum R: 64
🧰 (RSI) Momentum S: 142
🧰 (RSI) Diviser: 2
🧰 (RSI) Multiplier: 1
| 30 | 🎯 (TP) Take Profit %
🎯 (TP) Take Profit: false
🎯 (TP) %: 2.2
🎯 (TP) Color: #42bda8
🎯 (TP) Linewidth: 1
| 31 | 🛑 (SL) Stop Loss %
🛑 (SL) Stop Loss: false
🛑 (SL) %: 2.7
🛑 (SL) Color: #801922
🛑 (SL) Linewidth: 1
| 32 | 🤖 Automation : Discord | Telegram | Twitter | Wundertrading | 3commas | Zignaly | Aleeert | Alertatron | Uniswap-v3
🤖 Automation Selected : Discord
| 33 | 🤖 Discord
🔗 Link Discord: discord.com
🔗 Link 📚 Automation: 🔒Titan Pro👽
📱💻 Discord ▬ Enter Long: 🔒Titan Pro👽
📱💻 Discord ▬ Exit Long: 🔒Titan Pro👽
📱💻 Discord ▬ Enter Short: 🔒Titan Pro👽
📱💻 Discord ▬ Exit Short: 🔒Titan Pro👽
| 34 | 🤖 Telegram
🔗 Link Telegram: telegram.org
🔗 Link 📚 Automation: 🔒Titan Pro👽
📱💻 Telegram ▬ Enter Long: 🔒Titan Pro👽
📱💻 Telegram ▬ Exit Long: 🔒Titan Pro👽
📱💻 Telegram ▬ Enter Short: 🔒Titan Pro👽
📱💻 Telegram ▬ Exit Short: 🔒Titan Pro👽
| 35 | 🤖 Twitter
🔗 Link Twitter: twitter.com
🔗 Link 📚 Automation: 🔒Titan Pro👽
📱💻 Twitter ▬ Enter Long: 🔒Titan Pro👽
📱💻 Twitter ▬ Exit Long: 🔒Titan Pro👽
📱💻 Twitter ▬ Enter Short: 🔒Titan Pro👽
📱💻 Twitter ▬ Exit Short: 🔒Titan Pro👽
| 36 | 🤖 Wundertrading : Binance | Bitmex | Bybit | KuCoin | Deribit | OKX | Coinbase | Huobi | Bitfinex | Bitget
🔗 Link Wundertrading: wundertrading.com
🔗 Link 📚 Automation: 🔒Titan Pro👽
📱💻 Wundertrading ▬ Enter Long: 🔒Titan Pro👽
📱💻 Wundertrading ▬ Exit Long: 🔒Titan Pro👽
📱💻 Wundertrading ▬ Enter Short: 🔒Titan Pro👽
📱💻 Wundertrading ▬ Exit Short: 🔒Titan Pro👽
| 37 | 🤖 3commas : Binance | Bybit | OKX | Bitfinex | Coinbase | Deribit | Bitmex | Bittrex | Bitstamp | Gate.io | Kraken | Gemini | Huobi | KuCoin
🔗 Link 3commas: 3commas.io
🔗 Link 📚 Automation: 🔒Titan Pro👽
📱💻 3commas ▬ Enter Long: 🔒Titan Pro👽
📱💻 3commas ▬ Exit Long: 🔒Titan Pro👽
📱💻 3commas ▬ Enter Short: 🔒Titan Pro👽
📱💻 3commas ▬ Exit Short: 🔒Titan Pro👽
| 38 | 🤖 Zignaly : Binance | Ascendex | Bitmex | Kucoin | VCCE
🔗 Link Zignaly: zignaly.com
🔗 Link 📚 Automation: 🔒Titan Pro👽
🤖 Type Automation: Profit Sharing
🤖 Type Provider: Webook
🔑 Key: 🔒Titan Pro👽
🤖 pair: BTCUSDTP
🤖 exchange: binance
🤖 exchangeAccountType: futures
🤖 orderType: market
🚀 leverage: 1x
% positionSizePercentage: 100 %
💸 positionSizeQuote: 10000 $
🆔 signalId: @Signal1234
| 39 | 🤖 Aleeert : Binance
🔗 Link Aleeert: aleeert.com
🔗 Link 📚 Automation: 🔒Titan Pro👽
📱💻 Aleeert ▬ Enter Long: 🔒Titan Pro👽
📱💻 Aleeert ▬ Exit Long: 🔒Titan Pro👽
📱💻 Aleeert ▬ Enter Short: 🔒Titan Pro👽
📱💻 Aleeert ▬ Exit Short: 🔒Titan Pro👽
| 40 | 🤖 Alertatron : Binance | Bybit | Deribit | Bitmex
🔗 Link Alertatron: alertatron.com
🔗 Link 📚 Automation: 🔒Titan Pro👽
📱💻 Alertatron ▬ Enter Long: 🔒Titan Pro👽
📱💻 Alertatron ▬ Exit Long: 🔒Titan Pro👽
📱💻 Alertatron ▬ Enter Short: 🔒Titan Pro👽
📱💻 Alertatron ▬ Exit Short: 🔒Titan Pro👽
| 41 | 🤖 Uniswap-v3
🔗 Link Alertatron: uniswap.org
🔗 Link 📚 Automation: 🔒Titan Pro👽
📱💻 Uniswap-v3 ▬ Enter Long: 🔒Titan Pro👽
📱💻 Uniswap-v3 ▬ Exit Long: 🔒Titan Pro👽
📱💻 Uniswap-v3 ▬ Enter Short: 🔒Titan Pro👽
📱💻 Uniswap-v3 ▬ Exit Short: 🔒Titan Pro👽
| 42 | 🧲🤖 Copy-Trading : Zignaly | Wundertrading
🔗 Link 📚 Copy-Trading: 🔒Titan Pro👽
🧲🤖 Copy-Trading ▬ Zignaly: 🔒Titan Pro👽
🧲🤖 Copy-Trading ▬ Wundertrading: 🔒Titan Pro👽
| 43 | ♻️ ® Don't Repaint!
♻️ This Strategy does not Repaint!: ® Signs Do not repaint❕
♻️ This is a Real Strategy!: Quality : ® Titan Investimentos
📋️️ Get more information about Repainting here:
| 44 | 🔒 Copyright ©️
🔒 Copyright ©️: Copyright © 2023-2024 All rights reserved, ® Titan Investimentos
🔒 Copyright ©️: ® Titan Investimentos
🔒 Copyright ©️: Unique and Exclusive Strategy. All rights reserved
| 45 | 🏛️ Be a Titan Members
🏛️ Titan Pro 👽 Version with ✔️100% Integrated Automation 🤖 and 📚 Automation Tutorials ✔️100% available at: (PDF/VIDEO)
🏛️ Titan Affiliate 🛸 (Subscription Sale) 🔥 Receive 50% commission
| 46 | ⏱ Time Left
Time Left Titan Demo 🐄: ⏱♾ | ⏱ : ♾ Titan Demo 🐄 Version with ❌non-integrated automation 🤖 and 📚 Tutorials for automation ❌not available
Time Left Titan Pro 👽: 🔒Titan Pro👽 | ⏱ : Pro Plans: 30 Days, 90 Days, 12 Months, 24 Months. (👽 Pro 🅼 Monthly, 👽 Pro 🆀 Quarterly, 👽 Pro🅰 Annual, 👽 Pro👾Two Years)
| 47 | Nº Active Users
Nº Active Subscribers Titan Pro 👽: 5️⃣6️⃣ | 1✔️ 5✔️ 10✔️ 100❌ 1K❌ 10K❌ 50K❌ 100K❌ 1M❌ 10M❌ 100M❌ : ⏱ Active Users is updated every 24 hours (Check on indicator)
Nº Active Affiliates Titan Aff 🛸: 6️⃣ | 1✔️ 5✔️ 10❌ 100❌ 1K❌ 10K❌ 50K❌ 100K❌ 1M❌ 10M❌ 100M❌ : ⏱ Active Users is updated every 24 hours (Check on indicator)
2️⃣7️⃣ : 📊 PERFORMANCE : 🆑 Conservative
📊 Exchange: Binance
📊 Pair: BINANCE: BTCUSDTPERP
📊 TimeFrame: 4h
📊 Initial Capital: 10000 $
📊 Order Type: % equity
📊 Size Per Order: 100 %
📊 Commission: 0.03 %
📊 Pyramid: 1
• ⚠️ Risk Profile: 🆑 Conservative: 🎯 TP=2.7 % | 🛑 SL=2.7 %
• 📆All years: 🆑 Conservative: 🚀 Leverage 1️⃣x
📆 Start: September 23, 2019
📆 End: January 11, 2023
📅 Days: 1221
📅 Bars: 7325
Net Profit:
🟢 + 1669.89 %
💲 + 166989.43 USD
Total Close Trades:
⚪️ 369
Percent Profitable:
🟡 64.77 %
Profit Factor:
🟢 2.314
DrawDrown Maximum:
🔴 -24.82 %
💲 -10221.43 USD
Avg Trade:
💲 + 452.55 USD
✔️ Trades Winning: 239
❌ Trades Losing: 130
✔️ Average Gross Win: + 12.31 %
❌ Average Gross Loss: - 9.78 %
✔️ Maximum Consecutive Wins: 9
❌ Maximum Consecutive Losses: 6
% Average Gain Annual: 499.33 %
% Average Gain Monthly: 41.61 %
% Average Gain Weekly: 9.6 %
% Average Gain Day: 1.37 %
💲 Average Gain Annual: 49933 $
💲 Average Gain Monthly: 4161 $
💲 Average Gain Weekly: 960 $
💲 Average Gain Day: 137 $
• 📆 Year: 2020: 🆑 Conservative: 🚀 Leverage 1️⃣x
• 📆 Year: 2021: 🆑 Conservative: 🚀 Leverage 1️⃣x
• 📆 Year: 2022: 🆑 Conservative: 🚀 Leverage 1️⃣x
2️⃣8️⃣ : 📊 PERFORMANCE : Ⓜ️ Moderate
📊 Exchange: Binance
📊 Pair: BINANCE: BTCUSDTPERP
📊 TimeFrame: 4h
📊 Initial Capital: 10000 $
📊 Order Type: % equity
📊 Size Per Order: 100 %
📊 Commission: 0.03 %
📊 Pyramid: 1
• ⚠️ Risk Profile: Ⓜ️ Moderate: 🎯 TP=2.8 % | 🛑 SL=2.7 %
• 📆 All years: Ⓜ️ Moderate: 🚀 Leverage 1️⃣x
📆 Start: September 23, 2019
📆 End: January 11, 2023
📅 Days: 1221
📅 Bars: 7325
Net Profit:
🟢 + 1472.04 %
💲 + 147199.89 USD
Total Close Trades:
⚪️ 362
Percent Profitable:
🟡 63.26 %
Profit Factor:
🟢 2.192
DrawDrown Maximum:
🔴 -22.69 %
💲 -9269.33 USD
Avg Trade:
💲 + 406.63 USD
✔️ Trades Winning: 229
❌ Trades Losing : 133
✔️ Average Gross Win: + 11.82 %
❌ Average Gross Loss: - 9.29 %
✔️ Maximum Consecutive Wins: 9
❌ Maximum Consecutive Losses: 8
% Average Gain Annual: 440.15 %
% Average Gain Monthly: 36.68 %
% Average Gain Weekly: 8.46 %
% Average Gain Day: 1.21 %
💲 Average Gain Annual: 44015 $
💲 Average Gain Monthly: 3668 $
💲 Average Gain Weekly: 846 $
💲 Average Gain Day: 121 $
• 📆 Year: 2020: Ⓜ️ Moderate: 🚀 Leverage 1️⃣x
• 📆 Year: 2021: Ⓜ️ Moderate: 🚀 Leverage 1️⃣x
• 📆 Year: 2022: Ⓜ️ Moderate: 🚀 Leverage 1️⃣x
2️⃣9️⃣ : 📊 PERFORMANCE : 🅰 Aggressive
📊 Exchange: Binance
📊 Pair: BINANCE: BTCUSDTPERP
📊 TimeFrame: 4h
📊 Initial Capital: 10000 $
📊 Order Type: % equity
📊 Size Per Order: 100 %
📊 Commission: 0.03 %
📊 Pyramid: 1
• ⚠️ Risk Profile: 🅰 Aggressive: 🎯 TP=1.6 % | 🛑 SL=6.9 %
• 📆 All years: 🅰 Aggressive: 🚀 Leverage 1️⃣x
📆 Start: September 23, 2019
📆 End: January 11, 2023
📅 Days: 1221
📅 Bars: 7325
Net Profit:
🟢 + 989.38 %
💲 + 98938.38 USD
Total Close Trades:
⚪️ 380
Percent Profitable:
🟢 84.47 %
Profit Factor:
🟢 2.156
DrawDrown Maximum:
🔴 -17.88 %
💲 -9182.84 USD
Avg Trade:
💲 + 260.36 USD
✔️ Trades Winning: 321
❌ Trades Losing: 59
✔️ Average Gross Win: + 5.75 %
❌ Average Gross Loss: - 14.51 %
✔️ Maximum Consecutive Wins: 21
❌ Maximum Consecutive Losses: 6
% Average Gain Annual: 295.84 %
% Average Gain Monthly: 24.65 %
% Average Gain Weekly: 5.69 %
% Average Gain Day: 0.81 %
💲 Average Gain Annual: 29584 $
💲 Average Gain Monthly: 2465 $
💲 Average Gain Weekly: 569 $
💲 Average Gain Day: 81 $
• 📆 Year: 2020: 🅰 Aggressive: 🚀 Leverage 1️⃣x
• 📆 Year: 2021: 🅰 Aggressive: 🚀 Leverage 1️⃣x
• 📆 Year: 2022: 🅰 Aggressive: 🚀 Leverage 1️⃣x
3️⃣0️⃣ : 🛠️ Roadmap
🛠️• 14/ 01 /2023 : Titan THEMIS Launch
🛠️• Updates January/2023 :
• 📚 Tutorials for Automation 🤖 already Available : ✔️
• ✔️ Discord
• ✔️ Wundertrading
• ✔️ Zignaly
• 📚 Tutorials for Automation 🤖 In Preparation : ⭕
• ⭕ Telegram
• ⭕ Twitter
• ⭕ 3comnas
• ⭕ Aleeert
• ⭕ Alertatron
• ⭕ Uniswap-v3
• ⭕ Copy-Trading
🛠️• Updates February/2023 :
• 📰 Launch of advertising material for Titan Affiliates 🛸
• 🛍️🎥🖼️📊 (Sales Page/VSL/Videos/Creative/Infographics)
🛠️• 28/05/2023 : Titan THEMIS update ▬ Version 2.7
🛠️• 28/05/2023 : BOT BOB release ▬ Version 1.0
• (Native Titan THEMIS Automation - Through BOT BOB, a bot for automation of signals, indicators and strategies of TradingView, of own code ▬ in validation.
• BOT BOB
Automation/Connection :
• API - For Centralized Brokers.
• Smart Contracts - Wallet Web - For Decentralized Brokers.
• This way users can automate any indicator or strategy of TradingView and Titan in a decentralized, secure and simplified way.
• Without having the need to use 'third party services' for automating TradingView indicators and strategies like the ones available above.
🛠️• 28/05/2023 : Release ▬ Titan Culture Guide 📝
3️⃣1️⃣ : 🧻 Notes ❕
🧻 • Note ❕ The "Demo 🐄" version, ❌does not have 'integrated automation', to automate the signals of this strategy and enjoy a fully automated system, you need to have access to the Pro version with '100% integrated automation' and all the tutorials for automation available. Become a Titan Pro 👽
🧻 • Note ❕ You will also need to be a "Pro User or higher on Tradingview", to be able to use the webhook feature available only for 'paid' profiles on the platform.
With the webhook feature it is possible to send the signals of this strategy to almost anywhere, in our case to centralized or decentralized brokerages, also to popular messaging services such as: Discord, Telegram or Twiter.
3️⃣2️⃣ : 🚨 Disclaimer ❕❗
🚨 • Disclaimer ❕❕ Past positive result and performance of a system does not guarantee its positive result and performance for the future!
🚨 • Disclaimer ❗❗❗ When using this strategy: Titan Investments is totally Exempt from any claim of liability for losses. The responsibility on the management of your funds is solely yours. This is a very high risk/volatility market! Understand your place in the market.
3️⃣3️⃣ : ♻️ ® No Repaint
This Strategy does not Repaint! This is a real strategy!
3️⃣4️⃣ : 🔒 Copyright ©️
Copyright © 2022-2023 All rights reserved, ® Titan Investimentos
3️⃣5️⃣ : 👏 Acknowledgments
I want to start this message in thanks to TradingView and all the Pinescript community for all the 'magic' created here, a unique ecosystem! rich and healthy, a fertile soil, a 'new world' of possibilities, for a complete deepening and improvement of our best personal skills.
I leave here my immense thanks to the whole community: Tradingview, Pinecoders, Wizards and Moderators.
I was not born Rich .
Thanks to TradingView and pinescript and all its transformation.
I could develop myself and the best of me and the best of my skills.
And consequently build wealth and patrimony.
Gratitude.
One more story for the infinite book !
If you were born poor you were born to be rich !
Raising🔼 the level and raising🔼 the ruler! 📏
My work is my 'debauchery'! Do better! 💐🌹
Soul of a first-timer! Creativity Exudes! 🦄
This is the manifestation of God's magic in me. This is the best of me. 🧙
You will copy me, I know. So you owe me. 💋
My mission here is to raise the consciousness and self-esteem of all Titans and Titanids! Welcome! 🧘 🏛️
The only way to accomplish great work is to do what you love ! Before I learned to program I was wasting my life!
Death is the best creation of life .
Now you are the new , but in the not so distant future you will gradually become the old . Here I stay forever!
Playing the game like an Athlete! 🖼️ Enjoy and Enjoy 🍷 🗿
In honor of: BOB ☆
1 name, 3 letters, 3 possibilities, and if read backwards it's the same thing, a palindrome. ☘
Gratitude to the oracles that have enabled me the 'luck' to get this far: Dal&Ni&Fer
3️⃣6️⃣ : 👮 House Rules : 📺 TradingView
House Rules : This publication and strategy follows all TradingView house guidelines and rules:
📺 TradingView House Rules: www.tradingview.com
📺 Script publication rules: www.tradingview.com
📺 Vendor requirements: www.tradingview.com
📺 Links/References rules: www.tradingview.com
3️⃣7️⃣ : 🏛️ Become a Titan Pro member 👽
🟩 Titan Pro 👽 🟩
3️⃣8️⃣ : 🏛️ Be a member Titan Aff 🛸
🟥 Titan Affiliate 🛸 🟥

Titan Investments|Quantitative THEMIS|Demo|BINANCE:BTCUSDTP:4hInvestment Strategy (Quantitative Trading)
| 🛑 | Watch "LIVE" and 'COPY' this strategy in real time:
🔗 Link: www.tradingview.com
Hello, welcome, feel free 🌹💐
Since the stone age to the most technological age, one thing has not changed, that which continues impress human beings the most, is the other human being!
Deep down, it's all very simple or very complicated, depends on how you look at it.
I believe that everyone was born to do something very well in life.
But few are those who have, let's use the word 'luck' .
Few are those who have the 'luck' to discover this thing.
That is why few are happy and successful in their jobs and professions.
Thank God I had this 'luck' , and discovered what I was born to do well.
And I was born to program. 👨💻
📋 Summary : Project Titan
0️⃣ : 🦄 Project Titan
1️⃣ : ⚖️ Quantitative THEMIS
2️⃣ : 🏛️ Titan Community
3️⃣ : 👨💻 Who am I ❔
4️⃣ : ❓ What is Statistical/Probabilistic Trading ❓
5️⃣ : ❓ How Statistical/Probabilistic Trading works ❓
6️⃣ : ❓ Why use a Statistical/Probabilistic system ❓
7️⃣ : ❓ Why the human brain is not prepared to do Trading ❓
8️⃣ : ❓ What is Backtest ❓
9️⃣ : ❓ How to build a Consistent system ❓
🔟 : ❓ What is a Quantitative Trading system ❓
1️⃣1️⃣ : ❓ How to build a Quantitative Trading system ❓
1️⃣2️⃣ : ❓ How to Exploit Market Anomalies ❓
1️⃣3️⃣ : ❓ What Defines a Robust, Profitable and Consistent System ❓
1️⃣4️⃣ : 🔧 Fixed Technical
1️⃣5️⃣ : ❌ Fixed Outputs : 🎯 TP(%) & 🛑SL(%)
1️⃣6️⃣ : ⚠️ Risk Profile
1️⃣7️⃣ : ⭕ Moving Exits : (Indicators)
1️⃣8️⃣ : 💸 Initial Capital
1️⃣9️⃣ : ⚙️ Entry Options
2️⃣0️⃣ : ❓ How to Automate this Strategy ❓ : 🤖 Automation : 'Third-Party Services'
2️⃣1️⃣ : ❓ How to Automate this Strategy ❓ : 🤖 Automation : 'Exchanges
2️⃣2️⃣ : ❓ How to Automate this Strategy ❓ : 🤖 Automation : 'Messaging Services'
2️⃣3️⃣ : ❓ How to Automate this Strategy ❓ : 🤖 Automation : '🧲🤖Copy-Trading'
2️⃣4️⃣ : ❔ Why be a Titan Pro 👽❔
2️⃣5️⃣ : ❔ Why be a Titan Aff 🛸❔
2️⃣6️⃣ : 📋 Summary : ⚖️ Strategy: Titan Investments|Quantitative THEMIS|Demo|BINANCE:BTCUSDTP:4h
2️⃣7️⃣ : 📊 PERFORMANCE : 🆑 Conservative
2️⃣8️⃣ : 📊 PERFORMANCE : Ⓜ️ Moderate
2️⃣9️⃣ : 📊 PERFORMANCE : 🅰 Aggressive
3️⃣0️⃣ : 🛠️ Roadmap
3️⃣1️⃣ : 🧻 Notes ❕
3️⃣2️⃣ : 🚨 Disclaimer ❕❗
3️⃣3️⃣ : ♻️ ® No Repaint
3️⃣4️⃣ : 🔒 Copyright ©️
3️⃣5️⃣ : 👏 Acknowledgments
3️⃣6️⃣ : 👮 House Rules : 📺 TradingView
3️⃣7️⃣ : 🏛️ Become a Titan Pro member 👽
3️⃣8️⃣ : 🏛️ Be a member Titan Aff 🛸
0️⃣ : 🦄 Project Titan
This is the first real, 100% automated Quantitative Strategy made available to the public and the pinescript community for TradingView.
You will be able to automate all signals of this strategy for your broker , centralized or decentralized and also for messaging services : Discord, Telegram or Twitter .
This is the first strategy of a larger project, in 2023, I will provide a total of 6 100% automated 'Quantitative' strategies to the pinescript community for TradingView.
The future strategies to be shared here will also be unique , never before seen, real 'Quantitative' bots with real, validated results in real operation.
Just like the 'Quantitative THEMIS' strategy, it will be something out of the loop throughout the pinescript/tradingview community, truly unique tools for building mutual wealth consistently and continuously for our community.
1️⃣ : ⚖️ Quantitative THEMIS : Titan Investments|Quantitative THEMIS|Demo|BINANCE:BTCUSDTP:4h
This is a truly unique and out of the curve strategy for BTC /USD .
A truly real strategy, with real, validated results and in real operation.
A unique tool for building mutual wealth, consistently and continuously for the members of the Titan community.
Initially we will operate on a monthly, quarterly, annual or biennial subscription service.
Our goal here is to build a great community, in exchange for an extremely fair value for the use of our truly unique tools, which bring and will bring real results to our community members.
With this business model it will be possible to provide all Titan users and community members with the purest and highest degree of sophistication in the market with pinescript for tradingview, providing unique and truly profitable strategies.
My goal here is to offer the best to our members!
The best 'pinescript' tradingview service in the world!
We are the only Start-Up in the world that will decentralize real and full access to truly real 'quantitative' tools that bring and will bring real results for mutual and ongoing wealth building for our community.
2️⃣ : 🏛️ Titan Community : 👽 Pro 🔁 Aff 🛸
Become a Titan Pro 👽
To get access to the strategy: "Quantitative THEMIS" , and future Titan strategies in a 100% automated way, along with all tutorials for automation.
Pro Plans: 30 Days, 90 Days, 12 Months, 24 Months.
👽 Pro 🅼 Monthly
👽 Pro 🆀 Quarterly
👽 Pro🅰 Annual
👽 Pro👾Two Years
You will have access to a truly unique system that is out of the curve .
A 100% real, 100% automated, tested, validated, profitable, and in real operation strategy.
Become a Titan Affiliate 🛸
By becoming a Titan Affiliate 🛸, you will automatically receive 50% of the value of each new subscription you refer .
You will receive 50% for any of the above plans that you refer .
This way we will encourage our community to grow in a fair and healthy way, because we know what we have in our hands and what we deliver real value to our users.
We are at the highest level of sophistication in the market, the consistency here and the results here speak for themselves.
So growing our community means growing mutual wealth and raising collective conscience.
Wealth must be created not divided.
And here we are creating mutual wealth on all ends and in all ways.
A non-zero sum system, where everybody wins.
3️⃣ : 👨💻 Who am I ❔
My name is FilipeSoh I am 26 years old, Technical Analyst, Trader, Computer Engineer, pinescript Specialist, with extensive experience in several languages and technologies.
For the last 4 years I have been focusing on developing, editing and creating pinescript indicators and strategies for Tradingview for people and myself.
Full-time passionate workaholic pinescript developer with over 10,000 hours of pinescript development.
• Pinescript expert ▬Tradingview.
• Specialist in Automated Trading
• Specialist in Quantitative Trading.
• Statistical/Probabilistic Trading Specialist - Mark Douglas Scholl.
• Inventor of the 'Classic Forecast' Indicators.
• Inventor of the 'Backtest Table'.
4️⃣ : ❓ What is Statistical/Probabilistic Trading ❓
Statistical/probabilistic trading is the only way to get a positive mathematical expectation regarding the market and consequently that is the only way to make money consistently from it.
I will present below some more details about the Quantitative THEMIS strategy, it is a real strategy, tested, validated and in real operation, 'Skin in the Game' , a consistent way to make money with statistical/probabilistic trading in a 100% automated.
I am a Technical Analyst , I used to be a Discretionary Trader , today I am 100% a Statistical Trader .
I've gotten rich and made a lot of money, and I've also lost a lot with 'leverage'.
That was a few years ago.
The book that changed everything for me was "Trading in The Zone" by Mark Douglas.
That's when I understood that the market is just a game of statistics and probability, like a casino!
It was then that I understood that the human brain is not prepared for trading, because it involves triggers and mental emotions.
And emotions in trading and in making trading decisions do not go well together, not in the long run, because you always have the burden of being wrong with the outcome of that particular position.
But remembering that the market is just a statistical game!
5️⃣ : ❓ How Statistical/Probabilistic Trading works ❓
Let's use a 'coin' as an example:
If we toss a 'coin' up 10 times.
Do you agree that it is impossible for us to know exactly the result of the 'plays' before they actually happen?
As in the example above, would you agree, that we cannot "guess" the outcome of a position before it actually happens?
As much as we cannot "guess" whether the coin will drop heads or tails on each flip.
We can analyze the "backtest" of the 10 moves made with that coin:
If we analyze the 10 moves and count the number of times the coin fell heads or tails in a specific sequence, we then have a percentage of times the coin fell heads or tails, so we have a 'backtest' of those moves.
Then on the next flip we can now assume a point or a favorable position for one side, the side with the highest probability .
In a nutshell, this is more or less how probabilistic statistical trading works.
As Statistical Traders we can never say whether such a Trader/Position we take will be a winner or a loser.
But still we can have a positive and consistent result in a "sequence" of trades, because before we even open a position, backtests have already been performed so we identify an anomaly and build a system that will have a positive statistical advantage in our favor over the market.
The advantage will not be in one trade itself, but in the "sequence" of trades as a whole!
Because our system will work like a casino, having a positive mathematical expectation relative to the players/market.
Design, develop, test models and systems that can take advantage of market anomalies, until they change.
Be the casino! - Mark Douglas
6️⃣ : ❓ Why use a Statistical/Probabilistic system ❓
In recent years I have focused and specialized in developing 100% automated trading systems, essentially for the cryptocurrency market.
I have developed many extremely robust and efficient systems, with positive mathematical expectation towards the market.
These are not complex systems per se , because here we want to avoid 'over-optimization' as much as possible.
As Da Vinci said: "Simplicity is the highest degree of sophistication".
I say this because I have tested, tried and developed hundreds of systems/strategies.
I believe I have programmed more than 10,000 unique indicators/strategies, because this is my passion and purpose in life.
I am passionate about what I do, completely!
I love statistical trading because it is the only way to get consistency in the long run!
This is why I have studied, applied, developed, and specialized in 100% automated cryptocurrency trading systems.
The reason why our systems are extremely "simple" is because, as I mentioned before, in statistical trading we want to exploit the market anomaly to the maximum, that is, this anomaly will change from time to time, usually we can exploit a trading system efficiently for about 6 to 12 months, or for a few years, that is; for fixed 'scalpers' systems.
Because at some point these anomalies will be identified , and from the moment they are identified they will be exploited and will stop being anomalies .
With the system presented here; you can even copy the indicators and input values shared here;
However; what I have to offer you is: it is me , our team , and our community !
That is, we will constantly monitor this system, for life , because our goal here is to create a unique , perpetual , profitable , and consistent system for our community.
Myself , our team and our community will keep this script periodically updated , to ensure the positive mathematical expectation of it.
So we don't mind sharing the current parameters and values , because the real value is also in the future updates that this system will receive from me and our team , guided by our culture and our community of real users !
As we are hosted on 'tradingview', all future updates for this strategy, will be implemented and updated automatically on your tradingview account.
What we want here is: to make sure you get gains from our system, because if you get gains , our ecosystem will grow as a whole in a healthy and scalable way, so we will be generating continuous mutual wealth and raising the collective consciousness .
People Need People: 3️⃣🅿
7️⃣ : ❓ Why the human brain is not prepared to do Trading ❓
Today my greatest skill is to develop statistically profitable and 100% automated strategies for 'pinescript' tradingview.
Note that I said: 'profitable' because in fact statistical trading is the only way to make money in a 'consistent' way from the market.
And consequently have a positive wealth curve every cycle, because we will be based on mathematics, not on feelings and news.
Because the human brain is not prepared to do trading.
Because trading is connected to the decision making of the cerebral cortex.
And the decision making is automatically linked to emotions, and emotions don't match with trading decision making, because in those moments, we can feel the best and also the worst sensations and emotions, and this certainly affects us and makes us commit grotesque mistakes!
That's why the human brain is not prepared to do trading.
If you want to participate in a fully automated, profitable and consistent trading system; be a Titan Pro 👽
I believe we are walking an extremely enriching path here, not only in terms of financial returns for our community, but also in terms of knowledge about probabilistic and automated statistical trading.
You will have access to an extremely robust system, which was built upon very strong concepts and foundations, and upon the world's main asset in a few years: Bitcoin .
We are the tip of the best that exists in the cryptocurrency market when it comes to probabilistic and automated statistical trading.
Result is result! Me being dressed or naked.
This is just the beginning!
But there is a way to consistently make money from the market.
Being the Casino! - Mark Douglas
8️⃣ : ❓ What is Backtest ❓
Imagine the market as a purely random system, but even in 'randomness' there are patterns.
So now imagine the market and statistical trading as follows:
Repeating the above 'coin' example, let's think of it as follows:
If we toss a coin up 10 times again.
It is impossible to know which flips will have heads or tails, correct?
But if we analyze these 10 tosses, then we will have a mathematical statistic of the past result, for example, 70 % of the tosses fell 'heads'.
That is:
7 moves fell on "heads" .
3 moves fell on "tails" .
So based on these conditions and on the generic backtest presented here, we could adopt " heads " as our system of moves, to have a statistical and probabilistic advantage in relation to the next move to be performed.
That is, if you define a system, based on backtests , that has a robust positive mathematical expectation in relation to the market you will have a profitable system.
For every move you make you will have a positive statistical advantage in your favor over the market before you even make the move.
Like a casino in relation to all its players!
The casino does not have an advantage over one specific player, but over all players, because it has a positive mathematical expectation about all the moves that night.
The casino will always have a positive statistical advantage over its players.
Note that there will always be real players who will make real, million-dollar bankrolls that night, but this condition is already built into the casino's 'strategy', which has a pre-determined positive statistical advantage of that night as a whole.
Statistical trading is the same thing, as long as you don't understand this you will keep losing money and consistently.
9️⃣ : ❓ How to build a Consistent system ❓
See most traders around the world perform trades believing that that specific position taken will make them filthy rich, because they simply believe faithfully that the position taken will be an undoubted winner, based on a trader's methodology: 'trading a trade' without analyzing the whole context, just using 'empirical' aspects in their system.
But if you think of trading, as a sequence of moves.
You see, 'a sequence' !
When we think statistically, it doesn't matter your result for this , or for the next specific trade , but the final sequence of trades as a whole.
As the market has a random system of results distribution , if your system has a positive statistical advantage in relation to the market, at the end of that sequence you'll have the biggest probability of having a winning bank.
That's how you do real trading!
And with consistency!
Trading is a long term game, but when you change the key you realize that it is a simple game to make money in a consistent way from the market, all you need is patience.
Even more when we are based on Bitcoin, which has its 'Halving' effect where, in theory, we will never lose money in 3 to 4 years intervals, due to its scarcity and the fact that Bitcoin is the 'discovery of digital scarcity' which makes it the digital gold, we believe in this thesis and we follow Satoshi's legacy.
So align Bitcoin with a probabilistic statistical trading system with a positive mathematical expectation of the market and 100% automated with the long term, and all you need is patience, and you will become rich.
In fact Bitcoin by itself is already a path, buy, wait for each halving and your wealth will be maintained.
No inflation, unlike fiat currencies.
This is a complete and extremely robust strategy, with the most current possible and 'not possible' techniques involved and applied here.
Today I am at another level in developing 100% automated 'quantitative' strategies.
I was born for this!
🔟 : ❓ What is a Quantitative Trading system ❓
In addition to having access to a revolutionary strategy you will have access to disruptive 100% multifunctional tables with the ability to perform 'backtests' for better tracking and monitoring of your system on a customized basis.
I would like to emphasize one thing, and that is that you keep this in mind.
Today my greatest skill in 'pinescript' is to build indicators, but mainly strategies, based on statistical and probabilistic trading, with a postive mathematical expectation in relation to the market, in a 100% automated way.
This with the goal of building a consistent and continuous positive equity curve through mathematics using data, converting it into statistical / probabilistic parameters and applying them to a Quantitative model.
Before becoming a Quantitative Trader , I was a Technical Analyst and a Discretionary Trader .
First as a position trader and then as a day trader.
Before becoming a Trader, I trained myself as a Technical Analyst , to masterly understand the shape and workings of the market in theory.
But everything changed when I met 'Mark Douglas' , when I got to know his works, that's when my head exploded 🤯, and I started to understand the market for good!
The market is nothing more than a 'random' system of distributing results.
See that I said: 'random' .
Do yourself a mental exercise.
Is there really such a thing as random ?
I believe not, as far as we know maybe the 'singularity'.
So thinking this way, to translate, the market is nothing more than a game of probability, statistics and pure mathematics.
Like a casino!
What happens is that most traders, whenever they take a position, take it with all the empirical certainty that such position will win or lose, and do not take into consideration the total sequence of results to understand their place in the market.
Understanding your place in the market gives you the ability to create and design systems that can exploit the present market anomaly, and thus make money statistically, consistently, and 100% automated.
Thinking of it this way, it is easy to make money from the market.
There are many ways to make money from the market, but the only consistent way I know of is through 'probabilistic and automated statistical trading'.
1️⃣1️⃣ : ❓ How to build a Quantitative Trading system ❓
There are some fundamental points that must be addressed here in order to understand what makes up a system based on statistics and probability applied to a quantitative model.
When we talk about 'discretionary' trading, it is a trading system based on human decisions after the defined 'empirical' conditions are met.
It is quite another thing to build a fully automated system without any human interference/interaction .
That said:
Building a statistically profitable system is perfectly possible, but this is a high level task , but with possible high rewards and consistent gains.
Here you will find a real "Skin In The Game" strategy.
With all due respect, but the vast majority of traders who post strategies on TradingView do not understand what they are doing.
Most of them do not understand the minimum complexity involved in the main variable for the construction of a real strategy, the mother variable: "strategy".
I say this by my own experience, because I have analyzed practically all the existing publications of TradingView + 200,000 indicators and strategies.
I breathe pinescript, I eat pinescript, I sleep pinescript, I bathe pinescript, I live TradingView.
But the main advantage for the TradingView users, is that all entry and exit orders made by this strategy can be checked and analyzed thoroughly, to validate and prove the veracity of this strategy, because this is a 100% real strategy.
Here there is a huge world of possibilities, but only one way to build a 'pinescript strategy' that will work correctly aligned to the real world with real results .
There are some fundamental points to take into consideration when building a profitable trading system:
The most important of these for me is: 'DrawDown' .
Followed by: 'Hit Rate' .
And only after that we use the parameter: 'Profit'.
See, this is because here, we are dealing with the 'imponderable' , and anything can happen in this scenario.
But there is one thing that makes us sleep peacefully at night, and that is: controlling losses .
That is, in other words: controlling the DrawDown .
The amateur is concerned with 'winning', the professional is concerned with conserving capital.
If we have the losses under control, then we can move on to the other two parameters: hit rate and profit.
See, the second most important factor in building a system is the hit rate.
I say this from my own experience.
I have worked with many systems with a 'low hit rate', but extremely profitable.
For example: systems with hit rates of 40 to 50%.
But as much as statistically and mathematically the profit is rewarding, operating systems with a low hit rate is always very stressful psychologically.
That's why there are two big reasons why when I build an automated trading system, I focus on the high hit rate of the system, they are
1 - To reduce psychological damage as much as possible .
2 - And more important , when we create a system with a 'high hit rate' , there is a huge intrinsic advantage here, that most statistic traders don't take in consideration.
That is: knowing more quickly when the system stops being functional.
The main advantage of a system with a high hit rate is: to identify when the system stops being functional and stop exploiting the market's anomaly.
Look: When we are talking about trading and random distribution of results on the market, do you agree that when we create a trading system, we are focused on exploring some anomaly of that market?
When that anomaly is verified by the market, it will stop being functional with time.
That's why trading systems, 'scalpers', especially for cryptocurrencies, need constant monitoring, quarterly, semi-annually or annually.
Because market movements change from time to time.
Because we go through different cycles from time to time, such as congestion cycles, accumulation , distribution , volatility , uptrends and downtrends .
1️⃣2️⃣ : ❓ How to Exploit Market Anomalies ❓
You see there is a very important point that must be stressed here.
As we are always trying to exploit an 'anomaly' in the market.
So the 'number' of indicators/tools that will integrate the system is of paramount importance.
But most traders do not take this into consideration.
To build a professional, robust, consistent, and profitable system, you don't need to use hundreds of indicators to build your setup.
This will actually make it harder to read when the setup stops working and needs some adjustment.
So focusing on a high hit rate is very important here, this is a fundamental principle that is widely ignored , and with a high hit rate, we can know much more accurately when the system is no longer functional much faster.
As Darwin said: "It is not the strongest or the most intelligent that wins the game of life, it is the most adapted.
So simple systems, as contradictory as it may seem, are more efficient, because they help to identify inflection points in the market much more quickly.
1️⃣3️⃣ : ❓ What Defines a Robust, Profitable and Consistent System ❓
See I have built, hundreds of thousands of indicators and 'pinescript' strategies, hundreds of thousands.
This is an extremely professional, robust and profitable system.
Based on the currency pairs: BTC /USDT
There are many ways and avenues to build a profitable trading setup/system.
And actually this is not a difficult task, taking in consideration, as the main factor here, that our trading and investment plan is for the long term, so consequently we will face scenarios with less noise.
He who is in a hurry eats raw.
As mentioned before.
Defining trends in pinescript is technically a simple task, the hardest task is to determine congestion zones with low volume and volatility, it's in these moments that many false signals are generated, and consequently is where most setups face their maximum DrawDown.
That's why this strategy was strictly and thoroughly planned, built on a very solid foundation, to avoid as much noise as possible, for a positive and consistent equity curve in each market cycle, 'Consistency' is our 'Mantra' around here.
1️⃣4️⃣ : 🔧 Fixed Technical
• Strategy: Titan Investments|Quantitative THEMIS|Demo|BINANCE:BTCUSDTP:4h
• Pair: BTC/USDTP
• Time Frame: 4 hours
• Broker: Binance (Recommended)
For a more conservative scenario, we have built the Quantitative THEMIS for the 4h time frame, with the main focus on consistency.
So we can avoid noise as much as possible!
1️⃣5️⃣ : ❌ Fixed Outputs : 🎯 TP(%) & 🛑SL(%)
In order to build a 'perpetual' system specific to BTC/USDT, it took a lot of testing, and more testing, and a lot of investment and research.
There is one initial and fundamental point that we can address to justify the incredible consistency presented here.
That fundamental point is our exit via Take Profit or Stop Loss percentage (%).
🎯 Take Profit (%)
🛑 Stop Loss (%)
See, today I have been testing some more advanced backtesting models for some cryptocurrency systems.
In which I perform 'backtest of backtest', i.e. we use a set of strategies each focused on a principle, operating individually, but they are part of something unique, i.e. we do 'backtests' of 'backtests' together.
What I mean is that we do a lot of backtesting around here.
I can assure you, that always the best output for a trading system is to set fixed output values!
In other words:
🎯 Take Profit (%)
🛑 Stop Loss (%)
This happens because statistically setting fixed exit structures in the vast majority of times, presents a superior result on the capital/equity curve, throughout history and for the vast majority of setups compared to other exit methods.
This is due to a mathematical principle of simplicity, 'avoiding more noise'.
Thus whenever the Quantitative THEMIS strategy takes a position it has a target and a defined maximum stop percentage.
1️⃣6️⃣ : ⚠️ Risk Profile
The strategy, currently has 3 risk profiles ⚠️ patterns for 'fixed percentage exits': Take Profit (%) and Stop Loss (%) .
They are: ⚠️ Rich's Profiles
✔️🆑 Conservative: 🎯 TP=2.7 % 🛑 SL=2.7 %
❌Ⓜ️ Moderate: 🎯 TP=2.8 % 🛑 SL=2.7 %
❌🅰 Aggressive: 🎯 TP=1.6 % 🛑 SL=6.9 %
You will be able to select and switch between the above options and profiles through the 'input' menu of the strategy by navigating to the "⚠️ Risk Profile" menu.
You can then select, test and apply the Risk Profile above that best suits your risk management, expectations and reality , as well as customize all the 'fixed exit' values through the TP and SL menus below.
1️⃣7️⃣ : ⭕ Moving Exits : (Indicators)
The strategy currently also has 'Moving Exits' based on indicator signals.
These are Moving Exits (Indicators)
📈 LONG : (EXIT)
🧃 (MAO) Short : true
📉 SHORT : (EXIT)
🧃 (MAO) Long: false
You can select and toggle between the above options through the 'input' menu of the strategy by navigating to the "LONG : Exit" and "SHORT : Exit" menu.
1️⃣8️⃣ : 💸 Initial Capital
By default the "Initial Capital" set for entries and backtests of this strategy is: 10000 $
You can set another value for the 'Starting Capital' through the tradingview menu under "properties" , and edit the value of the "Initial Capital" field.
This way you can set and test other 'Entry Values' for your trades, tests and backtests.
1️⃣9️⃣ : ⚙️ Entry Options
By default the 'order size' set for this strategy is 100 % of the 'initial capital' on each new trade.
You can set and test other entry options like : contracts , cash , % of equity
You should make these changes directly in the input menu of the strategy by navigating to the menu "⚙️ Properties : TradingView" below.
⚙️ Properties : (TradingView)
📊 Strategy Type: strategy.position_size != 1
📝💲 % Order Type: % of equity
📝💲 % Order Size: 100
Leverage: 1
So you can define and test other 'Entry Options' for your trades, tests and backtests.
2️⃣0️⃣ : ❓ How to Automate this Strategy ❓ : 🤖 Automation : 'Third-Party Services'
It is possible to automate the signals of this strategy for any centralized or decentralized broker, as well as for messaging services: Discord, Telegram and Twitter.
All in an extremely simple and uncomplicated way through the tutorials available in PDF /VIDEO for our Titan Pro 👽 subscriber community.
With our tutorials in PDF and Video it will be possible to automate the signals of this strategy for the chosen service in an extremely simple way with less than 10 steps only.
Tradingview naturally doesn't count with native integration between brokers and tradingview.
But it is possible to use 'third party services' to do the integration and automation between Tradingview and your centralized or decentralized broker.
Here are the standard, available and recommended 'third party services' to automate the signals from the 'Quantitative THEMIS' strategy on the tradingview for your broker:
1) Wundertrading (Recommended):
2) 3commas:
3) Zignaly:
4) Aleeert.com (Recommended):
5) Alertatron:
Note! 'Third party services' cannot perform 'withdrawals' via their key 'API', they can only open positions, so your funds will always be 'safe' in your brokerage firm, being traded via the 'API', when they receive an entry and exit signal from this strategy.
2️⃣1️⃣ : ❓ How to Automate this Strategy ❓ : 🤖 Automation : 'Exchanges
You can automate this strategy for any of the brokers below, through your broker's 'API' by connecting it to the 'third party automation services' for tradingview available and mentioned in the menu above:
1) Binance (Recommended)
2) Bitmex
3) Bybit
4) KuCoin
5) Deribit
6) OKX
7) Coinbase
8) Huobi
9) Bitfinex
10) Bitget
11) Bittrex
12) Bitstamp
13) Gate. io
14) Kraken
15) Gemini
16) Ascendex
17) VCCE
2️⃣2️⃣ : ❓ How to Automate this Strategy ❓ : 🤖 Automation : 'Messaging Services'
You can also automate and monitor the signals of this strategy much more efficiently by sending them to the following popular messaging services:
1) Discord
2) Telegram
3) Twitter
2️⃣3️⃣ : ❓ How to Automate this Strategy ❓ : 🤖 Automation : '🧲🤖Copy-Trading'
It will also be possible to copy/replicate the entries and exits of this strategy to your broker in an extremely simple and agile way, through the available copy-trader services.
This way it will be possible to replicate the signals of this strategy at each entry and exit to your broker through the API connecting it to the integrated copy-trader services available through the tradingview automation services below:
1) Wundetrading:
2) Zignaly:
2️⃣4️⃣ : ❔ Why be a Titan Pro 👽❔
I believe that today I am at another level in 'pinescript' development.
I consider myself today a true unicorn as a pinescript developer, someone unique and very rare.
If you choose another tool or another pinescript service, this tool will be just another one, with no real results.
But if you join our Titan community, you will have access to a unique tool! And you will get real results!
I already earn money consistently with statistical and automated trading and as an expert pinescript developer.
I am here to evolve my skills as much as possible, and one day become a pinescript 'Wizard'.
So excellence, quality and professionalism will always be my north here.
You will never find a developer like me, and who will take so seriously such a revolutionary project as this one. A Maverick! ▬ The man never stops!
Here you will find the highest degree of sophistication and development in the market for 'pinescript'.
You will get the best of me and the best of pinescript possible.
Let me show you how a professional in my field does it.
Become a Titan Pro Member 👽 and get Full Access to this strategy and all the Automation Tutorials.
Be the Titan in your life!
2️⃣5️⃣ : ❔ Why be a Titan Aff 🛸❔
Get financial return for your referrals, Decentralize the World, and raise the collective consciousness.
2️⃣6️⃣ : 📋 Summary : ⚖️ Strategy: Titan Investments|Quantitative THEMIS|Demo|BINANCE:BTCUSDTP:4h
® Titan Investimentos | Quantitative THEMIS ⚖️ | Demo 🐄 2.6 | Dev: © FilipeSoh 🧙 | 🤖 100% Automated : Discord, Telegram, Twitter, Wundertrading, 3commas, Zignaly, Aleeert, Alertatron, Uniswap-v3 | BINANCE:BTCUSDTPERP 4h
🛒 Subscribe this strategy ❗️ Be a Titan Member 🏛️
🛒 Titan Pro 👽 🔗 🏛️ Titan Pro 👽 Version with ✔️100% Integrated Automation 🤖 and 📚 Automation Tutorials ✔️100% available at: (PDF/VIDEO)
🛒 Titan Affiliate 🛸 🔗 🏛️ Titan Affiliate 🛸 (Subscription Sale) 🔥 Receive 50% commission
📋 Summary : QT THEMIS ⚖️
🕵️♂️ Check This Strategy..................................................................0
🦄 ® Titan Investimentos...............................................................1
👨💻 © Developer..........................................................................2
📚 Signal Automation Tutorials : (PDF/VIDEO).......................................3
👨🔧 Revision...............................................................................4
📊 Table : (BACKTEST)..................................................................5
📊 Table : (INFORMATIONS).............................................................6
⚙️ Properties : (TRADINGVIEW)........................................................7
📆 Backtest : (TRADINGVIEW)..........................................................8
⚠️ Risk Profile...........................................................................9
🟢 On 🔴 Off : (LONG/SHORT).......................................................10
📈 LONG : (ENTRY)....................................................................11
📉 SHORT : (ENTRY)...................................................................12
📈 LONG : (EXIT).......................................................................13
📉 SHORT : (EXIT)......................................................................14
🧩 (EI) External Indicator.............................................................15
📡 (QT) Quantitative...................................................................16
🎠 (FF) Forecast......................................................................17
🅱 (BB) Bollinger Bands................................................................18
🧃 (MAP) Moving Average Primary......................................................19
🧃 (MAP) Labels.........................................................................20
🍔 (MAQ) Moving Average Quaternary.................................................21
🍟 (MACD) Moving Average Convergence Divergence...............................22
📣 (VWAP) Volume Weighted Average Price........................................23
🪀 (HL) HILO..........................................................................24
🅾 (OBV) On Balance Volume.........................................................25
🥊 (SAR) Stop and Reverse...........................................................26
🛡️ (DSR) Dynamic Support and Resistance..........................................27
🔊 (VD) Volume Directional..........................................................28
🧰 (RSI) Relative Momentum Index.................................................29
🎯 (TP) Take Profit %..................................................................30
🛑 (SL) Stop Loss %....................................................................31
🤖 Automation Selected...............................................................32
📱💻 Discord............................................................................33
📱💻 Telegram..........................................................................34
📱💻 Twitter...........................................................................35
🤖 Wundertrading......................................................................36
🤖 3commas............................................................................37
🤖 Zignaly...............................................................................38
🤖 Aleeert...............................................................................39
🤖 Alertatron...........................................................................40
🤖 Uniswap-v3..........................................................................41
🧲🤖 Copy-Trading....................................................................42
♻️ ® No Repaint........................................................................43
🔒 Copyright ©️..........................................................................44
🏛️ Be a Titan Member..................................................................45
Nº Active Users..........................................................................46
⏱ Time Left............................................................................47
| 0 | 🕵️♂️ Check This Strategy
🕵️♂️ Version Demo: 🐄 Version with ❌non-integrated automation 🤖 and 📚 Tutorials for automation ❌not available
🕵️♂️ Version Pro: 👽 Version with ✔️100% Integrated Automation 🤖 and 📚 Automation Tutorials ✔️100% available at: (PDF/VIDEO)
| 1 | 🦄 ® Titan Investimentos
Decentralizing the World 🗺
Raising the Collective Conscience 🗺
🦄Site:
🦄TradingView: www.tradingview.com
🦄Discord:
🦄Telegram:
🦄Youtube:
🦄Twitter:
🦄Instagram:
🦄TikTok:
🦄Linkedin:
🦄E-mail:
| 2 | 👨💻 © Developer
🧠 Developer: @FilipeSoh🧙
📺 TradingView: www.tradingview.com
☑️ Linkedin:
✅ Fiverr:
✅ Upwork:
🎥 YouTube:
🐤 Twitter:
🤳 Instagram:
| 3 | 📚 Signal Automation Tutorials : (PDF/VIDEO)
📚 Discord: 🔗 Link: 🔒Titan Pro👽
📚 Telegram: 🔗 Link: 🔒Titan Pro👽
📚 Twitter: 🔗 Link: 🔒Titan Pro👽
📚 Wundertrading: 🔗 Link: 🔒Titan Pro👽
📚 3comnas: 🔗 Link: 🔒Titan Pro👽
📚 Zignaly: 🔗 Link: 🔒Titan Pro👽
📚 Aleeert: 🔗 Link: 🔒Titan Pro👽
📚 Alertatron: 🔗 Link: 🔒Titan Pro👽
📚 Uniswap-v3: 🔗 Link: 🔒Titan Pro👽
📚 Copy-Trading: 🔗 Link: 🔒Titan Pro👽
| 4 | 👨🔧 Revision
👨🔧 Start Of Operations: 01 Jan 2019 21:00 -0300 💡 Start Of Operations (Skin in the game) : Revision 1.0
👨🔧 Previous Review: 01 Jan 2022 21:00 -0300 💡 Previous Review : Revision 2.0
👨🔧 Current Revision: 01 Jan 2023 21:00 -0300 💡 Current Revision : Revision 2.6
👨🔧 Next Revision: 28 May 2023 21:00 -0300 💡 Next Revision : Revision 2.7
| 5 | 📊 Table : (BACKTEST)
📊 Table: true
🖌️ Style: label.style_label_left
📐 Size: size_small
📏 Line: defval
🎨 Color: #131722
| 6 | 📊 Table : (INFORMATIONS)
📊 Table: false
🖌️ Style: label.style_label_right
📐 Size: size_small
📏 Line: defval
🎨 Color: #131722
| 7 | ⚙️ Properties : (TradingView)
📊 Strategy Type: strategy.position_size != 1
📝💲 % Order Type: % of equity
📝💲 % Order Size: 100 %
🚀 Leverage: 1
| 8 | 📆 Backtest : (TradingView)
🗓️ Mon: true
🗓️ Tue: true
🗓️ Wed: true
🗓️ Thu: true
🗓️ Fri: true
🗓️ Sat: true
🗓️ Sun: true
📆 Range: custom
📆 Start: UTC 31 Oct 2008 00:00
📆 End: UTC 31 Oct 2030 23:45
📆 Session: 0000-0000
📆 UTC: UTC
| 9 | ⚠️ Risk Profile
✔️🆑 Conservative: 🎯 TP=2.7 % 🛑 SL=2.7 %
❌Ⓜ️ Moderate: 🎯 TP=2.8 % 🛑 SL=2.7 %
❌🅰 Aggressive: 🎯 TP=1.6 % 🛑 SL=6.9 %
| 10 | 🟢 On 🔴 Off : (LONG/SHORT)
🟢📈 LONG: true
🟢📉 SHORT: true
| 11 | 📈 LONG : (ENTRY)
📡 (QT) Long: true
🧃 (MAP) Long: false
🅱 (BB) Long: false
🍟 (MACD) Long: false
🅾 (OBV) Long: false
| 12 | 📉 SHORT : (ENTRY)
📡 (QT) Short: true
🧃 (MAP) Short: false
🅱 (BB) Short: false
🍟 (MACD) Short: false
🅾 (OBV) Short: false
| 13 | 📈 LONG : (EXIT)
🧃 (MAP) Short: true
| 14 | 📉 SHORT : (EXIT)
🧃 (MAP) Long: false
| 15 | 🧩 (EI) External Indicator
🧩 (EI) Connect your external indicator/filter: false
🧩 (EI) Connect your indicator here (Study mode only): close
🧩 (EI) Connect your indicator here (Study mode only): close
| 16 | 📡 (QT) Quantitative
📡 (QT) Quantitative: true
📡 (QT) Market: BINANCE:BTCUSDTPERP
📡 (QT) Dice: openai
| 17 | 🎠 (FF) Forecast
🎠 (FF) Include current unclosed current candle: true
🎠 (FF) Forecast Type: flat
🎠 (FF) Nº of candles to use in linear regression: 3
| 18 | 🅱 (BB) Bollinger Bands
🅱 (BB) Bollinger Bands: true
🅱 (BB) Type: EMA
🅱 (BB) Period: 20
🅱 (BB) Source: close
🅱 (BB) Multiplier: 2
🅱 (BB) Linewidth: 0
🅱 (BB) Color: #131722
| 19 | 🧃 (MAP) Moving Average Primary
🧃 (MAP) Moving Average Primary: true
🧃 (MAP) BarColor: false
🧃 (MAP) Background: false
🧃 (MAP) Type: SMA
🧃 (MAP) Source: open
🧃 (MAP) Period: 100
🧃 (MAP) Multiplier: 2.0
🧃 (MAP) Linewidth: 2
🧃 (MAP) Color P: #42bda8
🧃 (MAP) Color N: #801922
| 20 | 🧃 (MAP) Labels
🧃 (MAP) Labels: true
🧃 (MAP) Style BUY ZONE: shape.labelup
🧃 (MAP) Color BUY ZONE: #42bda8
🧃 (MAP) Style SELL ZONE: shape.labeldown
🧃 (MAP) Color SELL ZONE: #801922
| 21 | 🍔 (MAQ) Moving Average Quaternary
🍔 (MAQ) Moving Average Quaternary: true
🍔 (MAQ) BarColor: false
🍔 (MAQ) Background: false
🍔 (MAQ) Type: SMA
🍔 (MAQ) Source: close
🍔 (MAQ) Primary: 14
🍔 (MAQ) Secondary: 22
🍔 (MAQ) Tertiary: 44
🍔 (MAQ) Quaternary: 16
🍔 (MAQ) Linewidth: 0
🍔 (MAQ) Color P: #42bda8
🍔 (MAQ) Color N: #801922
| 22 | 🍟 (MACD) Moving Average Convergence Divergence
🍟 (MACD) Macd Type: EMA
🍟 (MACD) Signal Type: EMA
🍟 (MACD) Source: close
🍟 (MACD) Fast: 12
🍟 (MACD) Slow: 26
🍟 (MACD) Smoothing: 9
| 23 | 📣 (VWAP) Volume Weighted Average Price
📣 (VWAP) Source: close
📣 (VWAP) Period: 340
📣 (VWAP) Momentum A: 84
📣 (VWAP) Momentum B: 150
📣 (VWAP) Average Volume: 1
📣 (VWAP) Multiplier: 1
📣 (VWAP) Diviser: 2
| 24 | 🪀 (HL) HILO
🪀 (HL) Type: SMA
🪀 (HL) Function: Maverick🧙
🪀 (HL) Source H: high
🪀 (HL) Source L: low
🪀 (HL) Period: 20
🪀 (HL) Momentum: 26
🪀 (HL) Diviser: 2
🪀 (HL) Multiplier: 1
| 25 | 🅾 (OBV) On Balance Volume
🅾 (OBV) Type: EMA
🅾 (OBV) Source: close
🅾 (OBV) Period: 16
🅾 (OBV) Diviser: 2
🅾 (OBV) Multiplier: 1
| 26 | 🥊 (SAR) Stop and Reverse
🥊 (SAR) Source: close
🥊 (SAR) High: 1.8
🥊 (SAR) Mid: 1.6
🥊 (SAR) Low: 1.6
🥊 (SAR) Diviser: 2
🥊 (SAR) Multiplier: 1
| 27 | 🛡️ (DSR) Dynamic Support and Resistance
🛡️ (DSR) Source D: close
🛡️ (DSR) Source R: high
🛡️ (DSR) Source S: low
🛡️ (DSR) Momentum R: 0
🛡️ (DSR) Momentum S: 2
🛡️ (DSR) Diviser: 2
🛡️ (DSR) Multiplier: 1
| 28 | 🔊 (VD) Volume Directional
🔊 (VD) Type: SMA
🔊 (VD) Period: 68
🔊 (VD) Momentum: 3.8
🔊 (VD) Diviser: 2
🔊 (VD) Multiplier: 1
| 29 | 🧰 (RSI) Relative Momentum Index
🧰 (RSI) Type UP: EMA
🧰 (RSI) Type DOWN: EMA
🧰 (RSI) Source: close
🧰 (RSI) Period: 29
🧰 (RSI) Smoothing: 22
🧰 (RSI) Momentum R: 64
🧰 (RSI) Momentum S: 142
🧰 (RSI) Diviser: 2
🧰 (RSI) Multiplier: 1
| 30 | 🎯 (TP) Take Profit %
🎯 (TP) Take Profit: false
🎯 (TP) %: 2.2
🎯 (TP) Color: #42bda8
🎯 (TP) Linewidth: 1
| 31 | 🛑 (SL) Stop Loss %
🛑 (SL) Stop Loss: false
🛑 (SL) %: 2.7
🛑 (SL) Color: #801922
🛑 (SL) Linewidth: 1
| 32 | 🤖 Automation : Discord | Telegram | Twitter | Wundertrading | 3commas | Zignaly | Aleeert | Alertatron | Uniswap-v3
🤖 Automation Selected : Discord
| 33 | 🤖 Discord
🔗 Link Discord:
🔗 Link 📚 Automation: 🔒Titan Pro👽
📱💻 Discord ▬ Enter Long: 🔒Titan Pro👽
📱💻 Discord ▬ Exit Long: 🔒Titan Pro👽
📱💻 Discord ▬ Enter Short: 🔒Titan Pro👽
📱💻 Discord ▬ Exit Short: 🔒Titan Pro👽
| 34 | 🤖 Telegram
🔗 Link Telegram:
🔗 Link 📚 Automation: 🔒Titan Pro👽
📱💻 Telegram ▬ Enter Long: 🔒Titan Pro👽
📱💻 Telegram ▬ Exit Long: 🔒Titan Pro👽
📱💻 Telegram ▬ Enter Short: 🔒Titan Pro👽
📱💻 Telegram ▬ Exit Short: 🔒Titan Pro👽
| 35 | 🤖 Twitter
🔗 Link Twitter:
🔗 Link 📚 Automation: 🔒Titan Pro👽
📱💻 Twitter ▬ Enter Long: 🔒Titan Pro👽
📱💻 Twitter ▬ Exit Long: 🔒Titan Pro👽
📱💻 Twitter ▬ Enter Short: 🔒Titan Pro👽
📱💻 Twitter ▬ Exit Short: 🔒Titan Pro👽
| 36 | 🤖 Wundertrading : Binance | Bitmex | Bybit | KuCoin | Deribit | OKX | Coinbase | Huobi | Bitfinex | Bitget
🔗 Link Wundertrading:
🔗 Link 📚 Automation: 🔒Titan Pro👽
📱💻 Wundertrading ▬ Enter Long: 🔒Titan Pro👽
📱💻 Wundertrading ▬ Exit Long: 🔒Titan Pro👽
📱💻 Wundertrading ▬ Enter Short: 🔒Titan Pro👽
📱💻 Wundertrading ▬ Exit Short: 🔒Titan Pro👽
| 37 | 🤖 3commas : Binance | Bybit | OKX | Bitfinex | Coinbase | Deribit | Bitmex | Bittrex | Bitstamp | Gate.io | Kraken | Gemini | Huobi | KuCoin
🔗 Link 3commas:
🔗 Link 📚 Automation: 🔒Titan Pro👽
📱💻 3commas ▬ Enter Long: 🔒Titan Pro👽
📱💻 3commas ▬ Exit Long: 🔒Titan Pro👽
📱💻 3commas ▬ Enter Short: 🔒Titan Pro👽
📱💻 3commas ▬ Exit Short: 🔒Titan Pro👽
| 38 | 🤖 Zignaly : Binance | Ascendex | Bitmex | Kucoin | VCCE
🔗 Link Zignaly:
🔗 Link 📚 Automation: 🔒Titan Pro👽
🤖 Type Automation: Profit Sharing
🤖 Type Provider: Webook
🔑 Key: 🔒Titan Pro👽
🤖 pair: BTCUSDTP
🤖 exchange: binance
🤖 exchangeAccountType: futures
🤖 orderType: market
🚀 leverage: 1x
% positionSizePercentage: 100 %
💸 positionSizeQuote: 10000 $
🆔 signalId: @Signal1234
| 39 | 🤖 Aleeert : Binance
🔗 Link Aleeert:
🔗 Link 📚 Automation: 🔒Titan Pro👽
📱💻 Aleeert ▬ Enter Long: 🔒Titan Pro👽
📱💻 Aleeert ▬ Exit Long: 🔒Titan Pro👽
📱💻 Aleeert ▬ Enter Short: 🔒Titan Pro👽
📱💻 Aleeert ▬ Exit Short: 🔒Titan Pro👽
| 40 | 🤖 Alertatron : Binance | Bybit | Deribit | Bitmex
🔗 Link Alertatron:
🔗 Link 📚 Automation: 🔒Titan Pro👽
📱💻 Alertatron ▬ Enter Long: 🔒Titan Pro👽
📱💻 Alertatron ▬ Exit Long: 🔒Titan Pro👽
📱💻 Alertatron ▬ Enter Short: 🔒Titan Pro👽
📱💻 Alertatron ▬ Exit Short: 🔒Titan Pro👽
| 41 | 🤖 Uniswap-v3
🔗 Link Alertatron:
🔗 Link 📚 Automation: 🔒Titan Pro👽
📱💻 Uniswap-v3 ▬ Enter Long: 🔒Titan Pro👽
📱💻 Uniswap-v3 ▬ Exit Long: 🔒Titan Pro👽
📱💻 Uniswap-v3 ▬ Enter Short: 🔒Titan Pro👽
📱💻 Uniswap-v3 ▬ Exit Short: 🔒Titan Pro👽
| 42 | 🧲🤖 Copy-Trading : Zignaly | Wundertrading
🔗 Link 📚 Copy-Trading: 🔒Titan Pro👽
🧲🤖 Copy-Trading ▬ Zignaly: 🔒Titan Pro👽
🧲🤖 Copy-Trading ▬ Wundertrading: 🔒Titan Pro👽
| 43 | ♻️ ® Don't Repaint!
♻️ This Strategy does not Repaint!: ® Signs Do not repaint❕
♻️ This is a Real Strategy!: Quality : ® Titan Investimentos
📋️️ Get more information about Repainting here:
| 44 | 🔒 Copyright ©️
🔒 Copyright ©️: Copyright © 2023-2024 All rights reserved, ® Titan Investimentos
🔒 Copyright ©️: ® Titan Investimentos
🔒 Copyright ©️: Unique and Exclusive Strategy. All rights reserved
| 45 | 🏛️ Be a Titan Members
🏛️ Titan Pro 👽 Version with ✔️100% Integrated Automation 🤖 and 📚 Automation Tutorials ✔️100% available at: (PDF/VIDEO)
🏛️ Titan Affiliate 🛸 (Subscription Sale) 🔥 Receive 50% commission
| 46 | ⏱ Time Left
Time Left Titan Demo 🐄: ⏱♾ | ⏱ : ♾ Titan Demo 🐄 Version with ❌non-integrated automation 🤖 and 📚 Tutorials for automation ❌not available
Time Left Titan Pro 👽: 🔒Titan Pro👽 | ⏱ : Pro Plans: 30 Days, 90 Days, 12 Months, 24 Months. (👽 Pro 🅼 Monthly, 👽 Pro 🆀 Quarterly, 👽 Pro🅰 Annual, 👽 Pro👾Two Years)
| 47 | Nº Active Users
Nº Active Subscribers Titan Pro 👽: 5️⃣6️⃣ | 1✔️ 5✔️ 10✔️ 100❌ 1K❌ 10K❌ 50K❌ 100K❌ 1M❌ 10M❌ 100M❌ : ⏱ Active Users is updated every 24 hours (Check on indicator)
Nº Active Affiliates Titan Aff 🛸: 6️⃣ | 1✔️ 5✔️ 10❌ 100❌ 1K❌ 10K❌ 50K❌ 100K❌ 1M❌ 10M❌ 100M❌ : ⏱ Active Users is updated every 24 hours (Check on indicator)
2️⃣7️⃣ : 📊 PERFORMANCE : 🆑 Conservative
📊 Exchange: Binance
📊 Pair: BINANCE: BTCUSDTPERP
📊 TimeFrame: 4h
📊 Initial Capital: 10000 $
📊 Order Type: % equity
📊 Size Per Order: 100 %
📊 Commission: 0.03 %
📊 Pyramid: 1
• ⚠️ Risk Profile: 🆑 Conservative: 🎯 TP=2.7 % | 🛑 SL=2.7 %
• 📆All years: 🆑 Conservative: 🚀 Leverage 1️⃣x
📆 Start: September 23, 2019
📆 End: January 11, 2023
📅 Days: 1221
📅 Bars: 7325
Net Profit:
🟢 + 1669.89 %
💲 + 166989.43 USD
Total Close Trades:
⚪️ 369
Percent Profitable:
🟡 64.77 %
Profit Factor:
🟢 2.314
DrawDrown Maximum:
🔴 -24.82 %
💲 -10221.43 USD
Avg Trade:
💲 + 452.55 USD
✔️ Trades Winning: 239
❌ Trades Losing: 130
✔️ Average Gross Win: + 12.31 %
❌ Average Gross Loss: - 9.78 %
✔️ Maximum Consecutive Wins: 9
❌ Maximum Consecutive Losses: 6
% Average Gain Annual: 499.33 %
% Average Gain Monthly: 41.61 %
% Average Gain Weekly: 9.6 %
% Average Gain Day: 1.37 %
💲 Average Gain Annual: 49933 $
💲 Average Gain Monthly: 4161 $
💲 Average Gain Weekly: 960 $
💲 Average Gain Day: 137 $
• 📆 Year: 2020: 🆑 Conservative: 🚀 Leverage 1️⃣x
• 📆 Year: 2021: 🆑 Conservative: 🚀 Leverage 1️⃣x
• 📆 Year: 2022: 🆑 Conservative: 🚀 Leverage 1️⃣x
2️⃣8️⃣ : 📊 PERFORMANCE : Ⓜ️ Moderate
📊 Exchange: Binance
📊 Pair: BINANCE: BTCUSDTPERP
📊 TimeFrame: 4h
📊 Initial Capital: 10000 $
📊 Order Type: % equity
📊 Size Per Order: 100 %
📊 Commission: 0.03 %
📊 Pyramid: 1
• ⚠️ Risk Profile: Ⓜ️ Moderate: 🎯 TP=2.8 % | 🛑 SL=2.7 %
• 📆 All years: Ⓜ️ Moderate: 🚀 Leverage 1️⃣x
📆 Start: September 23, 2019
📆 End: January 11, 2023
📅 Days: 1221
📅 Bars: 7325
Net Profit:
🟢 + 1472.04 %
💲 + 147199.89 USD
Total Close Trades:
⚪️ 362
Percent Profitable:
🟡 63.26 %
Profit Factor:
🟢 2.192
DrawDrown Maximum:
🔴 -22.69 %
💲 -9269.33 USD
Avg Trade:
💲 + 406.63 USD
✔️ Trades Winning: 229
❌ Trades Losing : 133
✔️ Average Gross Win: + 11.82 %
❌ Average Gross Loss: - 9.29 %
✔️ Maximum Consecutive Wins: 9
❌ Maximum Consecutive Losses: 8
% Average Gain Annual: 440.15 %
% Average Gain Monthly: 36.68 %
% Average Gain Weekly: 8.46 %
% Average Gain Day: 1.21 %
💲 Average Gain Annual: 44015 $
💲 Average Gain Monthly: 3668 $
💲 Average Gain Weekly: 846 $
💲 Average Gain Day: 121 $
• 📆 Year: 2020: Ⓜ️ Moderate: 🚀 Leverage 1️⃣x
• 📆 Year: 2021: Ⓜ️ Moderate: 🚀 Leverage 1️⃣x
• 📆 Year: 2022: Ⓜ️ Moderate: 🚀 Leverage 1️⃣x
2️⃣9️⃣ : 📊 PERFORMANCE : 🅰 Aggressive
📊 Exchange: Binance
📊 Pair: BINANCE: BTCUSDTPERP
📊 TimeFrame: 4h
📊 Initial Capital: 10000 $
📊 Order Type: % equity
📊 Size Per Order: 100 %
📊 Commission: 0.03 %
📊 Pyramid: 1
• ⚠️ Risk Profile: 🅰 Aggressive: 🎯 TP=1.6 % | 🛑 SL=6.9 %
• 📆 All years: 🅰 Aggressive: 🚀 Leverage 1️⃣x
📆 Start: September 23, 2019
📆 End: January 11, 2023
📅 Days: 1221
📅 Bars: 7325
Net Profit:
🟢 + 989.38 %
💲 + 98938.38 USD
Total Close Trades:
⚪️ 380
Percent Profitable:
🟢 84.47 %
Profit Factor:
🟢 2.156
DrawDrown Maximum:
🔴 -17.88 %
💲 -9182.84 USD
Avg Trade:
💲 + 260.36 USD
✔️ Trades Winning: 321
❌ Trades Losing: 59
✔️ Average Gross Win: + 5.75 %
❌ Average Gross Loss: - 14.51 %
✔️ Maximum Consecutive Wins: 21
❌ Maximum Consecutive Losses: 6
% Average Gain Annual: 295.84 %
% Average Gain Monthly: 24.65 %
% Average Gain Weekly: 5.69 %
% Average Gain Day: 0.81 %
💲 Average Gain Annual: 29584 $
💲 Average Gain Monthly: 2465 $
💲 Average Gain Weekly: 569 $
💲 Average Gain Day: 81 $
• 📆 Year: 2020: 🅰 Aggressive: 🚀 Leverage 1️⃣x
• 📆 Year: 2021: 🅰 Aggressive: 🚀 Leverage 1️⃣x
• 📆 Year: 2022: 🅰 Aggressive: 🚀 Leverage 1️⃣x
3️⃣0️⃣ : 🛠️ Roadmap
🛠️• 14/ 01 /2023 : Titan THEMIS Launch
🛠️• Updates January/2023 :
• 📚 Tutorials for Automation 🤖 already Available : ✔️
• ✔️ Discord
• ✔️ Wundertrading
• ✔️ Zignaly
• 📚 Tutorials for Automation 🤖 In Preparation : ⭕
• ⭕ Telegram
• ⭕ Twitter
• ⭕ 3comnas
• ⭕ Aleeert
• ⭕ Alertatron
• ⭕ Uniswap-v3
• ⭕ Copy-Trading
🛠️• Updates February/2023 :
• 📰 Launch of advertising material for Titan Affiliates 🛸
• 🛍️🎥🖼️📊 (Sales Page/VSL/Videos/Creative/Infographics)
🛠️• 28/05/2023 : Titan THEMIS update ▬ Version 2.7
🛠️• 28/05/2023 : BOT BOB release ▬ Version 1.0
• (Native Titan THEMIS Automation - Through BOT BOB, a bot for automation of signals, indicators and strategies of TradingView, of own code ▬ in validation.
• BOT BOB
Automation/Connection :
• API - For Centralized Brokers.
• Smart Contracts - Wallet Web - For Decentralized Brokers.
• This way users can automate any indicator or strategy of TradingView and Titan in a decentralized, secure and simplified way.
• Without having the need to use 'third party services' for automating TradingView indicators and strategies like the ones available above.
🛠️• 28/05/2023 : Release ▬ Titan Culture Guide 📝
3️⃣1️⃣ : 🧻 Notes ❕
🧻 • Note ❕ The "Demo 🐄" version, ❌does not have 'integrated automation', to automate the signals of this strategy and enjoy a fully automated system, you need to have access to the Pro version with '100% integrated automation' and all the tutorials for automation available. Become a Titan Pro 👽
🧻 • Note ❕ You will also need to be a "Pro User or higher on Tradingview", to be able to use the webhook feature available only for 'paid' profiles on the platform.
With the webhook feature it is possible to send the signals of this strategy to almost anywhere, in our case to centralized or decentralized brokerages, also to popular messaging services such as: Discord, Telegram or Twiter.
3️⃣2️⃣ : 🚨 Disclaimer ❕❗
🚨 • Disclaimer ❕❕ Past positive result and performance of a system does not guarantee its positive result and performance for the future!
🚨 • Disclaimer ❗❗❗ When using this strategy: Titan Investments is totally Exempt from any claim of liability for losses. The responsibility on the management of your funds is solely yours. This is a very high risk/volatility market! Understand your place in the market.
3️⃣3️⃣ : ♻️ ® No Repaint
This Strategy does not Repaint! This is a real strategy!
3️⃣4️⃣ : 🔒 Copyright ©️
Copyright © 2022-2023 All rights reserved, ® Titan Investimentos
3️⃣5️⃣ : 👏 Acknowledgments
I want to start this message in thanks to TradingView and all the Pinescript community for all the 'magic' created here, a unique ecosystem! rich and healthy, a fertile soil, a 'new world' of possibilities, for a complete deepening and improvement of our best personal skills.
I leave here my immense thanks to the whole community: Tradingview, Pinecoders, Wizards and Moderators.
I was not born Rich .
Thanks to TradingView and pinescript and all its transformation.
I could develop myself and the best of me and the best of my skills.
And consequently build wealth and patrimony.
Gratitude.
One more story for the infinite book !
If you were born poor you were born to be rich !
Raising🔼 the level and raising🔼 the ruler! 📏
My work is my 'debauchery'! Do better! 💐🌹
Soul of a first-timer! Creativity Exudes! 🦄
This is the manifestation of God's magic in me. This is the best of me. 🧙
You will copy me, I know. So you owe me. 💋
My mission here is to raise the consciousness and self-esteem of all Titans and Titanids! Welcome! 🧘 🏛️
The only way to accomplish great work is to do what you love ! Before I learned to program I was wasting my life!
Death is the best creation of life .
Now you are the new , but in the not so distant future you will gradually become the old . Here I stay forever!
Playing the game like an Athlete! 🖼️ Enjoy and Enjoy 🍷 🗿
In honor of: BOB ☆
1 name, 3 letters, 3 possibilities, and if read backwards it's the same thing, a palindrome. ☘
Gratitude to the oracles that have enabled me the 'luck' to get this far: Dal&Ni&Fer
3️⃣6️⃣ : 👮 House Rules : 📺 TradingView
House Rules : This publication and strategy follows all TradingView house guidelines and rules:
📺 TradingView House Rules: www.tradingview.com
📺 Script publication rules: www.tradingview.com
📺 Vendor requirements: www.tradingview.com
📺 Links/References rules: www.tradingview.com
3️⃣7️⃣ : 🏛️ Become a Titan Pro member 👽
🟩 Titan Pro 👽 🟩
3️⃣8️⃣ : 🏛️ Be a member Titan Aff 🛸
🟥 Titan Affiliate 🛸 🟥

ProfitView Strategy TemplateHello traders,
This script took me a full week of coding/testing, sweat, and tears - and I’m too nice as I’m giving it for free to the community.
If you're tired of manual trading and looking for a solid strategy template to pair with your indicators, look no further.
This Pine Script v5 strategy template is engineered for maximum customization and risk management.
Best part?
This Pine Script v5 template facilitates the dynamic construction of ProfitView alerts, sparing users the time and effort of mastering the ProfitView syntax and manually creating alert commands.
This powerful tool gives much power to those who don't know how to code in Pinescript and want to automate their indicators' signals via the ProfitView Chrome extension.
IMPORTANT NOTES
ProfitView is a trading bot software that forwards TradingView alerts to your brokers (examples: Binance, Oanda, Coinbase, Bybit, etc.) for automating trading.
Many traders don't know how to dynamically create ProfitView-compatible alerts using the data from their TradingView scripts.
Traders using trading bots want their alerts to reflect the stop-loss/take-profit/trailing-stop/stop-loss to break options from your script and then create the orders accordingly.
This script showcases how to create ProfitView alerts dynamically.
TRADINGVIEW ALERTS
1) You'll have to create one alert per asset X timeframe = 1 chart.
Example: 1 alert for EUR/USD on the 5 minutes chart, 1 alert for EUR/USD on the 15-minute chart (assuming you want your bot to trade the EUR/USD on the 5 and 15-minute timeframes)
2) Select the Order fills and alert() function calls condition
3) For each alert, the alert message is pre-configured with the text below
{{strategy.order.alert_message}}
Please leave it as it is.
It's a TradingView native variable that will fetch the alert text messages built by the script.
4) ProfitView doesn't use webhook technology, so setting a webhook URL from the alerts notifications tab is unnecessary.
KEY FEATURES
I) Modular Indicator Connection
* plug your existing indicator into the template.
* Only two lines of code are needed for full compatibility.
Step 1: Create your connector
Adapt your indicator with only 2 lines of code and then connect it to this strategy template.
To do so:
1) Find in your indicator where the conditions print the long/buy and short/sell signals.
2) Create an additional plot as below
I'm giving an example with a Two moving averages cross.
Please replicate the same methodology for your indicator, whether a MACD , ZigZag, Pivots , higher-highs, lower-lows or whatever indicator with clear buy and sell conditions.
//@version=5
indicator("Supertrend", overlay = true, timeframe = "", timeframe_gaps = true)
atrPeriod = input.int(10, "ATR Length", minval = 1)
factor = input.float(3.0, "Factor", minval = 0.01, step = 0.01)
= ta.supertrend(factor, atrPeriod)
supertrend := barstate.isfirst ? na : supertrend
bodyMiddle = plot(barstate.isfirst ? na : (open + close) / 2, display = display.none)
upTrend = plot(direction < 0 ? supertrend : na, "Up Trend", color = color.green, style = plot.style_linebr)
downTrend = plot(direction < 0 ? na : supertrend, "Down Trend", color = color.red, style = plot.style_linebr)
fill(bodyMiddle, upTrend, color.new(color.green, 90), fillgaps = false)
fill(bodyMiddle, downTrend, color.new(color.red, 90), fillgaps = false)
buy = ta.crossunder(direction, 0)
sell = ta.crossunder(direction, 0)
//////// CONNECTOR SECTION ////////
Signal = buy ? 1 : sell ? -1 : 0
plot(Signal, title = "Signal", display = display.data_window)
//////// CONNECTOR SECTION ////////
Important Notes
🔥 The Strategy Template expects the value to be exactly 1 for the bullish signal and -1 for the bearish signal
Now, you can connect your indicator to the Strategy Template using the method below or that one.
Step 2: Connect the connector
1) Add your updated indicator to a TradingView chart
2) Add the Strategy Template as well to the SAME chart
3) Open the Strategy Template settings, and in the Data Source field, select your 🔌Connector🔌 (which comes from your indicator)
Note it doesn’t have to be named 🔌Connector🔌 - you can name it as you want - however, I recommend an explicit name you can easily remember.
From then, you should start seeing the signals and plenty of other stuff on your chart.
🔥 Note that whenever you update your indicator values, the strategy statistics and visuals on your chart will update in real-time
II) BOT Risk Management:
- Max Drawdown:
Mode: Select whether the max drawdown is calculated in percentage (%) or USD.
Value: If the max drawdown reaches this specified value, set a value to halt the bot.
- Max Consecutive Days:
Use Max Consecutive Days BOT Halt: Enable/Disable halting the bot if the max consecutive losing days value is reached.
- Max Consecutive Days: Set the maximum number of consecutive losing days allowed before halting the bot.
- Max Losing Streak:
Use Max Losing Streak: Enable/Disable a feature to prevent the bot from taking too many losses in a row.
- Max Losing Streak Length: Set the maximum length of a losing streak allowed.
Margin Call:
- Use Margin Call: Enable/Disable a feature to exit when a specified percentage away from a margin call to prevent it.
Margin Call (%): Set the percentage value to trigger this feature.
- Close BOT Total Loss:
Use Close BOT Total Loss: Enable/Disable a feature to close all trades and halt the bot if the total loss is reached.
- Total Loss ($): Set the total loss value in USD to trigger this feature.
Intraday BOT Risk Management:
- Intraday Losses:
Use Intraday Losses BOT Halt: Enable/Disable halting the bot on reaching specified intraday losses.
Mode: Select whether the intraday loss is calculated in percentage (%) or USD.
- Max Intraday Losses (%): Set the value for maximum intraday losses.
Limit Intraday Trades:
- Use Limit Intraday Trades: Enable/Disable a feature to limit the number of intraday trades.
- Max Intraday Trades: Set the maximum number of intraday trades allowed.
Restart Intraday EA:
- Use Restart Intraday EA: Enable/Disable a feature to restart the bot at the first bar of the next day if it has been stopped with an intraday risk management safeguard.
III) Order Types and Position Sizing
- Choose between market, limit, or stop orders.
- Set your position size directly in the template.
Please use the position size from the “Inputs” and not the “Properties” tab.
I know it's redundant. - the template needs this value from the "Inputs" tab to build the alerts, and the Backtester needs it from the "Properties" tab.
IV) Advanced Take-Profit and Stop-Loss Options
- Choose to set your SL/TP in either pips or percentages.
- Option for multiple take-profit levels and trailing stop losses.
- Move your stop loss to break even +/- offset in pips for “risk-free” trades.
V) Miscellaneous
Retry order openings if they fail.
Order Types:
Select and specify order type and price settings.
Position Size:
Define the type and size of positions.
Leverage:
Leverage settings, including margin type and hedge mode.
Session:
Limit trades to specific sessions.
Dates:
Limit trades to a specific date range.
Trades Direction:
Direction: Specify the market direction for opening positions.
VI) Notifications (Telegram/Discord/Email/IFTTT/Twilio/SMS)
Customize notifications sent to Telegram, Discord, Email, IFTTT, Twilio, and ProfitView Logger.
VII) Logger
The ProfitView commands are logged in the TradingView logger.
You'll find more information about it in this TradingView blog post .
WHY YOU MIGHT NEED THIS TEMPLATE
1) Transform your indicator into a ProfitView trading bot more easily than before
Connect your indicator to the template
Create your alerts
Set your EA settings
2) Save Time
Auto-generated alert messages for ProfitView.
I tested them all and checked with the support team what could/couldn’t be done.
3) Be in Control
Manage your trading risks with advanced features.
4) Customizable
Fits various trading styles and asset classes.
REQUIREMENTS
* Make sure you have your ProfitView account and do the settings correctly in your Chrome extension. If you don't know how to do it, read the documentation + ask for help in the ProfitView Discord support channel.
* If there is any issue with the template, ask me in the comments section - I’ll answer quickly.
BACKTEST RESULTS FROM THIS POST
1) I connected this strategy template to a dummy Supertrend script.
I could have selected any other indicator or concept for this script post.
I wanted to share an example of how you can quickly upgrade your strategy, making it compatible with ProfitView.
2) The backtest results aren't relevant for this educational script publication.
I used realistic backtesting data but didn't look too much into optimizing the results, as this isn't the point of why I'm publishing this script.
This strategy is a template to be connected to any indicator - the sky is the limit. :)
3) This template is made to take 1 trade per direction at any given time.
Pyramiding is set to 1 on TradingView.
The strategy default settings are:
* Initial Capital: 100000 USD
* Position Size: 1%
* Commission Percent: 0.075%
* Slippage: 1 tick
* No margin/leverage used
Best regards,
Dave

TradingView.To Strategy Template (with Dyanmic Alerts)Hello traders,
If you're tired of manual trading and looking for a solid strategy template to pair with your indicators, look no further.
This Pine Script v5 strategy template is engineered for maximum customization and risk management.
Best part?
This Pine Script v5 template facilitates the dynamic construction of TradingView.TO alerts, sparing users the time and effort of mastering the TradingView.TO syntax and manually create alert commands.
This powerful tool gives much power to those who don't know how to code in Pinescript and want to automate their indicators' signals via TradingView.TO bot.
IMPORTANT NOTES
TradingView.TO is a trading bot software that forwards TradingView alerts to your brokers (examples: Binance, Oanda, Coinbase, Bybit, Metatrader 4/5, ...) for automating trading.
Many traders don't know how to create TradingView.TO dynamically-compatible alerts using the data from their TradingView scripts.
Traders using trading bots want their alerts to reflect the stop-loss/take-profit/trailing-stop/stop-loss to break options from your script and then create the orders accordingly.
This script showcases how to create TradingView.TO alerts dynamically.
TRADINGVIEW ALERTS
1) You'll have to create one alert per asset X timeframe = 1 chart.
Example: 1 alert for BTC/USDT on the 5 minutes chart, 1 alert for BTC/USDT on the 15-minute chart (assuming you want your bot to trade the BTC/USDT on the 5 and 15-minute timeframes)
2) Select the Order fills and alert() function calls condition
3) For each alert, the alert message is pre-configured with the text below
{{strategy.order.alert_message}}
Please leave it as it is.
It's a TradingView native variable that will fetch the alert text messages built by the script.
4) TradingView.TO uses webhook technology - setting a webhook URL from the alerts notifications tab is required.
KEY FEATURES
I) Modular Indicator Connection
* plug your existing indicator into the template.
* Only two lines of code are needed for full compatibility.
Step 1: Create your connector
Adapt your indicator with only 2 lines of code and then connect it to this strategy template.
To do so:
1) Find in your indicator where the conditions print the long/buy and short/sell signals.
2) Create an additional plot as below
I'm giving an example with a Two moving averages cross.
Please replicate the same methodology for your indicator, whether a MACD , ZigZag, Pivots , higher-highs, lower-lows or whatever indicator with clear buy and sell conditions.
//@version=5
indicator("Supertrend", overlay = true, timeframe = "", timeframe_gaps = true)
atrPeriod = input.int(10, "ATR Length", minval = 1)
factor = input.float(3.0, "Factor", minval = 0.01, step = 0.01)
= ta.supertrend(factor, atrPeriod)
supertrend := barstate.isfirst ? na : supertrend
bodyMiddle = plot(barstate.isfirst ? na : (open + close) / 2, display = display.none)
upTrend = plot(direction < 0 ? supertrend : na, "Up Trend", color = color.green, style = plot.style_linebr)
downTrend = plot(direction < 0 ? na : supertrend, "Down Trend", color = color.red, style = plot.style_linebr)
fill(bodyMiddle, upTrend, color.new(color.green, 90), fillgaps = false)
fill(bodyMiddle, downTrend, color.new(color.red, 90), fillgaps = false)
buy = ta.crossunder(direction, 0)
sell = ta.crossunder(direction, 0)
//////// CONNECTOR SECTION ////////
Signal = buy ? 1 : sell ? -1 : 0
plot(Signal, title = "Signal", display = display.data_window)
//////// CONNECTOR SECTION ////////
Important Notes
🔥 The Strategy Template expects the value to be exactly 1 for the bullish signal and -1 for the bearish signal
Now, you can connect your indicator to the Strategy Template using the method below or that one.
Step 2: Connect the connector
1) Add your updated indicator to a TradingView chart
2) Add the Strategy Template as well to the SAME chart
3) Open the Strategy Template settings, and in the Data Source field, select your 🔌Connector🔌 (which comes from your indicator)
Note it doesn’t have to be named 🔌Connector🔌 - you can name it as you want - however, I recommend an explicit name you can easily remember.
From then, you should start seeing the signals and plenty of other stuff on your chart.
🔥 Note that whenever you update your indicator values, the strategy statistics and visuals on your chart will update in real-time
II) BOT Risk Management:
- Max Drawdown:
Mode: Select whether the max drawdown is calculated in percentage (%) or USD.
Value: If the max drawdown reaches this specified value, set a value to halt the bot.
- Max Consecutive Days:
Use Max Consecutive Days BOT Halt: Enable/Disable halting the bot if the max consecutive losing days value is reached.
- Max Consecutive Days: Set the maximum number of consecutive losing days allowed before halting the bot.
- Max Losing Streak:
Use Max Losing Streak: Enable/Disable a feature to prevent the bot from taking too many losses in a row.
- Max Losing Streak Length: Set the maximum length of a losing streak allowed.
Margin Call:
- Use Margin Call: Enable/Disable a feature to exit when a specified percentage away from a margin call to prevent it.
Margin Call (%): Set the percentage value to trigger this feature.
- Close BOT Total Loss:
Use Close BOT Total Loss: Enable/Disable a feature to close all trades and halt the bot if the total loss is reached.
- Total Loss ($): Set the total loss value in USD to trigger this feature.
Intraday BOT Risk Management:
- Intraday Losses:
Use Intraday Losses BOT Halt: Enable/Disable halting the bot on reaching specified intraday losses.
Mode: Select whether the intraday loss is calculated in percentage (%) or USD.
- Max Intraday Losses (%): Set the value for maximum intraday losses.
Limit Intraday Trades:
- Use Limit Intraday Trades: Enable/Disable a feature to limit the number of intraday trades.
- Max Intraday Trades: Set the maximum number of intraday trades allowed.
Restart Intraday EA:
III) Order Types and Position Sizing
- Choose between market or limit orders.
- Set your position size directly in the template.
Please use the position size from the “Inputs” and not the “Properties” tab.
I know it's redundant. - the template needs this value from the "Inputs" tab to build the alerts, and the Backtester needs it from the "Properties" tab.
IV) Advanced Take-Profit and Stop-Loss Options
- Choose to set your SL/TP in either USD or percentages.
- Option for multiple take-profit levels and trailing stop losses.
- Move your stop loss to break even +/- offset in USD for “risk-free” trades.
V) Miscellaneous:
Retry order openings if they fail.
Order Types:
Select and specify order type and price settings.
Position Size:
Define the type and size of positions.
Leverage:
Leverage settings, including margin type and hedge mode.
Session:
Limit trades to specific sessions.
Dates:
Limit trades to a specific date range.
Trades Direction:
Direction: Specify the market direction for opening positions.
VI) Logger
The TradingView.TO commands are logged in the TradingView logger.
You'll find more information about it in this TradingView blog post .
WHY YOU MIGHT NEED THIS TEMPLATE
1) Transform your indicator into a TradingView.TO trading bot more easily than before
Connect your indicator to the template
Create your alerts
Set your EA settings
2) Save Time
Auto-generated alert messages for TradingView.TO.
I tested them all and checked with the support team what could/couldn’t be done.
3) Be in Control
Manage your trading risks with advanced features.
4) Customizable
Fits various trading styles and asset classes.
REQUIREMENTS
* Make sure you have your TradingView.TO account
* If there is any issue with the template, ask me in the comments section - I’ll answer quickly.
BACKTEST RESULTS FROM THIS POST
1) I connected this strategy template to a dummy Supertrend script.
I could have selected any other indicator or concept for this script post.
I wanted to share an example of how you can quickly upgrade your strategy, making it compatible with TradingView.TO.
2) The backtest results aren't relevant for this educational script publication.
I used realistic backtesting data but didn't look too much into optimizing the results, as this isn't the point of why I'm publishing this script.
This strategy is a template to be connected to any indicator - the sky is the limit. :)
3) This template is made to take 1 trade per direction at any given time.
Pyramiding is set to 1 on TradingView.
The strategy default settings are:
* Initial Capital: 100000 USD
* Position Size: 1%
* Commission Percent: 0.075%
* Slippage: 1 tick
* No margin/leverage used

Quantum Reversal Engine [ApexLegion]Quantum Reversal Engine
STRATEGY OVERVIEW
This strategy is constructed using 5 custom analytical filters that analyze different market dimensions - trend structure, momentum expansion, volume confirmation, price action patterns, and reversal detection - with results processed through a multi-component scoring calculation that determines signal generation and position management decisions.
Why These Custom Filters Were Independently Developed:
This strategy employs five custom-developed analytical filters:
1. Apex Momentum Core (AMC) - Custom oscillator with volatility-scaled deviation calculation
Standard oscillators lag momentum shifts by 2-3 bars. Custom calculation designed for momentum analysis
2. Apex Wick Trap (AWT) - Wick dominance analysis for trap detection
Existing wick analysis tools don't quantify trap conditions. Uses specific ratios for wick dominance detection
3. Apex Volume Pulse (AVP) - Volume surge validation with participation confirmation
Volume indicators typically use simple averages. Uses surge multipliers with participation validation
4. Apex TrendGuard (ATG) - Angle-based trend detection with volatility band integration
EMA slope calculations often produce false signals. Uses angle analysis with volatility bands for confirmation
5. Quantum Composite Filter (QCF) - Multi-component scoring and signal generation system
Composite scoring designed to filter noise by requiring multiple confirmations before signal activation.
Each filter represents mathematical calculations designed to address specific analytical requirements.
Framework Operation: The strategy functions as a scoring framework where each filter contributes weighted points based on market conditions. Entry signals are generated when minimum threshold scores are met. Exit management operates through a three-tier system with continued signal strength evaluation determining position holds versus closures at each TP level.
Integration Challenge: The core difficulty was creating a scoring system where five independent filters could work together without generating conflicting signals. This required backtesting to determine effective weight distributions.
Custom Filter Development:
Each of the five filters represents analytical approaches developed through testing and validation:
Integration Validation: Each filter underwent individual testing before integration. The composite scoring system required validation to verify that filters complement rather than conflict with each other, resulting in a cohesive analytical framework that was tested during the development period.
These filters represent custom-developed components created specifically for this strategy, with each component addressing different analytical requirements through testing and parameter adjustment.
Programming Features:
Multi-timeframe data handling with backup systems
Performance optimization techniques
Error handling for live trading scenarios
Parameter adaptation based on market conditions
Strategy Features:
Uses multi-filter confirmation approach
Adapts position holding based on continued signal strength
Includes analysis tools for trade review and optimization
Ongoing Development: The strategy was developed through testing and validation processes during the creation period.
COMPONENT EXPLANATION
EMA System
Uses 8 exponential moving averages (7, 14, 21, 30, 50, 90, 120, 200 periods) for trend identification. Primary signals come from 8/21 EMA crossovers, while longer EMAs provide structural context. EMA 1-4 determine short-term structure, EMA 5-8 provide long-term trend confirmation.
Apex Momentum Core (AMC)
Built custom oscillator mathematics after testing dozens of momentum calculation methods. Final algorithm uses price deviation from EMA baseline with volatility scaling to reduce lag while maintaining accuracy across different market conditions.
Custom momentum oscillator using price deviation from EMA baseline:
apxCI = 100 * (source - emaBase) / (sensitivity * sqrt(deviation + 1))
fastLine = EMA(apxCI, smoothing)
signalLine = SMA(fastLine, 4)
Signals generate when fastLine crosses signalLine at +50/-50 thresholds.
This identifies momentum expansion before traditional oscillators.
Apex Volume Pulse (AVP)
Created volume surge analysis that goes beyond simple averages. Extensive testing determined 1.3x multiplier with participation validation provides reliable confirmation while filtering false volume spikes.
Compares current volume to 21-period moving average.
Requires 1.3x average volume for signal confirmation. This filters out low-volume moves during quiet periods and confirms breakouts with actual participation.
Apex Wick Trap (AWT)
Developed proprietary wick trap detection through analysis of failed breakout patterns. Tested various ratio combinations before settling on 60% wick dominance + 20% body limit as effective trap identification parameters.
Analyzes candle structure to identify failed breakouts:
candleRange = math.max(high - low, 0.00001)
candleBody = math.abs(close - open)
bodyRatio = candleBody / candleRange
upperWick = high - math.max(open, close)
lowerWick = math.min(open, close) - low
upperWickRatio = upperWick / candleRange
lowerWickRatio = lowerWick / candleRange
trapWickLong = showAWT and lowerWickRatio > minWickDom and bodyRatio < bodyToRangeLimit and close > open
trapWickShort = showAWT and upperWickRatio > minWickDom and bodyRatio < bodyToRangeLimit and close < open This catches reversals after fake breakouts.
Apex TrendGuard (ATG)
Built angle-based trend detection after standard EMA crossovers proved insufficient. Combined slope analysis with volatility bands through iterative testing to eliminate false trend signals.
EMA slope analysis with volatility bands:
Fast EMA (21) vs Slow EMA (55) for trend direction
Angle calculation: atan(fast - slow) * 180 / π
ATR bands (1.75x multiplier) for breakout confirmation
Minimum 25° angle for strong trend classification
Core Algorithm Framework
1. Composite Signal Generation
calculateCompositeSignals() =>
// Component Conditions
structSignalLong = trapWickLong
structSignalShort = trapWickShort
momentumLong = amcBuySignal
momentumShort = amcSellSignal
volumeSpike = volume > volAvg_AVP * volMult_AVP
priceStrength_Long = close > open and close > close
priceStrength_Short = close < open and close < close
rsiMfiComboValue = (ta.rsi(close, 14) + ta.mfi(close, 14)) / 2
reversalTrigger_Long = ta.crossover(rsiMfiComboValue, 50)
reversalTrigger_Short = ta.crossunder(rsiMfiComboValue, 50)
isEMACrossUp = ta.crossover(emaFast_ATG, emaSlow_ATG)
isEMACrossDown = ta.crossunder(emaFast_ATG, emaSlow_ATG)
// Enhanced Composite Score Calculation
scoreBuy = 0.0
scoreBuy += structSignalLong ? scoreStruct : 0.0
scoreBuy += momentumLong ? scoreMomentum : 0.0
scoreBuy += flashSignal ? weightFlash : 0.0
scoreBuy += blinkSignal ? weightBlink : 0.0
scoreBuy += volumeSpike_AVP ? scoreVolume : 0.0
scoreBuy += priceStrength_Long ? scorePriceAction : 0.0
scoreBuy += reversalTrigger_Long ? scoreReversal : 0.0
scoreBuy += emaAlignment_Bull ? weightTrendAlign : 0.0
scoreBuy += strongUpTrend ? weightTrendAlign : 0.0
scoreBuy += highRisk_Long ? -1.2 : 0.0
scoreBuy += signalGreenDot ? 1.0 : 0.0
scoreBuy += isAMCUp ? 0.8 : 0.0
scoreBuy += isVssBuy ? 1.5 : 0.0
scoreBuy += isEMACrossUp ? 1.0 : 0.0
scoreBuy += signalRedX ? -1.0 : 0.0
scoreSell = 0.0
scoreSell += structSignalShort ? scoreStruct : 0.0
scoreSell += momentumShort ? scoreMomentum : 0.0
scoreSell += flashSignal ? weightFlash : 0.0
scoreSell += blinkSignal ? weightBlink : 0.0
scoreSell += volumeSpike_AVP ? scoreVolume : 0.0
scoreSell += priceStrength_Short ? scorePriceAction : 0.0
scoreSell += reversalTrigger_Short ? scoreReversal : 0.0
scoreSell += emaAlignment_Bear ? weightTrendAlign : 0.0
scoreSell += strongDownTrend ? weightTrendAlign : 0.0
scoreSell += highRisk_Short ? -1.2 : 0.0
scoreSell += signalRedX ? 1.0 : 0.0
scoreSell += isAMCDown ? 0.8 : 0.0
scoreSell += isVssSell ? 1.5 : 0.0
scoreSell += isEMACrossDown ? 1.0 : 0.0
scoreSell += signalGreenDot ? -1.0 : 0.0
compositeBuySignal = enableComposite and scoreBuy >= thresholdCompositeBuy
compositeSellSignal = enableComposite and scoreSell >= thresholdCompositeSell
if compositeBuySignal and compositeSellSignal
compositeBuySignal := false
compositeSellSignal := false
= calculateCompositeSignals()
// Final Entry Signals
entryCompositeBuySignal = compositeBuySignal and ta.rising(emaFast_ATG, 2)
entryCompositeSellSignal = compositeSellSignal and ta.falling(emaFast_ATG, 2)
Calculates weighted scores from independent modules and activates signals only when threshold requirements are met.
2. Smart Exit Hold Evaluation System
evaluateSmartHold() =>
compositeBuyRecentCount = 0
compositeSellRecentCount = 0
for i = 0 to signalLookbackBars - 1
compositeBuyRecentCount += compositeBuySignal ? 1 : 0
compositeSellRecentCount += compositeSellSignal ? 1 : 0
avgVolume = ta.sma(volume, 20)
volumeSpike = volume > avgVolume * volMultiplier
// MTF Bull/Bear conditions
mtf_bull = mtf_emaFast_final > mtf_emaSlow_final
mtf_bear = mtf_emaFast_final < mtf_emaSlow_final
emaBackupDivergence = math.abs(mtf_emaFast_backup - mtf_emaSlow_backup) / mtf_emaSlow_backup
emaBackupStrong = emaBackupDivergence > 0.008
mtfConflict_Long = inLong and mtf_bear and emaBackupStrong
mtfConflict_Short = inShort and mtf_bull and emaBackupStrong
// Layer 1: ATR-Based Dynamic Threshold (Market Volatility Intelligence)
atr_raw = ta.atr(atrLen)
atrValue = na(atr_raw) ? close * 0.02 : atr_raw
atrRatio = atrValue / close
dynamicThreshold = atrRatio > 0.02 ? 1.0 : (atrRatio > 0.01 ? 1.5 : 2.8)
// Layer 2: ROI-Conditional Time Intelligence (Selective Pressure)
timeMultiplier_Long = realROI >= 0 ? 1.0 : // Profitable positions: No time pressure
holdTimer_Long <= signalLookbackBars ? 1.0 : // Loss positions 1-8 bars: Base
holdTimer_Long <= signalLookbackBars * 2 ? 1.1 : // Loss positions 9-16 bars: +10% stricter
1.3 // Loss positions 17+ bars: +30% stricter
timeMultiplier_Short = realROI >= 0 ? 1.0 : // Profitable positions: No time pressure
holdTimer_Short <= signalLookbackBars ? 1.0 : // Loss positions 1-8 bars: Base
holdTimer_Short <= signalLookbackBars * 2 ? 1.1 : // Loss positions 9-16 bars: +10% stricter
1.3 // Loss positions 17+ bars: +30% stricter
// Dual-Layer Threshold Calculation
baseThreshold_Long = mtfConflict_Long ? dynamicThreshold + 1.0 : dynamicThreshold
baseThreshold_Short = mtfConflict_Short ? dynamicThreshold + 1.0 : dynamicThreshold
timeAdjustedThreshold_Long = baseThreshold_Long * timeMultiplier_Long
timeAdjustedThreshold_Short = baseThreshold_Short * timeMultiplier_Short
// Final Smart Hold Decision with Dual-Layer Intelligence
smartHold_Long = not mtfConflict_Long and smartScoreLong >= timeAdjustedThreshold_Long and compositeBuyRecentCount >= signalMinCount
smartHold_Short = not mtfConflict_Short and smartScoreShort >= timeAdjustedThreshold_Short and compositeSellRecentCount >= signalMinCount
= evaluateSmartHold()
Evaluates whether to hold positions past TP1/TP2/TP3 levels based on continued signal strength, volume confirmation, and multi-timeframe trend alignment
HOW TO USE THE STRATEGY
Step 1: Initial Setup
Apply strategy to your preferred timeframe (backtested on 15M)
Enable "Use Heikin-Ashi Base" for smoother signals in volatile markets
"Show EMA Lines" and "Show Ichimoku Cloud" are enabled for visual context
Set default quantities to match your risk management (5% equity default)
Step 2: Signal Recognition
Visual Signal Guide:
Visual Signal Guide - Complete Reference:
🔶 Red Diamond: Bearish momentum breakdown - short reversal signal
🔷 Blue Diamond: Strong bullish momentum - long reversal signal
🔵 Blue Dot: Volume-confirmed directional move - trend continuation
🟢 Green Dot: Bullish EMA crossover - trend reversal confirmation
🟠 Orange X: Oversold reversal setup - counter-trend opportunity
❌ Red X: Bearish EMA breakdown - trend reversal warning
✡ Star Uprising: Strong bullish convergence
💥 Ultra Entry: Ultra-rapid downward momentum acceleration
▲ VSS Long: Velocity-based bullish momentum confirmation
▼ VSS Short: Velocity-based bearish momentum confirmation
Step 3: Entry Execution
For Long Positions:
1. ✅ EMA1 crossed above EMA2 exactly 3 bars ago [ta.crossover(ema1,ema2) ]
2. ✅ Current EMA structure: EMA1 > EMA2 (maintained)
3. ✅ Composite score ≥ 5.0 points (6.5+ for 5-minute timeframes)
4. ✅ Cooldown period completed (no recent stop losses)
5. ✅ Volume spike confirmation (green dot/blue dot signals)
6. ✅ Bullish candle closes above EMA structure
For Short Positions:
1. ✅ EMA1 crossed below EMA2 exactly 3 bars ago [ta.crossunder(ema1,ema2) ]
2. ✅ Current EMA structure: EMA1 < EMA2 (maintained)
3. ✅ Composite score ≥ 5.4 points (7.0+ for 5-minute timeframes)
4. ✅ Cooldown period completed (no recent stop losses)
5. ✅ Momentum breakdown (red diamond/red X signals)
6. ✅ Bearish candle closes below EMA structure
🎯 Critical Timing Note: The strategy requires EMA crossover to have occurred 3 bars prior to entry, not at the current bar. This attempts to avoid premature entries and may improve signal reliability.
Step 4: Reading Market Context
EMA Ribbon Interpretation:
All EMAs ascending = Strong uptrend context
EMAs 1-3 above EMAs 4-8 = Bullish structure
Tight EMA spacing = Low volatility/consolidation
Wide EMA spacing = High volatility/trending
Ichimoku Cloud Context:
Price above cloud = Bullish environment
Price below cloud = Bearish environment
Cloud color intensity = Momentum strength
Thick cloud = Strong support/resistance
THE SMART EXIT GRID SYSTEM
Smart Exit Grid Approach:
The Smart Exit Grid uses dynamic hold evaluation that continuously analyzes market conditions after position entry. This differs from traditional fixed profit targets by adapting exit timing based on real-time signal strength.
How Smart Exit Grid System Works
The system operates through three evaluation phases:
Smart Score Calculation:
The smart score calculation aggregates 22 signal components in real-time, combining reversal warnings, continuation signals, trend alignment indicators, EMA structural analysis, and risk penalties into a numerical representation of market conditions. MTF analysis provides additional confirmation as a separate validation layer.
Signal Stack Management:
The per-tick signal accumulation system monitors 22 active signal types with MTF providing trend validation and conflict detection as a separate confirmation layer.
Take Profit Progression:
Smart Exit Activation:
The QRE system activates Smart Exit Grid immediately upon position entry. When strategy.entry() executes, the system initializes monitoring systems designed to track position progress.
Upon position opening, holdTimer begins counting, establishing the foundation for subsequent decisions. The Smart Exit Grid starts accumulating signals from entry, with all 22 signal components beginning real-time tracking when the trade opens.
The system operates on continuous evaluation where smartScoreLong and smartScoreShort calculate from the first tick after entry. QRE's approach is designed to capture market structure changes, trend deteriorations, or signal pattern shifts that can trigger protective exits even before the first take profit level is reached.
This activation creates a proactive position management framework. The 8-candle sliding window starts from entry, meaning that if market conditions change rapidly after entry - due to news events, liquidity shifts, or technical changes - the system can respond within the configured lookback period.
TP Markers as Reference Points:
The TP1, TP2, and TP3 levels function as reference points rather than mandatory exit triggers. When longTP1Hit or shortTP1Hit conditions activate, they serve as profit confirmation markers that inform the Smart Exit algorithm about achieved reward levels, but don't automatically initiate position closure.
These TP markers enhance the Smart Exit decision matrix by providing profit context to ongoing signal evaluation. The system recognizes when positions have achieved target returns, but the actual exit decision remains governed by continuous smart score evaluation and signal stack analysis.
TP2 Reached: Enhanced Monitoring
TP2 represents significant profit capture with additional monitoring features:
This approach is designed to help avoid premature profit-taking during trending conditions. If TP2 is reached but smartScoreLong remains above the dynamic threshold and the 8-candle sliding window shows persistent signals, the position continues holding. If market structure deteriorates before reaching TP2, the Smart Exit can trigger closure based on signal analysis.
The visual TP circles that appear when levels are reached serve as performance tracking tools, allowing users to see how frequently entries achieve various profit levels while understanding that actual exit timing depends on market structure analysis.
Risk Management Systems:
Operating independently from the Smart Exit Grid are two risk management systems: the Trap Wick Detection Protocol and the Stop Loss Mechanism. These systems maintain override authority over other exit logic.
The Trap Wick System monitors for conditionBearTrapExit during long positions and conditionBullTrapExit during short positions. When detected, these conditions trigger position closure with state reset, bypassing Smart Exit evaluations. This system recognizes that certain candlestick patterns may indicate reversal risk.
Volatility Exit Monitoring: The strategy monitors for isStrongBearCandle combined with conditionBearTrapExit, recognizing when market structure may be shifting.
Volume Validation: Before exiting on volatility, the strategy requires volume confirmation: volume > ta.sma(volume, 20) * 1.8. This is designed to filter exits on weak, low-volume movements.
The Stop Loss Mechanism operates through multiple triggers including traditional price-based stops (longSLHit, shortSLHit) and early exit conditions based on smart score deterioration combined with negative ROI. The early exit logic activates when smartScoreLong < 1.0 or smartScoreShort < 1.0 while realROI < -0.9%.
These risk management systems are designed so that risk scenarios can trigger protective closure with state reset across all 22 signal counters, TP tracking variables, and smart exit states.
This architecture - Smart Exit activation, TP markers as navigation tools, and independent risk management - creates a position management system that adapts to market conditions while maintaining risk discipline through dedicated protection protocols.
TP3 Reached: Enhanced Protection
Once TP3 is hit, the strategy shifts into enhanced monitoring:
EMA Structure Monitoring: isEMAStructureDown becomes a primary exit trigger
MTF Alignment: The higher timeframe receives increased consideration
Wick Trap Priority: conditionBearTrapExit becomes an immediate exit signal
Approach Differences:
Traditional Fixed Exits:
Exit at predetermined levels regardless of market conditions
May exit during trend continuation
May exit before trend completion
Limited adaptation to changing volatility
Smart Exit Grid Approach:
Adaptive timing based on signal conditions
Exits when supporting signals weaken
Multi-timeframe validation for trend confirmation
Volume confirmation requirements for holds
Structural monitoring for trend analysis
Dynamic ATR-Based Smart Score Threshold System
Market Volatility Adaptive Scoring
// Real-time ATR Analysis
atr_raw = ta.atr(atrLen)
atrValue = na(atr_raw) ? close * 0.02 : atr_raw
atrRatio = atrValue / close
// Three-Tier Dynamic Threshold Matrix
dynamicThreshold = atrRatio > 0.02 ? 1.0 : // High volatility: Lower threshold
(atrRatio > 0.01 ? 1.5 : // Medium volatility: Standard
2.8) // Low volatility: Higher threshold
The market volatility adaptive scoring calculates real-time ATR with a 2% fallback for new markets. The atrRatio represents the relationship between current volatility and price, creating a foundation for threshold adjustment.
The three-tier dynamic threshold matrix responds to market conditions by adjusting requirements based on volatility levels: lowering thresholds during high volatility periods above 2% ATR ratio to 1.0 points, maintaining standard requirements at 1.5 points for medium volatility between 1-2%, and raising standards to 2.8 points during low volatility periods below 1%.
Profit-Loss Adaptive Management:
The system applies different evaluation criteria based on position performance:
Winning Positions (realROI ≥ 0%):
→ timeMultiplier = 1.0 (No additional pressure)
→ Maintains base threshold requirements
→ Allows natural progression to TP2/TP3 levels
Losing Positions (realROI < 0%):
→ Progressive time pressure activated
→ Increasingly strict requirements over time
→ Faster decision-making on underperforming trades
ROI-Adaptive Smart Hold Decision Process:
The strategy uses a profit-loss adaptive system:
Winning Position Management (ROI ≥ 0%):
✅ Standard threshold requirements maintained
✅ No additional time-based pressure applied
✅ Allows positions to progress toward TP2/TP3 levels
✅ timeMultiplier remains at 1.0 regardless of hold duration
Losing Position Management (ROI < 0%):
⚠️ Time-based threshold adjustments activated
⚠️ Progressive increase in required signal strength over time
⚠️ Earlier exit evaluation on underperforming positions
⚠️ timeMultiplier increases from 1.0 → 1.1 → 1.3 based on hold duration
Real-Time Monitoring:
Monitor Analysis Table → "Smart" filter → "Score" vs "Dynamic Threshold"
Winning positions: Evaluation based on signal strength deterioration only
Losing positions: Evaluation considers both signal strength and progressive time adjustments
Breakeven positions (0% ROI): Treated as winning positions - no time adjustments
This approach differentiates between winning and losing positions in the hold evaluation process, requiring higher signal thresholds for extended holding of losing positions while maintaining standard requirements for winning ones.
ROI-Conditional Decision Matrix Examples:
Scenario 1 - Winning Position in Any Market:
Position ROI: +0.8% → timeMultiplier = 1.0 (regardless of hold time)
ATR Medium (1.2%) → dynamicThreshold = 1.5
Final Threshold = 1.5 × 1.0 = 1.5 points ✅ Position continues
Scenario 2 - Losing Position, Extended Hold:
Position ROI: -0.5% → Time pressure activated
Hold Time: 20 bars → timeMultiplier = 1.3
ATR Low (0.8%) → dynamicThreshold = 2.8
Final Threshold = 2.8 × 1.3 = 3.64 points ⚡ Enhanced requirements
Scenario 3 - Fresh Losing Position:
Position ROI: -0.3% → Time pressure activated
Hold Time: 5 bars → timeMultiplier = 1.0 (still early)
ATR High (2.1%) → dynamicThreshold = 1.0
Final Threshold = 1.0 × 1.0 = 1.0 points 📊 Recovery opportunity
Scenario 4 - Breakeven Position:
Position ROI: 0.0% → timeMultiplier = 1.0 (no pressure)
Hold Time: 15 bars → No time penalty applied
Final Threshold = dynamicThreshold only ⚖️ Neutral treatment
🔄8-Candle Sliding Window Signal Rotation System
Composite Signal Counting Mechanism
// Dynamic Lookback Window (configurable: default 8)
signalLookbackBars = input.int(8, "Composite Lookback Bars", minval=1, maxval=50)
// Rolling Signal Analysis
compositeBuyRecentCount = 0
compositeSellRecentCount = 0
for i = 0 to signalLookbackBars - 1
compositeBuyRecentCount += compositeBuySignal ? 1 : 0
compositeSellRecentCount += compositeSellSignal ? 1 : 0
Candle Flow Example (8-bar window):
→
✓ ✓ ✗ ✓ ✗ ✓ ✗ ✓ 🗑️
New Signal Count = 5/8 signals in window
Threshold Check: 5 ≥ signalMinCount (2) = HOLD CONFIRMED
Signal Decay & Refresh Mechanism
// Signal Persistence Tracking
if compositeBuyRecentCount >= signalMinCount
smartHold_Long = true
else
smartHold_Long = false
The composite signal counting operates through a configurable sliding window. The system maintains rolling counters that scan backward through the specified number of candles.
During each evaluation cycle, the algorithm iterates through historical bars, incrementing counters when composite signals are detected. This creates a dynamic signal persistence measurement where recent signal density determines holding decisions.
The sliding window rotation functions like a moving conveyor belt where new signals enter while the oldest signals drop off. For example, in an 8-bar window, if 5 out of 8 recent candles showed composite buy signals, and the minimum required count is 2, the system confirms the hold condition. As new bars form, the window slides forward, potentially changing the signal count and triggering exit conditions when signal density falls below the threshold.
Signal decay and refresh occur continuously where smartHold_Long remains true only when compositeBuyRecentCount exceeds signalMinCount. When recent signal density drops below the minimum requirement, the system switches to exit mode.
Advanced Signal Stack Management - 22-Signal Real-Time Evaluation
// Long Position Signal Stacking (calc_on_every_tick=true)
if inLong
// Primary Reversal Signals
if signalRedDiamond: signalCountRedDiamond += 1 // -0.5 points
if signalStarUprising: signalCountStarUprising += 1 // +1.5 points
if entryUltraShort: signalCountUltra += 1 // -1.0 points
// Trend Confirmation Signals
if strongUpTrend: trendUpCount_Long += 1 // +1.5 points
if emaAlignment_Bull: bullAlignCount_Long += 1 // +1.0 points
// Risk Assessment Signals
if highRisk_Long: riskCount_Long += 1 // -1.5 points
if topZone: tzoneCount_Long += 1 // -0.5 points
The per-tick signal accumulation system operates with calc_on_every_tick=true for real-time responsiveness. During long positions, the system monitors primary reversal signals where Red Diamond signals subtract 0.5 points as reversal warnings, Star Uprising adds 1.5 points for continuation signals, and Ultra Short signals deduct 1.0 points as counter-trend warnings.
Trend confirmation signals provide weighted scoring where strongUpTrend adds 1.5 points for aligned momentum, emaAlignment_Bull contributes 1.0 point for structural support, and various EMA-based confirmations contribute to the overall score. Risk assessment signals apply negative weighting where highRisk_Long situations subtract 1.5 points, topZone conditions deduct 0.5 points, and other risk factors create defensive scoring adjustments.
The smart score calculation aggregates all 22 components in real-time, combining reversal warnings, continuation signals, trend alignment indicators, EMA structural analysis, and risk penalties into a numerical representation of market conditions. This score updates continuously, providing the foundation for hold-or-exit decisions.
MULTI-TIMEFRAME (MTF) SYSTEM
MTF Data Collection
The strategy requests higher timeframe data (default 30-minute) for trend confirmation:
= request.security(syminfo.tickerid, mtfTimeframe, , lookahead=barmerge.lookahead_off, gaps=barmerge.gaps_off)
MTF Watchtower System - Implementation Logic
The system employs a timeframe discrimination protocol where currentTFInMinutes is compared against a 30-minute threshold. This creates different operational behavior between timeframes:
📊 Timeframe Testing Results:
30M+ charts: Full MTF confirmation → Tested with full features
15M charts: Local EMA + adjusted parameters → Standard testing baseline
5M charts: Local EMA only → Requires parameter adjustment
1M charts: High noise → Limited testing conducted
When the chart timeframe is 30 minutes or above, the strategy activates useMTF = true and requests external MTF data through request.security(). For timeframes below 30 minutes, including your 5-minute setup, the system deliberately uses local EMA calculations to avoid MTF lag and data inconsistencies.
The triple-layer data sourcing architecture works as follows: timeframes from 1 minute to 29 minutes rely on chart-based EMA calculations for immediate responsiveness. Timeframes of 30 minutes and above utilize MTF data through the security function, with a backup system that doubles the EMA length (emaLen * 2) if MTF data fails. When MTF data is unavailable or invalid, the system falls back to local EMA as the final safety net.
Data validation occurs through a pipeline where mtf_dataValid checks not only for non-null values but also verifies that EMA values are positive above zero. The system tracks data sources through mtf_dataSource which displays "MTF Data" for successful external requests, "Backup EMA" for failed MTF with backup system active, or "Chart EMA" for local calculations.
🔄 MTF Smart Score Caching & Recheck System
// Cache Update Decision Logic
mtfSmartIntervalSec = input.int(300, "Smart Grid Recheck Interval (sec)") // 5-minute cache
canRecheckSmartScore = na(timenow) ? false :
(na(lastCheckTime) or (timenow - lastCheckTime) > mtfSmartIntervalSec * 1000)
// Cache Management
if canRecheckSmartScore
lastCheckTime := timenow
cachedSmartScoreLong := smartScoreLong // Store current calculation
cachedSmartScoreShort := smartScoreShort
The performance-optimized caching system addresses the computational intensity of continuous MTF analysis through intelligent interval management. The mtfSmartIntervalSec parameter, defaulting to 300 seconds (5 minutes), determines cache refresh frequency. The system evaluates canRecheckSmartScore by comparing current time against lastCheckTime plus the configured interval.
When cache updates trigger, the system stores current calculations in cachedSmartScoreLong and cachedSmartScoreShort, creating stable reference points that reduce excessive MTF requests. This cache management balances computational efficiency with analytical accuracy.
The cache versus real-time hybrid system creates a multi-layered decision matrix where immediate signals update every tick for responsive market reaction, cached MTF scores refresh every 5 minutes for stability filtering, dynamic thresholds recalculate every bar for volatility adaptation, and sliding window analysis updates every bar for trend persistence validation.
This architecture balances real-time signal detection with multi-timeframe strategic validation, creating adaptive trading intelligence that responds immediately to market changes while maintaining strategic stability through cached analysis and volatility-adjusted decision thresholds.
⚡The Execution Section Deep Dive
The execution section represents the culmination of all previous systems – where analysis transforms into action.
🚪 Entry Execution: The Gateway Protocol
Primary Entry Validation:
Entry isn't just about seeing a signal – it's about passing through multiple security checkpoints, each designed to filter out low-quality opportunities.
Stage 1: Signal Confirmation
entryCompositeBuySignal must be TRUE for longs
entryCompositeSellSignal must be TRUE for shorts
Stage 2: Enhanced Entry Validation
The strategy employs an "OR" logic system that recognizes different types of market opportunities:
Path A - Trend Reversal Entry:
When emaTrendReversal_Long triggers, it indicates the market structure is shifting in favor of the trade direction. This isn't just about a single EMA crossing – it represents a change in market momentum that experienced traders recognize as potential high-probability setups.
Path B - Momentum Breakout Entry:
The strongBullMomentum condition is where QRE identifies accelerating market conditions:
Criteria:
EMA1 rising for 3+ candles AND
EMA2 rising for 2+ candles AND
Close > 10-period high
This combination captures those explosive moves where the market doesn't just trend – it accelerates, creating momentum-driven opportunities.
Path C - Recovery Entry:
When previous exit states are clean (no recent stop losses), the strategy permits entry based purely on signal strength. This pathway is designed to help avoid the strategy becoming overly cautious after successful trades.
🛡️ The Priority Exit Matrix: When Rules Collide
Not all exit signals are created equal. QRE uses a strict hierarchy that is designed to avoid conflicting signals from causing hesitation:
Priority Level 1 - Exception Exits (Immediate Action):
Condition: TP3 reached AND Wick Trap detected
Action: Immediate exit regardless of other signals
Rationale: Historical analysis suggests wick traps at TP3 may indicate potential reversals
Priority Level 2 - Structural Breakdown:
Condition: TP3 active AND EMA structure deteriorating AND Smart Score insufficient
Logic: isEMAStructureDown AND NOT smartHold_Long
This represents the strategy recognizing that the underlying market structure that justified the trade is failing. It's like a building inspector identifying structural issues – you don't wait for additional confirmation.
Priority Level 3 - Enhanced Volatility Exits:
Conditions: TP2 active AND Strong counter-candle AND Wick trap AND Volume spike
Logic: Multiple confirmation required to reduce false exits
Priority Level 4 - Standard Smart Score Exits:
Condition: Any TP level active AND smartHold evaluates to FALSE
This is the bread-and-butter exit logic where signal deterioration triggers exit
⚖️ Stop Loss Management: Risk Control Protocol
Dual Stop Loss System:
QRE provides two stop loss modes that users can select based on their preference:
Fixed Mode (Default - useAdaptiveSL = false):
Uses predetermined percentage levels regardless of market volatility:
- Long SL = entryPrice × (1 - fixedRiskP - slipBuffer)
- Short SL = entryPrice × (1 + fixedRiskP + slipBuffer)
- Default: 0.6% risk + 0.3% slippage buffer = 0.9% total stop
- Consistent and predictable stop loss levels
- Recommended for users who prefer stable risk parameters
Adaptive Mode (Optional - useAdaptiveSL = true):
Dynamic system that adjusts stop loss based on market volatility:
- Base Calculation uses ATR (Average True Range)
- Long SL = entryPrice × (1 - (ATR × atrMultSL) / entryPrice - slipBuffer)
- Short SL = entryPrice × (1 + (ATR × atrMultSL) / entryPrice + slipBuffer)
- Automatically widens stops during high volatility periods
- Tightens stops during low volatility periods
- Advanced users can enable for volatility-adaptive risk management
Trend Multiplier Enhancement (Both Modes):
When strongUpTrend is detected for long positions, the stop loss receives 1.5x breathing room. Strong trends often have deeper retracements before continuing. This is designed to help avoid the strategy being shaken out of active trades by normal market noise.
Mode Selection Guidance:
- New Users: Start with Fixed Mode for predictable risk levels
- Experienced Users: Consider Adaptive Mode for volatility-responsive stops
- Volatile Markets: Adaptive Mode may provide better stop placement
- Stable Markets: Fixed Mode often sufficient for consistent risk management
Early Exit Conditions:
Beyond traditional stop losses, QRE implements "smart stops" that trigger before price-based stops:
Early Long Exit: (smartScoreLong < 1.0 OR prev5BearCandles) AND realROI < -0.9%
🔄 State Management: The Memory System
Complete State Reset Protocol:
When a position closes, QRE doesn't just wipe the slate clean – it performs a methodical reset:
TP State Cleanup:
All Boolean flags: tp1/tp2/tp3HitBefore → FALSE
All Reached flags: tp1/tp2/tp3Reached → FALSE
All Active flags: tp1/tp2/tp3HoldActive → FALSE
Signal Counter Reset:
Every one of the 22 signal counters returns to zero.
This is designed to avoid signal "ghosting" where old signals influence new trades.
Memory Preservation:
While operational states reset, certain information is preserved for learning:
killReasonLong/Short: Why did this trade end?
lastExitWasTP1/TP2/TP3: What was the exit quality?
reEntryCount: How many consecutive re-entries have occurred?
🔄 Re-Entry Logic: The Comeback System
Re-Entry Conditions Matrix:
QRE implements a re-entry system that recognizes not all exits are created equal:
TP-Based Re-Entry (Enabled):
Criteria: Previous exit was TP1, TP2, or TP3
Cooldown: Minimal or bypassed entirely
Logic: Target-based exits indicate potentially viable market conditions
EMA-Based Re-Entry (Conditional):
Criteria: Previous exit was EMA-based (structural change)
Requirements: Must wait for EMA confirmation in new direction
Minimum Wait: 5 candles
Advanced Re-Entry Features:
When adjustReEntryTargets is enabled, the strategy becomes more aggressive with re-entries:
Target Adjustment: TP1 multiplied by reEntryTP1Mult (default 2.0)
Stop Adjustment: SL multiplied by reEntrySLMult (default 1.5)
Logic: If we're confident enough to re-enter, we should be confident enough to hold for bigger moves
Performance Tracking: Strategy tracks re-entry win rate, average ROI, and total performance separately from initial entries for optimization analysis.
📊 Exit Reason Analytics: Learning from Every Trade
Kill Reason Tracking:
Every exit is categorized and stored:
"TP3 Exit–Wick Trap": Exit at target level with wick pattern detection
"Smart Exit–EMA Down": Structural breakdown exit
"Smart Exit–Volatility": Volatility-based protection exit
"Exit Post-TP1/TP2/TP3": Standard smart exit progression
"Long SL Exit" / "Short SL Exit": Stop loss exits
Performance Differentiation:
The strategy tracks performance by exit type, allowing for continuous analysis:
TP-based exits: Achieved target levels, analyze for pattern improvement
EMA-based exits: Mixed results, analyze for pattern improvement
SL-based exits: Learning opportunities, adjust entry criteria
Volatility exits: Protective measures, monitor performance
🎛️ Trailing Stop Implementation:
Conditional Trailing Activation:
Activation Criteria: Position profitable beyond trailingStartPct AND
(TP hold active OR re-entry trade)
Dynamic Trailing Logic:
Unlike simple trailing stops, QRE's implementation considers market context:
Trending Markets: Wider trail offsets to avoid whipsaws
Volatile Markets: Tighter offsets to protect gains
Re-Entry Trades: Enhanced trailing to maximize second-chance opportunities
Return-to-Entry Protection:
When deactivateOnReturn is enabled, the strategy will close positions that return to entry level after being profitable. This is designed to help avoid the frustration of watching profitable trades turn into losers.
🧠 How It All Works Together
The beauty of QRE lies not in any single component, but in how everything integrates:
The Entry Decision: Multiple pathways are designed to help identify opportunities while maintaining filtering standards.
The Progression System: Each TP level unlocks new protection features, like achieving ranks in a video game.
The Exit Matrix: Prioritized decision-making aims to reduce analysis paralysis while providing appropriate responses to different market conditions.
The Memory System: Learning from each trade while preventing contamination between separate opportunities.
The Re-Entry Logic: Re-entry system that balances opportunity with risk management.
This creates a trading system where entry conditions filter for quality, progression systems adapt to changing market conditions, exit priorities handle conflicting signals intelligently, memory systems learn from each trade cycle, and re-entry logic maximizes opportunities while managing risk exposure.
📊 ANALYSIS TABLE INTERPRETATION -
⚙️ Enabling Analysis Mode
Navigate to strategy settings → "Testing & Analysis" → Enable "Show Analysis Table". The Analysis Table displays different information based on the selected test filter and provides real-time insight into all strategy components, helping users understand current market conditions, position status, and system decision-making processes.
📋 Filter Mode Interpretations
"All" Mode (Default View):
Composite Section:
Buy Score: Aggregated strength from all 22 bullish signals (threshold 5.0+ triggers entry consideration)
Sell Score: Aggregated strength from all 22 bearish signals (threshold 5.4+ triggers entry consideration)
APEX Filters:
ATG Trend: Shows current trend direction analysis
Indicates whether momentum filters are aligned for directional bias
ReEntry Section:
Most Recent Exit: Displays exit type and timeframe since last position closure
Status: Shows if ReEntry system is Ready/Waiting/Disabled
Count: Current re-entry attempts versus maximum allowed attempts
Position Section (When Active):
Status: Current position state (LONG/SHORT/FLAT)
ROI: Dual calculation showing Custom vs Real ROI percentages
Entry Price: Original position entry level
Current Price: Live market price for comparison
TP Tracking: Progress toward profit targets
"Smart" Filter (Critical for Active Positions):
Smart Exit Section:
Hold Timer: Time elapsed since position opened (bar-based counting)
Status: Whether Smart Exit Grid is Enabled/Disabled
Score: Current smart score calculation from 22-component matrix
Dynamic Threshold: ATR-based minimum score required for holding
Final Threshold: Time and ROI-adjusted threshold actually used for decisions
Score Check: Pass/Fail based on Score vs Final Threshold comparison
Smart Hold: Current hold decision status
Final Hold: Final recommendation based on all factors
🎯 Advanced Smart Exit Debugging - ROI & Time-Based Threshold System
Understanding the Multi-Layer Threshold System:
Layer 1: Dynamic Threshold (ATR-Based)
atrRatio = ATR / close
dynamicThreshold = atrRatio > 0.02 ? 1.0 : // High volatility: Lower threshold
(atrRatio > 0.01 ? 1.5 : // Medium volatility: Standard
2.8) // Low volatility: Higher threshold
Layer 2: Time Multiplier (ROI & Duration-Based)
Winning Positions (ROI ≥ 0%):
→ timeMultiplier = 1.0 (No time pressure, regardless of hold duration)
Losing Positions (ROI < 0%):
→ holdTimer ≤ 8 bars: timeMultiplier = 1.0 (Early stage, standard requirements)
→ holdTimer 9-16 bars: timeMultiplier = 1.1 (10% stricter requirements)
→ holdTimer 17+ bars: timeMultiplier = 1.3 (30% stricter requirements)
Layer 3: Final Threshold Calculation
finalThreshold = dynamicThreshold × timeMultiplier
Examples:
- Winning Position: 2.8 × 1.0 = 2.8 (Always standard)
- Losing Position (Early): 2.8 × 1.0 = 2.8 (Same as winning initially)
- Losing Position (Extended): 2.8 × 1.3 = 3.64 (Much stricter)
Real-Time Debugging Display:
Smart Exit Section shows:
Score: 3.5 → Current smartScoreLong/Short value
Dynamic Threshold: 2.8 → Base ATR-calculated threshold
Final Threshold: 3.64 (ATR×1.3) → Actual threshold used for decisions
Score Check: FAIL (3.5 vs 3.64) → Pass/Fail based on final comparison
Final Hold: NO HOLD → Actual system decision
Position Status Indicators:
Winner + Early: ATR×1.0 (No pressure)
Winner + Extended: ATR×1.0 (No pressure - winners can run indefinitely)
Loser + Early: ATR×1.0 (Recovery opportunity)
Loser + Extended: ATR×1.1 or ATR×1.3 (Increasing pressure to exit)
MTF Section:
Data Source: Shows whether using MTF Data/EMA Backup/Local EMA
Timeframe: Configured watchtower timeframe setting
Data Valid: Confirms successful MTF data retrieval status
Trend Signal: Higher timeframe directional bias analysis
Close Price: MTF price data availability confirmation
"Composite" Filter:
Composite Section:
Buy Score: Real-time weighted scoring from multiple indicators
Sell Score: Opposing directional signal strength
Threshold: Minimum scores required for signal activation
Components:
Flash/Blink: Momentum acceleration indicators (F = Flash active, B = Blink active)
Individual filter contributions showing which specific signals are firing
"ReEntry" Filter:
ReEntry System:
System: Shows if re-entry feature is Enabled/Disabled
Eligibility: Conditions for new entries in each direction
Performance: Success metrics of re-entry attempts when enabled
🎯 Key Status Indicators
Status Column Symbols:
✓ = Condition met / System active / Signal valid
✗ = Condition not met / System inactive / No signal
⏳ = Cooldown active (waiting period)
✅ = Ready state / Good condition
🔄 = Processing / Transitioning state
🔍 Critical Reading Guidelines
For Active Positions - Smart Exit Priority Reading:
1. First Check Position Type:
ROI ≥ 0% = Winning Position (Standard requirements)
ROI < 0% = Losing Position (Progressive requirements)
2. Check Hold Duration:
Early Stage (≤8 bars): Standard multiplier regardless of ROI
Extended Stage (9-16 bars): Slight pressure on losing positions
Long Stage (17+ bars): Strong pressure on losing positions
3. Score vs Final Threshold Analysis:
Score ≥ Final Threshold = HOLD (Continue position)
Score < Final Threshold = EXIT (Close position)
Watch for timeMultiplier changes as position duration increases
4. Understanding "Why No Hold?"
Common scenarios when Score Check shows FAIL:
Losing position held too long (timeMultiplier increased to 1.1 or 1.3)
Low volatility period (dynamic threshold raised to 2.8)
Signal deterioration (smart score dropped below required level)
MTF conflict (higher timeframe opposing position direction)
For Entry Signal Analysis:
Composite Score Reading: Signal strength relative to threshold requirements
Component Analysis: Individual filter contributions to overall score
EMA Structure: Confirm 3-bar crossover requirement met
Cooldown Status: Ensure sufficient time passed since last exit
For ReEntry Opportunities (when enabled):
System Status: Availability and eligibility for re-engagement
Exit Type Analysis: TP-based exits enable immediate re-entry, SL-based exits require cooldown
Condition Monitoring: Requirements for potential re-entry signals
Debugging Common Issues:
Issue: "Score is high but no hold?"
→ Check Final Threshold vs Score (not Dynamic Threshold)
→ Losing position may have increased timeMultiplier
→ Extended hold duration applying pressure
Issue: "Why different thresholds for same score?"
→ Position ROI status affects multiplier
→ Time elapsed since entry affects multiplier
→ Market volatility affects base threshold
Issue: "MTF conflicts with local signals?"
→ Higher timeframe trend opposing position
→ System designed to exit on MTF conflicts
→ Check MTF Data Valid status
⚡ Performance Optimization Notes
For Better Performance:
Analysis table updates may impact performance on some devices
Use specific filters rather than "All" mode for focused monitoring
Consider disabling during live trading for optimal chart performance
Enable only when needed for debugging or analysis
Strategic Usage:
Monitor "Smart" filter when positions are active for exit timing decisions
Use "Composite" filter during setup phases for signal strength analysis
Reference "ReEntry" filter after position closures for re-engagement opportunities
Track Final Threshold changes to understand exit pressure evolution
Advanced Debugging Workflow:
Position Entry Analysis:
Check Composite score vs threshold
Verify EMA crossover timing (3 bars prior)
Confirm cooldown completion
Hold Decision Monitoring:
Track Score vs Final Threshold progression
Monitor timeMultiplier changes over time
Watch for MTF conflicts
Exit Timing Analysis:
Identify which threshold layer caused exit
Track performance by exit type
Analyze re-entry eligibility
This analysis system provides transparency into strategy decision-making processes, allowing users to understand how signals are generated and positions are managed according to the programmed logic during various market conditions and position states.
SIGNAL TYPES AND CHARACTERISTICS
🔥 Core Momentum Signals
Flash Signal
Calculation: ta.rma(math.abs(close - close ), 5) > ta.sma(math.abs(close - close ), 7)
Purpose: Detects sudden price acceleration using smoothed momentum comparison
Characteristics: Triggers when recent price movement exceeds historical average movement
Usage: Primary momentum confirmation across multiple composite calculations
Weight: 1.3 points in composite scoring
Blink Signal
Calculation: math.abs(ta.change(close, 1)) > ta.sma(math.abs(ta.change(close, 1)), 5)
Purpose: Identifies immediate price velocity spikes
Characteristics: More sensitive than Flash, captures single-bar momentum bursts
Usage: Secondary momentum confirmation, often paired with Flash
Weight: 1.3 points in composite scoring
⚡ Advanced Composite Signals
Apex Pulse Signal
Calculation: apexAngleValue > 30 or apexAngleValue < -30
Purpose: Detects extreme EMA angle momentum
Characteristics: Identifies when trend angle exceeds ±30 degrees
Usage: Confirms directional momentum strength in trend-following scenarios
Pressure Surge Signal
Calculation: volSpike_AVP and strongTrendUp_ATG
Purpose: Combines volume expansion with trend confirmation
Characteristics: Requires both volume spike and strong uptrend simultaneously
Usage: bullish signal for trend continuation
Shift Wick Signal
Calculation: ta.crossunder(ema1, ema2) and isWickTrapDetected and directionFlip
Purpose: Detects bearish reversal with wick trap confirmation
Characteristics: Combines EMA crossunder with upper wick dominance and directional flip
Usage: Reversal signal for trend change identification
🛡️ Trap Exit Protection Signals
Bear Trap Exit
Calculation: isUpperWickTrap and isBearEngulfNow
Conditions: Previous bullish candle with 80%+ upper wick, followed by current bearish engulfing
Purpose: Emergency exit signal for long positions
Priority: Highest - overrides all other hold conditions
Action: Immediate position closure with full state reset
Bull Trap Exit
Calculation: isLowerWickTrap and isBullEngulfNow
Conditions: Previous bearish candle with 80%+ lower wick, followed by current bullish engulfing
Purpose: Emergency exit signal for short positions
Priority: Highest - overrides all other hold conditions
Action: Immediate position closure with full state reset
📊 Technical Analysis Foundation Signals
RSI-MFI Hybrid System
Base Calculation: (ta.rsi(close, 14) + ta.mfi(close, 14)) / 2
Oversold Threshold: < 35
Overbought Threshold: > 65
Weak Condition: < 35 and declining
Strong Condition: > 65 and rising
Usage: Momentum confirmation and reversal identification
ADX-DMI Trend Classification
Strong Up Trend: (adx > 25 and diplus > diminus and (diplus - diminus) > 5) or (ema1 > ema2 and ema2 > ema3 and ta.rising(ema2, 3))
Strong Down Trend: (adx > 20 and diminus > diplus - 5) or (ema1 < ema2 and ta.falling(ema1, 3))
Trend Weakening: adx < adx and adx < adx
Usage: Primary trend direction confirmation
Bollinger Band Squeeze Detection
Calculation: bbWidth < ta.lowest(bbWidth, 20) * 1.2
Purpose: Identifies low volatility periods before breakouts
Usage: Entry filter - avoids trades during consolidation
🎨 Visual Signal Indicators
Red X Signal
Calculation: isBearCandle and ta.crossunder(ema1, ema2)
Visual: Red X above price
Purpose: Bearish EMA crossunder with confirming candle
Composite Weight: +1.0 for short positions, -1.0 for long positions
Characteristics: Simple but effective trend change indicator
Green Dot Signal
Calculation: isBullCandle and ta.crossover(ema1, ema2)
Visual: Green dot below price
Purpose: Bullish EMA crossover with confirming candle
Composite Weight: +1.0 for long positions, -1.0 for short positions
Characteristics: Entry confirmation for trend-following strategies
Blue Diamond Signal
Trigger Conditions: amcBuySignal and score >= 4
Scoring Components: 11 different technical conditions
Key Requirements: AMC bullish + momentum rise + EMA expansion + volume confirmation
Visual: Blue diamond below price
Purpose: Bullish reversal or continuation signal
Characteristics: Multi-factor confirmation requiring 4+ technical alignments
Red Diamond Signal
Trigger Conditions: amcSellSignal and score >= 5
Scoring Components: 11 different technical conditions (stricter than Blue Diamond)
Key Requirements: AMC bearish + momentum crash + EMA compression + volume decline
Visual: Red diamond above price
Purpose: Potential bearish reversal or continuation signal
Characteristics: Requires higher threshold (5 vs 4) for more selective triggering
🔵 Specialized Detection Signals
Blue Dot Signal
Calculation: volumePulse and isCandleStrong and volIsHigh
Requirements: Volume > 2.0x MA, strong candle body > 35% of range, volume MA > 55
Purpose: Volume-confirmed momentum signal
Visual: Blue dot above price
Characteristics: Volume-centric signal for high-liquidity environments
Orange X Signal
Calculation: Complex multi-factor oversold reversal detection
Requirements: AMC oversold + wick trap + flash/blink + RSI-MFI oversold + bullish flip
Purpose: Oversold bounce signal with multiple confirmations
Visual: Orange X below price
Characteristics: Reversal signal requiring 5+ simultaneous conditions
VSS (Velocity Signal System)
Components: Volume spike + EMA angle + trend direction
Buy Signal: vssTrigger and vssTrendDir == 1
Sell Signal: vssTrigger and vssTrendDir == -1
Visual: Green/Red triangles
Purpose: Velocity-based momentum detection
Characteristics: Fast-response signal for momentum trading
⭐ Elite Composite Signals
Star Uprising Signal
Base Requirements: entryCompositeBuySignal and echoBodyLong and strongUpTrend and isAMCUp
Additional Confirmations: RSI hybrid strong + not high risk
Special Conditions: At bottom zone OR RSI bottom bounce OR strong volume bounce
Visual: Star symbol below price
Purpose: Bullish reversal signal from oversold conditions
Characteristics: Most selective bullish signal requiring multiple confirmations
Ultra Short Signal
Scoring System: 7-component scoring requiring 4+ points
Key Components: EMA trap + volume decline + RSI weakness + composite confirmation
Additional Requirements: Falling EMA structure + volume spike + flash confirmation
Visual: Explosion emoji above price
Purpose: Aggressive short entry for trend reversal or continuation
Characteristics: Complex multi-layered signal for experienced short selling
🎯 Composite Signal Architecture
Enhanced Composite Scoring
Long Composite: 15+ weighted components including structure, momentum, flash/blink, volume, price action, reversal triggers, trend alignment
Short Composite: Mirror structure with bearish bias
Threshold: 5.0 points required for signal activation
Conflict Resolution: If both long and short signals trigger simultaneously, both are disabled
Final Validation: Requires EMA momentum confirmation (ta.rising(emaFast_ATG, 2) for longs, ta.falling(emaFast_ATG, 2) for shorts)
Risk Assessment Integration
High Risk Long: RSI > 70 OR close > upper Bollinger Band 80%
High Risk Short: RSI < 30 OR close < lower Bollinger Band 80%
Zone Analysis: Top zone (95% of 50-bar high) vs Bottom zone (105% of 50-bar low)
Risk Penalty: High risk conditions subtract 1.5 points from composite scores
This signal architecture creates a multi-layered detection system where simple momentum signals provide foundation, technical analysis adds structure, visual indicators offer clarity, specialized detectors capture different market conditions, and composite signals identify potential opportunities while integrated risk assessment is designed to filter risky entries.
VISUAL FEATURES SHOWCASE
Ichimoku Cloud Visualization
Dynamic Color Intensity: Cloud transparency adapts to momentum strength - darker colors indicate stronger directional moves, while lighter transparency shows weakening momentum phases.
Gradient Color Mapping: Bullish momentum renders blue-purple spectrum with increasing opacity, while bearish momentum displays corresponding color gradients with intensity-based transparency.
Real-time Momentum Feedback: Color saturation provides immediate visual feedback on market structure strength, allowing traders to assess levels at a glance without additional indicators.
EMA Ribbon Bands
The 8-level exponential moving average system creates a comprehensive trend structure map with gradient color coding.
Signal Type Visualization
STRATEGY PROPERTIES & BACKTESTING DISCLOSURE
📊 Default Strategy Configuration:
✅ Initial Capital: 100,000 USD (realistic for average traders)
✅ Commission: 0.075% per trade (realistic exchange fees)
✅ Slippage: 3 ticks (market impact consideration)
✅ Position Size: 5% equity per trade (sustainable risk level)
✅ Pyramiding: Disabled (single position management)
✅ Sample Size: 185 trades over 12-month backtesting period
✅ Risk Management: Adaptive stop loss with maximum 1% risk per trade
COMPREHENSIVE BACKTESTING RESULTS
Testing Period & Market Conditions:
Backtesting Period: June 25, 2024 - June 25, 2025 (12 months)
Timeframe: 15-minute charts (MTF system active)
Market: BTCUSDT (Bitcoin/Tether)
Market Conditions: Full market cycle including volatility periods
Deep Backtesting: Enabled for maximum accuracy
📈 Performance Summary:
Total Return: +2.19% (+2,193.59 USDT)
Total Trades Executed: 185 trades
Win Rate: 34.05% (63 winning trades out of 185)
Profit Factor: 1.295 (gross profit ÷ gross loss)
Maximum Drawdown: 0.65% (653.17 USDT)
Risk-Adjusted Returns: Consistent with conservative risk management approach
📊 Detailed Trade Analysis:
Position Distribution:
Long Positions: 109 trades (58.9%) | Win Rate: 36.70%
Short Positions: 76 trades (41.1%) | Win Rate: 30.26%
Average Trade Duration: Optimized for 15-minute timeframe efficiency
Profitability Metrics:
Average Profit per Trade: 11.74 USDT (0.23%)
Average Winning Trade: 151.17 USDT (3.00%)
Average Losing Trade: 60.27 USDT (1.20%)
Win/Loss Ratio: 2.508 (winners are 2.5x larger than losses)
Largest Single Win: 436.02 USDT (8.69%)
Largest Single Loss: 107.41 USDT (controlled risk management)
💰 Financial Performance Breakdown:
Gross Profit: 9,523.93 USDT (9.52% of capital)
Gross Loss: 7,352.48 USDT (7.35% of capital)
Net Profit After Costs: 2,171.44 USDT (2.17%)
Commission Costs: 1,402.47 USDT (realistic trading expenses)
Maximum Equity Run-up: 2,431.66 USDT (2.38%)
⚖️ Risk Management Validation:
Maximum Drawdown: 0.65% showing controlled risk management
Drawdown Recovery: Consistent equity curve progression
Risk per Trade: Successfully maintained below 1.5% per position
Position Sizing: 5% equity allocation proved sustainable throughout testing period
📋 Strategy Performance Characteristics:
✅ Strengths Demonstrated:
Controlled Risk: Maximum drawdown well below industry standards (< 1%)
Positive Expectancy: Win/loss ratio of 2.5+ creates profitable edge
Consistent Performance: Steady equity curve without extreme volatility
Realistic Costs: Includes actual commission and slippage impacts
Sample Size: 185 trades during testing period
⚠️ Performance Considerations:
Win Rate: 34% win rate requires discipline to follow system signals
Market Dependency: Performance may vary significantly in different market conditions
Timeframe Sensitivity: Optimized for 15-minute charts; other timeframes may show different results
Slippage Impact: Real trading conditions may affect actual performance
📊 Benchmark Comparison:
Strategy Return: +2.19% over 12 months
Buy & Hold Bitcoin: +71.12% over same period
Strategy Advantage: Significantly lower drawdown and volatility
Risk-Adjusted Performance: Different risk profile compared to holding cryptocurrency
🎯 Real-World Application Insights:
Expected Trading Frequency:
Average: 15.4 trades per month (185 trades ÷ 12 months)
Weekly Frequency: Approximately 3-4 trades per week
Active Management: Requires regular monitoring during market hours
Capital Requirements:
Minimum Used in Testing: $10,000 for sustainable position sizing
Tested Range: $50,000-$100,000 for comfortable risk management
Commission Impact: 0.075% per trade totaled 1.4% of capital over 12 months
⚠️ IMPORTANT BACKTESTING DISCLAIMERS:
📈 Performance Reality:
Past performance does not guarantee future results. Backtesting results represent hypothetical performance and may not reflect actual trading outcomes due to market changes, execution differences, and emotional factors.
🔄 Market Condition Dependency:
This strategy's performance during the tested period may not be representative of performance in different market conditions, volatility regimes, or trending vs. sideways markets.
💸 Cost Considerations:
Actual trading costs may vary based on broker selection, market conditions, and trade size. Commission rates and slippage assumptions may differ from real-world execution.
🎯 Realistic Expectations:
The 34% win rate requires psychological discipline to continue following signals during losing streaks. Risk management and position sizing are critical for replicating these results.
⚡ Technology Dependencies:
Strategy performance assumes reliable internet connection, platform stability, and timely signal execution. Technical failures may impact actual results.
CONFIGURATION OPTIMIZATION
5-Minute Timeframe Optimization (Advanced Users Only)
⚠️ Important Warning: 5-minute timeframes operate without MTF confirmation, resulting in reduced signal quality and higher false signal rates.
Example 5-Minute Parameters:
Composite Thresholds: Long 6.5, Short 7.0 (vs 15M default 5.0/5.4)
Signal Lookback Bars: 12 (vs 15M default 8)
Volume Multiplier: 2.2 (vs 15M default 1.8)
MTF Timeframe: Disabled (automatic below 30M)
Risk Management Adjustments:
Position Size: Reduce to 3% (vs 5% default)
TP1: 0.8%, TP2: 1.2%, TP3: 2.0% (tighter targets)
SL: 0.8% (tighter stop loss)
Cooldown Minutes: 8 (vs 5 default)
Usage Notes for 5-Minute Trading:
- Wait for higher composite scores before entry
- Require stronger volume confirmation
- Monitor EMA structure more closely
15-Minute Scalping Setup:
TP1: 1.0%, TP2: 1.5%, TP3: 2.5%
Composite Threshold: 5.0 (higher filtering)
TP ATR Multiplier: 7.0
SL ATR Multiplier: 2.5
Volume Multiplier: 1.8 (requires stronger confirmation)
Hold Time: 2 bars minimum
3-Hour Swing Setup:
TP1: 2.0%, TP2: 4.0%, TP3: 8.0%
Composite Threshold: 4.5 (more signals)
TP ATR Multiplier: 8.0
SL ATR Multiplier: 3.2
Volume Multiplier: 1.2
Hold Time: 6 bars minimum
Market-Specific Adjustments
High Volatility Periods:
Increase ATR multipliers (TP: 2.0x, SL: 1.2x)
Raise composite thresholds (+0.5 points)
Reduce position size
Enable cooldown periods
Low Volatility Periods:
Decrease ATR multipliers (TP: 1.2x, SL: 0.8x)
Lower composite thresholds (-0.3 points)
Standard position sizing
Disable extended cooldowns
News Events:
Temporarily disable strategy 30 minutes before major releases
Increase volume requirements (2.0x multiplier)
Reduce position sizes by 50%
Monitor for unusual price action
RISK MANAGEMENT
Dual ROI System: Adaptive vs Fixed Mode
Adaptive RR Mode:
Uses ATR (Average True Range) for automatic adjustment
TP1: 1.0x ATR from entry price
TP2: 1.5x ATR from entry price
TP3: 2.0x ATR from entry price
Stop Loss: 1.0x ATR from entry price
Automatically adjusts to market volatility
Fixed Percentage Mode:
Uses predetermined percentage levels
TP1: 1.0% (default)
TP2: 1.5% (default)
TP3: 2.5% (default)
Stop Loss: 0.9% total (0.6% risk tolerance + 0.3% slippage buffer)(default)
Consistent levels regardless of volatility
Mode Selection: Enable "Use Adaptive RR" for ATR-based targets, disable for fixed percentages. Adaptive mode works better in varying volatility conditions, while fixed mode provides predictable risk/reward ratios.
Stop Loss Management
In Adaptive SL Mode:
Automatically scales with market volatility
Tight stops during low volatility (smaller ATR)
Wider stops during high volatility (larger ATR)
Include 0.3% slippage buffer in both modes
In Fixed Mode:
Consistent percentage-based stops
2% for crypto, 1.5% for forex, 1% for stocks
Manual adjustment needed for different market conditions
Trailing Stop System
Configuration:
Enable Trailing: Activates dynamic stop loss adjustment
Start Trailing %: Profit level to begin trailing (default 1.0%)
Trailing Offset %: Distance from current price (default 0.5%)
Close if Return to Entry: Optional immediate exit if price returns to entry level
Operation: Once position reaches trailing start level, stop loss automatically adjusts upward (longs) or downward (shorts) maintaining the offset distance from favorable price movement.
Timeframe-Specific Risk Considerations
15-Minute and Above (Tested):
✅ Full MTF system active
✅ Standard risk parameters apply
✅ Backtested performance metrics valid
✅ Standard position sizing (5%)
5-Minute Timeframes (Advanced Only):
⚠️ MTF system inactive - local signals only
⚠️ Higher false signal rate expected
⚠️ Reduced position sizing preferred (3%)
⚠️ Tighter stop losses required (0.8% vs 1.2%)
⚠️ Requires parameter optimization
⚠️ Monitor performance closely
1-Minute Timeframes (Limited Testing):
❌ Excessive noise levels
❌ Strategy not optimized for this frequency
Risk Management Practices
Allocate no more than 5% of your total investment portfolio to high-risk trading
Never trade with funds you cannot afford to lose
Thoroughly backtest and validate the strategy with small amounts before full implementation
Always maintain proper risk management and stop-loss settings
IMPORTANT DISCLAIMERS
Performance Disclaimer
Past performance does not guarantee future results. All trading involves substantial risk of loss. This strategy is provided for informational purposes and does not constitute financial advice.
Market Risk
Cryptocurrency and forex markets are highly volatile. Prices can move rapidly against positions, resulting in significant losses. Users should never risk more than they can afford to lose.
Strategy Limitations
This strategy relies on technical analysis and may not perform well during fundamental market shifts, news events, or unprecedented market conditions. No trading strategy can guarantee 100% success or eliminate the risk of loss.
Legal Compliance
You are responsible for compliance with all applicable regulations and laws in your jurisdiction. Consult with licensed financial professionals when necessary.
User Responsibility
Users are responsible for their own trading decisions, risk management, and compliance with applicable regulations in their jurisdiction.

Qullamaggie [Modified] | FractalystWhat's the purpose of this strategy?
The strategy aims to identify high-probability breakout setups in trending markets, inspired by Kristjan "Qullamaggie" Kullamägi’s approach.
It focuses on capturing explosive price moves after periods of consolidation, using technical criteria like moving averages, breakouts, trailing stop-loss and momentum confirmation.
Ideal for swing traders seeking to ride strong trends while managing risk.
----
How does the strategy work?
The strategy follows a systematic process to capture high-momentum breakouts:
Pre-Breakout Criteria:
Prior Price Surge: Identifies stocks that have rallied 30-100%+ in recent month(s), signaling strong underlying momentum (per Qullamaggie’s volatility expansion principles).
Consolidation Phase: Looks for a tightening price range (e.g., flag, pennant, or tight base), indicating a potential "coiling" before continuation.
Trend Confirmation: Uses moving averages (e.g., 20/50/200 EMA) to ensure the stock is trading above key averages on the daily chart, confirming an uptrend.
Price Break: Enters when price clears the consolidation high with conviction.
Risk Management:
Initial Stop Loss: Placed below the consolidation low or a recent swing point to limit downside.
Break-Even Adjustment: Moves stop loss to breakeven once the trade reaches 1.5x risk-to-reward (RR), securing a "free trade" while letting winners run.
Trailing Stop (Unique Edge):
Market Structure Trailing: Instead of trailing via moving averages, the stop is dynamically adjusted using structural invalidation level. This adapts to price action, allowing the trade to stay open during volatile retracements while locking in gains as new structure forms.
Why This Matters: Most strategies use rigid trailing stops (e.g., below the 10EMA), which often exit prematurely in choppy markets. By trailing based on structure, this strategy avoids "noise" and captures larger trends, directly boosting overall returns.
----
What markets or timeframes is this suited for?
This is a long-only strategy designed for trending markets, and it performs best in:
Markets: Stocks (especially high-growth, liquid equities), cryptocurrencies (major pairs with strong volatility), commodities (e.g., oil, gold), and futures (index/commodity futures).
Timeframes: Primarily daily charts for swing trades (1-30 day holds), though weekly charts can help confirm broader trends.
Key Advantage: The TradingView script allows instant backtesting with adjustable parameters
You can:
- Test historical performance across multiple markets to identify which assets align best with the strategy.
- Optimize settings (e.g., trailing stop sensitivity, moving averages etc.) to match a market’s volatility profile.
Build a diversified portfolio by filtering for markets that show consistent profitability in backtests.
For example, you might discover cryptos require tighter trailing stops due to volatility, while stocks thrive with wider structural stops. The script automates this analysis, letting you to trade confidently.
----
What indicators or tools does the strategy use?
The strategy combines customizable technical tools with strict anti-lookahead safeguards:
Core Indicators:
Moving Averages: Adjustable periods (e.g., 20/50/200 EMA or SMA) and timeframes (daily/weekly) to confirm trend alignment. Users can test combinations (e.g., 10EMA vs. 20EMA) to optimize for specific markets.
Breakout Parameters:
Consolidation Length: Adjustable window to define the "tightness" of the pre-breakout pattern.
Entry Models: Flexible entry logics (Breakouts and fractals)
Anti-Lookahead Design:
All calculations (e.g., moving averages, consolidation ranges, volume averages) use only closed/confirmed data available at the time of the signal.
----
How do I manage risk with this strategy?
The strategy prioritizes customizable risk controls to align with your trading style and account size:
User-Defined Risk Inputs:
Risk Per Trade: Set a % of Equity (e.g., 1-2%) to determine position size. The strategy auto-calculates shares/contracts to match your selected risk per trade.
Flexibility: Choose between fixed risk or equity-based scaling.
The script adjusts position sizing dynamically based on your selection.
Pyramiding Feature:
Customizable Entries: Adjust the number of pyramiding trades allowed (e.g., 1-3 additional positions) in the strategy settings. Each new entry is triggered only if the prior trade hits its 1.5x RR target and the trend remains intact.
Risk-Scaled Additions: New positions use profits from prior trades, compounding gains without increasing initial risk.
Risk-Free Trade Mechanic:
Once a trade reaches 1.5x RR, the stop loss is moved to breakeven, eliminating downside risk.
The strategy then opens a new position (if pyramiding is enabled) using a portion of the locked-in profit. This "snowballs" winners while keeping total capital exposure stable.
Impact on Net Profit & Drawdown:
Net Profit Boost: Pyramiding lets you ride multi-leg trends aggressively. For example, a 100% runner could generate 2-3x more profit vs. a single-entry approach.
Controlled Drawdowns: Since new positions are funded by profits (not initial capital), max drawdown stays anchored to your original risk per trade (e.g., 1-2% of account). Even if later entries fail, the breakeven stop on prior trades protects overall equity.
Why This Works: Most strategies either over-leverage (increasing drawdowns) or exit too early. By recycling profits into new positions only after securing risk-free capital, this approach mimics hedge fund "scaling in" tactics while staying retail-trader friendly.
----
How does the strategy identify market structure for its trailing stoploss?
The strategy identifies market structure by utilizing an efficient logic with for loops to pinpoint the first swing candle that features a pivot of 2. This marks the beginning of the break of structure, where the market's previous trend or pattern is considered invalidated or changed.
----
What are the underlying calculations?
The underlying calculations involve:
Identifying Swing Points: The strategy looks for swing highs (marked with blue Xs) and swing lows (marked with red Xs). A swing high is identified when a candle's high is higher than the highs of the candles before and after it. Conversely, a swing low is when a candle's low is lower than the lows of the candles before and after it.
Break of Structure (BOS):
Bullish BOS: This occurs when the price breaks above the swing high level of the previous structure, indicating a potential shift to a bullish trend.
Bearish BOS: This happens when the price breaks below the swing low level of the previous structure, signaling a potential shift to a bearish trend.
Structural Liquidity and Invalidation:
Structural Liquidity: After a break of structure, liquidity levels are updated to the first swing high in a bullish BOS or the first swing low in a bearish BOS.
Structural Invalidation: If the price moves back to the level of the first swing low before the bullish BOS or the first swing high before the bearish BOS, it invalidates the break of structure, suggesting a potential reversal or continuation of the previous trend.
This method provides users with a technical approach to filter market regimes, offering an advantage by minimizing the risk of overfitting to historical data, which is often a concern with traditional indicators like moving averages.
By focusing on identifying pivotal swing points and the subsequent breaks of structure, the strategy maintains a balance between sensitivity to market changes and robustness against historical data anomalies, ensuring a more adaptable and potentially more reliable market analysis tool.
----
What entry criteria are used in this script?
The script uses two entry models for trading decisions: BreakOut and Fractal.
Underlying Calculations:
Breakout: The script records the most recent swing high by storing it in a variable. When the price closes above this recorded level, and all other predefined conditions are satisfied, the script triggers a breakout entry. This approach is considered conservative because it waits for the price to confirm a breakout above the previous high before entering a trade. As shown in the image, as soon as the price closes above the new candle (first tick), the long entry gets taken. The stop-loss is initially set and then moved to break-even once the price moves in favor of the trade.
Fractal: This method involves identifying a swing low with a period of 2, which means it looks for a low point where the price is lower than the two candles before and after it. Once this pattern is detected, the script executes the trade. This is an aggressive approach since it doesn't wait for further price confirmation. In the image, this is represented by the 'Fractal 2' label where the script identifies and acts on the swing low pattern.
----
What type of stop-loss identification method are used in this strategy?
This strategy employs two types of stop-loss methods: Initial Stop-loss and Trailing Stop-Loss.
Underlying Calculations:
Initial Stop-loss:
ATR Based: The strategy uses the Average True Range (ATR) to set an initial stop-loss, which helps in accounting for market volatility without predicting price direction.
Calculation:
- First, the True Range (TR) is calculated for each period, which is the greatest of:
- Current Period High - Current Period Low
- Absolute Value of Current Period High - Previous Period Close
- Absolute Value of Current Period Low - Previous Period Close
- The ATR is then the moving average of these TR values over a specified period, typically 14 periods by default. This ATR value can be used to set the stop-loss at a distance from the entry price that reflects the current market volatility.
Swing Low Based:
For this method, the stop-loss is set based on the most recent swing low identified in the market structure analysis. This approach uses the lowest point of the recent price action as a reference for setting the stop-loss.
Trailing Stop-Loss:
The strategy uses structural liquidity and structural invalidation levels across multiple timeframes to adjust the stop-loss once the trade is profitable. This method involves:
Detecting Structural Liquidity: After a break of structure, the liquidity levels are updated to the first swing high in a bullish scenario or the first swing low in a bearish scenario. These levels serve as potential areas where the price might find support or resistance, allowing the stop-loss to trail the price movement.
Detecting Structural Invalidation: If the price returns to the level of the first swing low before a bullish break of structure or the first swing high before a bearish break of structure, it suggests the trend might be reversing or invalidating, prompting the adjustment of the stop-loss to lock in profits or minimize losses.
By using these methods, the strategy dynamically adjusts the initial stop-loss based on market volatility, helping to protect against adverse price movements while allowing for enough room for trades to develop. The ATR-based stop-loss adapts to the current market conditions by considering the volatility, ensuring that the stop-loss is not too tight during volatile periods, which could lead to premature exits, nor too loose during calm markets, which might result in larger losses. Similarly, the swing low based stop-loss provides a logical exit point if the market structure changes unfavorably.
Each market behaves differently across various timeframes, and it is essential to test different parameters and optimizations to find out which trailing stop-loss method gives you the desired results and performance. This involves backtesting the strategy with different settings for the ATR period, the distance from the swing low, and how the trailing stop-loss reacts to structural liquidity and invalidation levels.
Through this process, you can tailor the strategy to perform optimally in different market environments, ensuring that the stop-loss mechanism supports the trade's longevity while safeguarding against significant drawdowns.
----
What type of break-even method is used in this strategy? What are the underlying calculations?
Moves the initial stop-loss to the entry price when the price reaches a certain RR ratio.
Calculation:
Break-even level = Entry Price + (Initial Risk * RR Ratio)
----
What tables are available in this script?
- Summary: Provides a general overview, displaying key performance parameters such as Net Profit, Profit Factor, Max Drawdown, Average Trade, Closed Trades and more.
Total Commission: Displays the cumulative commissions incurred from all trades executed within the selected backtesting window. This value is derived by summing the commission fees for each trade on your chart.
Average Commission: Represents the average commission per trade, calculated by dividing the Total Commission by the total number of closed trades. This metric is crucial for assessing the impact of trading costs on overall profitability.
Avg Trade: The sum of money gained or lost by the average trade generated by a strategy. Calculated by dividing the Net Profit by the overall number of closed trades. An important value since it must be large enough to cover the commission and slippage costs of trading the strategy and still bring a profit.
MaxDD: Displays the largest drawdown of losses, i.e., the maximum possible loss that the strategy could have incurred among all of the trades it has made. This value is calculated separately for every bar that the strategy spends with an open position.
Profit Factor: The amount of money a trading strategy made for every unit of money it lost (in the selected currency). This value is calculated by dividing gross profits by gross losses.
Avg RR: This is calculated by dividing the average winning trade by the average losing trade. This field is not a very meaningful value by itself because it does not take into account the ratio of the number of winning vs losing trades, and strategies can have different approaches to profitability. A strategy may trade at every possibility in order to capture many small profits, yet have an average losing trade greater than the average winning trade. The higher this value is, the better, but it should be considered together with the percentage of winning trades and the net profit.
Winrate: The percentage of winning trades generated by a strategy. Calculated by dividing the number of winning trades by the total number of closed trades generated by a strategy. Percent profitable is not a very reliable measure by itself. A strategy could have many small winning trades, making the percent profitable high with a small average winning trade, or a few big winning trades accounting for a low percent profitable and a big average winning trade. Most mean-reversion successful strategies have a percent profitability of 40-80% but are profitable due to risk management control.
BE Trades: Number of break-even trades, excluding commission/slippage.
Losing Trades: The total number of losing trades generated by the strategy.
Winning Trades: The total number of winning trades generated by the strategy.
Total Trades: Total number of taken traders visible your charts.
Net Profit: The overall profit or loss (in the selected currency) achieved by the trading strategy in the test period. The value is the sum of all values from the Profit column (on the List of Trades tab), taking into account the sign.
- Monthly: Displays performance data on a month-by-month basis, allowing users to analyze performance trends over each month and year.
- Weekly: Displays performance data on a week-by-week basis, helping users to understand weekly performance variations.
- UI Table: A user-friendly table that allows users to view and save the selected strategy parameters from user inputs. This table enables easy access to key settings and configurations, providing a straightforward solution for saving strategy parameters by simply taking a screenshot with Alt + S or ⌥ + S.
User-input styles and customizations:
Please note that all background colors in the style are disabled by default to enhance visualization.
How to Use This Strategy to Create a Profitable Edge and Systems?
Choose Your Strategy mode:
- Decide whether you are creating an investing strategy or a trading strategy.
Select a Market:
- Choose a one-sided market such as stocks, indices, or cryptocurrencies.
Historical Data:
- Ensure the historical data covers at least 10 years of price action for robust backtesting.
Timeframe Selection:
- Choose the timeframe you are comfortable trading with. It is strongly recommended to use a timeframe above 15 minutes to minimize the impact of commissions/slippage on your profits.
Set Commission and Slippage:
- Properly set the commission and slippage in the strategy properties according to your broker/prop firm specifications.
Parameter Optimization:
- Use trial and error to test different parameters until you find the performance results you are looking for in the summary table or, preferably, through deep backtesting using the strategy tester.
Trade Count:
- Ensure the number of trades is 200 or more; the higher, the better for statistical significance.
Positive Average Trade:
- Make sure the average trade is above zero.
(An important value since it must be large enough to cover the commission and slippage costs of trading the strategy and still bring a profit.)
Performance Metrics:
- Look for a high profit factor, and net profit with minimum drawdown.
- Ideally, aim for a drawdown under 20-30%, depending on your risk tolerance.
Refinement and Optimization:
- Try out different markets and timeframes.
- Continue working on refining your edge using the available filters and components to further optimize your strategy.
What Makes This Strategy Unique?
This strategy combines flexibility, smart risk management, and momentum focus in a way that’s rare and practical:
1. Adapts to Any Market Rhythm
Works on daily, weekly, or intraday charts without code changes.
Uses two entry types: classic breakouts (like trending stocks) or fractal patterns (to avoid false starts).
2. Smarter Stop-Loss System
No rigid rules: Stops adjust based on price structure (e.g., new “higher lows”), not fixed percentages.
Avoids whipsaws: Tightens stops only when the trend strengthens, not in choppy markets.
3. Safe Profit-Boosting Pyramiding
Adds new positions only after prior trades are risk-free (stops moved above breakeven).
Scales up using locked-in profits, not new capital, to grow gains safely.
4. Built-In Momentum Check
Tracks 1/3/6-month price growth to spotlight stocks with strong, lasting momentum.
Terms and Conditions | Disclaimer
Our charting tools are provided for informational and educational purposes only and should not be construed as financial, investment, or trading advice. They are not intended to forecast market movements or offer specific recommendations. Users should understand that past performance does not guarantee future results and should not base financial decisions solely on historical data.
Built-in components, features, and functionalities of our charting tools are the intellectual property of @Fractalyst Unauthorized use, reproduction, or distribution of these proprietary elements is prohibited.
- By continuing to use our charting tools, the user acknowledges and accepts the Terms and Conditions outlined in this legal disclaimer and agrees to respect our intellectual property rights and comply with all applicable laws and regulations.

RhAiA TradingView indicator that plots AI-generated LONG /SHORT signals on BTC/USDT charts, entering trades at signal timestamps with customizable take-profit (TP) and stop-loss (SL) levels, exit priority, and holding windows. Signals are blocked if a prior trade remains active, with color-coded lines and labels for entries, TP/SL hits, and window expirations.

ORB Pro SuiteOverview
ORB Pro with Filters + Debug Overlay is an advanced Opening Range Breakout indicator designed for precision intraday trading. It defines a configurable ORB window, automatically builds the breakout range, and triggers long or short signals only when all active filters align. The script also includes a built-in debug overlay that explains why each breakout is accepted or blocked, allowing traders to fine-tune entries with transparency.
What Makes It Unique
• Modular filter stack – close-confirmation vs. instant breaks, retest confirmation with adjustable tolerance %, volume-spike and EMA-trend filters, ORB-size range, session cutoff, and cooldown logic.
• Non-blocking debug overlay – inline or corner display of the exact rejection reason (“Too late,” “Low volume,” “Trend mismatch,” etc.).
• Fully customizable visuals – choose shaded, outline, or line-only ORB styles; set opacity, border color, and right-edge offset so the box never hides current candles.
• Integrated reversal engine – detects doji, hammer, and engulfing structures within a time-filtered window and optional VWAP/EMA confluence.
How It Works
During the defined opening window (default 9:30 – 9:45 NY), the indicator records the session high and low.
After the box closes, it looks for breakouts confirmed by candle close or retest (per user settings).
Each signal passes through range, volume, trend, time-delay, and session filters before printing.
Visual stop-loss / take-profit levels appear for reference using either R:R multiples or fixed %.
The optional reversal layer marks short-term exhaustion zones for counter-scalp setups.
Usage Guidelines
• Apply to standard candlestick charts (not Heikin Ashi, Renko, or Range).
• Select your local ORB start / end time, then enable or disable filters based on your playbook.
• Use the “Outline only” or “Corner table” debug modes for a cleaner chart.
• The script provides visual and alert-based confirmations only; it does not execute orders or backtest performance.
Inputs at a Glance
– ORB window (start/end time)
– Close-confirm toggle
– Retest tolerance %
– Volume SMA length
– EMA length for trend filter
– Min/Max range % filter
– Cooldown bars and session cutoff
– Visual R:R ratio or fixed SL/TP %
– Box style, opacity, border width / color
– Debug overlay mode (inline or table) and leader lines
Notes & Disclaimers
• This script is for analysis and educational purposes only. It does not constitute financial advice or guarantee performance.
• Signals are calculated on completed bars without lookahead.
• Invite-only access ensures version integrity and controlled distribution.
© Trades with B – Original development in Pine v6. Reuse of this code requires explicit permission from the author.

Key Zones & Levels - IntradayThis indicator provides key zones and levels for the day.
The levels are constant for the day and no re-painting.
The levels are plotted at 9:15pm IST for Indian stock market trading.
Use these levels with RSI for a perfect reversal setup with small stop loss.
Work perfectly for all types of market - Indices, stocks, commodity, futures.
Join my channel to support me - whatsapp.com