Imbalance No SL📊 Strategy Name: Imbalance No SL
This strategy specially trades on price jumps (true imbalances) in the market, takes advantage of momentum only, and as soon as the opposite signal and profit is received, the trade is closed immediately.
Imbalance No SL strategy specially generates buy and sell signals based on "Imbalance" logic, without any fixed Stop Loss.
🔍 Core Logic
Imbalance Detection
Bullish Imbalance : When the low of the current candle is above the high of the previous candle.
(i.e. a jump type gap occurred in the market – demand is high, price went straight up)
Bearish Imbalance : When the high of the current candle is below the low of the previous candle.
(i.e. the market suddenly fell down)
Creating Visual Box and Label on Signal:
As soon as bullish imbalance is found, green box & IMB BULL label is displayed on the chart.
Bearish has red box & IMB BEAR label.
Trade Entry Logic
BUY on Bullish Imbalance: If there is already a buy or neutral position, then a new “BUY” signal will fire.
SELL on Bearish Imbalance: If already in sell or neutral position, then new “SELL” signal will fire.
You can set quantity/lot size from ‘qty’ input field.
Trade Average Calculation
Buy/Sell maintains average price and their count (so that if averaging is done then correct P&L is calculated).
Trade Exit Logic (Profit Booking/Signal Reverse)
If your buy is going on and bearish imbalance is formed + price is above your average, then buy will be closed (profit condition).
If sell is going on and bullish imbalance is formed + price is below average, then sell will be closed.
Chart Cleaning/Management
Only keep the label and box of the latest signal on the chart, old boxes/labels are automatically deleted.
Alert
You can get alert on bullish or bearish signal (by using alert feature of TradingView).
✅ Simple Explanation for User
This strategy buys or sells directly at the gap (imbalance).
Whenever there is a clear signal of momentum in the market (breakout of the gap), then the trade entry takes place.
When there is an imbalance in the opposite direction and profit is made, the system closes the trade (closes).
There is no fixed stop-loss, risk management is handled by trade averaging/close.
You will know at every point on the visually chart that at which bar the buy, sell and exit took place.
⚠️ What to remember?
If the market is in trend then this script gives very good signals.
In choppy/sideways market, some loss trades can also come because there is no SL.
Big profit or big loss – both depend on the imbalance signal and market speed.
ابحث في النصوص البرمجية عن "stop loss"

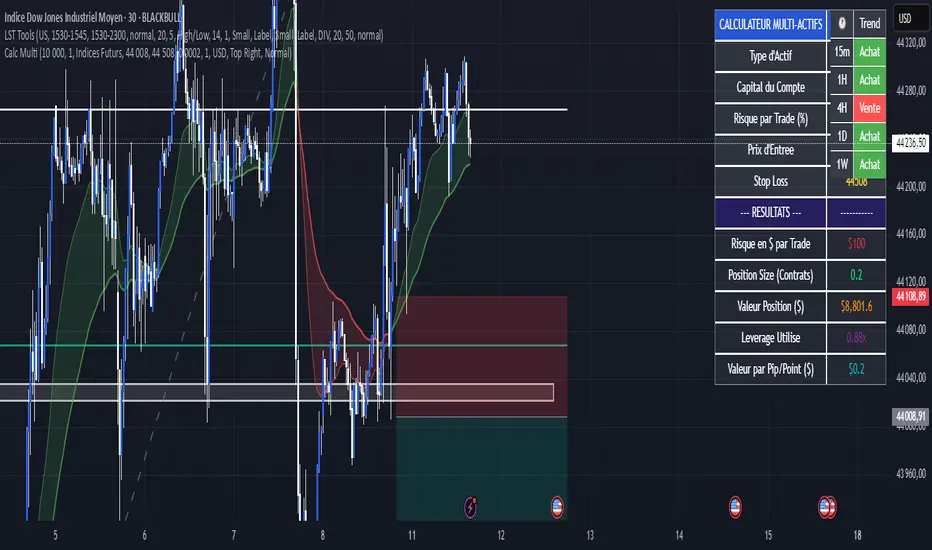
Calculateur Position Size Multi-ActifsThe Multi-Asset Position Size Calculator v6 is a fully customizable Pine Script indicator designed to help you determine the optimal position size based on your risk tolerance across any market: Forex, stocks, crypto, futures indices, or commodities. Features include:
Asset Type Selector: Choose between Forex, Stocks, Crypto, Futures Indices, or Commodities
Account Capital & Risk: Set your total account size and risk percentage per trade
Entry Price & Stop-Loss: Configure your entry and stop-loss levels directly
Automatic or Custom Pip/Point Value: Automatically calculates pip/point value by asset class or enter your own
Contract Size Adjustment: Define contract sizes (e.g., 100,000 units for Forex, 1 for stocks/crypto)
Margin & Leverage Display: View your used leverage and position value in real time
Risk Alerts: Warnings for invalid inputs, high leverage (>10×), and asset-specific risk settings (e.g., crypto leverage)
Integrated Table Interface: On-chart table with adjustable position and text size
Optional Price Level Drawing: Display entry and stop-loss lines on the chart
Trade any market confidently with precise, asset-tailored position sizing and risk management.
EMA 6/21/50 PROIndicator Description: EMAs 6/21/50 + MACD + AO + Panel + Alerts
This technical indicator combines several analysis tools to help identify opportunities to enter consolidated trends. It integrates Exponential Moving Averages (EMAs), the MACD, the Amazing Oscillator (AO), and an interactive information panel that allows you to visualize entry signals, trend direction, and potential exit levels (Take Profit and Stop Loss). It is designed for day or swing traders who want a quick and structured reading of the market.
What does the script do? The indicator does the following: It draws 6, 21, and 50-period EMAs on the chart to detect the direction of the trend. It generates LONG/SHORT entry signals based on EMA crossover, alignment with the overall trend (EMA50), and confirmation by indicators: MACD:
Momentum filter. AO: Impulse depletion filter. It visually displays the TP (Take Profit) and SL (Stop Loss) levels when there is a signal. It includes an informative graphical panel with icons and text summarizing the market status and entry conditions.
It issues customizable alerts for entry signals, allowing it to be used in automated strategies or as a manual guide. Allows you to enable/disable visual elements with buttons to customize the experience.
How does it do it?
EMAs and crossover signals: It uses three EMAs: 6 (fast), 21 (medium), and 50 (slow).
A LONG signal occurs when the 6-EMA crosses above the 21-EMA, the price is above the 50-EMA, the MACD confirms bullish momentum, and the AO shows no exhaustion.
A SHORT signal is given in reverse conditions, with the option to limit the system to long signals only (Long signals only).
Additional filters:
MACD: Entry is avoided if there is no favorable crossover between the MACD line and its signal.
AO: Entry is avoided if the OA shows signs of weakness or exhaustion. TP/SL Visual:
TP and SL levels are calculated based on user-defined pips, and are automatically drawn on the chart when there is a valid signal.
Information panel: Each bar is automatically updated. Samples: general trend, EMA crossover, MACD/AO filters, and presence of LONG/SHORT signal. It is possible to hide it with a button from the settings panel.
Alerts: Alerts are generated when the full LONG or SHORT entry conditions are met. They are useful for receiving automatic notifications or integrating them into automated systems.
How to use it?
Add to chart and configure options: Year of start of the analysis.
Activate only long signals if you wish.
Show/hide panel, EMAs, or TP/SL levels. Interpreting signals:
Green triangle under a candle = Possible LONG entry.
Red triangle above a candle = Possible SHORT entry.
Green Line = Suggested Take Profit. Red Line = Suggested Stop Loss. Trigger alerts from TradingView's alert settings to be notified in real-time.
Important Note
This script does not execute orders or represent an automated trading strategy.
It is a visual analysis tool that can support decision-making, but it is recommended to use it in conjunction with other elements of analysis and proper risk management.

Volume Pressure Analysis - Live DataVolume Pressure Gauge and Volume Percentage Indicator – Pine Script Guide
This indicator provides a simplified, real-time visualization of both volume pressure (buy vs. sell activity) and today’s trading volume in comparison to historical averages. It is designed to help traders assess whether buyers or sellers dominate the current session and whether today’s volume is significant relative to recent behaviour.
________________________________________
Key Functional Segments
1. Inputs and Configuration
Users can configure the length of the Simple Moving Average (SMA) used to calculate average volume, set the position of the gauge table on the chart, and toggle the visibility of the volume pressure display. This allows flexibility in integrating the tool with various trading styles and chart layouts.
2. Volume Data Calculations
The indicator calculates three key volume metrics:
• volToday: The current day’s volume.
• volAvg: The average volume over the user-defined SMA period (default is 20 bars).
• volPct: The current volume as a percentage of the average.
This enables traders to quickly recognize whether current trading activity is above or below normal, which can be a precursor to potential trend strength or weakness.
3. Volume Pressure Calculation
The script estimates buying and selling pressure based on price movement and volume. It distributes volume into upward (buy) and downward (sell) segments and expresses them as percentages of the total volume. This gives an immediate sense of whether bulls or bears are more active in the current session.
4. Visual Representation (Progress Bars)
The indicator renders a simplified visual gauge using horizontal bar segments (pseudo-bars) to reflect the proportion of buy and sell pressure. The length of each bar correlates with the strength of pressure from buyers or sellers, helping users assess dominance without analyzing candlestick behavior in depth.
5. Table Display
A compact table is drawn on the chart showing:
• Buy pressure percentage and corresponding bar.
• Sell pressure percentage and corresponding bar.
• Volume percentage compared to the recent average.
This format makes it easy to evaluate volume dynamics at a glance, without cluttering the price chart or relying on separate overlays.
________________________________________
How Traders Benefit from This Indicator
• Momentum Shift Detection: Early signs of trend reversal can be observed when volume pressure flips direction.
• Breakout Validation: High volume combined with dominant pressure supports the credibility of breakout moves.
• False Move Avoidance: If price moves on low volume or mixed pressure, traders can avoid low-probability entries.
• Market Context Awareness: Users can assess whether a day is behaving normally in terms of participation or is unusually quiet or aggressive.
________________________________________
Basic Usage Guide
1. Add the script to your TradingView chart and set your preferred SMA length for volume comparison.
2. Customize the table’s position using the X and Y settings for clarity and alignment.
3. Interpret the outputs:
o A higher red bar indicates dominant sell pressure.
o A higher green bar indicates dominant buy pressure.
o Volume % above 100% suggests above-average activity, while values below 100% may imply low conviction.
4. Apply to trading decisions:
o High buy pressure and high volume may indicate a strong long opportunity.
o High sell pressure and high volume may support short setups.
o Low volume or conflicting signals may call for caution.
5. Combine with other tools such as trend indicators, support/resistance zones, or price action patterns for more reliable trade setups.
________________________________________
Practical Example
• Sell Pressure: 70% → Suggests strong seller control; potential for short setups.
• Buy Pressure: 30% → Weak buying interest; long trades may carry risk.
• Volume Percentage: 120% → Indicates a surge in participation; movement may have greater validity.
________________________________________
Tips for New Traders
• Use this indicator as a confirmation tool rather than a standalone strategy.
• Begin on higher timeframes (4-hour or daily) to develop familiarity.
• Compare multiple examples to identify reliable patterns over time.
• Always incorporate proper risk management, including stop losses.
________________________________________
Disclaimer from aiTrendview
This indicator is intended solely for educational and informational use. It does not constitute investment advice, trade signals, or financial recommendations. aiTrendview and its affiliates are not liable for any trading losses incurred through use of this tool. All trading involves risk. Past performance of any indicator does not guarantee future results. Users should conduct independent research and consult with a certified financial advisor before making any trading decisions.

Volume Pressure Gauge + Volume %Volume Pressure Gauge and Volume Percentage Indicator – Pine Script Guide
This indicator provides a simplified, real-time visualization of both volume pressure (buy vs. sell activity) and today’s trading volume in comparison to historical averages. It is designed to help traders assess whether buyers or sellers dominate the current session and whether today’s volume is significant relative to recent behaviour.
________________________________________
Key Functional Segments
1. Inputs and Configuration
Users can configure the length of the Simple Moving Average (SMA) used to calculate average volume, set the position of the gauge table on the chart, and toggle the visibility of the volume pressure display. This allows flexibility in integrating the tool with various trading styles and chart layouts.
2. Volume Data Calculations
The indicator calculates three key volume metrics:
• volToday: The current day’s volume.
• volAvg: The average volume over the user-defined SMA period (default is 20 bars).
• volPct: The current volume as a percentage of the average.
This enables traders to quickly recognize whether current trading activity is above or below normal, which can be a precursor to potential trend strength or weakness.
3. Volume Pressure Calculation
The script estimates buying and selling pressure based on price movement and volume. It distributes volume into upward (buy) and downward (sell) segments and expresses them as percentages of the total volume. This gives an immediate sense of whether bulls or bears are more active in the current session.
4. Visual Representation (Progress Bars)
The indicator renders a simplified visual gauge using horizontal bar segments (pseudo-bars) to reflect the proportion of buy and sell pressure. The length of each bar correlates with the strength of pressure from buyers or sellers, helping users assess dominance without analyzing candlestick behavior in depth.
5. Table Display
A compact table is drawn on the chart showing:
• Buy pressure percentage and corresponding bar.
• Sell pressure percentage and corresponding bar.
• Volume percentage compared to the recent average.
This format makes it easy to evaluate volume dynamics at a glance, without cluttering the price chart or relying on separate overlays.
________________________________________
How Traders Benefit from This Indicator
• Momentum Shift Detection: Early signs of trend reversal can be observed when volume pressure flips direction.
• Breakout Validation: High volume combined with dominant pressure supports the credibility of breakout moves.
• False Move Avoidance: If price moves on low volume or mixed pressure, traders can avoid low-probability entries.
• Market Context Awareness: Users can assess whether a day is behaving normally in terms of participation or is unusually quiet or aggressive.
________________________________________
Basic Usage Guide
1. Add the script to your TradingView chart and set your preferred SMA length for volume comparison.
2. Customize the table’s position using the X and Y settings for clarity and alignment.
3. Interpret the outputs:
o A higher red bar indicates dominant sell pressure.
o A higher green bar indicates dominant buy pressure.
o Volume % above 100% suggests above-average activity, while values below 100% may imply low conviction.
4. Apply to trading decisions:
o High buy pressure and high volume may indicate a strong long opportunity.
o High sell pressure and high volume may support short setups.
o Low volume or conflicting signals may call for caution.
5. Combine with other tools such as trend indicators, support/resistance zones, or price action patterns for more reliable trade setups.
________________________________________
Practical Example
• Sell Pressure: 70% → Suggests strong seller control; potential for short setups.
• Buy Pressure: 30% → Weak buying interest; long trades may carry risk.
• Volume Percentage: 120% → Indicates a surge in participation; movement may have greater validity.
________________________________________
Tips for New Traders
• Use this indicator as a confirmation tool rather than a standalone strategy.
• Begin on higher timeframes (4-hour or daily) to develop familiarity.
• Compare multiple examples to identify reliable patterns over time.
• Always incorporate proper risk management, including stop losses.
________________________________________
Disclaimer from aiTrendview
This indicator is intended solely for educational and informational use. It does not constitute investment advice, trade signals, or financial recommendations. aiTrendview and its affiliates are not liable for any trading losses incurred through use of this tool. All trading involves risk. Past performance of any indicator does not guarantee future results. Users should conduct independent research and consult with a certified financial advisor before making any trading decisions.

NQ Phantom Scalper Pro# 👻 NQ Phantom Scalper Pro
**Advanced VWAP Mean Reversion Strategy with Volume Confirmation**
## 🎯 Strategy Overview
The NQ Phantom Scalper Pro is a sophisticated mean reversion strategy designed specifically for Nasdaq 100 (NQ) futures scalping. This strategy combines Volume Weighted Average Price (VWAP) bands with intelligent volume spike detection to identify high-probability reversal opportunities during optimal market hours.
## 🔧 Key Features
### VWAP Band System
- **Dynamic VWAP Bands**: Automatically adjusting standard deviation bands based on intraday volatility
- **Multiple Band Levels**: Configurable Band #1 (entry trigger) and Band #2 (profit target reference)
- **Flexible Anchoring**: Choose from Session, Week, Month, Quarter, or Year-based VWAP calculations
### Volume Intelligence
- **Volume Spike Detection**: Only triggers entries when volume exceeds SMA by configurable multiplier
- **Relative Volume Display**: Real-time volume strength indicator in info panel
- **Optional Volume Filter**: Can be disabled for testing alternative setups
### Advanced Time Management
- **12-Hour Format**: User-friendly time inputs (9 AM - 4 PM default)
- **Lunch Filter**: Automatically avoids low-liquidity lunch period (12-2 PM)
- **Visual Time Zones**: Color-coded background for active/inactive periods
- **Market Hours Focus**: Optimized for peak NQ trading sessions
### Smart Risk Management
- **ATR-Based Stops**: Volatility-adjusted stop losses using Average True Range
- **Dual Exit Strategy**: VWAP mean reversion + fixed profit targets
- **Adjustable Risk-Reward**: Configurable target ratio to opposite VWAP band
- **Position Sizing**: Percentage-based equity allocation
### Optional Trend Filter
- **EMA Trend Alignment**: Optional trend filter to avoid counter-trend trades
- **Configurable Period**: Adjustable EMA length for trend determination
- **Toggle Functionality**: Enable/disable based on market conditions
## 📊 How It Works
### Entry Logic
**Long Entries**: Triggered when price touches lower VWAP band + volume spike during active hours
**Short Entries**: Triggered when price touches upper VWAP band + volume spike during active hours
### Exit Strategy
1. **VWAP Mean Reversion**: Early exit when price returns to VWAP center line
2. **Profit Target**: Fixed target based on percentage to opposite VWAP band
3. **Stop Loss**: ATR-based protective stop
### Visual Elements
- **VWAP Center Line**: Blue line showing volume-weighted fair value
- **Green Bands**: Entry trigger levels (Band #1)
- **Red Bands**: Extended levels for target reference (Band #2)
- **Orange EMA**: Trend filter line (when enabled)
- **Background Colors**: Yellow (lunch), Gray (after hours), Clear (active trading)
- **Info Panel**: Real-time metrics display
## ⚙️ Recommended Settings
### Timeframes
- **Primary**: 1-5 minute charts for scalping
- **Validation**: Test on 15-minute for swing applications
### Market Conditions
- **Best Performance**: Ranging/choppy markets with good volume
- **Trend Markets**: Enable trend filter to avoid counter-trend trades
- **High Volatility**: Increase ATR multiplier for stops
### Session Optimization
- **Pre-Market**: Generally avoided (low volume)
- **Morning Session**: 9:30 AM - 12:00 PM (high activity)
- **Lunch Period**: 12:00 PM - 2:00 PM (filtered by default)
- **Afternoon Session**: 2:00 PM - 4:00 PM (good volume)
- **After Hours**: Generally avoided (wide spreads)
## ⚠️ Risk Disclaimer
This strategy is for educational purposes only and does not constitute financial advice. Past performance does not guarantee future results. Trading futures involves substantial risk of loss and is not suitable for all investors. Users should:
- Thoroughly backtest on historical data
- Start with small position sizes
- Understand the risks of leveraged trading
- Consider transaction costs and slippage
- Never risk more than you can afford to lose
## 📈 Performance Tips
1. **Volume Threshold**: Adjust volume multiplier based on average NQ volume patterns
2. **Band Sensitivity**: Modify band multipliers for different volatility regimes
3. **Time Filters**: Customize trading hours based on your timezone and preferences
4. **Trend Alignment**: Use trend filter during strong directional markets
5. **Risk Management**: Always maintain consistent position sizing and risk parameters
**Version**: 6.0 Compatible
**Asset**: Optimized for NASDAQ 100 Futures (NQ)
**Style**: Mean Reversion Scalping
**Frequency**: High-Frequency Trading Ready

Opening Range v3 (Dynamic)Opening Range Signals v3 (Dynamic) - Indicator Guide
Created by: MecarderoAurum
Why This Indicator Exists: An Overview
The "Opening Range Signals" indicator is a sophisticated tool designed for day traders who focus their strategy on the price action that unfolds during the Regular Trading Hours (RTH) of the New York session (09:30 - 16:00 ET). The opening period of the market, often called the "initial balance," is a critical time where institutions and traders establish the early high and low for the day. Trading the breakout of this range is a classic and effective strategy, but it's often plagued by false moves and "head fakes."
This indicator was built to solve that problem. It not only identifies the initial range but also incorporates a powerful dynamic expansion feature. This allows the indicator to intelligently adapt to early session volatility, filter out false breakouts, and establish more reliable support and resistance levels for the rest of the trading day. It provides a clear, visual framework for executing opening range strategies with more confidence.
Key Features & How to Use Them
1. Customizable Opening Range
This is the foundation of the indicator. It draws the high and low of the initial trading period on your chart.
What it does: Establishes the initial support and resistance levels for the day.
How to use it: In the settings under "Time Settings," you can set the "Opening Range Duration" from 1 to 30 minutes. A shorter duration (e.g., 5 minutes) will be more sensitive and give earlier signals, while a longer duration (e.g., 30 minutes) will establish a wider, more robust range.
2. Dynamic Range Expansion
This is the indicator's most powerful and unique feature. It helps you avoid getting trapped in false breakouts.
What it does: If the price breaks out of the initial range but then quickly closes back inside, the indicator will automatically expand the range to include the full wick of the failed breakout. This tells you the market is still establishing its true range.
How to use it: In the settings under "Dynamic Range," you can:
"Enable Dynamic Range Expansion": This is on by default.
"Expansion Time Limit (Min)": Set how long the indicator should look for these failed breakouts. After this time, the range will be locked for the day.
3. Clear Visual Trading Signals
The indicator provides three distinct signals to help you interpret the price action around the opening range.
Breakout Body (Yellow plotshape):
What it means: The first confirmation that the price has decisively moved outside the established range. It appears when a candle's body closes entirely above the high or below the low.
How to use it: This is your alert that a potential breakout is underway. Do not enter yet; wait for confirmation.
Continuation (Green plotshape):
What it means: This signal appears on the candle immediately following a breakout if it shows momentum in the same direction. It confirms that the breakout has strength.
How to use it: This is a potential entry trigger. A continuation signal suggests the breakout is valid and may continue.
Failure (Red plotshape):
What it means: This signal appears if, after a breakout and continuation, the price quickly reverses and closes back inside the range. It's a strong indication of a false breakout.
How to use it: If you are in a breakout trade, a failure signal is a clear sign to exit. It can also be used as a setup for a reversal trade in the opposite direction.
Sample Strategy: The Breakout-Continuation Trade
This strategy uses the indicator's signals to trade a classic opening range breakout with added confirmation.
Setup:
Set the "Opening Range Duration" to your preferred time (e.g., 5 or 15 minutes).
Ensure the "Dynamic Range Expansion" is enabled to filter out early noise.
Entry Trigger:
Wait for a Breakout signal (yellow) to appear. This puts you on high alert.
Wait for a Continuation signal (green) on the very next candle. This is your entry trigger. Enter a long trade on a bullish continuation or a short trade on a bearish continuation.
Stop-Loss:
For a bullish (long) trade, a common stop-loss placement is just below the low of the continuation candle or, for a more conservative stop, just inside the opening range high.
For a bearish (short) trade, place your stop-loss just above the high of the continuation candle or just inside the opening range low.
Trade Management:
If a Failure signal (red) appears after you've entered, it indicates the breakout has failed. This is a strong signal to exit your trade immediately to protect your capital.
If the trade moves in your favor, you can manage it by taking profits at key levels or using a trailing stop.

Gold 3min Trading Pro [XAU/USD]# Gold 3min Trading Pro - User Guide
## Overview
This is a professional scalping indicator specifically designed for Gold (XAU/USD) trading on 3-minute timeframes. It combines multiple technical analysis methods to provide high-probability entry signals for short-term trading.
## Key Features
### 1. Multi-Timeframe Trend Analysis
- **Major Trend**: Analyzes 15min, 1H, and 4H timeframes using moving averages
- **Short-term Trend**: Focuses on 3-minute price action and moving average alignment
- **Trend Strength**: Rated from 1-3 based on timeframe agreement
### 2. Core Indicators
- **RSI (9-period)**: Momentum oscillator for overbought/oversold conditions
- **Stochastic (9-period)**: %K and %D lines for entry timing
- **MACD**: Additional trend confirmation
- **Volume Analysis**: Detects volume spikes for signal validation
- **ATR-based Volatility Filter**: Ensures adequate market movement
### 3. Signal Types
- **Primary Signals**: Green triangles (LONG) and Red triangles (SHORT)
- **Enhanced Signals**: Stronger signals with multiple confirmations
- **Confirmation Signals**: Small circles for stochastic crossovers
## How to Use
### 1. Setup
- **Timeframe**: Use on 3-minute charts for Gold (XAU/USD)
- **Settings**: Default settings are optimized for Gold scalping
- **Session Filter**: Enable for London/New York sessions (recommended)
### 2. Entry Conditions
#### LONG Entry:
- Major trend is bullish (green background)
- Short-term trend is up or neutral
- RSI shows bullish momentum
- Stochastic indicates oversold recovery
- Volume spike confirmation
- Strong price action (bullish candle)
#### SHORT Entry:
- Major trend is bearish (red background)
- Short-term trend is down or neutral
- RSI shows bearish momentum
- Stochastic indicates overbought reversal
- Volume spike confirmation
- Strong price action (bearish candle)
### 3. Trade Management
- **Quick Target**: 50% of ATR-based calculation
- **Main Target**: Full ATR-based target
- **Stop Loss**: 60% of ATR below/above entry
- **Time Limit**: Exit if no progress within 20 bars (60 minutes)
### 4. Risk Management
- **Position Size**: Risk 1-2% of account per trade
- **Maximum Trades**: 3-5 trades per session
- **Avoid**: Low volatility periods and major news events
## Visual Elements
### Background Colors
- **Light Green**: Bullish major trend
- **Light Red**: Bearish major trend
- **Yellow**: Volume spike detected
- **Intense Colors**: Very strong trend alignment
### Chart Indicators
- **RSI Line (Blue)**: Main momentum indicator
- **Stochastic %K (Orange)**: Fast stochastic line
- **Stochastic %D (Yellow)**: Slow stochastic line
- **Horizontal Lines**: 70 (overbought), 30 (oversold), 50 (midline)
### Information Table (Top Right)
- Total signal count and performance statistics
- Current market conditions and trend strength
- RSI levels and volatility status
- Trading session information
- Last signal timing
## Alert System
### Standard Alerts
- **Scalp Long Signal**: Basic long entry signal
- **Scalp Short Signal**: Basic short entry signal
- **Premium Signals**: High-quality signals with strong confirmation
- **Trend Reversal**: Major trend change notifications
### Alert Setup
1. Right-click on chart → "Add Alert"
2. Select desired alert condition
3. Configure notification method (popup, email, webhook)
4. Set alert frequency to "Once Per Bar Close"
## Best Practices
### 1. Trading Sessions
- **Optimal**: London-NY overlap (3:00-5:00 PM EST)
- **Good**: London session (2:00-11:00 AM EST)
- **Avoid**: Asian session and major news releases
### 2. Market Conditions
- **Best**: Trending markets with normal to high volatility
- **Moderate**: Ranging markets during active sessions
- **Avoid**: Extremely low volatility or choppy conditions
### 3. Confirmation Rules
- Wait for signal triangle to appear
- Check that major trend aligns with signal direction
- Verify volume spike (yellow background)
- Ensure volatility is adequate (check info table)
### 4. Entry Timing
- Enter immediately after signal confirmation
- Use market orders for scalping speed
- Set stop loss and take profit levels immediately
## Settings Customization
### Essential Settings
- **MA Type**: EMA (recommended) or SMA
- **RSI Length**: 9 (default, can adjust 5-14)
- **Volume Threshold**: 1.8 (higher = fewer but stronger signals)
- **Volatility Filter**: Keep enabled for better signal quality
### Display Options
- **Show Scalping Signals**: Main entry signals
- **Show Performance Stats**: Information table
- **Show Trend Filter**: Background trend colors
- **Use Time Filter**: Session-based filtering
## Performance Optimization
### 1. Backtesting Tips
- Test on different market conditions
- Analyze win rate and average profit/loss
- Adjust settings based on historical performance
### 2. Signal Quality
- Higher trend strength (2-3) = better signals
- Volume confirmation improves success rate
- Enhanced signals have higher probability
### 3. Risk Control
- Never risk more than 2% per trade
- Use proper position sizing
- Stop trading after 3 consecutive losses
## Troubleshooting
### Common Issues
1. **No Signals**: Check volatility filter and session timing
2. **Too Many Signals**: Increase volume threshold or enable filters
3. **Poor Performance**: Verify timeframe (must be 3-minute) and symbol (XAU/USD)
### Support
- Ensure TradingView Pro+ subscription for multi-timeframe data
- Verify Gold symbol matches your broker's format
- Update to latest TradingView version
This indicator is designed for experienced traders familiar with scalping techniques and risk management. Always practice on demo accounts before live trading.

DP_ORB Entry & Exit IndicatorDisclaimer:
This indicator is for educational purposes only. It does not constitute financial advice. Always do your own research and manage your risk. Also, I cannot take full credit for 'ORB' as its a well known strategy amongst many traders, but I do need to give a special shout out to @TheBigDaddyMax for putting me on to this.
DP_ORB Entry & Exit Indicator
Description:
The DP_ORB Entry & Exit Indicator is a powerful tool designed for traders who utilize the Opening Range Breakout (ORB) strategy on the NYSE session. This indicator visually identifies the initial volatility window of the trading day, by marking the 15m High, and 15m Low into a ORB Box, & then tracks breakout opportunities, and provides clear, dynamic trade management levels—all directly on your chart.
Key Features:
Automatic Opening Range (ORB) Box:
Identifies and plots the high and low of the user-defined opening range (default 9:30–9:45 NYSE) for visual reference and strategy foundation.
Breakout Entry Signals:
Automatically detects and marks long or short breakout entries when price closes above or below the ORB range, with additional momentum confirmation.
Dynamic Stop Loss:
Stop loss is intelligently set to the previous bar’s low for long trades (or high for shorts), adapting to market structure at entry.
Take Profit Targets:
Up to three fully adjustable take-profit levels are plotted, calculated as percentages from entry, supporting progressive trade management.
Visual Trade Management:
Entry, stop loss, and take profit levels are displayed as extending dashed lines from entry point to the current bar, with labels always shown just to the right of price for clarity on all timeframes.
Automatic Reset and Cleanup:
Visuals and logic reset daily and upon exit, ensuring a clean, uncluttered chart experience.
How to Use:
Set your preferred opening range time and take profit levels in the settings.
Wait for a breakout and confirmation during the NYSE session.
Use the on-chart lines and labels to manage your trade according to your risk and strategy plan.
Best For:
Day traders and scalpers seeking a disciplined, visual, and fully-automated approach to opening range breakout trading.

HMA Crossover + ATR + Curvature (Long & Short)📏 Hull Moving Averages (Trend Filters)
- fastHMA = ta.hma(close, fastLength)
- slowHMA = ta.hma(close, slowLength)
These two HMAs act as dynamic trend indicators:
- A bullish crossover of fast over slow HMA signals a potential long setup.
- A bearish crossunder triggers short interest.
⚡️ Curvature (Acceleration Filter)
- curv = ta.change(ta.change(fastHMA))
This calculates the second-order change (akin to the second derivative) of the fast HMA — effectively the acceleration of the trend. It serves as a filter:
- For long entries: curv > curvThresh (positive acceleration)
- For short entries: curv < -curvThresh (negative acceleration)
It helps eliminate weak or stagnating moves by requiring momentum behind the crossover.
📈 Volatility-Based Risk Management (ATR)
- atr = ta.atr(atrLength)
- stopLoss = atr * atrMult
- trailStop = atr * trailMult
These define your:
- Initial stop loss: scaled to recent volatility using ATR and atrMult.
- Trailing stop: also ATR-scaled, to lock in gains dynamically as price moves favorably.
💰 Position Sizing via Risk Percent
- capital = strategy.equity
- riskCapital = capital * (riskPercent / 100)
- qty = riskCapital / stopLoss
This dynamically calculates the position size (qty) such that if the stop loss is hit, the loss does not exceed the predefined percentage of account equity. It’s a volatility-adjusted position sizing method, keeping your risk consistent regardless of market conditions.
📌 Execution Logic
- Long Entry: on bullish HMA crossover with rising curvature.
- Short Entry: on bearish crossover with falling curvature.
- Exits: use ATR-based trailing stops.
- Position is closed when trend conditions reverse (e.g., bearish crossover exits the long).
This framework gives you:
- Trend-following logic (via HMAs)
- Momentum confirmation (via curvature)
- Volatility-aware execution and exits (via ATR)
- Risk-controlled dynamic sizing
Want to get surgical and test what happens if we use curvature on the difference between HMAs instead? That might give some cool insights into trend strength transitions.

VWAP Deviation Channels with Probability (Lite)VWAP Deviation Channels with Probability (Lite)
Version 1.2
Overview
This indicator is a powerful tool for intraday traders, designed to identify high-probability areas of support and resistance. It plots the Volume-Weighted Average Price (VWAP) as a central "value" line and then draws statistically-based deviation channels around it.
Its unique feature is a dynamic probability engine that analyzes thousands of historical price bars to calculate and display the real-time likelihood of the price touching each of these deviation levels. This provides a quantifiable edge for making trading decisions.
Core Concepts Explained
This indicator is built on three key concepts:
The VWAP (Volume-Weighted Average Price): The dotted midline of the channels is the session VWAP. Unlike a Simple Moving Average (SMA) which only considers price, the VWAP incorporates volume into its calculation. This makes it a much more significant benchmark, as it represents the true average price where the most business has been transacted during the day. It's heavily used by institutional traders, which is why price often reacts strongly to it.
Standard Deviation Channels: The channels above and below the VWAP are based on standard deviations. Standard deviation is a statistical measure of volatility.
- Wide Bands: When the channels are wide, it signifies high volatility.
- Narrow Bands: When the channels are tight and narrow, it signifies low volatility and
consolidation (a "squeeze").
The Conditional Probability Engine: This is the heart of the indicator. For every deviation level, the script displays a percentage. This percentage answers a very specific question:
"Based on thousands of previous bars, when the last candle had a certain momentum (bullish or bearish), what was the historical probability that the price would touch this specific level?"
The probabilities are calculated separately depending on whether the previous candle was green (bullish) or red (bearish). This provides a nuanced, momentum-based edge. The level with the highest probability is highlighted, acting as a "price magnet."
How to Use This Indicator
Recommended Timeframes:
This indicator is designed specifically for intraday trading. It works best on timeframes like the 1-minute, 5-minute, and 15-minute charts. It will not display correctly on daily or higher timeframes.
Recommended Trading Strategy: Mean Reversion
The primary strategy for this indicator is "Mean Reversion." The core idea is that as the price stretches to extreme levels far away from the VWAP (the "mean"), it is statistically more likely to "snap back" toward it.
Here is a step-by-step guide to trading this setup:
1. Identify the Extreme: Wait for the price to push into one of the outer deviation bands (e.g., the -2, -3, or -4 bands for a buy setup, or the +2, +3, or +4 bands for a sell setup).
2. Look for the High-Probability Zone: Pay close attention to the highlighted probability label. This is the level that has historically acted as the strongest magnet for price. A touch of this level represents a high-probability area for a potential reversal.
3. Wait for Confirmation: Do not enter a trade just because the price has touched a band. Wait for a confirmation candle that shows momentum is shifting.
- For a Buy: Look for a strong bullish candle (e.g., a green engulfing candle or a hammer/pin
bar) to form at the lower bands.
- For a Sell: Look for a strong bearish candle (e.g., a red engulfing candle or a shooting star)
to form at the upper bands.
Define Your Exit:
- Take Profit: A logical primary target for a mean reversion trade is the VWAP (midLine).
- Stop Loss: A logical place for a stop-loss is just outside the next deviation band. For
example, if you enter a long trade at the -3 band, your stop loss could be placed just
below the -4 band.
Disclaimer: This indicator is a tool for analysis and should not be considered a standalone trading system. Trading involves significant risk, and past performance is not indicative of future results. Always use this indicator in conjunction with other forms of analysis and sound risk management practices.

CoffeeShopCrypto Supertrend Liquidity EngineMost SuperTrend indicators use fixed ATR multipliers that ignore context—forcing traders to constantly tweak settings that rarely adapt well across timeframes or assets.
This Supertrend is a nodd to and a more completion of the work
done by Olivier Seban ( @olivierseban )
This version replaces guesswork with an adaptive factor based on prior session volatility, dynamically adjusting stops to match current conditions. It also introduces liquidity-aware zones, real-time strength histograms, and a visual control panel—making your stoploss smarter, more responsive, and aligned with how the market actually moves.
📏 The Multiplier Problem & Adaptive Factor Solution
Traditional SuperTrend indicators rely on fixed ATR multipliers—often arbitrary numbers like 1.5, 2, or 3. The issue? No logical basis ties these values to actual market conditions. What works on a 5-minute Nasdaq chart fails on a daily EUR/USD chart. Traders spend hours tweaking multipliers per asset, timeframe, or volatility phase—and still end up with stoplosses that are either too tight or too loose. Worse, the market doesn’t care about your setting—it behaves according to underlying volatility, not your parameter.
This version fixes that by automating the multiplier selection entirely. It uses a 4-zone model based on the current ATR relative to the previous session’s ATR, dynamically adjusting the SuperTrend factor to match current volatility. It eliminates guesswork, adapts to the asset and timeframe, and ensures you’re always using a context-aware stoploss—one that evolves with the market instead of fighting it.
ATR EXAMPLE
Let’s say prior session ATR = 2.00
Now suppose current ATR = 0.32
This places us in Zone 1 (Very Low Volatility)
It doesn’t imply "overbought" or "oversold" — it tells you the market is moving very little, which often means:
Lower risk | Smaller stops | Smaller opportunities (and losses)
🔁 Liquidity Zones vs. Arbitrary Pullbacks
The standard SuperTrend stop loss line often looks like price “barely misses it” before continuing its trend. Traders call this "stop hunting," but what’s really happening is liquidity collection—price pulls back into a zone rich in orders before continuing. The problem? The old SuperTrend doesn’t show this zone. It only draws the outer limit, leaving no visual cue for where entries or continuation moves might realistically originate.
This script introduces 2 levels in the Liquidity Zone. One for Support and one for Stophunts, which draw dynamically between the current price and the SuperTrend line. These levels reflect where the market is most likely to revisit before resuming the trend. By visualizing the area just above the Supertrend stop loss, you can anticipate pullbacks, spot ideal re-entries, and avoid premature exits. This bridges the gap between mechanical stoploss logic and real-world liquidity behavior.
⏳ Prior Session ATR vs. Live ATR
Using real-time ATR to determine movement potential is like driving by looking in your rearview mirror. It’s reactive, not predictive. Traders often base decisions on live ATR, unaware that today’s range is still unfolding —creating volatility mismatches between what’s calculated and what actually matters. Since ATR reflects range, calculating it mid-session gives an incomplete and misleading picture of true volatility.
Instead, this system uses the ATR from the previous session , anchoring your volatility assumptions in a fully-formed price structure . It tells you how far price moved in the last full market phase—be it London, New York, or Tokyo—giving you a more reliable gauge of expected range today. This is a smarter way to estimate how far price could move rather than how far it has moved.
The Smoothing function will take the ATR, Support, Resistance, Stophunt Levels, and the Moving Avearage and smooth them by the calculation you choose.
It will also plot a moving average on your chart against closing prices by the smoothing function you choose.
🧭 Scalping vs. Trending Modes
The market moves in at least 4 phases. Trending, Ranging, Consolidation, Distribution.
Every trader has a different style —some scalp low-volatility moves during off-hours, while others ride macro trends across days. The problem with classic SuperTrend? It treats every market condition the same. A fixed system can’t possibly provide proper stoploss spacing for both a fast scalp and a long-term swing. Traders are forced to rebuild their system every time the market changes character or the session shifts.
This version solves that with a simple toggle:
Scalping or Trend Mode . With one switch, it inverts the logic of the adaptive factor to either tighten or loosen your trailing stops. During low-liquidity hours or consolidation phases, Scalping Mode offers snug stoplosses. During expansion or clear directional bias.
Trend Mode lets the trade breathe. This is flexibility built directly into the logic—not something you have to recalibrate manually.
📉 Histogram Oscillator for Move Strength
In legacy indicators, there’s no built-in way to gauge when the move is losing power . Traders rely on price action or momentum indicators to guess if a trend is fading. But this adds clutter, lag, and often contradiction. The classic SuperTrend doesn’t offer insight into how strong or weak the current trend leg is—only whether price has crossed a line.
This version includes a Trending Liquidity Histogram —a histogram that shows whether the liquidity in the SuperTrend zone is expanding or compressing. When the bars weaken or cross toward zero, it signals liquidity exhaustion . This early warning gives you time to prep for reversals or anticipate pullbacks. It even adapts visually depending on your trading mode, showing color-coded signals for scalping vs. trending behavior. It's both a strength gauge and a trade timing tool—built into your stoploss logic.
Histogram in Scalping Mode
Histogram in Trending Mode
📊 Visual Table for Real-Time Clarity
A major issue with custom indicators is opacity —you don’t always know what settings or values are currently being used. Even worse, if your dynamic logic changes mid-trade, you may not notice unless you go digging into the code or logs. This can create confusion, especially for discretionary traders.
This SuperTrend solves it with a clean visual summary table right on your chart. It shows your current ATR value, adaptive multiplier, trailing stop level, and whether a new zone size is active. That means no surprises and no second-guessing—everything important is visible and updated in real-time.

Zero Lag MACD + Kijun-sen + EOM StrategyThis strategy offers a robust approach to identifying high-probability trading opportunities in the fast-paced cryptocurrency markets, particularly on lower timeframes (e.g., 5-minute). It leverages the synergistic power of three distinct indicators to confirm entries, ensuring a disciplined approach to risk management.
Key Components:
Zero Lag MACD Enhanced Version 1.2: This core momentum indicator is used to identify precise shifts in trend and momentum, offering reduced lag compared to traditional MACD. Entry signals are filtered based on the histogram's position (below for buys, above for sells) to enhance signal reliability.
Kijun-sen (Ichimoku Cloud): Acting as a dynamic support/resistance and trend filter, the Kijun-sen line confirms the prevailing market direction. Long entries are confirmed when price is above Kijun-sen, and short entries when price is below.
Ease of Movement (EoM): This volume-based oscillator provides crucial confirmation of price movements by measuring the ease with which price changes. Positive EoM confirms buying pressure, while negative confirms selling pressure, adding an essential layer of validation to trade setups.
How it Works:
The strategy generates entry signals only when all three indicators align simultaneously:
For Long Entries: A Zero Lag MACD buy signal (crossover below histogram) must coincide with price trading above the Kijun-sen, and the Ease of Movement indicator being above its zero line.
For Short Entries: A Zero Lag MACD sell signal (crossover above histogram) must coincide with price trading below the Kijun-sen, and the Ease of Movement indicator being below its zero line.
Entries are executed at the open of the candle immediately following the signal confirmation.
Risk Management:
Disciplined risk management is paramount to this strategy:
Dynamic Stop-Loss: An Average True Range (ATR) based stop-loss is implemented, set at 2.5 times the current ATR. This adapts the stop-loss distance to market volatility, ensuring sensible risk sizing.
Fixed Take-Profit: A consistent Risk-to-Reward (R:R) ratio of 1:1.2 is applied for all trades, promoting stable profit realization.
Customization & Optimization:
The strategy is built with fully customizable input parameters for each indicator (MACD lengths, Kijun-sen period, ATR period, ATR multiplier, and Risk-to-Reward ratio). This allows users to fine-tune the strategy for different assets, timeframes, and market conditions, facilitating robust backtesting and optimization.
Disclaimer: Trading involves substantial risk and is not suitable for all investors. Past performance is not indicative of future results. This strategy is provided for educational and informational purposes only. Always use proper risk management and conduct your own due diligence.

Money Risk Management with Trade Tracking
Overview
The Money Risk Management with Trade Tracking indicator is a powerful tool designed for traders on TradingView to simplify trade simulation and risk management. Unlike the TradingView Strategy Tester, which can be complex for beginners, this indicator provides an intuitive, beginner-friendly interface to evaluate trading strategies in a realistic manner, mirroring real-world trading conditions.
Built on the foundation of open-source contributions from LuxAlgo and TCP, this indicator integrates external indicator signals, overlays take-profit (TP) and stop-loss (SL) levels, and provides detailed money management analytics. It empowers traders to visualize potential profits, losses, and risk-reward ratios, making it easier to understand the financial outcomes of their strategies.
Key Features
Signal Integration: Seamlessly integrates with external long and short signals from other indicators, allowing traders to overlay TP/SL levels based on their preferred strategies.
Realistic Trade Simulation: Simulates trades as they would occur in real-world scenarios, accounting for initial capital, risk percentage, leverage, and compounding effects.
Money Management Dashboard: Displays critical metrics such as current capital, unrealized P&L, risk amount, potential profit, risk-reward ratio, and trade status in a customizable, beginner-friendly table.
TP/SL Visualization: Plots TP and SL levels on the chart with customizable styles (solid, dashed, dotted) and colors, along with optional labels for clarity.
Performance Tracking: Tracks total trades, win/loss counts, win rate, and profit factor, providing a clear overview of strategy performance.
Liquidation Risk Alerts: Warns traders if stop-loss levels risk liquidation based on leverage settings, enhancing risk awareness.
Benefits for Traders
Beginner-Friendly: Simplifies the complexities of the TradingView Strategy Tester, offering an intuitive interface for new traders to simulate and evaluate trades without confusion.
Real-World Insights: Helps traders understand the actual profit or loss potential of their strategies by factoring in capital, risk, and leverage, bridging the gap between theoretical backtesting and real-world execution.
Enhanced Decision-Making: Provides clear, real-time analytics on risk-reward ratios, unrealized P&L, and trade performance, enabling informed trading decisions.
Customizable and Flexible: Allows customization of TP/SL settings, table positions, colors, and sizes, catering to individual trader preferences.
Risk Management Focus: Encourages disciplined trading by highlighting risk amounts, potential profits, and liquidation risks, fostering better financial planning.
Why This Indicator Stands Out
Many traders struggle to translate backtested strategy results into real-world outcomes due to the abstract nature of percentage-based profitability metrics. This indicator addresses that challenge by providing a practical, user-friendly tool that simulates trades with real-world parameters like capital, leverage, and compounding. Its open-source nature ensures accessibility, while its integration with other indicators makes it versatile for various trading styles.
How to Use
Add to TradingView: Copy the Pine Script code into TradingView’s Pine Editor and add it to your chart.
Configure Inputs: Set your initial capital, risk percentage, leverage, and TP/SL values in the indicator settings. Select external long/short signal sources if integrating with other indicators.
Monitor Dashboards: Use the Money Management and Target Dashboard tables to track trade performance and risk metrics in real time.
Analyze Results: Review win rates, profit factors, and P&L to refine your trading strategy.
Credits
This indicator builds upon the open-source contributions of LuxAlgo and TCP , whose efforts in sharing their code have made this tool possible. Their dedication to the trading community is deeply appreciated.

Gold Breakout Strategy - RR 4Strategy Name: Gold Breakout Strategy - RR 4
🧠 Main Objective
This strategy aims to capitalize on breakouts from the Donchian Channel on Gold (XAU/USD) by filtering trades with:
Volume confirmation,
A custom momentum indicator (LWTI - Linear Weighted Trend Index),
And a specific trading session (8 PM to 8 AM Quebec time — GMT-5).
It takes only one trade per day, either a buy or a sell, using a fixed stop-loss at the wick of the breakout candle and a 4:1 reward-to-risk (RR) ratio.
📊 Indicators Used
Donchian Channel
Length: 96
Detects breakouts of recent highs or lows.
Volume
Simple Moving Average (SMA) over 30 bars.
A breakout is only valid if the current volume is above the SMA.
LWTI (Linear Weighted Trend Index)
Measures momentum using price differences over 25 bars, smoothed over 5.
Used to confirm trend direction:
Buy when LWTI > its smoothed version (uptrend).
Sell when LWTI < its smoothed version (downtrend).
⏰ Time Filter
The strategy only allows entries between 8 PM and 8 AM (GMT-5 / Quebec time).
A timestamp-based filter ensures the system recognizes the correct trading session even across midnight.
📌 Entry Conditions
🟢 Buy (Long)
Price breaks above the previous Donchian Channel high.
The current channel high is higher than the previous one.
Volume is above its moving average.
LWTI confirms an uptrend.
The time is within the trading session (20:00 to 08:00).
No trade has been taken yet today.
🔴 Sell (Short)
Price breaks below the previous Donchian Channel low.
The current channel low is lower than the previous one.
Volume is above its moving average.
LWTI confirms a downtrend.
The time is within the trading session.
No trade has been taken yet today.
💸 Trade Management
Stop-Loss (SL):
For long entries: placed below the wick low of the breakout candle.
For short entries: placed above the wick high of the breakout candle.
Take-Profit (TP):
Set at a fixed 4:1 reward-to-risk ratio.
Calculated as 4x the distance between the entry price and stop-loss.
No trailing stop, no break-even, no scaling in/out.
🎨 Visuals
Green triangle appears below the candle on a buy signal.
Red triangle appears above the candle on a sell signal.
Donchian Channel lines are plotted on the chart.
The strategy is designed for the 5-minute timeframe.
🔄 One Trade Per Day Rule
Once a trade is taken (buy or sell), no more trades will be executed for the rest of the day. This prevents overtrading and limits exposure.

SuperTrade ST1 StrategyOverview
The SuperTrade ST1 Strategy is a long-only trend-following strategy that combines a Supertrend indicator with a 200-period EMA filter to isolate high-probability bullish trade setups. It is designed to operate in trending markets, using volatility-based exits with a strict 1:4 Risk-to-Reward (R:R) ratio, meaning that each trade targets a profit 4× the size of its predefined risk.
This strategy is ideal for traders looking to align with medium- to long-term trends, while maintaining disciplined risk control and minimal trade frequency.
How It Works
This strategy leverages three key components:
Supertrend Indicator
A trend-following indicator based on Average True Range (ATR).
Identifies bullish/bearish trend direction by plotting a trailing stop line that moves with price volatility.
200-period Exponential Moving Average (EMA) Filter
Trades are only taken when the price is above the EMA, ensuring participation only during confirmed uptrends.
Helps filter out counter-trend entries during market pullbacks or ranges.
ATR-Based Stop Loss and Take Profit
Each trade uses the ATR to calculate volatility-adjusted exit levels.
Stop Loss: 1× ATR below entry.
Take Profit: 4× ATR above entry (1:4 R:R).
This asymmetry ensures that even with a lower win rate, the strategy can remain profitable.
Entry Conditions
A long trade is triggered when:
Supertrend flips from bearish to bullish (trend reversal).
Price closes above the Supertrend line.
Price is above the 200 EMA (bullish market bias).
Exit Logic
Once a long position is entered:
Stop loss is set 1 ATR below entry.
Take profit is set 4 ATR above entry.
The strategy automatically exits the position on either target.
Backtest Settings
This strategy is configured for realistic backtesting, including:
$10,000 account size
2% equity risk per trade
0.1% commission
1 tick slippage
These settings aim to simulate real-world conditions and avoid overly optimistic results.
How to Use
Apply the script to any timeframe, though higher timeframes (1H, 4H, Daily) often yield more reliable signals.
Works best in clearly trending markets (especially in crypto, stocks, indices).
Can be paired with alerts for live trading or analysis.
Important Notes
This version is long-only by design. No short positions are executed.
Ideal for swing traders or position traders seeking asymmetric returns.
Users can modify the ATR period, Supertrend factor, or EMA filter length based on asset behavior.

External Signals Strategy Tester v5External Signals Strategy Tester v5 – User Guide (English)
1. Purpose
This Pine Script strategy is a universal back‑tester that lets you plug in any external buy/sell series (for example, another indicator, webhook feed, or higher‑time‑frame condition) and evaluate a rich set of money‑management rules around it – with a single click on/off workflow for every module.
2. Core Workflow
Feed signals
Buy Signal / Sell Signal inputs accept any series (price, boolean, output of request.security(), etc.).
A crossover above 0 is treated as “signal fired”.
Date filter
Start Date / End Date restricts the test window so you can exclude unwanted history.
Trade engine
Optional Long / Short enable toggles.
Choose whether opposite signals simply close the trade or reverse it (flip direction in one transaction).
Risk modules – all opt‑in via check‑boxes
Classic % block – fixed % Take‑Profit / Stop‑Loss / Break‑Even.
Fibonacci Bollinger Bands (FBB) module
Draws dynamic VWMA/HMA/SMA/EMA/DEMA/TEMA mid‑line with ATR‑scaled Fibonacci envelopes.
Every line can be used for stops, trailing, or multi‑target exits.
Separate LONG and SHORT sub‑modules
Each has its own SL plus three Take‑Profits (TP1‑TP3).
Per TP you set line, position‑percentage to close, and an optional trailing flag.
Executed TP/SLs deactivate themselves so they cannot refire.
Trailing behaviour
If Trail is checked, the selected line is re‑evaluated once per bar; the order is amended via strategy.exit().
3. Inputs Overview
Group Parameter Notes
Trade Settings Enable Long / Enable Short Master switches
Close on Opposite / Reverse Position How to react to a counter‑signal
Risk % Use TP / SL / BE + their % Traditional fixed‑distance management
Fibo Bands FIBO LEVELS ENABLE + visual style/length Turn indicator overlay on/off
FBB LONG SL / TP1‑TP3 Enable, Line, %, Trail Rules applied only while a long is open
FBB SHORT SL / TP1‑TP3 Enable, Line, %, Trail Rules applied only while a short is open
Line choices: Basis, 0.236, 0.382, 0.5, 0.618, 0.764, 1.0 – long rules use lower bands, short rules use upper bands automatically.
4. Algorithm Details
Position open
On the very first bar after entry, the script checks the direction and activates the corresponding LONG or SHORT module, deactivating the other.
Order management loop (every bar)
FBB Stop‑Loss: placed/updated at chosen band; if trailing, follows the new value.
TP1‑TP3: each active target updates its limit price to the selected band (or holds static if trailing is off).
The classic % block runs in parallel; its exits have priority because they call strategy.close_all().
Exit handling
When any strategy.exit() fires, the script reads exit_id and flips the *_Active flag so that order will not be recreated.
A Stop‑Loss (SL) also disables all remaining TPs for that leg.
5. Typical Use Cases
Scenario Suggested Setup
Scalping longs into VWAP‐reversion Enable LONG TP1 @ 0.382 (30 %), TP2 @ 0.618 (40 %), SL @ 0.236 + trailing
Fade shorts during news spikes Enable SHORT SL @ 1.0 (no trail) and SHORT TP1,2,3 on consecutive lowers with small size‑outs
Classic trend‑follow Use only classic % TP/SL block and disable FBB modules
6. Hints & Tips
Signal quality matters – this script manages exits, it does not generate entries.
Keep TV time zone in mind when picking start/end dates.
For portfolio‑style testing allocate smaller default_qty_value than 100 % or use strategy.percent_of_equity sizing.
You can combine FBB exits with fixed‑% ones for layered management.
7. Limitations / Safety
No pyramiding; the script holds max one position at a time.
All calculations are bar‑close; intra‑bar touches may differ from real‑time execution.
The indicator overlay is optional, so you can run visual‑clean tests by unchecking FIBO LEVELS ENABLE.

PEAD strategy█ OVERVIEW
This strategy trades the classic post-earnings announcement drift (PEAD).
It goes long only when the market gaps up after a positive EPS surprise.
█ LOGIC
1 — Earnings filter — EPS surprise > epsSprThresh %
2 — Gap filter — first regular 5-minute bar gaps ≥ gapThresh % above yesterday’s close
3 — Timing — only the first qualifying gap within one trading day of the earnings bar
4 — Momentum filter — last perfDays trading-day performance is positive
5 — Risk management
• Fixed stop-loss: stopPct % below entry
• Trailing exit: price < Daily EMA( emaLen )
█ INPUTS
• Gap up threshold (%) — 1 (gap size for entry)
• EPS surprise threshold (%) — 5 (min positive surprise)
• Past price performance — 20 (look-back bars for trend check)
• Fixed stop-loss (%) — 8 (hard stop distance)
• Daily EMA length — 30 (trailing exit length)
Note — Back-tests fill on the second 5-minute bar (Pine limitation).
Live trading: enable calc_on_every_tick=true for first-tick entries.
────────────────────────────────────────────
█ 概要(日本語)
本ストラテジーは決算後の PEAD を狙い、
EPS サプライズがプラス かつ 寄付きギャップアップ が発生した銘柄をスイングで買い持ちします。
█ ロジック
1 — 決算フィルター — EPS サプライズ > epsSprThresh %
2 — ギャップフィルター — レギュラー時間最初の 5 分足が前日終値+ gapThresh %以上
3 — タイミング — 決算当日または翌営業日の最初のギャップのみエントリー
4 — モメンタムフィルター — 過去 perfDays 営業日の騰落率がプラス
5 — リスク管理
• 固定ストップ:エントリー − stopPct %
• 利確:終値が日足 EMA( emaLen ) を下抜け
█ 入力パラメータ
• Gap up threshold (%) — 1 (ギャップ条件)
• EPS surprise threshold (%) — 5 (EPS サプライズ最小値)
• Past price performance — 20 (パフォーマンス判定日数)
• Fixed stop-loss (%) — 8 (固定ストップ幅)
• Daily EMA length — 30 (利確用 EMA 期間)
注意 — Pine の仕様上、バックテストでは寄付き 5 分足の次バーで約定します。
実運用で寄付き成行に合わせたい場合は calc_on_every_tick=true を有効にしてください。
────
ご意見や質問があればお気軽にコメントください。
Happy trading!

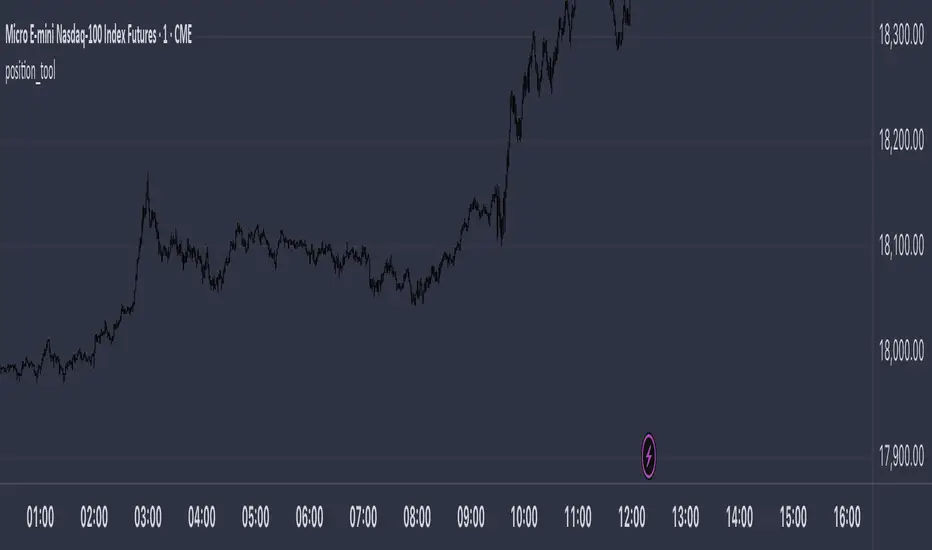
position_toolLibrary "position_tool"
Trying to turn TradingView's position tool into a library from which you can draw position tools for your strategies on the chart. Not sure if this is going to work
calcBaseUnit()
Calculates the chart symbol's base unit of change in asset prices.
Returns: (float) A ticks or pips value of base units of change.
calcOrderPipsOrTicks(orderSize, unit)
Converts the `orderSize` to ticks.
Parameters:
orderSize (float) : (series float) The order size to convert to ticks.
unit (simple float) : (simple float) The basic units of change in asset prices.
Returns: (int) A tick value based on a given order size.
calcProfitLossSize(price, entryPrice, isLongPosition)
Calculates a difference between a `price` and the `entryPrice` in absolute terms.
Parameters:
price (float) : (series float) The price to calculate the difference from.
entryPrice (float) : (series float) The price of entry for the position.
isLongPosition (bool)
Returns: (float) The absolute price displacement of a price from an entry price.
calcRiskRewardRatio(profitSize, lossSize)
Calculates a risk to reward ratio given the size of profit and loss.
Parameters:
profitSize (float) : (series float) The size of the profit in absolute terms.
lossSize (float) : (series float) The size of the loss in absolute terms.
Returns: (float) The ratio between the `profitSize` to the `lossSize`
createPosition(entryPrice, entryTime, tpPrice, slPrice, entryColor, tpColor, slColor, textColor, showExtendRight)
Main function to create a position visualization with entry, TP, and SL
Parameters:
entryPrice (float) : (float) The entry price of the position
entryTime (int) : (int) The entry time of the position in bar_time format
tpPrice (float) : (float) The take profit price
slPrice (float) : (float) The stop loss price
entryColor (color) : (color) Color for entry line
tpColor (color) : (color) Color for take profit zone
slColor (color) : (color) Color for stop loss zone
textColor (color) : (color) Color for text labels
showExtendRight (bool) : (bool) Whether to extend lines to the right
Returns: (bool) Returns true when position is closed
DI+/- Cross Strategy with ATR SL and 2% TPDI+/- Cross Strategy with ATR Stop Loss and 2% Take Profit
📝 Script Description for Publishing:
This strategy is based on the directional movement of the market using the Average Directional Index (ADX) components — DI+ and DI- — to generate entry signals, with clearly defined risk and reward targets using ATR-based Stop Loss and Fixed Percentage Take Profit.
🔍 How it works:
Buy Signal: When DI+ crosses above 40, signaling strong bullish momentum.
Sell Signal: When DI- crosses above 40, indicating strong bearish momentum.
Stop Loss: Dynamically calculated using ATR × 1.5, to account for market volatility.
Take Profit: Fixed at 2% above/below the entry price, for consistent reward targeting.
🧠 Why it’s useful:
Combines momentum breakout logic with volatility-based risk management.
Works well on trending assets, especially when combined with higher timeframe filters.
Clean BUY and SELL visual labels make it easy to interpret and backtest.
✅ Tips for Use:
Use on assets with clear trends (e.g., major forex pairs, trending stocks, crypto).
Best on 30m – 4H timeframes, but can be customized.
Consider combining with other filters (e.g., EMA trend direction or Bollinger Bands) for even better accuracy.

ATM Option Selling StrategyATM Option Selling Strategy – Explained
This strategy is designed for intraday option selling based on the 9/15 EMA crossover, 50/80 MA trend filter, and RSI 50 level. It ensures that all trades are exited before market close (3:24 PM IST).
. Indicators Used:
9 EMA & 15 EMA → For short-term trend identification.
50 MA & 80 MA → To determine the overall trend.
RSI (14) → To confirm momentum (above or below 50 level).
2. Entry Conditions:
🔴 Sell ATM Call (CE) when:
Price is below 50 & 80 MA (Bearish trend).
9 EMA crosses below 15 EMA (Short-term trend turns bearish).
RSI is below 50 (Momentum confirms weakness).
🟢 Sell ATM Put (PE) when:
Price is above 50 & 80 MA (Bullish trend).
9 EMA crosses above 15 EMA (Short-term trend turns bullish).
RSI is above 50 (Momentum confirms strength).
3. Position Sizing & Risk Management:
Sell 375 quantity per trade (Lot size).
50-Point Stop Loss → If option premium moves against us by 50 points, exit.
50-Point Take Profit → If option premium moves in our favor by 50 points, book profit.
Exit all trades at 3:24 PM IST → No overnight positions.
4. Exit Conditions:
✅ Stop Loss or Take Profit Hits → Automatically exits based on a 50-point move.
✅ Time-Based Exit at 3:24 PM → Ensures no open positions at market close.
Why This Works?
✔ Trend Confirmation → 50/80 MA ensures we only sell options in the direction of the market trend.
✔ Momentum Confirmation → RSI prevents entering weak trades.
✔ Controlled Risk → SL and TP protect against large losses.
✔ No Overnight Risk → All trades close before market close.

Supertrend + MACD CrossoverKey Elements of the Template:
Supertrend Settings:
supertrendFactor: Adjustable to control the sensitivity of the Supertrend.
supertrendATRLength: ATR length used for Supertrend calculation.
MACD Settings:
macdFastLength, macdSlowLength, macdSignalSmoothing: These settings allow you to fine-tune the MACD for better results.
Risk Management:
Stop-Loss: The stop-loss is based on the ATR (Average True Range), a volatility-based indicator.
Take-Profit: The take-profit is based on the risk-reward ratio (set to 3x by default).
Both stop-loss and take-profit are dynamic, based on ATR, which adjusts according to market volatility.
Buy and Sell Signals:
Buy Signal: Supertrend is bullish, and MACD line crosses above the Signal line.
Sell Signal: Supertrend is bearish, and MACD line crosses below the Signal line.
Visual Elements:
The Supertrend line is plotted in green (bullish) and red (bearish).
Buy and Sell signals are shown with green and red triangles on the chart.
Next Steps for Optimization:
Backtesting:
Run backtests on BTC in the 5-minute timeframe and adjust parameters (Supertrend factor, MACD settings, risk-reward ratio) to find the optimal configuration for the 60% win ratio.
Fine-Tuning Parameters:
Adjust supertrendFactor and macdFastLength to find more optimal values based on BTC's market behavior.
Tweak the risk-reward ratio to maximize profitability while maintaining a good win ratio.
Evaluate Market Conditions:
The performance of the strategy can vary based on market volatility. It may be helpful to evaluate performance in different market conditions or pair it with a filter like RSI or volume.
Let me know if you'd like further tweaks or explanations!

Auto TrendLines [TradingFinder] Support Resistance Signal Alerts🔵 Introduction
The trendline is one of the most essential tools in technical analysis, widely used in financial markets such as Forex, cryptocurrency, and stocks. A trendline is a straight line that connects swing highs or swing lows and visually indicates the market’s trend direction.
Traders use trendlines to identify price structure, the strength of buyers and sellers, dynamic support and resistance zones, and optimal entry and exit points.
In technical analysis, trendlines are typically classified into three categories: uptrend lines (drawn by connecting higher lows), downtrend lines (formed by connecting lower highs), and sideways trends (moving horizontally). A valid trendline usually requires at least three confirmed touchpoints to be considered reliable for trading decisions.
Trendlines can serve as the foundation for a variety of trading strategies, such as the trendline bounce strategy, valid breakout setups, and confluence-based analysis with other tools like candlestick patterns, divergences, moving averages, and Fibonacci levels.
Additionally, trendlines are categorized into internal and external, and further into major and minor levels, each serving unique roles in market structure analysis.
🔵 How to Use
Trendlines are a key component in technical analysis, used to identify market direction, define dynamic support and resistance zones, highlight strategic entry and exit points, and manage risk. For a trendline to be reliable, it must be drawn based on structural principles—not by simply connecting two arbitrary points.
🟣 Selecting Pivot Types Based on Trend Direction
The first step is to determine the market trend: uptrend, downtrend, or sideways.
Then, choose pivot points that match the trend type :
In an uptrend, trendlines are drawn by connecting low pivots, especially higher lows.
In a downtrend, trendlines are formed by connecting high pivots, specifically lower highs.
It is crucial to connect pivots of the same type and structure to ensure the trendline is valid and analytically sound.
🟣 Pivot Classification
This indicator automatically classifies pivot points into two categories :
Major Pivots :
MLL : Major Lower Low
MHL : Major Higher Low
MHH : Major Higher High
MLH : Major Lower High
These define the primary structure of the market and are typically used in broader structural analysis.
Minor Pivots :
mLL: minor Lower Low
mHL: minor Higher Low
mHH: minor Higher High
mLH: minor Lower High
These are used for drawing more precise trendlines within corrective waves or internal price movements.
Example : In a downtrend, drawing a trendline from an MHH to an mHH creates structural inconsistency and introduces noise. Instead, connect points like MHL to MHL or mLH to mLH for a valid trendline.
🟣 Drawing High-Precision Trendlines
To ensure a reliable trendline :
Use pivots of the same classification (Major with Major or Minor with Minor).
Ensure at least three valid contact points (three touches = structural confirmation).
Draw through candles with the least deviation (choose wicks or bodies based on confluence).
Preferably draw from right to left for better alignment with current market behavior.
Use parallel lines to turn a single trendline into a trendline zone, if needed.
🟣 Using Trendlines for Trade Entries
Bounce Entry: When price approaches the trendline and shows signs of reversal (e.g., a reversal candle, divergence, or support/resistance), enter in the direction of the trend with a logical stop-loss.
Breakout Entry: When price breaks through the trendline with strong momentum and a confirmation (such as a retest or break of structure), consider trading in the direction of the breakout.
🟣 Trendline-Based Risk Management
For bounce entries, the stop-loss is placed below the trendline or the last pivot low (in an uptrend).
For breakout entries, the stop-loss is set behind the breakout candle or the last structural level.
A broken trendline can also act as an exit signal from a trade.
🟣 Combining Trendlines with Other Tools (Confluence)
Trendlines gain much more strength when used alongside other analytical tools :
Horizontal support and resistance levels
Moving averages (such as EMA 50 or EMA 200)
Fibonacci retracement zones
Candlestick patterns (e.g., Engulfing, Pin Bar)
RSI or MACD divergences
Market structure breaks (BoS / ChoCH)
🔵 Settings
Pivot Period : This defines how sensitive the pivot detection is. A higher number means the algorithm will identify more significant pivot points, resulting in longer-term trendlines.
Alerts
Alert :
Enable or disable the entire alert system
Set a custom alert name
Choose how often alerts trigger (every time, once per bar, or on bar close)
Select the time zone for alert timestamps (e.g., UTC)
Each trendline type supports two alert types :
Break Alert : Triggered when price breaks the trendline
React Alert : Triggered when price reacts or bounces off the trendline
These alerts can be independently enabled or disabled for all trendline categories (Major/Minor, Internal/External, Up/Down).
Display :
For each of the eight trendline types, you can control :
Whether to show or hide the line
Whether to delete the previous line when a new one is drawn
Color, line style (solid, dashed, dotted), extension direction (e.g., right only), and width
Major lines are typically thicker and more opaque, while minor lines appear thinner and more transparent.
All settings are designed to give the user full control over the appearance, behavior, and alert system of the indicator, without requiring manual drawing or adjustments.
🔵 Conclusion
A trendline is more than just a line on the chart—it is a structural, strategic, and flexible tool in technical analysis that can serve as the foundation for understanding price behavior and making trading decisions. Whether in trending markets or during corrections, trendlines help traders identify market direction, key zones, and high-potential entry and exit points with precision.
The accuracy and effectiveness of a trendline depend on using structurally valid pivot points and adhering to proper market logic, rather than relying on guesswork or personal bias.
This indicator is built to solve that exact problem. It automatically detects and draws multiple types of trendlines based on actual price structure, separating them into Major/Minor and Internal/External categories, and respecting professional analytical principles such as pivot type, trend direction, and structural location.
