™TradeChartist Entry/Exit Indicator™TradeChartist Entry/Exit Indicator is an easy to use indicator that plots very high probability BUY and SELL signals on the chart along with an optional dynamic trigger line for SELL and BUY which can be used as a reference for Stop Loss/ Trailing Stop Loss.
What does the ™TradeChartist Entry/Exit Indicator do?
Plots very high probability BUY and SELL signals on chart
Plots dynamic BUY or SELL trigger lines that can be used to
---------1. Set Stop Loss reference or Trailing Stop Loss.
---------2. Anticipate change in trend/momentum when price breaches the trigger line.
Plots BUY and SELL price lines which are Candle open prices when BUY/SELL signals are posted.
Alert traders when BUY/SELL signal is generated and Trigger for BUY/SELL is breached.
Plots Background vertical Signal break lines at BUYs in green and at SELLs in red.
Plots % Gains based on candle close in real-time and based on candle high for BUY/candle low for SELL on previous candles calculated from the candle open price at BUY/SELL.
Plots RSI colour candles based on user preferred Overbought and Oversold RSI levels from indicator settings.
Paints background colour for BUY and SELL zones which can be changed from indicator settings under Style tab to personalise the chart screen.
What markets can this indicator be used on?
Forex
Stocks
Commodities
Cryptocurrencies
and almost any asset on Trading View
Works really well when there is good volume, volatility or both in the asset observed/traded.
Does this indicator repaint?
No and Yes
Once the confirmed BUY (in green) and SELL (in red) signals are posted after a candle close, it doesn't repaint.
Repainting happens for real time BUY and SELL trigger plots on the current candle as price tries to breach the trigger line.
For confirmed BUY and SELL alerts, use alerts on candle close. Real-time BUY and SELL trigger alerts can also be set.
Does the indicator send alerts when a signal is generated?
Yes, traders can get alerts by setting Trading View alerts for BUY/SELL Signals and BUY/SELL Triggers. For confirmed BUY/SELL alerts, 'Once per bar close' must be used.
Why are there two Signal Generator types in the indicator settings?
The two types of signal generators cater to almost all types of traders and trade types. Some assets perform well with Type 1 and some assets with Type 2. Also some traders prefer Type 1 and some prefer Type 2 based on variation in frequency of signals on the asset observed. Both types can be used along with 'Use Heikin Ashi Candles' from the indicator settings to have more combinations to test on an asset for maximising gains.
Type 1 on GBPUSD 1hr chart
Type 2 on GBPUSD 1hr chart
Type 1 normally works well with most types of assets.
Should the indicator be used on normal candles or Heikin Ashi candles?
The indicator can be used on either of the candle types. If signals from Heikin Ashi chart needs to be plotted on normal chart, just check 'Use Heikin Ashi Candles' from indicator settings. It may not be exact, but very close as it mimics Heikin Ashi chart trend.
Heikin Ashi charts are recommended to spot trends and reversals but they don't reflect real OHLC values in the candles, so BUY/SELL entry price points may not be ideal using Heikin Ashi charts especially when there are gaps in price action (example Stocks, FOREX, Commodities). For real OHLC prices and to know exact price points for entering/exiting trade, use normal candlestick charts. It is purely for this reason Heikin Ashi chart signals can be mimicked on normal candles using 'Use Heikin Ashi Candles' option from settings without having to switch between the two.
It can be seen from the GOLD 1hr charts above (Heikin Ashi on left and normal candlestick chart on right), the indicator mimics signals sensibly (not copy) and doesn't use same entry values as Heikin Ashi chart to aid the trader with practical trade execution.
How do the Trigger Lines work and should they be used?
Trigger for BUY/SELL lines are coded to adapt to bull and bear power in the asset trading environment and helps the trader to anticipate change in trend based on direction of price momentum when enabled from indicator settings (On by default). Traders can use trigger lines as reference for Stop Loss points. For example, when a BUY signal is posted, the 'Trigger for SELL' can be used as initial Stop Loss reference and as price starts going up, the trigger line starts moving up enabling the trader to use it as a trailing stop loss point which helps secure or lock profits as they act as ideal support/resistance lines based on the type of trade too. BUY/SELL Trigger lines can be enabled or disabled from indicator settings 'Inputs' tab.
Also, the trigger lines can alert traders to anticipate change in trend/momentum when price hits them and it helps them take a position, either Long or Short when confirmed BUY/SELL signal is posted. As price tries to breach the trigger lines, they change from 'Trigger to BUY/SELL' to 'BUY/SELL Triggered' as shown below on 1hr Gold chart. This feature is coded purely to signal the trader a potential change in trend/momentum. The trigger lines also act as strong support/resistance so only a confirmed close above them will ensure a High Probability Trade.
It should also be noted that price tends to test the BUY/SELL trigger lines to see if a breach is possible. A rejection at trigger lines could mean trend continuation in the signal direction. Traders could use other trend indicators like Ichimoku cloud, stoch, TRIX etc. to make an informed trade decision here. In the chart below, the 'BUY triggered' label has changed back to 'Trigger for BUY' as price failed to close above it.
What is the use of 'Plot BUY/SELL Price Line'?
Enabling BUY/SELL price line from settings (On by default) plots the price line corresponding to candle open when BUY/SELL signals were posted on the chart by the indicator. Open price is used as it is close to the trigger lines and is a fair reference point for indicator to calculate the gains plot on chart since BUY/SELL signals.
Can trade gains be plotted on chart and how are they calculated?
To show percentage gains on chart, just enable 'Show % Gains on Chart' from indicator settings (Off by default). As explained above, % gains are calculated from BUY/SELL candle Open price to high (for Long trades) or low (for Short trades) and to current candle close (for both Long and Short trades) as it helps see real-time gains from BUY/SELL candle Open price. The % gains are plotted as below.
0 - 0.75% - ↑ in green
0.75-1.5% - 1% in green
1.51-2.5% - 2% in green
2.51-3.5% - 3% in green
3.51-4.5% - 4% in green
4.51-5.5% - 5% in green
5.51-10.5% - 5+% in green
10.51-20% - 10+% in green
20+% - 20+% in green
Down from Entry - ↓ in red
What are RSI Colour Candles?
RSI Colour Candles are visual candle plots in colour (Blue when RSI>60, Yellow when RSI<30 and On by default) that help trades spot RSI levels at a glance visually from the chart in real-time without the need for another indicator on screen. Traders can also choose the source to be used for plotting RSI colour candles from indicator settings input tab and change candle colours from indicator settings style tab. The length for RSI calculation is 14 and works well for almost any trading scenario and cannot be changed from indicator settings. The default overbought RSI is set at 60 as it helps spot momentum increase and big moves happen above 60 RSI. When deciding to sell or buy, RSI can be tuned from settings to spot decent entry or exit. For example, RSI>80 on a red Heikin Ashi candle (blue body and red border) after an uptrend could signal potential sell-off or RSI<30 on a green Heikin Ashi candle (yellow body and green border) after a down trend could signal a good move up. In the example daily chart of RVN-BTC below, RSI>75 on a red Heikin Ashi candle signalled a potential sell off way before the actual SELL signal plot on chart.
What is the use of Signal Break Line Plot and Paint Background options from indicator settings?
Signal break lines can be useful if traders prefer to switch off BUY/SELL signals from indicator settings to show where previous signals were generated. (On by default)
Paint Background is just a nice to have feature that paints the signal zones to personalise the chart screen. (Off by default). The background paint colours can be changed from indicator settings style tab.
4hr SPX chart below showcases the difference when the Signal Break Lines and Background Paint options are used with BUY/SELL signals switched off.
Important Note:
When using this indicator on a chart, check 'Scale Price Chart Only' and 'Auto (Fits Data to Screen)' by clicking on settings wheel on the bottom right under the chart screen as shown below. If not checked, the chart screen will look like one on the left as shown below.
-----------------------------------------------------------------------------------------
This is not a free to use indicator. Get in touch with me if you would like access to the indicator for a 1 day trial before deciding on a paid access for a period of your choice. Monthly, Quarterly, Half-Yearly and 1 Year access available.
-----------------------------------------------------------------------------------------
ابحث في النصوص البرمجية عن "stop loss"

Momentum Trader Strategy 3.0Momentum Trader 3.0 is a momentum trading strategy which uses volume to confirm market momentum driven moves.
By default it only trades between 0900 and 1530 (designed for futures trading and can be toggled to 24/7)
No repaint issues, what you see is real
Toggles allow you to enable Long or Short independently which may work better or worse for your market
Designed primarily for Day Trading (1-15m interval)
Presently only the Short side is optimized, the Long works but overtrades a bit. I will be adding an option to remove the less useful signals and improve performance.
Momentum Trader is a real and successful momentum strategy (which I use myself). It isn't a miracle 'always win' strategy but it is a steady workhorse. By combining high probability momentum trades and auto stop-losses, it takes a good slice of most rallies, a big slice of the grand drops, and avoids heavy sudden losses.
Momentum Trader can be used in any timeframe. Your success depends on the volatility of the individual market. I recommend trading at 10m and below for high volatility instruments like ES/SPX while low volatility instruments can be traded at the 1h and beyond. At the level of 1D+ it also works as well but naturally as a momentum strategy it may take a while to pivot.
Momentum Trader provides you with 3 long and 2 short entries which represent different levels of risk/reward. Like any real strategy, there can be periods of chop where the strategy will lose (small based on stop-loss) if the market is chopping very quickly back and forth or pivoting suddenly. As a rule, Momentum Trader attempts to avoid most of that by typically flagging trends which are established and confirmed. Different signals give you different degrees of confirmation and thus different risk/reward.

Default Strategy Inputs (Forex / Crypto)The code in this post contains a set of default strategy inputs I use in new projects / backtests in Tradingview.
Full code commentary is available on the Backtest-Rookies website. To comply with house rules, I cannot post the direct link here.
Features
Trade Direction: So that you can limit the strategy for long only, short only or trade in both directions. It is important to note that when you select “Long Only”, you will still see Short signals on the chart. However, they are only used to close a position rather than reverse it. This is the default behaviour for strategies. The same applies to “Short Only”.
Date Ranges: So that you can isolate backtesting to specific periods of interest such as bull or bear markets.
Sessions: So you can easily get an idea of the expected results during your own session. You may also notice that performance of the strategy varies depending on which session it is deployed in.
Some example stop losses: It is not an exhaustive list but it should be enough to provide some inspiration for different types of stops that you can experiment with.
Happy Scripting. I hope the community finds it useful.
RED-E Gamma Range DetectorRED-E Gamma Range Detector
Overview
The RED-E Gamma Range Detector identifies key support and resistance zones based on recent price action and volume distribution, combined with a simple momentum ribbon to help traders visualize trend direction. It's designed to highlight potential areas where price may react, inspired by the concept of gamma exposure levels in options trading.
How It Works
1. Support & Resistance Zones (Green & Red Boxes)
RED-E analyzes the recent price range over a customizable lookback period
It identifies high-probability support levels (green boxes) below current price
It identifies high-probability resistance levels (red boxes) above current price
These zones represent areas where price has historically shown increased activity
2. Gamma Flip Level (Yellow Dashed Line)
The yellow line represents the approximate "gamma flip" - the midpoint of the recent range
Above this line: Price tends to be more stable with range-bound behavior
Below this line: Price tends to be more volatile with trending behavior
This level acts as a key pivot point for market structure
3. Momentum Ribbon (Green/Red Fill)
A simple visual indicator using 9 and 21 period EMAs
Green ribbon: 9 EMA is above 21 EMA (bullish momentum)
Red ribbon: 9 EMA is below 21 EMA (bearish momentum)
Ribbon width shows strength of trend (wider = stronger trend)
How to Use
For Range Trading:
Look for buy signals near green support zones when above gamma flip
Look for sell signals near red resistance zones when above gamma flip
Price tends to bounce between zones in stable conditions
For Trend Trading:
Watch for breakouts above resistance or below support zones
Use the momentum ribbon to confirm trend direction
Wider ribbon gaps indicate stronger directional moves
For Risk Management:
Use support/resistance zones for stop-loss placement
Recognize increased volatility potential below the gamma flip
Adjust position sizing based on your proximity to key zones
Settings
Lookback Period: Number of bars to analyze (default: 20)
Lower values = more responsive to recent price action
Higher values = more stable, longer-term levels
Best Practices
Works best on liquid instruments (major stocks, indices, forex pairs)
Combine with other technical analysis tools for confirmation
Most effective on 1H, 4H, and daily timeframes
Always use proper risk management and stop losses
Why "RED-E"?
RED-E stands for being Ready to identify critical gamma levels, support/resistance zones, and momentum shifts - keeping you prepared for market moves before they happen.
Educational Note
This indicator approximates gamma exposure concepts using price and volume analysis. It does not use actual options data. The term "gamma" refers to the rate of change in options delta and how market makers hedge their positions, which can create support/resistance at certain price levels.
Disclaimer
This indicator is for educational and informational purposes only. It does not guarantee profitable trades. Past performance is not indicative of future results. Always conduct your own analysis and manage risk appropriately. Trading involves substantial risk of loss.
Recommended Categories
Primary Category:
✅ Support and Resistance
Secondary Categories:
✅ Momentum
✅ Trend Analysis
✅ Volatility

Atif's Liquidity Toolkit💎 GENERAL OVERVIEW:
Atif’s Liquidity Toolkit is a price-action-based indicator used to identify Buyside & Sellside Liquidity Levels, Liquidity Sweeps, FVG Sweeps, and Buy/Sell signals, following specific rules from Atif Hussain.
This indicator was developed by Flux Charts in collaboration with Atif Hussain.
🔹Purpose of this indicator:
The purpose of Atif’s Liquidity Toolkit is to help traders understand where liquidity is forming, when it’s being taken, and how momentum shifts immediately afterward. It automates the entire process of identifying buyside & sellside liquidity, detecting liquidity sweeps, and confirming whether displacement followed through a Fair Value Gap. The goal is to give traders a consistent, rule-based framework to interpret market structure.
🎯ATIF’S LIQUIDITY TOOLKIT FEATURES:
Atif’s Liquidity Toolkit indicator includes 6 main features:
Fair Value Gaps
Multi-Timeframe Liquidity Levels
Liquidity Sweeps
Fair Value Gap Sweeps
Buy & Sell Signals with Take-Profit & Stop-Loss Levels
Alerts
1️⃣Fair Value Gaps
🔹What is a Fair Value Gap?:
A Fair Value Gap (FVG) is an area where the market’s perception of fair value suddenly changes. On your chart, it appears as a three-candle pattern: a large candle in the middle, with smaller candles on each side that don’t fully overlap it. A bullish FVG forms when a bullish candle is between two smaller bullish/bearish candles, where the first and third candles’ wicks don’t overlap each other at all. A bearish FVG forms when a bearish candle is between two smaller bullish/bearish candles, where the first and third candles’ wicks don’t overlap each other at all.
Bullish & Bearish FVGs:
In the settings, you can toggle on/off FVGs, choose the invalidation method, adjust the sensitivity, and toggle on FVG Midline & Labels.
🔹Invalidation Method:
The Invalidation Method setting allows traders to choose how an FVG is invalidated. You can choose between Close and Wick.
Close: A candle must close below a bullish FVG or above a bearish FVG to invalidate it.
Wick: A candle’s wick must go below a bullish FVG or above a bearish FVG to invalidate it.
🔹Sensitivity:
The sensitivity setting determines the minimum gap size required for an FVG detection. A higher sensitivity will filter out smaller gaps, while a lower sensitivity will detect more frequent, smaller gaps. Setting the sensitivity to 0 will display all gaps, regardless of their size.
On the left, the sensitivity is 5. On the right, the sensitivity is 0.
🔹Midline:
When enabled, a dashed line is drawn at the center of the FVG.
🔹Labels:
When enabled, a text label will be plotted with the gap, clearly identifying the zone as a FVG.
2️⃣ Multi-Timeframe Liquidity Levels
The indicator automatically detects and plots Buyside Liquidity (BSL) & Sellside Liquidity (SSL) Levels across up to three timeframes simultaneously.
🔹What is Buyside Liquidity?
Buyside Liquidity (BSL) represents price levels where many buy stop orders are sitting, usually from traders holding short positions. When price moves into these areas, those stop-loss orders get triggered and short sellers are forced to buy back their positions. These zones often form above key highs such as the previous day, week, or month. Understanding BSL is important because when price reaches these levels, the sudden wave of buy orders can create sharp reactions or reversals as liquidity is taken from the market.
🔹What is Sellside Liquidity?
Sellside Liquidity (SSL) represents price levels where many sell stop orders are waiting, usually from traders holding long positions. When price drops into these areas, those stop-loss orders are triggered and long traders are forced to sell their positions. These zones often form below key lows such as the previous day, week, or month. Understanding SSL is important because when price reaches these levels, the surge of sell orders can cause sharp reactions or reversals as liquidity is taken from the market.
Atif’s Liquidity Toolkit indicator automatically plots Buyside & Sellside Liquidity levels using the following levels:
Previous Day High (PDH) & Previous Day Low (PDL)
Previous Week High (PWH) & Previous Week Low (PWL)
Previous Month High (PMH) & Previous Month Low (PML)
Asia Session Highs/Lows
London Session Highs/Lows
New York Session Highs/Lows
The session start and end times are not customizable. The following times in EST are used for each session:
Asia Session: 20:00-00:00
London Session: 02:00-05:00
New York Sessions:
NY AM: 09:30-11:00
NY Lunch: 12:00-13:00
NY PM: 14:00-16:00
Users can also plot swing highs/lows using a lookback period and choosing the higher timeframe. Users can choose two custom higher timeframes and also enable swing highs/lows from the current chart’s timeframe.
There are three settings to customize for the current chart’s timeframe and higher timeframes:
Current TF - when toggled on, swing highs/lows will be plotted from the chart’s timeframe using the pivot length input
HTF 1 - when toggled on, swing highs/lows will be plotted from the user-inputted timeframe using the pivot length input
HTF 2 - when toggled on, swing highs/lows will be plotted from the user-inputted timeframe using the pivot length input
The Pivot Length controls how far back the indicator checks to confirm whether a candle’s high or low is a true swing point (also called a “pivot”). When detecting a swing high, the indicator checks if that candle’s high is higher than the highs of the previous X candles and the next X candles. For a swing low, it checks if the candle’s low is lower than the lows of the previous X candles and the next X candles. The number X comes from your Pivot Length setting.
A lower Pivot Length input (for example, 3 or 4) means the indicator only looks at a few candles on each side, so it will detect more swing points, including smaller, less significant ones. A higher Pivot Length input (for example, 20 or 25) makes the indicator look at more candles on each side, so it only marks major turning points that stand out clearly on the chart.
In short:
Low Pivot Length = more frequent, smaller levels (short-term focus)
High Pivot Length = fewer, stronger levels (major swing focus)
The Pivot Length input for each setting (Current TF, HTF 1, and HTF 2) are displayed below in the red boxes:
Each liquidity level is plotted with a text label, making it easy to identify where a level came from. You can turn off the ‘Show Levels’ setting if you don’t want to see the levels on your chart.
Please note: Liquidity Levels play a key role in finding liquidity sweeps, FVG Sweeps, and Buy/Sell signals. Keeping the levels turned off will not stop the indicator from using the levels that are enabled from being used for the other features mentioned.
3️⃣Liquidity Sweeps:
The indicator automatically detects bullish and bearish liquidity sweeps using the liquidity levels you have enabled.
🔹What is a Liquidity Sweep?
A liquidity sweep is a market phenomenon where significant players, such as institutional traders, deliberately drive prices through key levels to trigger clusters of pending buy or sell orders. It’s how the market gathers the liquidity needed for larger participants to enter positions.
Traders often place stop-loss orders around obvious highs and lows, such as the previous day’s, week’s, or month’s levels. When price pushes through one of these areas, it triggers the stops placed there and generates a burst of volume. This often creates a short-term fake-out before the market reverses in the opposite direction.
By detecting these sweeps in real time, traders can identify potential reversal areas or “trap” areas where liquidity has been taken.
🔹Bullish Liquidity Sweep
These occur when price dips below a Sellside Liquidity (SSL) level, taking out the stop-loss orders placed by long traders below that low. The indicator marks a zone around the candle that swept the SSL to highlight where liquidity was removed from the market.
When this happens, it shows that the market just cleared out sell-side liquidity, meaning traders who were long had their stops hit. This is often followed by a reversal or strong reaction upward, because the market no longer has pending liquidity to fill below that level.
🔹Bearish Liquidity Sweep
These occur when price dips above a Buyside Liquidity (BSL) level, taking out the stop-loss orders placed by short seller traders above that high. The indicator marks a zone around the candle that swept the BSL to highlight where liquidity was removed from the market.
When this happens, it shows that the market just cleared out buyside liquidity, meaning short traders had their stops hit. This is often followed by a reversal or strong reaction downward, because the market no longer has pending liquidity to fill above that level.
Under the ‘Liquidity Sweeps’ section in the settings, you can toggle on/off Bullish Regular Sweeps and Bearish Regular Sweeps. You can also customize the line style and color of liquidity levels that have been swept.
🔹How to Use Liquidity Sweeps
Liquidity sweeps are not direct trade signals. They are best used as context when forming a directional bias. A sweep shows that the market has removed liquidity from one side, which can hint at where the next move may develop.
For example:
When Buyside Liquidity (BSL) is swept, it often signals that buy stops have been triggered and the market may be preparing to move lower. Traders may then begin looking for short opportunities.
When Sellside Liquidity (SSL) is swept, it often signals that sell stops have been triggered and the market may be preparing to move higher. Traders may then begin looking for long opportunities.
It’s common practice to use liquidity sweeps as the first step in building a trade idea. Many traders will wait for additional confirmation, such as a fair value gap forming after the sweep, before opening a position.
Under the ‘Liquidity Sweeps’ section in the settings, you can toggle on/off:
Bullish Regular Sweeps - when disabled, Bullish Regular Sweeps won’t appear on your chart.
Bearish Regular Sweeps - when disabled, Bearish Regular Sweeps won’t appear on your chart.
4️⃣Fair Value Gap Sweeps:
The indicator automatically detects bullish and bearish Fair Value Gap sweeps (FVG Sweep) using the liquidity levels you have enabled.
🔹What is a FVG Sweep?
A FVG Sweep is a specific type of liquidity sweep that not only clears liquidity above or below a key level, but also forms a Fair Value Gap (FVG) immediately afterward.
The liquidity sweep shows where stop orders were triggered, areas where the market aggressively took out one side’s liquidity. The formation of a Fair Value Gap right after the sweep confirms that displacement followed. This means that the sweep was not just a stop hunt, but a deliberate move backed by momentum.
In simple terms, a regular liquidity sweep only tells you that liquidity was taken. A FVG Sweep tells you that liquidity was taken and a strong directional move started immediately after, leaving an imbalance in price. That imbalance represents where aggressive buyers or sellers entered the market without enough opposite-side orders to keep price balanced. This combination adds a confirmation and intent behind regular liquidity sweeps.
🔹Bullish FVG Sweep
The indicator automatically detects bullish FVG Sweeps when price takes out a Sellside Liquidity (SSL) level and then forms a bullish FVG within the next few candles. This sequence shows that sellers were stopped out and buyers immediately entered the market with momentum.
🔹Bearish FVG Sweep
The indicator automatically detects bearish FVG Sweeps when price takes out a Buyside Liquidity (BSL) level and then forms a bearish FVG shortly after. This shows that short sellers’ stops were triggered, and new selling pressure entered the market right away.
🔹How to Use FVG Sweeps
Unlike regular liquidity sweeps, FVG Sweeps can be used as trade entries because they confirm both liquidity being cleared and immediate momentum. A regular sweep only shows that stop-losses were triggered, but an FVG Sweep proves that price not only cleared liquidity but also moved away with momentum, leaving behind an imbalance (Fair Value Gap). This shift often marks the start of a new short-term trend.
We’ll cover this in more detail in the Buy and Sell Signal section below, but in short, a bullish FVG Sweep can act as confirmation for a potential long entry after price takes out a low, while a bearish FVG Sweep can confirm a short entry after price takes out a high.
The strongest FVG Sweeps come from extremely sharp reversals. On the chart, they look like a “V” shape for bullish setups or an inverted “V” shape for bearish setups. This shape shows how quickly momentum shifted after liquidity was cleared. When price instantly reverses and leaves a Fair Value Gap behind, it’s a clear sign that buyers or sellers stepped in aggressively and absorbed all available liquidity on the opposite side.
In practice, traders often use FVG Sweeps as a trigger to align their bias. For example, after a bullish FVG Sweep, the focus shifts toward looking for long setups within the new imbalance or during a small retracement into the Fair Value Gap. After a bearish FVG Sweep, traders focus on short setups as price retraces back into the gap before continuing lower. The key takeaway is that FVG Sweeps show conviction.
Under the ‘Liquidity Sweeps’ section in the settings, you can toggle on/off:
Bullish FVG Sweeps - when disabled, Bullish FVG Sweeps won’t appear on your chart.
Bearish FVG Sweeps - when disabled, Bearish FVG Sweeps won’t appear on your chart.
Please Note: the settings you choose to use for Fair Value Gaps, under the ‘Fair Value Gaps’ section, will be used for FVG Sweeps. This is important because if you increase the sensitivity value for FVGs, not all FVG Sweeps will appear if the FVG’s size doesn’t meet the sensitivity threshold.
5️⃣Buy & Sell Signals:
This indicator also plots Buy & Sell signals. These signals follow logic based on Atif Hussain’s FVG trading model. The entry requirements for a Long & Short signal are outlined below.
🔹Buy Signal:
In order for a Buy Signal to generate, the following conditions must occur in order:
Bullish FVG Sweep
Price Retraces to the Bullish FVG
🔹Sell Signal:
In order for a Buy Signal to generate, the following conditions must occur in order:
Bearish FVG Sweep
Price Retraces to the FVG
🔹Require Retracement:
Under the ‘Signals’ section in the settings, you can toggle on/off the ‘Require Retracement’ setting. When disabled, a long/short signal will appear immediately after a Bullish or Bearish FVG Sweep, instead of waiting for price to retrace back to the gap.
Please Note: the liquidity levels you enable under the ‘Liquidity Levels’ section will be the levels used for signals. Thus, if you only have the Previous Day Highs/Lows enabled, then only those levels will be used to generate buy/sell signals. Also, long Signals will only appear if Bullish FVG Sweeps are enabled, and Short Signals will only appear if Bearish FVG Sweeps are enabled.
When a Buy Signal or Sell Signal is plotted, three suggested take-profit levels and one suggested stop-loss level are plotted. There are two different Take-Profit methods you can choose from within the indicator settings: Manual or Auto.
🔹Manual Take-Profit:
If you’re using manual take-profit levels, you can customize the Risk-to-Reward (RR) for Take-Profit 1, 2, and 3 by adjusting the “RR 1”, “RR 2”, and “RR 3” settings. Setting RR 1 to 1 means take-profit 1 is a 1:1 risk-to-reward ratio. The stop-loss will always be placed at the recent low for Buy Signals, and at the recent high for Sell Signals.
🔹Auto Take-Profit:
If you select to use Auto Take-Profit instead of Manual, then Take-Profit 1, 2, and 3 will be automatically determined based on nearby liquidity levels. The stop-loss will be placed at the recent low for Buy Signals, and at the recent high for Sell Signals. Take-Profit Levels 1, 2, and 3 will be placed at the three closest opposite liquidity levels. If the take-profit 2 and take-profit 3 levels are too far away, only one take-profit level will be displayed.
🔹Signal Settings:
Long Signals:
When enabled, long signals are shown. When disabled, long signals will not appear.
Short Signals:
When enabled, short signals are shown. When disabled, short signals will not appear.
Require Retracement:
When enabled, price must retrace to a FVG after a FVG Sweep in order for a signal to be generated.
Take-Profit Levels:
When enabled, take-profit levels (TP 1, TP 2, and TP 3) are shown with long/short signals. When disabled, take-profit levels and their price labels are not displayed.
Take-Profit Labels:
When enabled, take-profit labels are displayed when price reaches one of the three take-profit levels. When disabled, labels won’t appear when price reaches take-profit levels.
Stop-Loss Levels:
When enabled, stop-loss levels are shown for long/short signals. When disabled, the stop-loss level and its price label are not displayed.
Stop-Loss Labels:
When enabled, stop-loss levels are shown for long/short signals. When disabled, a label won’t appear when price reaches the stop-loss level.
6️⃣Alerts:
The indicator supports alerts, so you never miss a key market move. You can choose to receive alerts for each of the following conditions:
Bearish Liquidity Sweep
Bullish Liquidity Sweep
Bearish FVG Sweep
Bullish FVG Sweep
Long Signal
Short Signal
TP 1
TP 2
TP 3
Stop-Loss
‼️Important Notes:
TradingView has limitations when running features on multiple timeframes, such as the liquidity levels, which can result in the following error:
🔹Computation Error:
The computation of using MTF features are very intensive on TradingView. This can sometimes cause calculation timeouts. When this occurs, simply force the recalculation by modifying one indicator’s settings or by removing the indicator and adding it to your chart again.
🚩 UNIQUENESS:
This indicator is unique because it identifies a specific type of liquidity event referred to as FVG Sweeps, where price takes liquidity and then immediately forms a Fair Value Gap in the opposite direction. These FVG Sweeps serve as the foundation of the model, and the script uses them as the required condition for generating Buy and Sell signals. Once an FVG Sweep is confirmed, the indicator automatically produces a fully defined trade idea with a stop-loss and up to three take-profit targets, following a consistent rule-based execution approach.

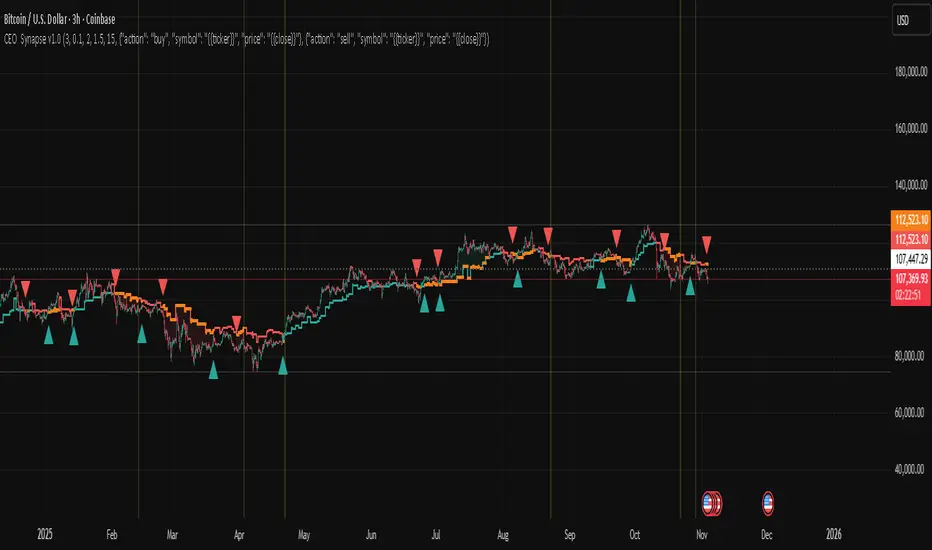
CEO Synapse v1.0CEO Synapse — Uyarlanabilir Rejim Stratejisi
This script is invite-only.
What Does This Strategy Do?
Markets are complex systems requiring various expertise. The "CEO Synapse" strategy adopts a "digital dashboard" approach based on the reality that a single viewpoint is insufficient. The strategy combines multiple analytical engines, each developed by me, analyzing different aspects of the market (structure, momentum, rhythm). It detects trend and momentum deviations in markets. A trading decision is made only when there is consensus among these expert engines. The "Synapse Engine" uses adaptive filtering and consensus logic for position management based on market regime (trend/range).
It eliminates the problem of traditional indicators generating misleading signals alone and failing to adapt to volatility and regime changes. Its dynamic threshold mechanism, adaptive periods, and special noise filters reduce unnecessary trades.
Original Methodology and Proprietary Logic: This algorithm does not rely on or copy any open source strategy code. The system uses commonly accepted indicators' mathematical principles such as ADX, EMA, SMA, ATR, True Range, etc., as data sources. The author's methodology combines dynamic period EMA, multi-filter consensus, adaptive threshold, and regime-based execution.
Though our strategy creates an original decision-making mechanism, it leverages foundational building blocks of technical analysis. The traditional indicators we use and their purposes are:
ADX (Average Directional Index): This indicator measures a trend’s strength, not its direction. Our strategy uses ADX as a filter to open positions only under sufficiently strong and distinct trend market conditions. This largely prevents misleading signals in weak or sideways markets.
Moving Averages (EMA and SMA): They form the backbone to determine the main trend direction. By smoothing price data, they reduce noise and reveal the market's general trend. But our strategy processes their outputs not as traditional crossover signals, but as input to an advanced consensus logic with dynamically adjusted periods based on market rhythm combined with other filters.
ATR (Average True Range): This indicator does not produce direct buy-sell signals but measures current market volatility. Especially in "Sideways Market" regime, take profit and stop loss levels are dynamically set based on ATR instead of fixed values, enabling risk management to adapt to market conditions.
Bollinger Band Logic (using Standard Deviation): Though the strategy does not plot Bollinger Bands directly, it uses Standard Deviation, the underlying mathematical concept, to detect excessive price deviations and volatility spikes, producing critical signals for the AMF PG core engine.
"Synapse Engine" consists of two layers: Decision Center (Dynamic Threshold) which automatically adjusts risk appetite based on performance and regime; and Filter Committee (Consensus Score) which weights separate filters to produce a single score. This combination is not reproducible and commercially valuable. Closed source is mandatory.
No classic open source code used. Only publicly available indicators are used. Parameters, order, and usage are fully customized.
Generated Signals: Trend/range entry/exit (long/short), adaptive trailing stop position management, additional risk control signals with Shock Absorber and Quantum Filter.
Purpose: Detect trend breaks and momentum deviations. Components: Volatility filters, adaptive signal weighting, EMA/SMA. Methodology: Combines price and volume change rates via dynamic weighting functions.
What Problem Does CEO Synapse Solve?
CEO Synapse addresses three main issues caused by traditional technical analysis and single indicator usage:
Problem: Misleading Signals and Market Noise
Traditional indicators (MACD, RSI, etc.) generate many "false" buy-sell signals, especially in sideways and choppy markets, causing traders to constantly enter and exit positions (whipsaw) and incur losses.
CEO Synapse Solution: The strategy never relies on a single signal. The Consensus-Based Decision Mechanism ensures no position is opened unless different analytical engines (structural, momentum, rhythm) agree. This "board of directors" approach filters market noise, processing only high-probability signals.
Problem: Static Analysis and Changing Market Conditions
Markets constantly change character; sometimes strong trend, sometimes narrow range. Most strategies try to function with fixed parameters across all conditions, leading to failure.
CEO Synapse Solution: The strategy has Adaptive Regime Switching. It actively analyzes whether the market is in "Trend Mode" or "Sideways Market Mode" and automatically adjusts entry/exit rules and risk management (take profit/stop loss) to the current regime, allowing chameleon-like adaptation to conditions.
Problem: Fixed Parameters and Declining Performance
Many traders believe they find the "best" settings and never change them for months or years. But as market volatility and cycles change, fixed settings lose effectiveness.
CEO Synapse Solution: The strategy operates on Full Adaptation principle.
Market Rhythm Adaptation: Dynamically adjusts analysis speed (e.g., EMA periods) according to market’s natural cycles.
Performance Adaptation: Continuously optimizes risk appetite (signal threshold) based on recent strategy performance, becoming bolder with gains and more cautious with losses.
In summary, CEO Synapse simplifies decision-making, eliminates market noise, and smartly adapts to changing market conditions, protecting the user from common mistakes.
Why "Invite-Only"?
Offering CEO Synapse as "Invite-Only" is a strategic decision to protect the strategy's commercial value and intellectual property and to provide users with the highest quality experience. Key reasons:
Protection of Proprietary IP:
CEO Synapse is the result of hundreds of hours of research, development, and testing. Its consensus logic, adaptive threshold mechanism, and engine integration are unique and patented. Open sourcing it would instantly destroy this trade secret and competitive edge.
Maintaining Performance Integrity and Effectiveness:
Uncontrolled distribution could lead to misuse or signal theft and sale by malicious actors. The invite-only model preserves the strategy’s integrity and ensures access only for serious investors.
Quality User Experience and Support:
Controlled distribution allows better user experience. High-quality documentation explaining features and best practices can be provided, and future updates and support services can be managed better for a limited user base.
Business Model:
CEO Synapse is positioned as a premium analysis tool. Invite-only access reflects its value and compensates the developer for ongoing maintenance, support, and future improvements.
Usage: Available on all timeframes.
Based entirely on my own adaptive filtering methodology.
Proprietary logic: The algorithm’s unique, non-reproducible logic and methodology. Example: Multi-filter consensus + adaptive threshold + regime-based execution.
Why Is This a Premium Tool?
"CEO Synapse"’s value stems from being a proprietary, integrated system beyond free standard indicators:
Advanced Noise Filtering: Not just reduces noise but adjusts filter sensitivity to current market character. Inspired by public mathematical concepts (cycle analysis, statistical filtering) but uniquely combined with proprietary weighting mechanisms and adaptive consensus logic forming the strategy's commercial value. Core indicators (EMA, ATR, ADX, DMI, etc.) are uniquely processed inside this proprietary system.
Full Adaptation: Instead of fixed parameters, the strategy continuously adapts to the market's natural rhythm, volatility, and past performance.
Consensus-Based Decision Making: Relies on collective intelligence of multiple analytical engines, not a single failure point.
These features substantially increase the ability to extract meaningful, actionable insights from raw market data, making it premium. It improves signal accuracy, reduces risk, and adapts to regime shifts. The dynamic threshold mechanism continuously adjusts risk appetite based on recent performance (profitability) and market regime.
By using this script, you agree not to redistribute, sell, or reverse engineer the source code.
This strategy is for educational purposes only. Past performance does not guarantee future results. Always apply proper risk management and protect your capital.
Risk Management: Maximum Drawdown Protection
The strategy includes a built-in capital protection mechanism. Users can specify the percentage drop from peak capital they tolerate. If the capital hits this drawdown limit, protection activates, closing all open positions and blocking new trades, acting as an emergency brake to guard capital against unexpected market conditions.
Automation Ready: Customizable Webhook Alerts
Fully Compatible Automation (JSON): The strategy outputs fully configurable JSON-formatted alert messages for buy, sell, and close actions. This allows connecting CEO Synapse signals to automation platforms like 3Commas and PineConnector for fully automated trading. Dynamic values like position size ({{strategy.order.contracts}}) are automatically included in alerts.
Strategy Backtest Information
Please remember past performance is not indicative of future results. The published chart and report are based on the BTCUSD pair in a 3-hour timeframe with the following settings:
Test Period: January 1, 2018 – November 3, 2025
Default Position Size: 15% of capital
Pyramiding: Off
Commission: 0.0008
Slippage: 2 ticks
Test Approach: The published test contains 201 trades and is statistically significant. Performing your own tests on different assets and timeframes is strongly recommended. Default settings are a template and should be adjusted per your analysis.
Pinbar MTF - No Repaint# Pinbar MTF - No Repaint Indicator
## Complete Technical Documentation
---
## 📊 Overview
**Pinbar MTF (Multi-Timeframe) - No Repaint** is a professional-grade TradingView Pine Script indicator designed to detect high-probability pinbar reversal patterns with advanced filtering systems. The indicator is specifically engineered to be **100% non-repainting**, making it reliable for both live trading and backtesting.
### Key Features
✅ **Non-Repainting** - Signals only appear AFTER bar closes, never disappear
✅ **Three-Layer Filter System** - ATR, SWING, and RSI filters
✅ **Automatic SL/TP Calculation** - Based on risk:reward ratios
✅ **Real-time Alerts** - TradingView notifications for all signals
✅ **Visual Trade Management** - Lines, labels, and areas for entries, stops, and targets
✅ **Backtesting Ready** - Reliable historical data for strategy testing
---
## 🎯 What is a Pinbar?
A **Pinbar (Pin Bar/Pinocchio Bar)** is a single candlestick pattern that indicates a potential price reversal:
### Bullish Pinbar (BUY Signal)
- **Long lower wick** (rejection of lower prices)
- **Small body at the top** of the candle
- Shows buyers rejected sellers' attempt to push price down
- Forms at support levels or swing lows
- Entry signal for LONG positions
### Bearish Pinbar (SELL Signal)
- **Long upper wick** (rejection of higher prices)
- **Small body at the bottom** of the candle
- Shows sellers rejected buyers' attempt to push price up
- Forms at resistance levels or swing highs
- Entry signal for SHORT positions
---
## 🔧 How the Indicator Works
### 1. **Pinbar Detection Logic**
The indicator analyzes the **previous closed bar ** to identify pinbar patterns:
```
Bullish Pinbar Requirements:
- Lower wick > 72% of total candle range (adjustable)
- Upper wick < 28% of total candle range
- Close > Open (bullish candle body)
Bearish Pinbar Requirements:
- Upper wick > 72% of total candle range (adjustable)
- Lower wick < 28% of total candle range
- Close < Open (bearish candle body)
```
**Why check ?** By analyzing the previous completed bar, we ensure the pattern is fully formed and won't change, preventing repainting.
---
### 2. **Three-Layer Filter System**
#### 🔍 **Filter #1: ATR (Average True Range) Filter**
- **Purpose**: Ensures the pinbar has significant size
- **Function**: Only signals if pinbar range ≥ ATR value
- **Benefit**: Filters out small, insignificant pinbars
- **Settings**:
- Enable/Disable toggle
- ATR Period (default: 7)
**Example**: If ATR = 50 pips, only pinbars with 50+ pip range will signal.
---
#### 🔍 **Filter #2: SWING Filter** (Always Active)
- **Purpose**: Confirms pinbar forms at swing highs/lows
- **Function**: Validates the pinbar is an absolute high/low
- **Benefit**: Identifies true reversal points
- **Settings**:
- Swing Candles (default: 3)
**How it works**:
- For bullish pinbar: Checks if low is lowest of past 3 bars
- For bearish pinbar: Checks if high is highest of past 3 bars
**Example**: With 3 swing candles, a bullish pinbar must have the lowest low among the last 3 bars.
---
#### 🔍 **Filter #3: RSI (Relative Strength Index) Filter**
- **Purpose**: Confirms momentum conditions
- **Function**: Prevents signals in extreme momentum zones
- **Benefit**: Avoids counter-trend trades
- **Settings**:
- Enable/Disable toggle
- RSI Period (default: 7)
- RSI Source (Close, Open, High, Low, HL2, HLC3, OHLC4)
- Overbought Level (default: 70)
- Oversold Level (default: 30)
**Logic**:
- Bullish Pinbar: Only signals if RSI < 70 (not overbought)
- Bearish Pinbar: Only signals if RSI > 30 (not oversold)
---
### 3. **Stop Loss Calculation**
Two methods available:
#### Method A: ATR-Based Stop Loss (Recommended)
```
Bullish Pinbar:
SL = Pinbar Low - (1 × ATR)
Bearish Pinbar:
SL = Pinbar High + (1 × ATR)
```
**Benefit**: Dynamic stops that adapt to market volatility
#### Method B: Fixed Pips Stop Loss
```
Bullish Pinbar:
SL = Pinbar Low - (Fixed Pips)
Bearish Pinbar:
SL = Pinbar High + (Fixed Pips)
```
**Settings**:
- Calculate Stop with ATR (toggle)
- Stop Pips without ATR (default: 5)
---
### 4. **Take Profit Calculation**
Take Profit is calculated based on Risk:Reward ratio:
```
Bullish Trade:
TP = Entry + (Entry - SL) × Risk:Reward Ratio
Bearish Trade:
TP = Entry - (SL - Entry) × Risk:Reward Ratio
```
**Example**:
- Entry: 1.2000
- SL: 1.1950 (50 pip risk)
- RR: 2:1
- TP: 1.2100 (100 pip reward = 50 × 2)
**Settings**:
- Risk:Reward Ratio (default: 1.0, range: 0.1 to 10.0)
---
## 📈 Visual Elements
### On-Chart Displays
1. **Signal Markers**
- 🟢 **Green Triangle Up** = Bullish Pinbar (BUY)
- 🔴 **Red Triangle Down** = Bearish Pinbar (SELL)
- Placed directly on the pinbar candle
2. **Entry Labels**
- Green "BUY" label with entry price
- Red "SELL" label with entry price
- Shows exact entry level
3. **Stop Loss Lines**
- 🔴 Red horizontal line
- "SL" label
- Extends 20 bars forward
4. **Take Profit Lines**
- 🟢 Green horizontal line
- "TP" label
- Extends 20 bars forward
5. **Risk/Reward Areas** (Optional)
- Red shaded box = Risk zone (Entry to SL)
- Green shaded box = Reward zone (Entry to TP)
- Visual risk:reward visualization
6. **Info Table** (Top Right)
- Displays current settings
- Shows filter status (ON/OFF)
- Real-time RSI value
- Quick reference panel
---
## 🔔 Alert System
Three alert types available:
### 1. Combined Alert: "Pinbar Signal (Any Direction)"
- Fires for BOTH bullish and bearish pinbars
- **Best for**: General monitoring
- **Message**: "Pinbar Signal Detected on {TICKER} at {PRICE}"
### 2. Bullish Alert: "Bullish Pinbar Alert"
- Fires ONLY for BUY signals
- **Best for**: Long-only strategies
- **Message**: "BUY Signal on {TICKER} at {PRICE}"
### 3. Bearish Alert: "Bearish Pinbar Alert"
- Fires ONLY for SELL signals
- **Best for**: Short-only strategies
- **Message**: "SELL Signal on {TICKER} at {PRICE}"
---
## ⚙️ Input Parameters Reference
### **Filters Group**
| Parameter | Default | Range | Description |
|-----------|---------|-------|-------------|
| ATR Filter on Pinbar Range? | ✅ ON | Boolean | Enable/disable ATR filter |
| ATR Period | 7 | 1+ | Lookback period for ATR calculation |
| Swing Candles | 3 | 1+ | Bars to check for swing high/low |
| RSI Filter on Pinbar? | ❌ OFF | Boolean | Enable/disable RSI filter |
| RSI Period | 7 | 2+ | Lookback period for RSI calculation |
| RSI Source | Close | Multiple | Price data for RSI (Close/Open/High/Low/etc) |
| RSI Overbought Level | 70 | 50-100 | Upper threshold for RSI filter |
| RSI Oversold Level | 30 | 0-50 | Lower threshold for RSI filter |
### **Pinbar Detection Group**
| Parameter | Default | Range | Description |
|-----------|---------|-------|-------------|
| Shadow % vs Body | 72 | 50-95 | Minimum wick size as % of total range |
### **Visualization Group**
| Parameter | Default | Range | Description |
|-----------|---------|-------|-------------|
| Show SL and TP Lines? | ✅ ON | Boolean | Display stop loss and take profit lines |
| Show SL and TP Area? | ❌ OFF | Boolean | Show shaded risk/reward boxes |
### **Risk Management Group**
| Parameter | Default | Range | Description |
|-----------|---------|-------|-------------|
| Risk:Reward Ratio | 1.0 | 0.1-10.0 | Target profit vs risk (1.0 = 1:1, 2.0 = 1:2) |
| Calculate Stop with ATR? | ✅ ON | Boolean | Use ATR for stop calculation |
| Stop Pips without ATR | 5 | 1+ | Fixed pip stop when ATR disabled |
---
## 🚫 Non-Repainting Architecture
### What is Repainting?
**Repainting** occurs when an indicator's historical signals differ from what appeared in real-time. This makes backtesting unreliable and can lead to false confidence in a strategy.
### How This Indicator Prevents Repainting
1. **Closed Bar Analysis**
- All calculations use ` ` offset (previous bar)
- Only analyzes COMPLETED candles
- Signals appear on the bar AFTER the pinbar closes
2. **Confirmed Swing Points**
- Waits for sufficient bar history before signaling
- Only checks historical bars that cannot change
- Prevents premature swing detection
3. **Static Alert Timing**
- Alerts fire only after bar completion
- No conditional logic that changes historically
- Same results in replay mode and live trading
### Verification Method
To verify non-repainting behavior:
1. Apply indicator to chart
2. Note signal locations and prices
3. Refresh browser / reload chart
4. **Signals remain in exact same locations**
---
## 💼 Trading Strategy Guidelines
### Entry Rules
**For Bullish Pinbar (LONG):**
1. Wait for green triangle to appear
2. Enter at close of pinbar (shown in label)
3. Alternative: Enter on break of pinbar high
4. Place stop loss at red SL line
5. Set target at green TP line
**For Bearish Pinbar (SHORT):**
1. Wait for red triangle to appear
2. Enter at close of pinbar (shown in label)
3. Alternative: Enter on break of pinbar low
4. Place stop loss at red SL line
5. Set target at green TP line
### Risk Management
- **Position Sizing**: Risk only 1-2% of account per trade
- **Stop Loss**: Always use the calculated SL (never move it wider)
- **Take Profit**: Use calculated TP or trail stop after 1:1 RR
- **Multiple Timeframes**: Confirm signals on higher timeframe
### Best Practices
✅ **DO:**
- Wait for bar to close before entering
- Trade in direction of higher timeframe trend
- Use on liquid markets with clear support/resistance
- Combine with price action analysis
- Keep a trading journal
❌ **DON'T:**
- Enter before bar closes (prevents seeing full pattern)
- Trade against strong trends
- Ignore the filters (they improve win rate)
- Risk more than 2% per trade
- Trade every signal (be selective)
---
## 📊 Backtesting & Data Export
### Available Data Points
The indicator exports these values for strategy development:
| Output | Description |
|--------|-------------|
| Bullish Signal | 1 = BUY signal, 0 = No signal |
| Bearish Signal | 1 = SELL signal, 0 = No signal |
| Bull SL | Stop loss level for long trades |
| Bull TP | Take profit level for long trades |
| Bull Entry | Entry price for long trades |
| Bear SL | Stop loss level for short trades |
| Bear TP | Take profit level for short trades |
| Bear Entry | Entry price for short trades |
### How to Use in Strategy
These values can be accessed by Pine Script strategies using:
```pine
indicator_values = request.security(syminfo.tickerid, timeframe.period,
)
```
---
## 🎓 Understanding the Filters
### Why Use Multiple Filters?
Single-indicator systems often generate too many false signals. This indicator uses a **confluence approach**:
1. **Pinbar Pattern** = Price rejection detected
2. **+ SWING Filter** = Rejection at key level
3. **+ ATR Filter** = Significant move
4. **+ RSI Filter** = Favorable momentum
**Result**: Higher probability setups with better risk:reward
### Filter Optimization
**Conservative Settings** (Fewer, Higher Quality Signals):
- ATR Filter: ON
- Swing Candles: 5
- RSI Filter: ON
- Shadow %: 75%
**Aggressive Settings** (More Signals, More Noise):
- ATR Filter: OFF
- Swing Candles: 2
- RSI Filter: OFF
- Shadow %: 65%
**Balanced Settings** (Recommended):
- ATR Filter: ON
- Swing Candles: 3
- RSI Filter: OFF (or ON for trending markets)
- Shadow %: 72%
---
## 🔍 Troubleshooting
### "No Signals Appearing"
**Possible Causes:**
1. Filters are too strict
2. No pinbars forming on chart
3. Insufficient bar history
**Solutions:**
- Reduce Shadow % to 65%
- Reduce Swing Candles to 2
- Disable ATR or RSI filters temporarily
- Check that chart has enough data loaded
### "Too Many Signals"
**Solutions:**
- Enable ATR filter
- Increase Swing Candles to 4-5
- Enable RSI filter
- Increase Shadow % to 75-80%
### "Signals Appearing Late"
**This is normal behavior!** The indicator:
- Analyzes previous closed bar
- Signals appear on the bar AFTER the pinbar
- This is what prevents repainting
- Signal latency is 1 bar (by design)
---
## 📝 Technical Specifications
**Indicator Type:** Overlay (displays on price chart)
**Pine Script Version:** 5
**Max Labels:** 500
**Max Lines:** 500
**Repainting:** None (100% non-repainting)
**Data Window Values:** 8 exported values
**Alert Types:** 3 (Combined, Bullish, Bearish)
**Performance:**
- Lightweight script (fast execution)
- Works on all timeframes
- Compatible with all markets (Forex, Crypto, Stocks, Futures)
- No data snooping bias
---
## 🎯 Use Cases
### 1. **Swing Trading**
- Timeframe: Daily, 4H
- Filter Settings: All enabled
- Best for: Catching major reversals
### 2. **Day Trading**
- Timeframe: 15m, 1H
- Filter Settings: ATR + SWING only
- Best for: Intraday reversals
### 3. **Scalping**
- Timeframe: 5m, 15m
- Filter Settings: SWING only (aggressive)
- Best for: Quick reversals (requires experience)
### 4. **Position Trading**
- Timeframe: Weekly, Daily
- Filter Settings: All enabled + high RR (2:1 or 3:1)
- Best for: Long-term trend reversal catches
---
## 🏆 Advantages Over Other Pinbar Indicators
✅ **Guaranteed Non-Repainting** - Many pinbar indicators repaint; this one never does
✅ **Automatic SL/TP** - No manual calculation needed
✅ **Multi-Layer Filtering** - Reduces false signals significantly
✅ **Visual Trade Management** - Clear entry, stop, and target levels
✅ **Flexible Configuration** - Adaptable to any trading style
✅ **Alert System** - Never miss a setup
✅ **Backtesting Ready** - Reliable historical data
✅ **Professional Grade** - Suitable for live trading
---
## 📚 Educational Resources
### Recommended Reading on Pinbars
- "The Pin Bar Trading Strategy" by Nial Fuller
- "Price Action Trading" by Al Brooks
- TradingView Education: Price Action Patterns
### Practice Recommendations
1. Paper trade signals for 20+ trades before live trading
2. Backtest on different timeframes and markets
3. Keep detailed records of all trades
4. Analyze winning vs losing setups
5. Refine filter settings based on results
---
## ⚖️ Disclaimer
This indicator is a tool for technical analysis and does not guarantee profits. Trading involves substantial risk of loss. Past performance is not indicative of future results.
- Always use proper risk management
- Never risk more than you can afford to lose
- Consider your trading experience and objectives
- Seek independent financial advice if needed
---
## 📧 Version Information
**Current Version:** 1.0
**Last Updated:** 2024
**Compatibility:** TradingView Pine Script v5
**Status:** Production Ready
---
## 🔄 Future Enhancements (Potential)
Possible future additions:
- Multi-timeframe confirmation option
- Volume filter integration
- Customizable color schemes
- Win rate statistics display
- Partial profit taking levels
- Trailing stop functionality
---
## 📖 Quick Start Guide
### 5-Minute Setup
1. **Add to Chart**
- Open TradingView
- Go to Pine Editor
- Paste the code
- Click "Add to Chart"
2. **Configure Settings**
- Open indicator settings (gear icon)
- Start with default settings
- Enable "Show SL and TP Lines"
3. **Set Alert**
- Right-click indicator name
- Click "Add Alert"
- Select "Pinbar Signal (Any Direction)"
- Configure notification method
4. **Test**
- Scroll back on chart
- Verify signals make sense
- Check that signals don't repaint
5. **Trade** (After Practice!)
- Wait for alert
- Verify signal quality
- Enter, place SL/TP
- Manage trade
---
## 🎯 Final Thoughts
The **Pinbar MTF - No Repaint** indicator is designed for serious traders who value:
- **Reliability** over flashy signals
- **Quality** over quantity
- **Honesty** over false promises
This indicator will NOT:
- Make you rich overnight
- Win every trade
- Replace proper trading education
This indicator WILL:
- Identify high-probability reversal setups
- Save you analysis time
- Provide consistent, non-repainting signals
- Help you develop a systematic trading approach
**Success in trading comes from:**
1. Proper education (60%)
2. Risk management (30%)
3. Technical tools like this indicator (10%)
Use this tool as part of a complete trading plan, not as a standalone solution.

Luxy BIG beautiful Dynamic ORBThis is an advanced Opening Range Breakout (ORB) indicator that tracks price breakouts from the first 5, 15, 30, and 60 minutes of the trading session. It provides complete trade management including entry signals, stop-loss placement, take-profit targets, and position sizing calculations.
The ORB strategy is based on the concept that the opening range of a trading session often acts as support/resistance, and breakouts from this range tend to lead to significant moves.
What Makes This Different?
Most ORB indicators simply draw horizontal lines and leave you to figure out the rest. This indicator goes several steps further:
Multi-Stage Tracking
Instead of just one ORB timeframe, this tracks FOUR simultaneously (5min, 15min, 30min, 60min). Each stage builds on the previous one, giving you multiple trading opportunities throughout the session.
Active Trade Management
When a breakout occurs, the indicator automatically calculates and displays entry price, stop-loss, and multiple take-profit targets. These lines extend forward and update in real-time until the trade completes.
Cycle Detection
Unlike indicators that only show the first breakout, this tracks the complete cycle: Breakout → Retest → Re-breakout. You can see when price returns to test the ORB level after breaking out (potential re-entry).
Failed Breakout Warning
If price breaks out but quickly returns inside the range (within a few bars), the label changes to "FAILED BREAK" - warning you to exit or avoid the trade.
Position Sizing Calculator
Built-in risk management that tells you exactly how many shares to buy based on your account size and risk tolerance. No more guessing or manual calculations.
Advanced Filtering
Optional filters for volume confirmation, trend alignment, and Fair Value Gaps (FVG) to reduce false signals and improve win rate.
Core Features Explained
### 1. Multi-Stage ORB Levels
The indicator builds four separate Opening Range levels:
ORB 5 - First 5 minutes (fastest signals, most volatile)
ORB 15 - First 15 minutes (balanced, most popular)
ORB 30 - First 30 minutes (slower, more reliable)
ORB 60 - First 60 minutes (slowest, most confirmed)
Each level is drawn as a horizontal range on your chart. As time progresses, the ranges expand to include more price action. You can enable or disable any stage and assign custom colors to each.
How it works: During the opening minutes, the indicator tracks the highest high and lowest low. Once the time period completes, those levels become your ORB high and low for that stage.
### 2. Breakout Detection
When price closes outside the ORB range, a label appears:
BREAK UP (green label above price) - Price closed above ORB High
BREAK DOWN (red label below price) - Price closed below ORB Low
The label shows which ORB stage triggered (ORB5, ORB15, etc.) and the cycle number if tracking multiple breakouts.
Important: Signals appear on bar close only - no repainting. What you see is what you get.
### 3. Retest Detection
After price breaks out and moves away, if it returns to test the ORB level, a "RETEST" label appears (orange). This indicates:
The original breakout level is now acting as support/resistance
Potential re-entry opportunity if you missed the first breakout
Confirmation that the level is significant
The indicator requires price to move a minimum distance away before considering it a valid retest (configurable in settings).
### 4. Failed Breakout Detection
If price breaks out but returns inside the ORB range within a few bars (before the breakout is "committed"), the original label changes to "FAILED BREAK" in orange.
This warns you:
The breakout lacked conviction
Consider exiting if already in the trade
Wait for better setup
Committed Breakout: The indicator tracks how many bars price stays outside the range. Only after staying outside for the minimum number of bars does it become a committed breakout that can be retested.
### 5. TP/SL Lines (Trade Management)
When a breakout occurs, colored horizontal lines appear showing:
Entry Line (cyan for long, orange for short) - Your entry price (the ORB level)
Stop Loss Line (red) - Where to exit if trade goes against you
TP1, TP2, TP3 Lines (same color as entry) - Profit targets at 1R, 2R, 3R
These lines extend forward as new bars form, making it easy to track your trade. When a target is hit, the line turns green and the label shows a checkmark.
Lines freeze (stop updating) when:
Stop loss is hit
The final enabled take-profit is hit
End of trading session (optional setting)
### 6. Position Sizing Dashboard
The dashboard (bottom-left corner by default) shows real-time information:
Current ORB stage and range size
Breakout status (Inside Range / Break Up / Break Down)
Volume confirmation (if filter enabled)
Trend alignment (if filter enabled)
Entry and Stop Loss prices
All enabled Take Profit levels with percentages
Risk/Reward ratio
Position sizing: Max shares to buy and total risk amount
Position Sizing Example:
If your account is $25,000 and you risk 1% per trade ($250), and the distance from entry to stop loss is $0.50, the calculator shows you can buy 500 shares (250 / 0.50 = 500).
### 7. FVG Filter (Fair Value Gap)
Fair Value Gaps are price inefficiencies - gaps left by strong momentum where one candle's high doesn't overlap with a previous candle's low (or vice versa).
When enabled, this filter:
Detects bullish and bearish FVGs
Draws semi-transparent boxes around these gaps
Only allows breakout signals if there's an FVG near the breakout level
Why this helps: FVGs indicate institutional activity. Breakouts through FVGs tend to be stronger and more reliable.
Proximity setting: Controls how close the FVG must be to the ORB level. 2.0x means the breakout can be within 2 times the FVG size - a reasonable default.
### 8. Volume & Trend Filters
Volume Filter:
Requires current volume to be above average (customizable multiplier). High volume breakouts are more likely to sustain.
Set minimum multiplier (e.g., 1.5x = 50% above average)
Set "strong volume" multiplier (e.g., 2.5x) that bypasses other filters
Dashboard shows current volume ratio
Trend Filter:
Only shows breakouts aligned with a higher timeframe trend. Choose from:
VWAP - Price above/below volume-weighted average
EMA - Price above/below exponential moving average
SuperTrend - ATR-based trend indicator
Combined modes (VWAP+EMA, VWAP+SuperTrend) for stricter filtering
### 9. Pullback Filter (Advanced)
Purpose:
Waits for price to pull back slightly after initial breakout before confirming the signal.
This reduces false breakouts from immediate reversals.
How it works:
- After breakout is detected, indicator waits for a small pullback (default 2%)
- Once pullback occurs AND price breaks out again, signal is confirmed
- If no pullback within timeout period (5 bars), signal is issued anyway
Settings:
Enable Pullback Filter: Turn this filter on/off
Pullback %: How much price must pull back (2% is balanced)
Timeout (bars): Max bars to wait for pullback (5 is standard)
When to use:
- Choppy markets with many fake breakouts
- When you want higher quality signals
- Combine with Volume filter for maximum confirmation
Trade-off:
- Better signal quality
- May miss some valid fast moves
- Slight entry delay
How to Use This Indicator
### For Beginners - Simple Setup
Add the indicator to your chart (5-minute or 15-minute timeframe recommended)
Leave all default settings - they work well for most stocks
Watch for BREAK UP or BREAK DOWN labels to appear
Check the dashboard for entry, stop loss, and targets
Use the position sizing to determine how many shares to buy
Basic Trading Plan:
Wait for a clear breakout label
Enter at the ORB level (or next candle open if you're late)
Place stop loss where the red line indicates
Take profit at TP1 (50% of position) and TP2 (remaining 50%)
### For Advanced Traders - Customized Setup
Choose which ORB stages to track (you might only want ORB15 and ORB30)
Enable filters: Volume (stocks) or Trend (trending markets)
Enable FVG filter for institutional confirmation
Set "Track Cycles" mode to catch retests and re-breakouts
Customize stop loss method (ATR for volatile stocks, ORB% for stable ones)
Adjust risk per trade and account size for accurate position sizing
Advanced Strategy Example:
Enable ORB15 only (disable others for cleaner chart)
Turn on Volume filter at 1.5x with Strong at 2.5x
Enable Trend filter using VWAP
Set Signal Mode to "Track Cycles" with Max 3 cycles
Wait for aligned breakouts (Volume + Trend + Direction)
Enter on retest if you missed the initial break
### Timeframe Recommendations
5-minute chart: Scalping, very active trading, crypto
15-minute chart: Day trading, balanced approach (most popular)
30-minute chart: Swing entries, less screen time
60-minute chart: Position trading, longer holds
The indicator works on any intraday timeframe, but ORB is fundamentally a day trading strategy. Daily charts don't make sense for ORB.
DEFAULT CONFIGURATION
ON by Default:
• All 4 ORB stages (5/15/30/60)
• Breakout Detection
• Retest Labels
• All TP levels (1/1.5/2/3)
• TP/SL Lines (Detailed mode)
• Dashboard (Bottom Left, Dark theme)
• Position Size Calculator
OFF by Default (Optional Filters):
• FVG Filter
• Pullback Filter
• Volume Filter
• Trend Filter
• HTF Bias Check
• Alerts
Recommended for Beginners:
• Leave all defaults
• Session Mode: Auto-Detect
• Signal Mode: Track Cycles
• Stop Method: ATR
• Add Volume Filter if trading stocks
Recommended for Advanced:
• Enable ORB15 + ORB30 only (disable 5 & 60)
• Enable: Volume + Trend + FVG
• Signal Mode: Track Cycles, Max 3
• Stop Method: ATR or Safer
• Enable HTF Daily bias check
## Settings Guide
The settings are organized into logical groups. Here's what each section controls:
### ORB COLORS Section
Show Edge Labels: Display "ORB 5", "ORB 15" labels at the right edge of the levels
Background: Fill the area between ORB high/low with color
Transparency: How see-through the background is (95% is nearly invisible)
Enable ORB 5/15/30/60: Turn each stage on or off individually
Colors: Assign colors to each ORB stage for easy identification
### SESSION SETTINGS Section
Session Mode: Choose trading session (Auto-Detect works for most instruments)
Custom Session Hours: Define your own hours if needed (format: HHMM-HHMM)
Auto-Detect uses the instrument's natural hours (stocks use exchange hours, crypto uses 24/7).
### BREAKOUT DETECTION Section
Enable Breakout Detection: Master switch for signals
Show Retest Labels: Display retest signals
Label Size: Visual size for all labels (Small recommended)
Enable FVG Filter: Require Fair Value Gap confirmation
Show FVG Boxes: Display the gap boxes on chart
Signal Mode: "First Only" = one signal per direction per day, "Track Cycles" = multiple signals
Max Cycles: How many breakout-retest cycles to track (6 is balanced)
Breakout Buffer: Extra distance required beyond ORB level (0.1-0.2% recommended)
Min Distance for Retest: How far price must move away before retest is valid (2% recommended)
Min Bars Outside ORB: Bars price must stay outside for committed breakout (2 is balanced)
### TARGETS & RISK Section
Enable Targets & Stop-Loss: Calculate and show trade management
TP1/TP2/TP3 checkboxes: Select which profit targets to display
Stop Method: How to calculate stop loss placement
- ATR: Based on volatility (best for most cases)
- ORB %: Fixed % of ORB range
- Swing: Recent swing high/low
- Safer: Widest of all methods
ATR Length & Multiplier: Controls ATR stop distance (14 period, 1.5x is standard)
ORB Stop %: Percentage beyond ORB for stop (20% is balanced)
Swing Bars: Lookback period for swing high/low (3 is recent)
### TP/SL LINES Section
Show TP/SL Lines: Display horizontal lines on chart
Label Format: "Short" = minimal text, "Detailed" = shows prices
Freeze Lines at EOD: Stop extending lines at session close
### DASHBOARD Section
Show Info Panel: Display the metrics dashboard
Theme: Dark or Light colors
Position: Where to place dashboard on chart
Toggle rows: Show/hide specific information rows
Calculate Position Size: Enable the position sizing calculator
Risk Mode: Risk fixed $ amount or % of account
Account Size: Your total trading capital
Risk %: Percentage to risk per trade (0.5-1% recommended)
### VOLUME FILTER Section
Enable Volume Filter: Require volume confirmation
MA Length: Average period (20 is standard)
Min Volume: Required multiplier (1.5x = 50% above average)
Strong Volume: Multiplier that bypasses other filters (2.5x)
### TREND FILTER Section
Enable Trend Filter: Require trend alignment
Trend Mode: Method to determine trend (VWAP is simple and effective)
Custom EMA Length: If using EMA mode (50 for swing, 20 for day trading)
SuperTrend settings: Period and Multiplier if using SuperTrend mode
### HIGHER TIMEFRAME Section
Check Daily Trend: Display higher timeframe bias in dashboard
Timeframe: What TF to check (D = daily, recommended)
Method: Price vs MA (stable) or Candle Direction (reactive)
MA Period: EMA length for Price vs MA method (20 is balanced)
Min Strength %: Minimum strength threshold for HTF bias to be considered
- For "Price vs MA": Minimum distance (%) from moving average
- For "Candle Direction": Minimum candle body size (%)
- 0.5% is balanced - increase for stricter filtering
- Lower values = more signals, higher values = only strong trends
### ALERTS Section
Enable Alerts: Master switch (must be ON to use any alerts)
Breakout Alerts: Notify on ORB breakouts
Retest Alerts: Notify when price retests after breakout
Failed Break Alerts: Notify on failed breakouts
Stage Complete Alerts: Notify when each ORB stage finishes forming
After enabling desired alert types, click "Create Alert" button, select this indicator, choose "Any alert() function call".
## Tips & Best Practices
### General Trading Tips
ORB works best on liquid instruments (stocks with good volume, major crypto pairs)
First hour of the session is most important - that's when ORB is forming
Breakouts WITH the trend have higher success rates - use the trend filter
Failed breakouts are common - use the "Min Bars Outside" setting to filter weak moves
Not every day produces good ORB setups - be patient and selective
### Position Sizing Best Practices
Never risk more than 1-2% of your account on a single trade
Use the built-in calculator - don't guess your position size
Update your account size monthly as it grows
Smaller accounts: use $ Amount mode for simplicity
Larger accounts: use % of Account mode for scaling
### Take Profit Strategy
Most traders use: 50% at TP1, 50% at TP2
Aggressive: Hold through TP1 for TP2 or TP3
Conservative: Full exit at TP1 (1:1 risk/reward)
After TP1 hits, consider moving stop to breakeven
TP3 rarely hits - only on strong trending days
### Filter Combinations
Maximum Quality: Volume + Trend + FVG (fewest signals, highest quality)
Balanced: Volume + Trend (good quality, reasonable frequency)
Active Trading: No filters or Volume only (many signals, lower quality)
Trending Markets: Trend filter essential (indices, crypto)
Range-Bound: Volume + FVG (avoid trend filter)
### Common Mistakes to Avoid
Chasing breakouts - wait for the bar to close, don't FOMO into wicks
Ignoring the stop loss - always use it, move it manually if needed
Over-leveraging - the calculator shows MAX shares, you can buy less
Trading every signal - quality > quantity, use filters
Not tracking results - keep a journal to see what works for YOU
## Pros and Cons
### Advantages
Complete all-in-one solution - from signal to position sizing
Multiple timeframes tracked simultaneously
Visual clarity - easy to see what's happening
Cycle tracking catches opportunities others miss
Built-in risk management eliminates guesswork
Customizable filters for different trading styles
No repainting - what you see is locked in
Works across multiple markets (stocks, forex, crypto)
### Limitations
Intraday strategy only - doesn't work on daily charts
Requires active monitoring during first 1-2 hours of session
Not suitable for after-hours or extended sessions by default
Can produce many signals in choppy markets (use filters)
Dashboard can be overwhelming for complete beginners
Performance depends on market conditions (trends vs ranges)
Requires understanding of risk management concepts
### Best For
Day traders who can watch the first 1-2 hours of market open
Traders who want systematic entry/exit rules
Those learning proper position sizing and risk management
Active traders comfortable with multiple signals per day
Anyone trading liquid instruments with clear sessions
### Not Ideal For
Swing traders holding multi-day positions
Set-and-forget / passive investors
Traders who can't watch market open
Complete beginners unfamiliar with trading concepts
Low volume / illiquid instruments
## Frequently Asked Questions
Q: Why are no signals appearing?
A: Check that you're on an intraday timeframe (5min, 15min, etc.) and that the current time is within your session hours. Also verify that "Enable Breakout Detection" is ON and at least one ORB stage is enabled. If using filters, they might be blocking signals - try disabling them temporarily.
Q: What's the best ORB stage to use?
A: ORB15 (15 minutes) is most popular and balanced. ORB5 gives faster signals but more noise. ORB30 and ORB60 are slower but more reliable. Many traders use ORB15 + ORB30 together.
Q: Should I enable all the filters?
A: Start with no filters to see all signals. If too many false signals, add Volume filter first (stocks) or Trend filter (trending markets). FVG filter is most restrictive - use for maximum quality but fewer signals.
Q: How do I know which stop loss method to use?
A: ATR works for most cases - it adapts to volatility. Use ORB% if you want predictable stop placement. Swing is for respecting chart structure. Safer gives you the most room but largest risk.
Q: Can I use this for swing trading?
A: Not really - ORB is fundamentally an intraday strategy. The ranges reset each day. For swing trading, look at weekly support/resistance or moving averages instead.
Q: Why do TP/SL lines disappear sometimes?
A: Lines freeze (stop extending) when: stop loss is hit, the last enabled take-profit is hit, or end of session arrives (if "Freeze at EOD" is enabled). This is intentional - the trade is complete.
Q: What's the difference between "First Only" and "Track Cycles"?
A: "First Only" shows one breakout UP and one DOWN per day maximum - clean but might miss opportunities. "Track Cycles" shows breakout-retest-rebreak sequences - more signals but busier chart.
Q: Is position sizing accurate for options/forex?
A: The calculator is designed for shares (stocks). For options, ignore the share count and use the risk amount. For forex, you'll need to adapt the lot size calculation manually.
Q: How much capital do I need to use this?
A: The indicator works for any account size, but practical day trading typically requires $25,000 in the US due to Pattern Day Trader rules. Adjust the "Account Size" setting to match your capital.
Q: Can I backtest this strategy?
A: This is an indicator, not a strategy script, so it doesn't have built-in backtesting. You can visually review historical signals or code a strategy script using similar logic.
Q: Why does the dashboard show different entry price than the breakout label?
A: If you're looking at an old breakout, the ORB levels may have changed when the next stage completed. The dashboard always shows the CURRENT active range and trade setup.
Q: What's a good win rate to expect?
A: ORB strategies typically see 40-60% win rate depending on market conditions and filters used. The strategy relies on positive risk/reward ratios (2:1 or better) to be profitable even with moderate win rates.
Q: Does this work on crypto?
A: Yes, but crypto trades 24/7 so you need to define what "session start" means. Use Session Mode = Custom and set your preferred daily reset time (e.g., 0000-2359 UTC).
## Credits & Transparency
### Development
This indicator was developed with the assistance of AI technology to implement complex ORB trading logic.
The strategy concept, feature specifications, and trading logic were designed by the publisher. The implementation leverages modern development tools to ensure:
Clean, efficient, and maintainable code
Comprehensive error handling and input validation
Detailed documentation and user guidance
Performance optimization
### Trading Concepts
This indicator implements several public domain trading concepts:
Opening Range Breakout (ORB): Trading strategy popularized by Toby Crabel, Mark Fisher and many more talanted traders.
Fair Value Gap (FVG): Price imbalance concept from ICT methodology
SuperTrend: ATR-based trend indicator using public formula
Risk/Reward Ratio: Standard risk management principle
All mathematical formulas and technical concepts used are in the public domain.
### Pine Script
Uses standard TradingView built-in functions:
ta.ema(), ta.atr(), ta.vwap(), ta.highest(), ta.lowest(), request.security()
No external libraries or proprietary code from other authors.
## Disclaimer
This indicator is provided for educational and informational purposes only. It is not financial advice.
Trading involves substantial risk of loss and is not suitable for every investor. Past performance shown in examples is not indicative of future results.
The indicator provides signals and calculations, but trading decisions are solely your responsibility. Always:
Test strategies on paper before using real money
Never risk more than you can afford to lose
Understand that all trading involves risk
Consider seeking advice from a licensed financial advisor
The publisher makes no guarantees regarding accuracy, profitability, or performance. Use at your own risk.
---
Version: 3.0
Pine Script Version: v6
Last Updated: October 2024
For support, questions, or suggestions, please comment below or send a private message.
---
Happy trading, and remember: consistent risk management beats perfect entry timing every time.

Synapse Dynamics - Market Structure📊 SYNAPSE DYNAMICS - MARKET STRUCTURE INDICATOR
An educational tool for learning and practicing Smart Money Concepts (SMC) methodology through visual representation of institutional price action patterns.
═══════════════════════════════════════════════════
🎯 WHAT THIS INDICATOR DISPLAYS
This indicator visualizes Smart Money Concepts patterns on your chart:
- Order Blocks (OB) - Supply and demand zones based on institutional order flow theory. The indicator identifies these areas using price action criteria including the final opposing candle before a strong directional move.
- Breaker Blocks - Failed order blocks that may act as support/resistance. These occur when an order block is invalidated but price returns to the zone, potentially reversing its role.
- Fair Value Gaps (FVG) - Three-candle imbalance patterns where price gaps create inefficiencies. The indicator marks these zones for reference in analysis.
- Market Structure - Break of Structure (BOS) and Change of Character (CHoCH) patterns based on swing high/low breaks. These help identify potential trend continuation or reversal points.
- Reference Entry Signals - The indicator calculates potential entry zones with accompanying stop loss and take profit reference levels based on order block and FVG locations. These are for educational reference only.
- Higher Timeframe Context - Optional filter that displays the higher timeframe trend direction to provide additional market context.
- Information Panel - On-screen dashboard showing active reference signals, their status, and relevant price levels.
- Swing Point Mapping - Labels recent higher highs (HH), higher lows (HL), lower highs (LH), and lower lows (LL) based on configurable swing detection parameters.
═══════════════════════════════════════════════════
⚙️ HOW IT WORKS
The indicator uses the following methodology:
**Order Block Detection:** Identifies the last opposing candle before a strong directional move that breaks structure. Filters blocks by size to reduce noise.
**Market Structure Analysis:** Tracks swing points and identifies when price breaks previous highs/lows to determine BOS or CHoCH patterns.
**Fair Value Gap Identification:** Detects three-candle patterns where candle 1's high/low doesn't overlap with candle 3's low/high, creating an imbalance zone.
**Reference Signal Generation:** Combines order block proximity, FVG presence, and market structure breaks to suggest potential study areas. Optional HTF trend filter can be enabled.
**Timeframe Adaptation:** Automatically adjusts swing detection sensitivity based on the chart timeframe (using multipliers for intraday vs. higher timeframes).
═══════════════════════════════════════════════════
📚 EDUCATIONAL PURPOSE & IMPORTANT LIMITATIONS
**This indicator is designed as an educational tool for:**
- Learning Smart Money Concepts methodology
- Practicing pattern recognition
- Understanding institutional price action theories
- Analyzing market structure visually
**Critical Understanding:**
- All signals and levels are REFERENCE POINTS for study - not trading recommendations
- The indicator displays patterns based on historical price action - it cannot predict future movements
- Smart Money Concepts is a theoretical framework - market behavior varies
- Backtested or historical results shown do not guarantee future performance
- No indicator can account for all market variables, news events, or changing conditions
**Proper Use:**
This tool is meant to assist in learning technical analysis concepts. Users must develop their own analysis skills, risk management strategies, and trading plans. The displayed patterns require interpretation within broader market context.
═══════════════════════════════════════════════════
⚙️ CUSTOMIZATION OPTIONS
**Adjustable Parameters:**
- Order Block: Minimum size threshold, maximum count displayed
- Fair Value Gaps: Toggle visibility, maximum count
- Market Structure: Swing detection length, BOS/CHoCH display
- Signals: Entry/SL/TP calculation method, HTF filter toggle
- Visual Settings: Colors, line styles, label sizes, panel position
**Timeframe Compatibility:**
Works on all timeframes from 1-minute to monthly charts. The swing detection automatically scales based on timeframe.
═══════════════════════════════════════════════════
⚠️ DISCLAIMER
This indicator is for educational and informational purposes only. It does not constitute financial advice or trading recommendations. Trading involves substantial risk of loss. Past patterns and historical analysis do not indicate future results. Users are responsible for their own trading decisions and risk management. The author assumes no liability for trading losses.
═══════════════════════════════════════════════════
🔧 ALERT FUNCTIONALITY
Built-in alert conditions notify you when:
- New order blocks are detected
- Market structure changes occur (BOS/CHoCH)
- Reference entry signals appear
Configure alerts through TradingView's alert system.

U.T.M.S v2🇷🇺 ОПИСАНИЕ (РУССКИЙ)
U.T.M.S v2 — Чистый EMA-кроссовер с фильтрами
Стратегия для 15м (в первую очередь) и 1ч таймфреймов.
Генерирует сигналы при пересечении EMA(8) и EMA(19) только при подтверждении тренда, объёма, волатильности и времени суток.
Каждая сделка закрывается по фиксированному Take Profit и Stop Loss.
✅ Минимум ложных входов
✅ Работает только в ликвидные часы
✅ Полная фильтрация шума и флэта
🔧 Настройки:
Fast EMA / Slow EMA — периоды скользящих (по умолчанию 8 / 19)
Take Profit % — уровень фиксации прибыли (рек. 2.5%)
Stop Loss % — уровень стоп-лосса (рек. 2.0%)
Фильтры (все включены по умолчанию):
Use 1H Trend Filter — вход разрешён только по направлению тренда на 1H (EMA50 > EMA200 для лонга)
Use Volume Filter — объём должен быть ≥ 1.5× среднего за 20 баров
Min Volume Multiplier — нижний порог объёма (рек. 1.5)
Max Volume Multiplier — верхний порог (рек. 3.0–4.0), отсекает аномальные пампы
Use ATR Volatility Filter — минимальная волатильность (рек. 0.3%)
Use Time Filter (UTC) — торговля только в часы высокой ликвидности: 12:00–18:00 и 20:00–02:00 UTC
💡 Идеальна для ручной торговли или подключения сигнальных ботов.
🇬🇧 DESCRIPTION (ENGLISH)
U.T.M.S v2 — Clean EMA Crossover with Filters
Strategy for 15m (primarily) and 1h timeframes.
Generates signals when the EMA(8) and EMA(19) cross, only if trend, volume, volatility, and time of day are confirmed.
Each trade is closed with a fixed Take Profit and Stop Loss.
✅ Low noise, high-quality signals
✅ Active only during high-liquidity hours
✅ Fully protected against flat and fakeouts
🔧 Inputs:
Fast EMA / Slow EMA — moving average periods (default: 8 / 19)
Take Profit % — profit target (suggested: 2.5%)
Stop Loss % — stop loss level (suggested: 2.0%)
Filters (all enabled by default):
Use 1H Trend Filter — trades only in 1H trend direction (EMA50 > EMA200 for long)
Use Volume Filter — volume must be ≥ 1.5× 20-bar average
Min Volume Multiplier — minimum volume threshold (suggested: 1.5)
Max Volume Multiplier — maximum volume cap (suggested: 3.0–4.0), filters out pumps/dumps
Use ATR Volatility Filter — minimum volatility (suggested: 0.3%)
Use Time Filter (UTC) — active only during high-liquidity sessions: 12:00–18:00 & 20:00–02:00 UTC
💡 Perfect for manual trading or webhook-based signal bots.

PRO Scalper(EN)
## What it is
**PRO Scalper** is an intraday price–action and liquidity map that helps you see where the market is likely to move **now**, not just where it has been.
It combines five building blocks that professional scalpers often watch together:
1. **Session Volume-Weighted Average Price (VWAP)** — the intraday “fair value” anchor.
2. **Opening Range** — the first minutes of the session that set the day’s balance.
3. **Trend filter** — higher-timeframe bias using **Exponential Moving Averages (EMA)** and optional **Average Directional Index (ADX)** strength.
4. **Two independent Supply/Demand zone engines** — zones are drawn from confirmed swing pivots, with midlines and **touch counters**.
5. **Order-flow style visuals**:
* **Delta bubbles** (green/red circles) show where buying or selling pressure was unusually strong, using a safe **delta proxy** (no external feeds).
* **Liquidity densities** (subtle rectangular bands) highlight clusters of large activity that often act as magnets or barriers and disappear when “eaten” by strong moves.
This mix gives you a **complete intraday picture**: the mean (VWAP), the day’s initial balance (Opening Range), the higher-timeframe push (trend filter), the nearby fuel or brakes (zones), and the live pressure points (bubbles and densities).
---
## Why these components
* **VWAP** tracks where the bulk of traded value sits. Price tends to rotate around it or accelerate away from it — a perfect compass for scalps.
* **Opening Range** frames the early auction. Many intraday breaks, fades and retests start at its boundaries.
* **EMA bias + ADX strength** separates trending conditions from chop, so you can keep only the zones that agree with the bigger push.
* **Pivot-based zones (two pairs at once)** are simple, objective and fast. Midlines help with confirmations; touch counters quantify how many times the zone was tested.
* **Bubbles and densities** add the “effort” layer: where the push appeared and where liquidity is concentrated. You see **where** a move is likely to continue or fail.
Together they reduce ambiguity: **context + level + effort** — all on one screen.
---
## How it works (plain language)
* **VWAP** resets each day and is calculated as the cumulative sum of typical price multiplied by volume divided by total volume.
* **Opening Range** is either automatic (a multiple of your chart timeframe) or a manual number of minutes. While it is forming, the highest high and lowest low are captured and plotted as the range.
* **Trend filter**
* **EMA Fast** and **EMA Slow** define directional bias.
* **ADX (optional)** adds “trend strength”: only when the Average Directional Index is above the chosen threshold do we treat the move as strong. You can source this from a higher timeframe.
* **Zones**
* There are **two independent pairs** of pivots at the same time (for example 10-left 10-right and 5-left 5-right).
* Each detected pivot creates a **Supply** (from a swing high) or **Demand** (from a swing low) box. Box depth = **zone depth × Average True Range** for adaptive sizing; the boxes **extend forward**.
* Midline (optional dashed line inside the box) is the “balance” of the zone.
* **“Only in trend”** mode can hide boxes that go against the higher-timeframe bias.
* The **touch counter** increases when price revisits the box. Labels show the pair name and the number of touches.
* **Bubbles**
* A safe **delta proxy** measures bar pressure (for example, range-weighted close vs open).
* A **quantile filter** shows only unusually large pressure: choose lookback and percentile, and the script draws a circle sized by intensity (green = bullish pressure, red = bearish).
* **Densities**
* The script marks heavy activity clusters as **subtle bands** around price (depth = fraction of Average True Range).
* If price **breaks** a density with volume above its moving average, the band **disappears** (“eaten”), which often precedes continuation.
---
## How to use — practical playbooks
> Recommended chart: crypto or index futures, one to five minutes. Use **one hour** or **fifteen minutes** for the higher-timeframe bias.
### 1) Trend pullback scalp (continuation)
1. Enable **Only in trend** zones.
2. In an uptrend: wait for a pullback into a **Demand** zone that overlaps with VWAP or sits just below the Opening Range midpoint.
3. Look for **green bubbles** near the zone’s bottom or a fresh **density** under price.
4. Enter on a candle closing **back above the zone midline**.
5. Stop-loss: below the bottom of the zone or a small multiple of Average True Range.
6. Targets: previous swing high, Opening Range high, fixed risk multiples, or VWAP.
Mirror the logic for downtrends using Supply zones, red bubbles and densities above price.
### 2) Reversion with liquidity sweep (fade)
1. Bias neutral or countertrend allowed.
2. Price **wicks through** a zone boundary (or an Opening Range line) and **closes back inside** the zone.
3. The bubble color often flips (absorption).
4. Enter toward the **inside** of the zone; stop beyond the sweep wick; first target = zone midline, second = opposite side of the zone or VWAP.
### 3) Opening Range break and retest
1. Wait for the Opening Range to complete.
2. A break with a large bubble suggests intent.
3. Look for a **retest** into a nearby zone aligned with VWAP.
4. Trade continuation toward the next zone or the session extremes.
### 4) Density “eaten” continuation
1. When a density band **disappears** on high volume, it often means the resting liquidity was consumed.
2. Trade in the direction of the break, toward the nearest opposing zone.
---
## Settings — quick guide
**Core**
* *ATR Length* — used for zone and density depths.
* *Show VWAP / Show Opening Range*.
* *Opening Range*: Auto (multiple of timeframe minutes) or Manual minutes.
**Trend Filter**
* *Mode*: Off, EMA only, or EMA with ADX strength.
* *Use higher timeframe* and its value.
* *EMA Fast / EMA Slow*, *ADX Length*, *ADX threshold*.
* *Plot EMA filter* to display the moving averages.
**Zones (two pairs)**
* *Pivot A Left / Right* and *Pivot B Left / Right*.
* *Zone depth × ATR*, *Extend bars*.
* *Show zone midline*, *Only in trend zones*.
* Labels automatically show the touch counters.
**Bubbles**
* *Show Bubbles*.
* *Quantile lookback* and *Quantile percent* (higher percent = stricter filter, fewer bubbles).
**Densities**
* *Metric*: absolute delta proxy or raw volume.
* *Quantile lookback / percent*.
* *Depth × ATR*, *Extend bars*, *Merge distance* (in ATR),
* *Break condition*: volume moving average length and multiplier,
* *Midline for densities* (optional dashed line).
---
## Tips and risk management
* This script **does not use external order-flow feeds**. Delta is a **proxy** suitable for TradingView; tune quantiles per symbol and timeframe.
* Do not trade every bubble. Combine **context (trend + VWAP + Opening Range)** with **level (zone)** and **effort (bubble/density)**.
* Set stop-losses beyond the zone or at a fraction of Average True Range. Predefine risk per trade.
* Backtest your rules with a strategy script before using real funds.
* Markets differ. Parameters that work on Bitcoin may not transfer to low-liquidity altcoins or stocks.
* Nothing here is financial advice. Scalping is high-risk; slippage and over-trading can quickly damage your account.
---
## What makes PRO Scalper unique
* Two **independent** zone engines run in parallel, so you can see both **larger structure** and **fine intraday levels** at the same time.
* Clean **“only in trend” rendering** — zones and midlines against the bias can be hidden, reducing clutter and hesitation.
* **Touch counters** convert “feel” into numbers.
* **Self-contained order-flow visuals** (bubbles and densities) that require no extra data sources.
* Careful defaults: subtle colors for densities, clearer zones, and responsive auto Opening Range.
---
(RU)
## Что это такое
**PRO Scalper** — это индикатор для внутридневной торговли, который показывает **контекст и ликвидность прямо сейчас**.
Он объединяет пять модулей, которыми профессиональные скальперы пользуются вместе:
1. **VWAP** — средневзвешенная по объему цена за сессию, «справедливая стоимость» дня.
2. **Opening Range** — первая часть сессии, задающая баланс дня.
3. **Фильтр тренда** — направление старшего таймфрейма по **экспоненциальным средним** и при желании по силе тренда **Average Directional Index**.
4. **Две независимые системы зон спроса/предложения** — зоны строятся от подтвержденных экстремумов (пивотов), имеют **среднюю линию** и **счетчик касаний**.
5. **Визуализация «ордер-флоу»**:
* **Пузыри дельты** (зеленые/красные круги) — места повышенного покупательного/продажного давления, рассчитанные через безопасный **прокси-дельты**.
* **Плотности ликвидности** (ненавязчивые прямоугольные ленты) — скопления объема, которые нередко притягивают цену или удерживают ее и исчезают, когда «разъедаются» сильным движением.
Итог — **полная картинка момента**: среднее (VWAP), баланс дня (Opening Range), старшая сила (фильтр тренда), ближайшие уровни топлива/тормозов (зоны), текущие точки усилия (пузыри и плотности).
---
## Почему именно эти элементы
* **VWAP** показывает, где сосредоточена стоимость; цена либо вращается вокруг него, либо быстро уходит — идеальный ориентир скальпера.
* **Opening Range** фиксирует ранний аукцион — от его границ часто начинаются пробои, возвраты и ретесты.
* **EMA + ADX** отделяют тренд от «пилы», позволяя оставлять на графике только зоны по направлению старшего таймфрейма.
* **Зоны от пивотов** просты, объективны и быстры; средняя линия помогает подтверждать разворот, счетчик касаний переводит субъективность в цифры.
* **Пузыри и плотности** добавляют слой «усилия»: где именно возник толчок и где сконцентрирована ликвидность.
Комбинация **контекста + уровня + усилия** уменьшает двусмысленность и ускоряет принятие решения.
---
## Как это работает (простыми словами)
* **VWAP** каждый день стартует заново: сумма «типичной цены × объем» делится на суммарный объем.
* **Opening Range** — автоматический (кратный минутам вашего таймфрейма) или вручную заданный период; пока он формируется, фиксируются максимум и минимум.
* **Фильтр тренда**
* Две экспоненциальные средние задают направление.
* **ADX** (по желанию) добавляет «силу». Источник можно взять со старшего таймфрейма.
* **Зоны**
* Одновременно работает **две пары** пивотов (например 10-лево 10-право и 5-лево 5-право).
* От пивота строится зона **предложения** (от максимума) или **спроса** (от минимума). Глубина зоны = **коэффициент × Average True Range**; зона тянется вперед.
* Внутри рисуется **средняя линия** (по желанию).
* Режим **«только по тренду»** скрывает зоны против старшего направления.
* **Счетчик касаний** увеличивается, когда цена снова входит в зону; подпись показывает пару и количество касаний.
* **Пузыри**
* Используется безопасный **прокси-дельты** — измерение «напряжения» внутри свечи.
* Через **квантильный фильтр** выводятся только необычно сильные места: настраиваются окно и процент квантиля; размер кружка — сила, цвет: зеленый покупатели, красный продавцы.
* **Плотности**
* Крупные активности отмечаются **ненавязчивыми прямоугольниками** (глубина — доля Average True Range).
* Если плотность **пробивается** объемом выше среднего, она **исчезает** — часто это предвещает продолжение.
---
## Как пользоваться — практические схемы
> Рекомендация: крипто или фьючерсы, таймфрейм 1–5 минут. Для старшего фильтра удобно взять **1 час** или **15 минут**.
### 1) Скальп на откат по тренду
1. Включите **«только по тренду»**.
2. В восходящем тренде дождитесь отката в **зону спроса**, желательно рядом с **VWAP** или серединой **Opening Range**.
3. Подтверждение — **зеленые пузыри** у нижней границы зоны или свежая **плотность** под ценой.
4. Вход после закрытия свечи **выше средней линии** зоны.
5. Стоп-лосс: за нижнюю границу зоны или небольшой множитель Average True Range.
6. Цели: предыдущий максимум, верх Opening Range, фиксированные R-множители, либо VWAP.
Для нисходящего тренда зеркально: зоны предложения, красные пузыри и плотности над ценой.
### 2) Контрдвижение с «выбиванием ликвидности»
1. Нейтральный или контртрендовый режим.
2. Цена **выносит хвостом** границу зоны (или линию Opening Range) и **закрывается обратно внутри**.
3. Цвет пузыря часто меняется (поглощение).
4. Вход внутрь зоны; стоп — за хвост выбивания; цели: средняя линия, противоположная граница зоны или VWAP.
### 3) Пробой Opening Range + ретест
1. Дождитесь завершения диапазона.
2. Сильный пробой с крупным пузырем — признак намерения.
3. Ищите **ретест** в зоне по тренду рядом с линией диапазона и VWAP.
4. Торгуйте продолжение к следующей зоне.
### 4) Продолжение после «съеденной» плотности
1. Когда прямоугольник плотности **исчезает** на повышенном объеме, это значит, что ликвидность поглощена.
2. Торгуйте в сторону пробоя к ближайшей противоположной зоне.
---
## Настройки — краткая шпаргалка
**Core**
— Длина Average True Range (для размеров зон и плотностей).
— Включение VWAP и Opening Range.
— Длина Opening Range: автоматическая (кратная минутам ТФ) или ручная.
**Trend Filter**
— Режим: выкл., только средние, либо средние + ADX.
— Источник со старшего таймфрейма и его значение.
— Длины средних, длина ADX и порог силы.
— Показать/скрыть линий средних.
**Zones (две пары одновременно)**
— Пара A: лев/прав; Пара B: лев/прав.
— Глубина зоны × Average True Range, продление по барам.
— Средняя линия, режим **«только по тренду»**.
— Подписи со счетчиком касаний.
**Bubbles**
— Вкл./выкл., окно поиска и процент квантиля (чем выше процент — тем реже пузыри).
**Densities**
— Метрика: абсолютная прокси-дельты или чистый объем.
— Окно/квантиль, глубина × Average True Range, продление,
— Порог объединения (в Average True Range),
— Условие «разъедания» по объему,
— Средняя линия плотности (по желанию).
---
## Советы и риски
* Индикатор **не использует внешние потоки ордер-флоу**. Дельта — **прокси**, подходящая для TradingView; подбирайте квантили под инструмент и таймфрейм.
* Не торгуйте каждый пузырь. Склейте **контекст (тренд + VWAP + Opening Range)** с **уровнем (зона)** и **усилием (пузырь/плотность)**.
* Стоп-лосс — за границей зоны или по Average True Range. Риск на сделку задавайте заранее.
* Перед реальными деньгами протестируйте правила в стратегии.
* Разные рынки ведут себя по-разному; настройки из Биткоина могут не подойти малоликвидным альткоинам или акциям.
* Это не инвестиционная рекомендация. Скальпинг — высокий риск; проскальзывание и переизбыток сделок быстро наносят ущерб капиталу.
---
## Чем уникален PRO Scalper
* Две **одновременные** системы зон показывают и **крупную структуру**, и **точные локальные уровни**.
* Режим **«только по тренду»** чистит экран от лишних уровней и ускоряет решение.
* **Счетчики касаний** дают количественную опору.
* **Самодостаточные визуализации усилия** (пузыри и плотности) — без сторонних источников данных.
* Аккуратная цветовая схема: плотности — мягко, зоны — ясно; Opening Range — адаптивный.
Пусть он станет вашей «картой местности» для быстрых и дисциплинированных решений внутри дня.

FVG Buy/Sell [Multi-TF] by akshaykiriti1443The FVG Buy/Sell indicator is a precision trading tool designed for traders who operate with a clear directional bias. It excels at identifying high-probability entry points by detecting when price interacts with Fair Value Gaps (FVGs).
This indicator is built on a core principle: instead of predicting the market's direction, it provides the timing for an entry after you, the trader, have established your market bias. By automatically pinpointing bullish and bearish imbalances on both the current and a higher timeframe, it allows you to wait for the market to pull back to a key level and then provides a clear signal for execution.
The Core Strategy: Bias First, Entry Second
This indicator is most powerful when used as part of a two-step trading process. It is not a standalone signal generator; it is an entry confirmation tool.
Step 1: Determine Your Directional Bias
Before looking for any signals from this indicator, you must first have an opinion on the market's most likely direction. This bias should be derived from your primary analysis method, such as:
The Golden Rule:
If your bias is BULLISH, you will ONLY look for BUY signals generated by bullish (green/blue) FVGs. You will ignore all SELL signals.
If your bias is BEARISH, you will ONLY look for SELL signals generated by bearish (pink/orange) FVGs. You will ignore all BUY signals.
Step 2: Execute with the FVG Tap-In Signal
Once your bias is set, the indicator does the rest of the work. You simply wait for the price to pull back into an FVG zone that aligns with your bias and then wait for the confirmation arrow to appear.
A green up arrow confirms that price has tapped a bullish FVG and closed above it, signaling that support has held and it's a valid moment to enter a long position.
A red down arrow confirms that price has tapped a bearish FVG and closed below it, signaling that resistance has held and it's a valid moment to enter a short position.
How to Take a Trade (Step-by-Step Examples)
Example of a Bullish (Long) Trade Setup:
Establish Bias: Your primary analysis shows the market is in a clear uptrend. Your bias is Bullish. You are now only looking for buying opportunities.
Identify Zone: The indicator draws a bullish FVG (a green or blue box) during an impulsive up-move.
Wait for Pullback: Be patient and let the price retrace down into this FVG zone. Do not chase the price.
Confirmation Signal: A green UP arrow appears below a candle. This is your signal. It confirms that buyers have stepped in at the FVG level and defended it.
Entry: Enter a long (buy) position at the open of the candle immediately following the signal candle.
Stop Loss: Place your stop loss below the low of the signal candle or, for a safer stop, below the bottom of the FVG zone itself.
Take Profit: Target a previous high, a higher-timeframe resistance level, or use a risk-to-reward ratio like 1:2 or 1:3.
Example of a Bearish (Short) Trade Setup:
Establish Bias: Your primary analysis shows the market is breaking down into a downtrend. Your bias is Bearish. You are now only looking for selling opportunities.
Identify Zone: The indicator draws a bearish FVG (a pink or orange box) during an impulsive down-move.
Wait for Pullback: Patiently wait for the price to rally back up into this FVG zone.
Confirmation Signal: A red DOWN arrow appears above a candle. This is your confirmation that sellers have rejected the price at this level.
Entry: Enter a short (sell) position at the open of the next candle.
Stop Loss: Place your stop loss above the high of the signal candle or above the top of the FVG zone.
Take Profit: Target a previous low, a key support level, or the next major FVG below.
Features Explained in Detail
Multi-Timeframe (MTF) Analysis: HTF zones (dotted lines) carry more weight. A signal from a 4-hour FVG while you are on a 15-minute chart is significantly more powerful than a signal from a 15-minute FVG alone. Use HTF zones as major points of interest.
Confirmed Tap-In Logic: The arrow only appears after price has touched the zone and then closed outside of it in the expected direction. This built-in confirmation filters out wicks that simply pass through a zone without a real market reaction.
Dual Alert System:
Entry Alert ("Price has entered..."): This is a heads-up alert. It tells you to pay attention because price is now in your pre-defined zone of interest.
Tap-In Alert ("Confirmed tap-in..."): This is the execution alert. It signals that the conditions for a trade have been met according to the indicator's logic.
Fade on Tapped: When enabled, a zone will become transparent after a confirmed signal. This visually cleans up your chart, showing you which zones have already been tested and "mitigated."
Minimum FVG Size (Ticks): In volatile or ranging markets, many tiny, insignificant FVGs can form. Use this setting to filter out the noise. Increase the value to only display larger, more significant imbalances.
Disclaimer: Trading involves substantial risk. This indicator is a tool for analysis and should not be used as a sole reason to enter a trade. Always practice robust risk management and use this tool in conjunction with your own trading plan. Past performance is not indicative of future results.

TurtleTrader Intraday Extended by exp3rts🐢 TurtleTrader Intraday Extended by exp3rts
A modern intraday adaptation of the classic Turtle Trading strategy, optimized for short-term breakout trading with built-in risk management, pyramiding, and optional trend filters.
This strategy captures strong directional moves by entering breakouts from price channels, using ATR-based stop losses and controlled position scaling.
🔑 Key Features:
📈 Channel Breakout Entries: Buy/sell on breakout of highest highs or lowest lows
🛑 Dynamic ATR Stop Loss: Automatically calculated from market volatility
🔁 Pyramiding: Adds up to 4 positions as price moves in your favor
🔄 Directional Mode: Choose Long-only or Short-only mode
🧠 Skip After Win Option: Avoid overtrading by skipping the next entry after a profitable trade
📊 Optional EMA Display: Plot up to 3 EMAs for trend filtering or visual confirmation
📉 On-Chart ATR Label: Displays real-time ATR metrics (including ½N size used in classic Turtle rules)
⚙️ Strategy Inputs:
Entry/Exit channel length
ATR multiplier and period
Entry delay (bar offset)
Optional trade filter after profitable trades
Show/hide EMAs and ATR label
🧪 Best For:
Intraday breakout traders (works well on 5m–1h timeframes)
Traders who prefer mechanical rules and structured risk
Anyone testing volatility-based entries and exits
Inspired by the original Turtle Trading system — redesigned for modern markets with more intraday flexibility and visual enhancements.
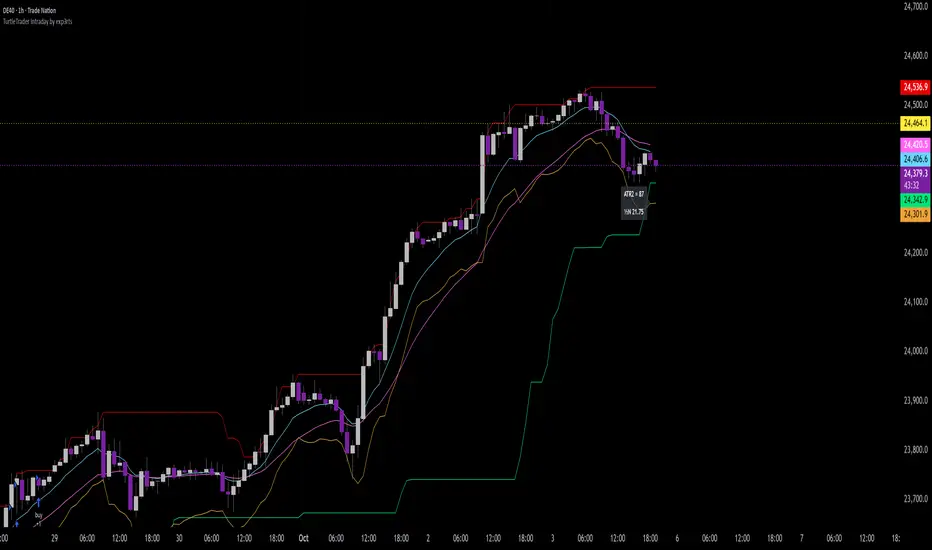
RSI Momentum ScalperOverview
The "RSI Momentum Scalper" is a Pine Script v5 strategy crafted for trading highly volatile markets, with a special focus on newly listed cryptocurrencies. This strategy harnesses the Relative Strength Index (RSI) alongside volume analysis and momentum thresholds to pinpoint short-term trading opportunities. It supports both long and short trades, managed with customizable take profit, stop loss, and trailing stop levels, which are visually plotted on the chart for easy tracking.
Why I Created This Strategy
I developed the "RSI Momentum Scalper" because I was seeking a reliable trading strategy tailored to newly listed, highly volatile cryptocurrencies. These assets often experience rapid price fluctuations, rendering traditional strategies less effective. I aimed to create a tool that could exploit momentum and volume spikes while managing risk through adaptable exit parameters. This strategy is designed to address that need, offering a flexible approach for traders in dynamic crypto markets.
How It Works
The strategy utilizes RSI to identify momentum shifts, combined with volume confirmation, to trigger long or short entries. Trades are controlled with take profit, stop loss, and trailing stop levels, which adjust dynamically as the price moves in your favor. The trailing stop helps lock in profits, while the plotted exit levels provide clear visual cues for trade management.
Customizable Settings
The script is highly customizable, allowing you to adjust it to various market conditions and trading styles. Here’s a brief overview of the key settings:
Trade Mode: Select "Both," "Long Only," or "Short Only" to determine the trade direction.
(Default: Both)
RSI Length: Sets the lookback period for the RSI calculation (2 to 30).
(Default: 8)
A shorter length increases RSI sensitivity, suitable for volatile assets.
RSI Overbought: Defines the upper RSI threshold (60 to 99) for short entries.
(Default: 90)
Higher values signal stronger overbought conditions.
RSI Oversold: Defines the lower RSI threshold (1 to 40) for long entries.
(Default: 10)
Lower values indicate stronger oversold conditions.
RSI Momentum Threshold: Sets the minimum RSI momentum change (1 to 15) to trigger entries.
(Default: 14)
Adjusts the sensitivity to price momentum.
Volume Multiplier: Multiplies the volume moving average to filter high-volume bars (1.0 to 3.0).
(Default: 1)
Higher values require stronger volume confirmation.
Volume MA Length: Sets the lookback period for the volume moving average (5 to 50).
(Default: 13)
Influences the volume trend sensitivity.
Take Profit %: Sets the profit target as a percentage of the entry price (0.1 to 10.0).
(Default: 4.15)
Determines when to close a winning trade.
Stop Loss %: Sets the loss limit as a percentage of the entry price (0.1 to 6.0).
(Default: 1.85)
Protects against significant losses.
Trailing Stop %: Sets the trailing stop distance as a percentage (0.1 to 4.0).
(Default: 2.55)
Locks in profits as the price moves favorably.
Visual Features
Exit Levels: Take profit (green), fixed stop loss (red), and trailing stop (orange) levels are plotted when in a position.
Performance Table: Displays win rate, total trades, and net profit in the top-right corner.
How to Use
Add the strategy to your chart in TradingView.
Adjust the input settings based on the cryptocurrency and timeframe you’re trading.
Monitor the plotted exit levels for trade management.
Use the performance table to assess the strategy’s performance over time.
Notes
Test the strategy on a demo account or with historical data before live trading.
The strategy is optimized for short-term scalping; adjust settings for longer timeframes if needed.

Opening Range IndicatorComplete Trading Guide: Opening Range Breakout Strategy
What Are Opening Ranges?
Opening ranges capture the high and low prices during the first few minutes of market open. These levels often act as key support and resistance throughout the trading day because:
Heavy volume occurs at market open as overnight orders execute
Institutional activity is concentrated during opening minutes
Price discovery happens as market participants react to overnight news
Psychological levels are established that traders watch all day
Understanding the Three Timeframes
OR5 (5-Minute Range: 9:30-9:35 AM)
Most sensitive - captures immediate market reaction
Quick signals but higher false breakout rate
Best for scalping and momentum trading
Use for early entry when conviction is high
OR15 (15-Minute Range: 9:30-9:45 AM)
Balanced approach - most popular among day traders
Moderate sensitivity with better reliability
Good for swing trades lasting several hours
Primary timeframe for most strategies
OR30 (30-Minute Range: 9:30-10:00 AM)
Most reliable but slower signals
Lower false breakout rate
Best for position trades and trend following
Use when looking for major moves
Core Trading Strategies
Strategy 1: Basic Breakout
Setup:
Wait for price to break above OR15 high or below OR15 low
Enter on the breakout candle close
Stop loss: Opposite side of the range
Target: 2-3x the range size
Example:
OR15 range: $100.00 - $102.00 (Range = $2.00)
Long entry: Break above $102.00
Stop loss: $99.50 (below OR15 low)
Target: $104.00+ (2x range size)
Strategy 2: Multiple Confirmation
Setup:
Wait for OR5 break first (early signal)
Confirm with OR15 break in same direction
Enter on OR15 confirmation
Stop: Below OR30 if available, or OR15 opposite level
Why it works:
Multiple timeframe confirmation reduces false signals and increases probability of sustained moves.
Strategy 3: Failed Breakout Reversal
Setup:
Price breaks OR15 level but fails to hold
Wait for re-entry into the range
Enter reversal trade toward opposite OR level
Stop: Recent breakout high/low
Target: Opposite side of range + extension
Key insight: Failed breakouts often lead to strong moves in the opposite direction.
Advanced Techniques
Range Quality Assessment
High-Quality Ranges (Trade these):
Range size: 0.5% - 2% of stock price
Clean boundaries (not choppy)
Volume spike during range formation
Clear rejection at range levels
Low-Quality Ranges (Avoid these):
Very narrow ranges (<0.3% of stock price)
Extremely wide ranges (>3% of stock price)
Choppy, overlapping candles
Low volume during formation
Volume Confirmation
For Breakouts:
Look for volume spike (2x+ average) on breakout
Declining volume often signals false breakout
Rising volume during range formation shows interest
Market Context Filters
Best Conditions:
Trending market days (SPY/QQQ with clear direction)
Earnings reactions or news-driven moves
High-volume stocks with good liquidity
Volatility above average (VIX considerations)
Avoid Trading When:
Extremely low volume days
Major economic announcements pending
Holidays or half-days
Choppy, sideways market conditions
Risk Management Rules
Position Sizing
Conservative: Risk 0.5% of account per trade
Moderate: Risk 1% of account per trade
Aggressive: Risk 2% maximum per trade
Stop Loss Placement
Inside the range: Quick exit but higher stop-out rate
Outside opposite level: More room but larger risk
ATR-based: 1.5-2x Average True Range below entry
Profit Taking
Target 1: 1x range size (take 50% off)
Target 2: 2x range size (take 25% off)
Runner: Trail remaining 25% with moving stops
Specific Entry Techniques
Breakout Entry Methods
Method 1: Immediate Entry
Enter as soon as price closes above/below range
Fastest entry but highest false signal rate
Best for strong momentum situations
Method 2: Pullback Entry
Wait for breakout, then pullback to range level
Enter when price bounces off former resistance/support
Better risk/reward but may miss some moves
Method 3: Volume Confirmation
Wait for breakout + volume spike
Enter after volume confirmation candle
Reduces false signals significantly
Multiple Timeframe Entries
Aggressive: OR5 break → immediate entry
Conservative: OR5 + OR15 + OR30 all align → enter
Balanced: OR15 break with OR30 support → enter
Common Mistakes to Avoid
1. Trading Poor-Quality Ranges
❌ Don't trade ranges that are too narrow or too wide
✅ Focus on clean, well-defined ranges with good volume
2. Ignoring Volume
❌ Don't chase breakouts without volume confirmation
✅ Always check for volume spike on breakouts
3. Over-Trading
❌ Don't force trades when ranges are unclear
✅ Wait for high-probability setups only
4. Poor Risk Management
❌ Don't risk more than planned or use tight stops in volatile conditions
✅ Stick to predetermined risk levels
5. Fighting the Trend
❌ Don't fade breakouts in strongly trending markets
✅ Align trades with overall market direction
Daily Trading Routine
Pre-Market (8:00-9:30 AM)
Check overnight news and earnings
Review major indices (SPY, QQQ, IWM)
Identify potential opening range candidates
Set alerts for range breakouts
Market Open (9:30-10:00 AM)
Watch opening range formation
Note volume and price action quality
Mark key levels on charts
Prepare for breakout signals
Trading Session (10:00 AM - 4:00 PM)
Execute breakout strategies
Manage existing positions
Trail stops as profits develop
Look for additional setups
Post-Market Review
Analyze winning and losing trades
Review range quality vs. outcomes
Identify improvement areas
Prepare for next session
Best Stocks/ETFs for Opening Range Trading
Large Cap Stocks (Best for beginners):
AAPL, MSFT, GOOGL, AMZN, TSLA
High liquidity, predictable behavior
Good range formation most days
ETFs (Consistent patterns):
SPY, QQQ, IWM, XLF, XLE
Excellent liquidity
Clear range boundaries
Mid-Cap Growth (Advanced traders):
Stocks with good volume (1M+ shares daily)
Recent news catalysts
Clean technical patterns
Performance Optimization
Track These Metrics:
Win rate by range type (OR5 vs OR15 vs OR30)
Average R/R (risk vs reward ratio)
Best performing market conditions
Time of day performance
Continuous Improvement:
Keep detailed trade journal
Review failed breakouts for patterns
Adjust position sizing based on win rate
Refine entry timing based on backtesting
Final Tips for Success
Start small - Paper trade or use tiny positions initially
Focus on quality - Better to miss trades than take bad ones
Stay disciplined - Stick to your rules even during losing streaks
Adapt to conditions - What works in trending markets may fail in choppy conditions
Keep learning - Markets evolve, so should your approach
The opening range strategy is powerful because it captures natural market behavior, but like all strategies, it requires practice, discipline, and proper risk management to be profitable long-term.

Katz Exploding PowerBand FilterUnderstanding the Katz Exploding PowerBand Filter (EPBF) v2.4
1. Indicator Overview
The Katz Exploding PowerBand Filter (EPBF) is an advanced technical indicator designed to identify moments of expanding bullish or bearish momentum, often referred to as "power." It operates as a standalone oscillator in a separate pane below the main price chart.
Its primary goal is to measure underlying market strength by calculating custom "Bull" and "Bear" power components. These components are then filtered through a versatile moving average and a dual signal line system to generate clear entry and exit signals. This indicator is not a simple momentum oscillator; it uses a unique calculation based on exponential envelopes of both price and squared price to derive its values.
2. On-Chart Lines and Components
The indicator pane consists of five main lines:
Bullish Component (Thick Green/Blue/Yellow/Gray Line): This is the core of the indicator. It represents the calculated bullish "power" or momentum in the market.
Bright Green: Indicates a strong, active long signal condition.
Blue: Shows the bull component is above the MA filter, but the filter itself is still pointing down—a potential sign of a reversal or weakening downtrend.
Yellow: A warning sign that bullish power is weakening and has fallen below the primary signal lines.
Gray: Represents neutral or insignificant bullish power.
Bearish Component (Thick Red/Purple/Yellow/Gray Line): This line represents the calculated bearish "power" or downward momentum.
Bright Red: Indicates a strong, active short signal condition.
Purple: Shows the bear component is above the MA filter, but the filter itself is still pointing down—a sign of potential trend continuation.
Yellow: A warning sign that bearish power is weakening.
Gray: Represents neutral or insignificant bearish power.
MA Filter (Purple Line): This is the main filter, calculated using the moving average type and length you select in the settings (e.g., HullMA, EMA). The Bull and Bear components are compared against this line to determine the underlying trend bias.
Signal Line 1 (Orange Line): A fast Exponential Moving Average (EMA) of the stronger power component. It acts as the first level of dynamic support or resistance for the power lines.
Signal Line 2 (Lime/Gray Line): A slower EMA that acts as a confirmation filter.
Lime Green: The line turns lime when it is rising and the faster Signal Line 1 is above it, indicating a confirmed bullish trend in momentum.
Gray: Indicates a neutral or bearish momentum trend.
3. On-Chart Symbols and Their Meanings
Various characters are plotted at the bottom of the indicator pane to provide clear, actionable signals.
L (Pre-Long Signal): The first sign of a potential long entry. It appears when the Bullish Component rises and crosses above both signal lines for the first time.
S (Pre-Short Signal): The first sign of a potential short entry. It appears when the Bearish Component rises and crosses above both signal lines for the first time.
▲ (Post-Long Signal): A stronger confirmation for a long entry. It appears with the 'L' signal only if the momentum trend is also confirmed bullish (i.e., the slower Signal Line 2 is lime green).
▼ (Post-Short Signal): A stronger confirmation for a short entry. It appears with the 'S' signal only if the momentum trend is confirmed bullish.
Exit / Take-Profit Symbols:
These symbols appear when a power component crosses below a line, suggesting that momentum is fading and it may be time to take profit.
⚠️ (Exit Signal 1): The Bull/Bear component has crossed below the main MA Filter. This is the first and most sensitive take-profit signal.
☣️ (Exit Signal 2): The Bull/Bear component has crossed below the faster Signal Line 1. This is a moderate take-profit signal.
🚼 (Exit Signal 3): The Bull/Bear component has crossed below the slower Signal Line 2. This is the slowest take-profit signal, suggesting the trend is more definitively exhausted.
4. Trading Strategy and Rules
Long Entry Rules:
Initial Signal: Wait for an L to appear at the bottom of the indicator. This confirms that bullish power is expanding.
Confirmation (Recommended): For a higher-probability trade, wait for a green ▲ symbol to appear. This confirms the underlying momentum trend aligns with the signal.
Entry: Enter a long (buy) position on the opening of the next candle after the signal appears.
Short Entry Rules:
Initial Signal: Wait for an S to appear at the bottom of the indicator. This confirms that bearish power is expanding.
Confirmation (Recommended): For a higher-probability trade, wait for a maroon ▼ symbol to appear. This confirms the underlying momentum trend aligns with the signal.
Entry: Enter a short (sell) position on the opening of the next candle after the signal appears.
Take Profit (TP) Rules:
The indicator provides three levels of take-profit signals. You can choose to exit your entire position or scale out at each level.
For a long trade, exit when you see ⚠️, ☣️, or 🚼 appear below the Bullish Component.
For a short trade, exit when you see ⚠️, ☣️, or 🚼 appear below the Bearish Component.
Stop Loss (SL) Rules:
The indicator does not provide an explicit stop loss. You must use your own risk management rules. Common methods include:
Swing High/Low: For a long position, place your stop loss below the most recent significant swing low on the price chart. For a short position, place it above the most recent swing high.
ATR-Based: Use an Average True Range (ATR) indicator to set a volatility-based stop loss.
Fixed Percentage: Risk a fixed percentage (e.g., 1-2%) of your account on the trade.
5. Disclaimer
This indicator is a tool for technical analysis and should not be considered financial advice. All trading involves significant risk, and past performance is not indicative of future results. The signals generated by this indicator are probabilistic and can result in losing trades. Always use proper risk management, such as setting a stop loss, and never risk more than you are willing to lose. It is recommended to backtest this indicator and use it in conjunction with other forms of analysis before trading with real capital. The indicator should only be used for educational purposes.
