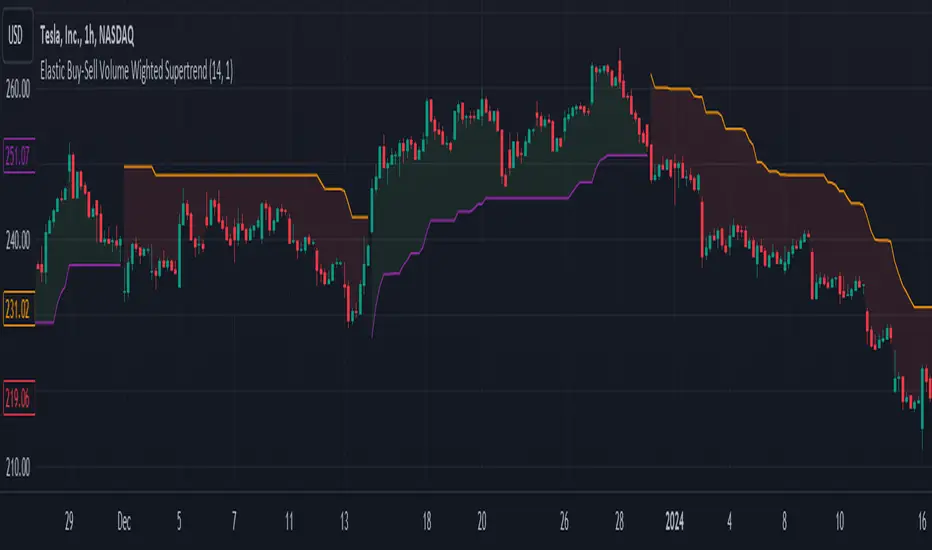
Elastic Buy-Sell Volume Wighted SupertrendCredits: This uses Trading View's buy and sell volume script and the Super trend script.
Elastic Buy-Sell Volume Wighted Supertrend can be used like a traditional supertrend indicator however we do not have to arbitrarily choose a multiplier depending on the stock and time frame the code dynamically adjust the multiplier and this is described below.
The buy and sell ATR (Average True Range) play a crucial role in determining the levels for potential buy and sell signals in the market. These ATR values are calculated based on volume-weighted averages, providing insights into the strength of buying and selling pressures. By incorporating volume into the ATR calculation, the indicator can better adapt to market dynamics, as volume often reflects the intensity of price movements. Instead of using Volume as whole this uses up and down volume derived from lower time frames which is used to calculate buy and sell ATR.
The multiplier is a key factor in the Supertrend calculation, which adjusts the width of the trend bands. The multiplier in this indicator dynamically adjusts itself based on two key components: the ratio of the asset's Average True Range (ATR) to that of a broader market benchmark and the coefficient of variation (CV) of the True Range (TR). The ratio comparison provides a historical context of the asset's volatility relative to the wider market over a longer time frame, while the CV accounts for short-term fluctuations in volatility.
By comparing the asset's ATR to that of the benchmark, traders gain insights into the asset's historical volatility behavior. A higher multiplier suggests that the asset's volatility has historically exceeded that of the benchmark, indicating potentially larger price movements compared to the broader market. Conversely, a lower multiplier suggests the opposite.
The CV component measures short-term variability in the asset's volatility, ensuring that the multiplier adapts to both long-term trends and short-term fluctuations. This combined approach enables traders to make informed decisions, considering both historical volatility relative to the broader market and short-term variability. Ultimately, the dynamic multiplier enhances traders' ability to adjust their strategies effectively across various market conditions.
Overall, the use of buy and sell ATR, along with a dynamically adjusted multiplier, enhances the indicator's ability to identify trend directions and to use a dynamic stop loss level.
ابحث في النصوص البرمجية عن "supertrend"
Rainbow Fibonacci Momentum - SuperTrend🌈 "Rainbow Fibonacci Momentum - SuperTrend" Indicator 🌈
IMPORTANT: as this is a complex and elaborate TREND ANALYSIS on the graph, ALL INDICATORS REPAINT.
Experience the brilliance of "Rainbow Fibonacci Momentum - SuperTrend" for your technical analysis on TradingView! This versatile indicator allows you to visualize various types of Moving Averages, including Simple Moving Averages (SMA), Exponential Moving Averages (EMA), Weighted Moving Averages (WMA), Hull Moving Averages (HMA), and Volume Weighted Moving Averages (VWMA).
Each MA displayed in a unique color to create a stunning rainbow effect. This makes it easier for you to identify trends and potential trading opportunities.
Key Features:
📊 Multiple Moving Average Types - Choose from a range of moving average types to suit your analysis.
🎨 Stunning Color Gradient - Each moving average type is displayed in a unique color, creating a beautiful rainbow effect.
📉 Overlay Compatible - Use it as an overlay on your price chart for clear trend insights.
With the "Rainbow Fibonacci Momentum - SuperTrend" indicator, you'll add a burst of color to your trading routine and gain a deeper understanding of market trends.
HOW IT WORKS
MA Lines:
MA - 5: purple lines
MA - 8: blue lines
MA - 13: green lines
MA - 21: yellow lines
MA - 34: orange lines
MA - 55: red line
Header Color Indicators:
Purple: MA-5 is in uptrend on the chart
Blue: MA-5 and MA-8 are in the uptrend on the chart
Green: MA-5, MA-8 and MA-13 are in the uptrend on the chart
Yellow: MA-5, MA-8, MA-13 and MA-21 are in the uptrend on the chart
Orange: MA-5, MA-8, MA-13, MA-21 and MA-34 are in the uptrend on the chart
Red: MA-5, MA-8, MA-13, MA-21, MA-34 and MA-55 are in the uptrend on the chart
Red + White Arrow: All MAs are correctly aligned in the uptrend on the chart
Footer Color Indicators:
Purple: MA-5 is in downtrend on the chart
Blue: MA-5 and MA-8 are in the downtrend on the chart
Green: MA-5, MA-8 and MA-13 are in the downtrend on the chart
Yellow: MA-5, MA-8, MA-13 and MA-21 are in the downtrend on the chart
Orange: MA-5, MA-8, MA-13, MA-21 and MA-34 are in the downtrend on the chart
Red: MA-5, MA-8, MA-13, MA-21, MA-34 and MA-55 are in the downtrend on the chart
Red + White Arrow: All MAs are correctly aligned in the downtrend on the chart
Background Colors:
Light Red: All MAs are on the rise!
Red: All MAs are align correctly on the rise!
Light Green: All MAs are in freefall!
Green: All MAs are align correctly in freefall!
Tiny Arrows Indicators/Alerts:
Down Arrow: All MAs are in freefall!
Up Arrow: All MAs are on the rise!
Big Arrows Indicators/Alerts:
Down Arrow: All MAs are align correctly in freefall!
Up Arrow: All MAs are align correctly on the rise!

Harmonic Patterns Based SupertrendExtending the earlier implemented concept of Harmonic-Patterns-Based-Trend-Follower , in this script, lets make it work as supertrend so that it is more easier to operate.
🎲 Process
🎯 Derive Zigzag and scan harmonic patterns for last 5 confirmed pivots
🎯 If a pattern is found, bullish and bearish zones are calculated based on parameter Base
🎯 These bullish and bearish zones act as supertrend based on current trade in progress.
🎯 When in bullish mode, bearish zone will only go up irrespective of new pattern forming new low. Similarly when in bearish mode, bullish zones will only come down - this is done to imitate the standard supertrend behaviour.
🎲 Note
Patterns are not created on latest pivot as last pivot will be unconfirmed and moving. Due to this, patterns appear after certain delay - patterns will not be real time. But, this is expected and does not impact the overall process.
Here are few chart captures to demonstrate how it works.
🎲 Settings
Settings are explained in the screenshot below.

6 Multi-Timeframe Supertrend with Heikin Ashi as Source
This is a multiple multi-timeframe version of famous supertrernd only with Heikin Ashi as source. Atr which stands in the heart of supertrend is calculated based on heikin-ashi bars which omits a great deal of noises.
with 6 multiplication of the supertrend, its simply much easier to spot trend direction or use it as trailing stop with several levels available.
this is a great tool to assess and manage your risk and calculate your position volume if you use the heikin ashi supertrend as your stoploss.

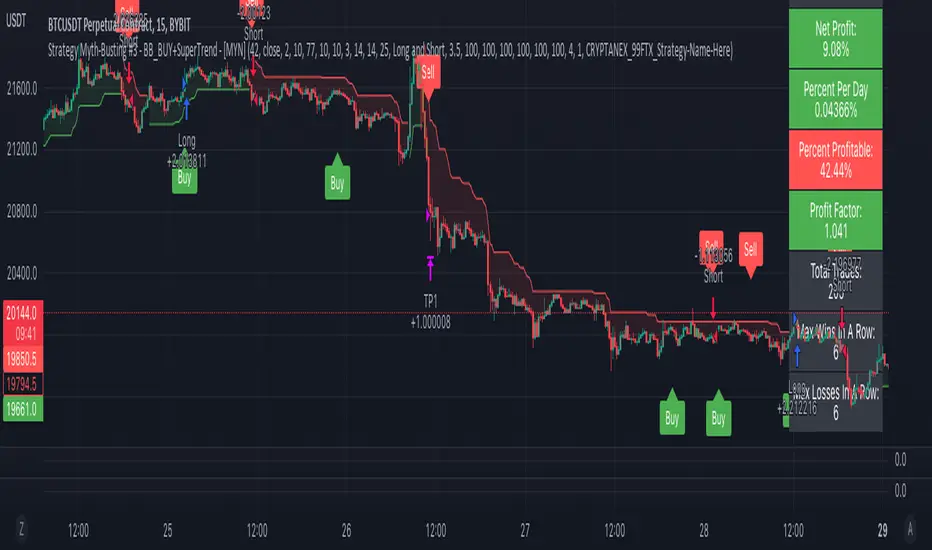
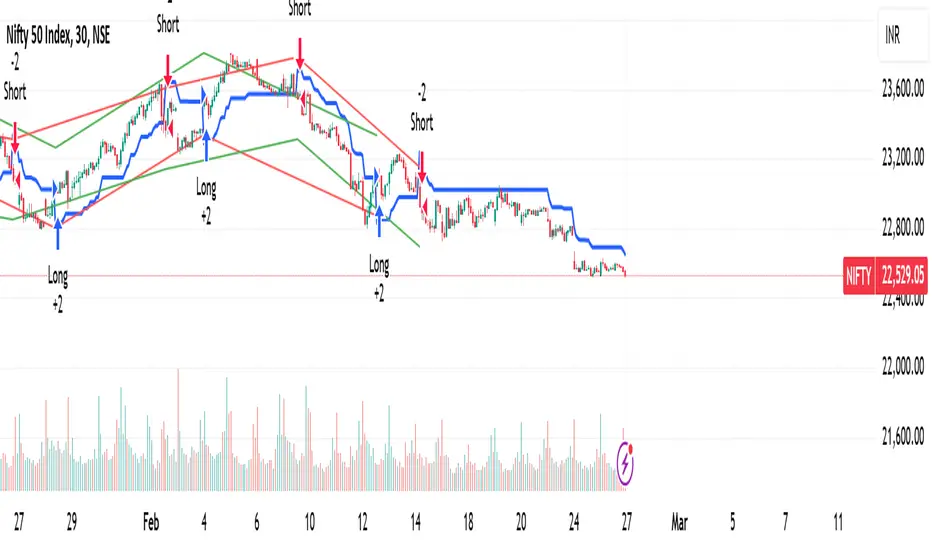
Strategy Myth-Busting #3 - BB_BUY+SuperTrend - [MYN]This is part of a new series we are calling "Strategy Myth-Busting" where we take open public manual trading strategies and automate them. The goal is to not only validate the authenticity of the claims but to provide an automated version for traders who wish to trade autonomously.
Our third one we are automating is one of the strategies from "The Best 3 Buy And Sell Indicators on Tradingview + Confirmation Indicators ( The Golden Ones ))" from "Online Trading Signals (Scalping Channel)". No formal backtesting was done by them so wanted to validate their claims.
If you know of or have a strategy you want to see myth-busted or just have an idea for one, please feel free to message me.
This strategy uses a combination of 2 open-source public indicators:
BB_Buy and Sell by guikroth (default settings)
SuperTrend from TradingView's Technicals (default settings)
Trading Rules
15 min candles
Long
Long condition when BB_BUY indicates buy signal and SuperTrend is green
Short
Short condition when BB_BUY indicates Sell signal and SuperTrend is red
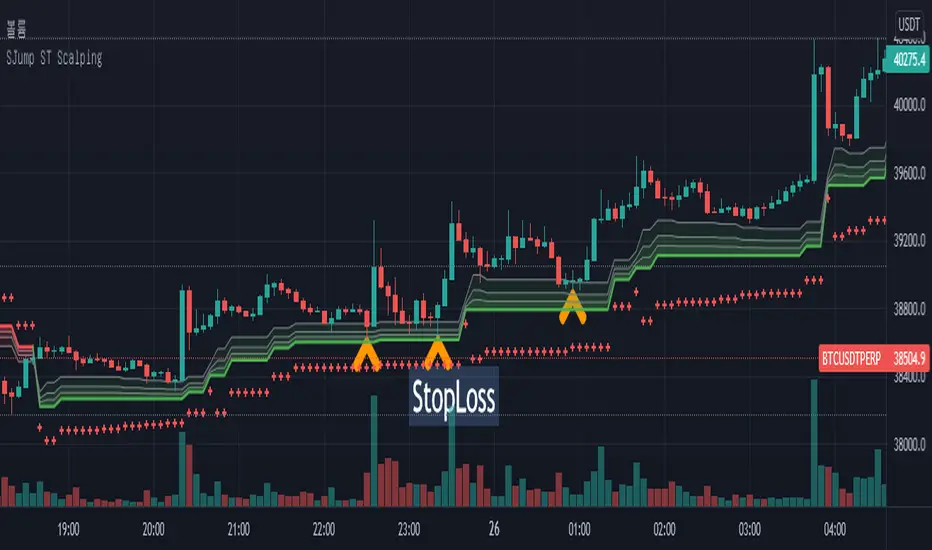
SuperJump HTF SuperTrend for ScalpingThis script can help you perform scalping using SuperTrend
First, set the HTF value higher than your current time frame.
As you know, the accuracy of the supertrend is very poor on the lower timeframe.
So I used higher timeframe(15 mins) supertrend more than current chart(5 mins)
Triple SupertrendThis triple supertrend indicator uses three different supertrend indicators with different and adjustable parameters. It is useful to filter false signals, set stop losses and detect sideways markets. When two or three (depending on the trading environment) supertrend lines turn green, a long is more suitable for a long position and vice versa.

Adoptive Supertrend - PivotsAnother experiment with Supertrend by making use of pivot point high/lows.
Trailing Stop types used in this indicator are:
ATR - plain ATR based supertrend
Breakout - ATR based supertrend combined with breakout. (Trailing triggered only if price change is higher than HighPriceChange multiplier times ATR.
Pivot Points - Trail only when new pivots created. Pivot stop multiplier is used below pivot low.
Combined - Combine everything together

超级趋势(Supertrend)指标This is a normal Supertrend indicator which redesign and translate for Chinese.
这是一个通用的超级趋势(Supertrend)指标。
本脚本的目的在于帮助使用中文的人了解该指标,特别是其用法。同时将该指标代码添加完整的中文注释,方便使用中文的人学习Pine语言。
超级趋势指标(SuperTrend)是最常见的基于ATR的指标之一。
本指标的特色
相对于标准的超级趋势指标,在此版本中,你可以从设置中更改ATR计算方法。ATR的默认计算方式是采用RMA(RSI中使用的移动平均线,称之为指数加权移动平均线),本版本中可以使用SMA来替代计算ATR。
默认设置项为勾选状态,即ATR的计算方式为标准的RMA。
指标可调节参数
该指标有两个可设置的参数
1 ATR参数:默认为10;
2 ATR乘数:默认为3。
本指标还有两项可选设置项
1 价格源:价格源默认使用收盘价,但是你还可以选择使用开盘价、最高价、最低价等其他的价格计算方式;
指标用法
超级趋势指标出现在价格之上或价格之下时,就会产生买入和卖出信号。
买入信号: 当超级趋势指标在价格下方绘制时,即图表中的绿色信号线开始出现时,则产生买入信号;同时超级趋势指标的买入信号线可以作为买入的止损点;
卖出信号: 当超级趋势指标在价格上方绘制时,即图表中的红色信号线开始出现时,则产生卖出信号;同时超级趋势指标的卖出信号线可以作为卖出的止损点。
本指标支持配置买卖点的预警。
指标优势
1 适用于不同的时间周期和不同的交易品种;
2 对趋势有很好的识别效应;
3 可以提供明确的止损价位参考。
指标局限性
与其他趋势指标类似,超级趋势指标的作用在于帮助你抓住大趋势,但是在震荡行情,特别是长期的震荡行情中会失真,此时若按照超级趋势指标交易,则会产生亏损。

Supertrend [TradingConToto]Supertrend — ADX/DI + EMA Gap + Breakout (with Mobile UI)
What makes it original
Supertrend combines trend strength (ADX/DI), multi-timeframe bias (EMA63 and EMA 200D equivalent), a structural filter based on the distance between EMA2400 and EMA4800 expressed in ATR units, and a momentum confirmation through a previous high breakout.
This is not a random mashup — it’s a sequence of filters designed to reduce trades in ranging markets and prioritize mature trends:
Direction: +DI > -DI (trend led by buyers).
Strength: ADX > mean(ADX) (avoids weak, choppy phases).
Short-term bias: Close > EMA63.
Long-term bias: Close > EMA4800 ≈ EMA200 daily on H1.
Momentum: Close > High (immediate breakout).
Structure: (EMA2400 − EMA4800) > k·ATR (ensures separation in ATR units, filters out flat phases).
Entries & exits
Entry: when all six conditions are met and no open position exists.
Exit: if +DI < -DI or Close < EMA63.
Visuals: EMA63 is painted green while in position and red otherwise, with a supertrend-style band; “BUY” labels appear below the green band and “SELL” labels above the red band.
UI: includes a compact table (mobile-friendly) showing the state of each condition.
Default parameters used in this publication
Initial capital: 10,000
Position size: 10% of equity (≤10% per trade is considered sustainable).
Commission: 0.01% per side (adjust to your broker/market).
Slippage: 1 tick
Pyramiding: 0 (only one position at a time)
Adjust commission/slippage to match your market. For US equities, commissions are often per share; for spot crypto, 0.10–0.20% total is common. I publish with 0.01% per side as a conservative example to avoid overestimating results.
Recommended backtest dataset
Timeframe: H1
Multi-cycle window (e.g. 2015–today)
Symbols with high liquidity (e.g. NASDAQ-100 large caps, or BTC/ETH spot) to generate 100+ trades. Avoid cherry-picked short windows.
Why each filter matters
+DI > -DI + ADX > mean: reduce counter-trend trades and weak signals.
Close > EMA63 + Close > EMA4800: enforce trend alignment in short and long horizons.
Breakout High : requires immediate momentum, avoids early entries.
EMA gap in ATR units: blocks flat or compressed structures where EMA200D aligns with price.
Limitations
The breakout filter may skip healthy pullbacks; the design prioritizes continuation over perfect entry price.
No fixed trailing stop/TP; exits depend on trend degradation via DI/EMA63.
Results vary with real costs (commissions, slippage, funding). Adjust defaults to your broker.
How to use
Apply it on a clean chart (no other indicators when publishing).
Keep in mind the default parameters above; if you change them, mention it in your notes and use the same values in the Strategy Tester.
Ensure your dataset produces 100+ trades for statistical validity.

Supertrend with 1% Target and 1% StoplossSupertrend Calculation: The Supertrend indicator is calculated using the Average True Range (ATR) and a factor. The factor and ATR length can be adjusted in the inputs.
Long and Short Conditions: The strategy enters a long position when the price crosses above the Supertrend line and a short position when the price crosses below it.
Target and Stop Loss: The strategy places a 1% target and a 1% stop loss for both long and short positions.
Visuals: The stop loss and take profit levels are plotted on the chart for better visibility.
3x Supertrend (for Vietnamese stock market and vn30f1m)The 4Vietnamese 3x Supertrend Strategy is an advanced trend-following trading system developed in Pine Script™ and designed for publication on TradingView as an open-source strategy under the Mozilla Public License 2.0. This strategy leverages three Supertrend indicators with different ATR lengths and multipliers to identify optimal trade entries and exits while dynamically managing risk.
Key Features:
Option to build and hold long term positions with entry stop order. Try this to avoid market complex movement and retain long term investment style's benefits.
Advanced Entry & Exit Optimization: Includes configurable stop-loss mechanisms, pyramiding, and exit conditions tailored for different market scenarios.
Dynamic Risk Management: Implements features like selective stop-loss activation, trade window settings, and closing conditions based on trend reversals and loss management.
This strategy is particularly suited for traders seeking a systematic and rule-based approach to trend trading. By making it open-source, we aim to provide transparency, encourage community collaboration, and help traders refine and optimize their strategies for better performance.
License:
This script is released under the Mozilla Public License 2.0, allowing modifications and redistribution while maintaining open-source integrity.
Happy trading!

TTP SuperTrend ADXThis indicator uses the strength of the trend from ADX to decide how the SuperTrend (ST) should behave.
Motivation
ST is a great trend following indicator but it's not capable of adapting to the trend strength.
The ADX, Average Directional Index measures the strength of the trend and can be use to dynamically tweak the ST factor so that it's sensitivity can adapt to the trend strength.
Implementation
The indicator calculates a normalised value of the ADX based on the data available in the chart.
Based on these values ST will use different factors to increase or reduce the factor use by ST: expansion or compression.
ST expansion vs compression
Expanding the ST would mean that the stronger a trends get the ST factor will grow causing it to distance further from the price delaying the next ST trend flip.
Compressing the ST would mean that the stronger a trends get the ST factor will shrink causing it to get closer to the price speeding up the next ST trend flip.
Features
- Alerts for trend flip
- Alerts for trend status
- Backtestable stream
- SuperTrend color gets more intense with the strength of the trend

[Sniper] SuperTrend + SSL Hybrid + QQE MODHi. I’m DuDu95.
**********************************************************************************
This is the script for the series called "Sniper".
*** What is "Sniper" Series? ***
"Sniper" series is the project that I’m going to start.
In "Sniper" Series, I’m going to "snipe and shoot" the youtuber’s strategy: to find out whether the youtuber’s video about strategy is "true or false".
Specifically, I’m going to do the things below.
1. Implement "Youtuber’s strategy" into pinescript code.
2. Then I will "backtest" and prove whether "the strategy really works" in the specific ticker (e.g. BTCUSDT) for the specific timeframe (e.g. 5m).
3. Based on the backtest result, I will rate and judge whether the youtube video is "true" or "false", and then rate the validity, reliability, robustness, of the strategy. (like a lie detector)
*** What is the purpose of this series? ***
1. To notify whether the strategy really works for the people who watched the youtube video.
2. To find and build my own scalping / day trading strategy that really works.
**********************************************************************************
*** Strategy Description ***
This strategy is from " QQE MOD + supertrend + ssl hybrid" by korean youtuber "코인투데이".
"코인투데이" claimed that this strategy will make you a lot of money in any crypto ticker in 15 minute timeframe.
### Entry Logic
1. Long Entry Logic
- Super Trend Short -> Long
- close > SSL Hybrid baseline upper k
- QQE MOD should be blue
2. Short Entry Logic
- Super Trend Long -> Short
- close < SSL Hybrid baseline lower k
- QQE MOD should be red
### Exit Logic
1. Long Exit Logic
- Super Trend Long -> Short
2. Short Entry Logic
- Super Trend Short -> Long
### StopLoss
1. Can Choose Stop Loss Type: Percent, ATR, Previous Low / High.
2. Can Chosse inputs of each Stop Loss Type.
### Take Profit
1. Can set Risk Reward Ratio for Take Profit.
- To simplify backtest, I erased all other options except RR Ratio.
- You can add Take Profit Logic by adding options in the code.
2. Can set Take Profit Quantity.
### Risk Manangement
1. Can choose whether to use Risk Manangement Logic.
- This controls the Quantity of the Entry.
- e.g. If you want to take 3% risk per trade and stop loss price is 6% below the long entry price,
then 50% of your equity will be used for trade.
2. Can choose How much risk you would take per trade.
### Plot
1. Added Labels to check the data of entry / exit positions.
2. Changed and Added color different from the original one. (green: #02732A, red: #D92332, yellow: #F2E313)
3. SuperTrend and SSL Hybrid Baseline is by default drawn on the chart.
4. If you check EMA filter, EMA would be drawn on the chart.
5. Should add QQE MOD indicator manually if you want to see QQE MOD.
**********************************************************************************
*** Rating: True or False?
### Rating:
→ 3.5 / 5 (0 = Trash, 1 = Bad, 2 = Not Good, 3 = Good, 4 = Great, 5 = Excellent)
### True or False?
→ True but not a 'perfect true'.
→ It did made a small profit on 15 minute timeframe. But it made a profit so it's true.
→ It worked well in longer timeframe. I think super trend works well so I will work on this further.
### Better Option?
→ Use this for Day trading or Swing Trading, not for Scalping. (Bigger Timeframe)
→ Although the result was not good at 15 minute timeframe, it was quite profitable in 1h, 2h, 4h, 8h, 1d timeframe.
→ Crypto like BTC, ETH was ok.
→ The result was better when I use EMA filter.
### Robust?
→ Yes. Although result was super bad in 5m timeframe, backtest result was "consistently" profitable on longer timeframe (when timeframe was bigger than 15m, it was profitable).
→ Also, MDD was good under risk management option on.
**********************************************************************************
*** Conclusion?
→ I recommend you not to use this on short timeframe as the youtuber first mentioned.
→ In my opinion, I can use on longer timeframe like 2h or bigger with EMA filter, stoploss and risk management.

Auto SuperTrend+Based upon SuperTrend+ , this variation measures the volatility in order to determine the range of the trend.
Notes:
Upward volatility is measured separately from downward.
WMA is used for averaging to provide a recency bias.
Changing time-frames should display similar results as the settings are based upon time and not bars.

MA Candles Supertrend StrategySimple strategy which is derived by below method:
1. Calculate moving average of High, Low, Open and Close and make candles of them.
2. Derive supertrend on the moving average candles.
3. Generate buy and sell signals based on supertrend direction combined with higher timeframe high-low condition

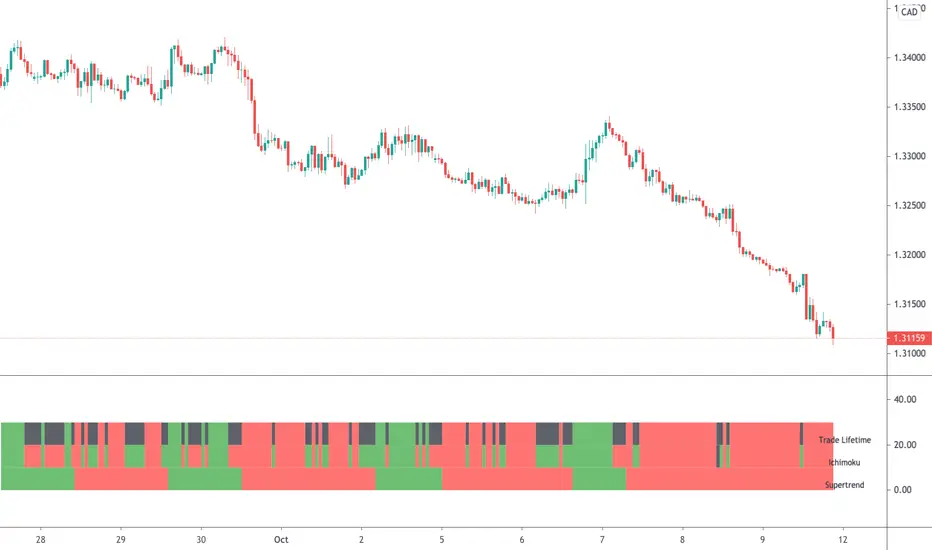
Ichimoku & Supertrend Combined StrategyOne of my mixed approach strategy indicators which include's:
- Ichimoku using much faster settings. (ECC-11)
- Supertrend
Whilst both Supertrend and Ichimoku are quite reliable, they do sometimes provide false signals. By combining both indicators, trading when both agree, it reduces the number of false alerts.
Using this indicator is simple. If the lifetime line is green then buy. If red then sell and when black don't trade. So...
Green Line - This strategy is in a buy position
Red Line - This strategy is in a sell position
Black Line - DON'T TRADE
The trader's approach is simple, when all indicators are green or red, then take the trade. As soon as one indicator changes, then re-evaluate using your normal process, such as price action, to determine whether to close the trade or continue.
There are also some alerts for opening and closing positions.
If you wish to make some changes or discuss, please don't hesitate to message me.
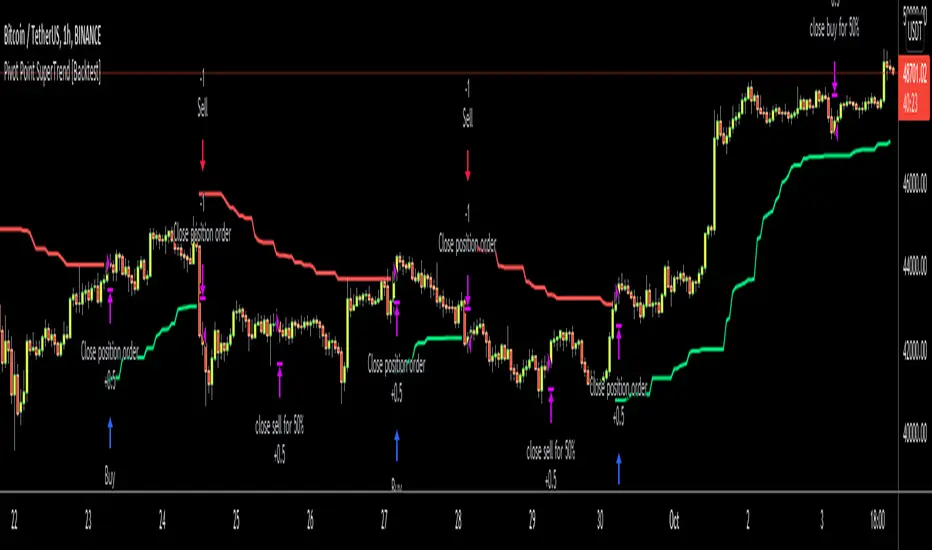
Pivot Point SuperTrend [Backtest]Hello All,
This is backtesting result of following indicator/strategy. I didn't work on adding other indicators. maybe in the future I can try to combine this with other indicators.
You can visit following link to see "Pivot Point SuperTrend" . by using this backtesting tool, you can test&find better options
There is option "Use Center Line to Close Entry for 50%" . by default it's not enabled. if you enable this option, pivot point center line may push you to close your entry for 50% (can be used as early stoploss/take profit line if you think it's risky)
Enjoy!
Variable SuperTrend - evoPlayed around with Lazy Bear's VMA and Gunazzi's SuperTrend Cloud .
It plots an uptrend if the low of a candle gets above the recent downtrend and plots a downtrend if the high of a candle gets below the recent uptrend, you have to wait for the candle to close to confirm the actual trend change.
I use it to give me a direction for longs or shorts, not as a stop/reverse indicator.
Thanks Lazy Bear and Gunazzi :)

BEST Supertrend StrategyHello traders
Sharing a sample Supertrend strategy to illustrate how to calculate a convergence and using it in a strategy
I based the setup as follow:
- Entries on Supertrend MTF breakout + moving average cross. Entering whenever there is a convergence
- exit whenever a Simple Moving Averages cross in the opposite direction happen
- possibility to filter only Longs/Shorts or both
All the best
Dave

Supertrend & ATR Trailing Stop by EVSupertrend / ATR Trailing Stop is a beginner-friendly trend and risk tool designed to keep charts clean while making direction and trailing levels obvious. It includes two trailing modes in one script: a classic Supertrend built from ATR bands, and an optional Chandelier-style trailing stop using a configurable lookback. The indicator highlights bullish and bearish regimes, plots a clear trailing stop line, and can show simple trend-flip signals when direction changes. For a minimal look, you can enable “Only Show Current Level” to display just the active trailing level without historical clutter. Alerts are included for trend flips so you can automate notifications and catch reversals or continuation shifts in real time.

Bar-Close Confirmed SupertrendOverview
This indicator is a Supertrend-style trend follower that confirms direction changes only after a bar closes. Trend flips are determined using the previous bar’s close relative to the bands, which helps avoid intrabar changes during live candles.
How it works
Computes ATR (Average True Range)
Builds upper/lower bands using ATR and a multiplier
Updates trend direction only when a prior candle confirms a break of the band
Confirmation logic (bar-close based)
Trend direction is updated using conditions based on the previous candle, such as:
close > upper → confirm uptrend
close < lower → confirm downtrend
Because signals are confirmed on the prior bar, trend changes and markers are displayed only when confirmation exists.
Signals
Uptrend confirmation: prior candle closes above the upper band → bullish marker
Downtrend confirmation: prior candle closes below the lower band → bearish marker
Inputs
ATR Length (default 10)
ATR Multiplier (default 3.0)
Notes
This script is intended for bar-close workflows. Behavior and responsiveness may differ across markets and timeframes depending on volatility and chosen settings.

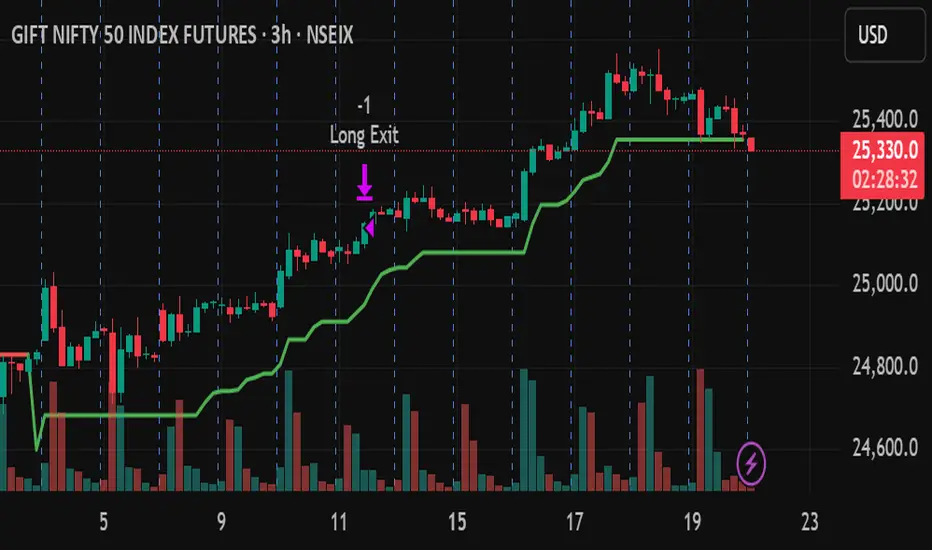
Supertrend 3H Strategy VinaySupertrend 3H Strategy Vinay-
Buy or sell using Supertrend, 200 points SL and 400 points target