Super scalpThis is scalp strategy based on the confluence of 3 indicators
ema 9 , supertrend and vwap
when supertrend buy signal is generated and the price is above ema and vwap scalp buy signal is generated
when supertrend sell signal is generated and the price is below ema and vwap scalp sell signal is generated
ابحث في النصوص البرمجية عن "supertrend"

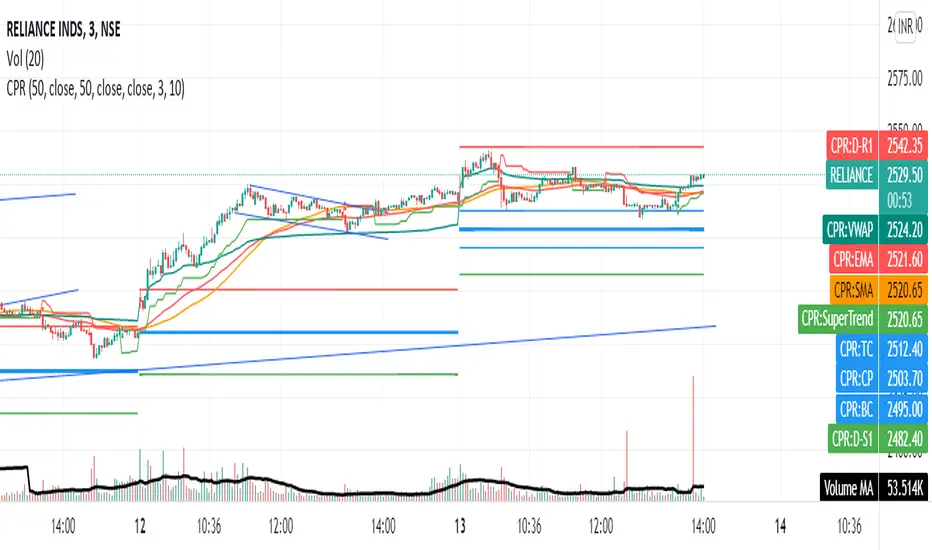
Share market aasan hai CPR with MA & VWAP This script will allow to add CPR with Standard Pivots and 4 Indicators.
Standard Pivot has 9 levels of support and 9 levels of resistance lines. It has CPR , 3 levels of Day-wise pivots , 3 levels of Weekly pivots and 3 Levels of Monthly Pivots .
In Addition to the CPR and Pivot , this script will allow user to Add 4 more Indicators - SMA , EMA , VWAP and SuperTrend as well.
All the Support and resistance levels can be enabled / disabled from settings. It will allow to select multiple combinations of support and resistance levels across 3 levels at any of the 3 time-frames individually and combined.
All 4 Indicators can be can be enabled / disabled from settings. This will allow the indicators to be plotted individually and combined along with any combination of CPR & Pivots .
These number of combinations will allow user to visualize the charts with desired indicators, pivot support & resistance levels on all or any of the 3 time frames.
For Ease of access, listed few points on how the script works..
- CPR and day-wise level 1 & 2 (S1 & R1) enabled by default and can be changed from settings
- Day-wise Level 2 & 3 (S2, R2, S3 & L3) can be enabled from settings
- Weekly 3 levels and Monthly 3 levels can be enabled from settings
- CPR & pivot levels colored in blue lines
- All support levels colored in Green
- All resistance levels Colored in Red
- Day-wise pivot , support & resistance are straight lines
- Weekly pivot , support & resistance are cross (+) lines
- Weekly pivot , support & resistance are circle (o) lines
- SMA , EMA , VWAP and SuperTrend Enabled by Default
- SMA
- EMA
- SuperTrend
HiLo IndicatorNYSE:SPCE
This is an old and simple concept of mine that I am revisiting. It looks similar to the Vortex Indicator but the formulation is different. I was sick and tired of buying late at the top of the peaks, so I wanted to relate the current price to historic highs and lows (you can change how far you want to go back Time Length = tl). The functions are incredible simple:
lo = close -lowest(close,tl)
hi = highest(close,tl) -close
This generates a weaving pattern that shows bullish (lo>hi) and bearish (lo

Big Snapper Alerts R2.0 by JustUncleLThis is a diversified Binary Option or Scalping Alert indicator originally designed for lower Time Frame Trend or Swing trading. Although you will find it a useful tool for higher time frames as well.
The Alerts are generated by the changing direction of the ColouredMA (HullMA by default), you then have the choice of selecting the Directional filtering on these signals or a Bollinger swing reversal filter.
The filters include:
Type 1 - The three MAs (EMAs 21,55,89 by default) in various combinations or by themselves. When only one directional MA selected then direction filter is given by ColouredMA above(up)/below(down) selected MA. If more than one MA selected the direction is given by MAs being in correct order for trend direction.
Type 2 - The SuperTrend direction is used to filter ColouredMA signals.
Type 3 - Bollinger Band Outside In is used to filter ColouredMA for swing reversals.
Type 4 - No directional filtering, all signals from the ColouredMA are shown.
Notes:
Each Type can be combined with another type to form more complex filtration.
Alerts can also be disabled completely if you just want one indicator with one colouredMA and/or 3xMAs and/or Bollinger Bands and/or SuperTrend painted on the chart.
Warning:
Be aware that combining Bollinger OutsideIn swing filter and a directional filter can be counter productive as they are opposites. So careful consideration is needed when combining Bollinger OutsideIn with any of the directional filters.
Hints:
For Binary Options try ColouredMA = HullMA(13) or HullMA(8) with Type 2 or 3 Filter.
When using Trend filters SuperTrend and/or 3xMA Trend, you will find if price reverses and breaks back through the Big Fat Signal line, then this can be a good reversal trade.
Some explanation about the what Hull Moving average and ideas of how the generated in Big Snapper can be used:
tradingsim.com
forextradingstrategies4u.com
Inspiration from @vdubus
Big Snapper's Bollinger OutsideIn Swing filter in Action:

Advanced Market Structure [Rogman]Rogman's Advanced Market Structure Indicator
The Ultimate All-in-One Market Structure Analysis Tool for TradingView
Take your technical analysis to the next level with a comprehensive, professional-grade tool designed for traders who demand precision and clarity in their charts.
🎯 Who Is This For?
ICT/SMC Traders seeking liquidity zones and market structure analysis
Day Traders monitoring session-based price action and kill zones
Swing Traders identifying key higher timeframe levels
Price Action Traders analyzing structure breaks and trend changes
Any Serious Trader wanting a clean, comprehensive market structure overlay
✨ Key Features
📊 Market Sessions Visualization
Track the three major trading sessions with our unique bracket-style display:
Asia, London, and New York sessions are clearly marked
Sessions display as SESSION ════════════ below price action
Smart vertical stacking prevents overlapping when sessions have similar lows
Fully customizable session times for any timezone
Perfect for identifying session highs/lows and optimal kill zone timing
📈 Higher Timeframe (HTF) Levels
Never miss a key level again:
Display Daily and Weekly Open, High, and Low levels
Instant visual reference for HTF support and resistance
Separate color controls for lines and labels
Choose from Solid, Dashed, or Dotted line styles
Essential for determining HTF bias and key decision points
🔄 Automatic Swing Detection
Let the indicator do the heavy lifting:
Auto-detection of swing highs (▼) and swing lows (▲)
Configurable lookback period for sensitivity adjustment
Optional horizontal level lines extending from swing points
Customizable colors, widths, and line styles
Identify potential reversal points and structure levels instantly
💧 Liquidity Zone Mapping
See where the money is hiding:
Automatic identification of buy-side liquidity (above swing highs)
Automatic identification of sell-side liquidity (below swing lows)
Visual zones show where stop losses are clustered
Real-time tracking when liquidity gets swept
Swept zones change color — know when liquidity has been taken
📉 Multi-Method Trend Detection
Three powerful methods to confirm trend direction:
Swing Structure — Based on higher highs/lows or lower highs/lows
EMA — Trend based on price position relative to EMA
Supertrend — Uses the popular Supertrend indicator
Features include:
Optional background coloring for at-a-glance trend identification
Real-time trend status label (UPTREND/DOWNTREND/NEUTRAL)
Customizable colors and transparency
🏷️ HH/HL/LH/LL Labels
Automatic market structure labeling:
HH (Higher High) — Bullish continuation signal
HL (Higher Low) — Bullish continuation signal
LH (Lower High) — Bearish continuation signal
LL (Lower Low) — Bearish continuation signal
Color-coded for instant visual recognition
📋 Information Dashboard
All critical data at a glance:
Current ticker symbol
Trend direction and status
Daily and Weekly bias
Last swing high and low prices
Active liquidity zone count
Positionable in any corner of your chart
🔔 Built-in Alerts
Never miss a key event:
Trend change alerts (Bullish/Bearish)
Swing high/low formation alerts
Set up notifications for critical market structure changes
🎨 Fully Customizable
Every feature can be:
Toggled on/off individually via the Feature Toggles menu
Color customized to match your chart theme
Size adjusted for optimal visibility
Fine-tuned with sensitivity parameters
Organized settings groups make configuration intuitive and fast.
🚀 Why Choose This Indicator?
Feature: Benefit: All-in-One Solution. Replace multiple indicators with one comprehensive tool. Clean Design and Thoughtful visual hierarchy keep charts readable. Smart Overlap Prevention. Session bars automatically stack to avoid visual clutter. Real-Time Updates: All elements update dynamically as the price moves. Professional Quality-Built with best practices in Pine Script v6. Extensive Documentation, clear code comments, and an organized structure
📖 How to Use
Add the indicator to your TradingView chart
Enable/disable features using the Feature Toggles menu
Customize colors and settings to match your preferences
Adjust session times for your timezone
Set up alerts for trend changes and swing formations
Pro Tips:
Use session times to identify optimal entry windows during kill zones
Watch for price sweeping liquidity zones before looking for reversals
Combine HTF bias with lower timeframe entries for higher probability trades
Use swing levels as potential support/resistance for entries and targets
Monitor the dashboard for a quick market assessment before trading
⚠️ Disclaimer
This indicator is provided for educational and informational purposes only. It does not constitute financial advice. Trading involves substantial risk and is not suitable for all investors. Past performance is not indicative of future results. Always conduct your own analysis and consider your financial situation before making trading decisions.

Kalman Hull Trend Score [BackQuant]Kalman Hull Trend Score
Overview
Kalman Hull Trend Score is a trend-strength and regime-evaluation indicator that combines two ideas, Kalman filtering and Hull-style smoothing, then measures persistence of that filtered trend using a rolling score. The goal is to produce a cleaner, more stable trend read than typical moving average tools, while still reacting fast enough to be practical in live markets.
Instead of treating a moving average as a simple line you cross, this indicator turns the filtered trend into an oscillator-like score that answers: “Is the smoothed trend consistently progressing, or is it stalling and degrading?”
Core idea
The indicator is built from two components:
A Kalman-based smoothing engine that estimates price state and reduces noise adaptively.
A Hull-style construction that uses multiple Kalman passes to create a responsive, low-lag trend filter.
Once the Kalman Hull filter is built, a persistence score is calculated by comparing the current Kalman Hull value to many past values. The result is a trend score that rises in sustained trends and compresses or flips during deterioration.
Why Kalman instead of standard smoothing
Traditional moving averages apply fixed smoothing rules regardless of market conditions. A Kalman filter behaves differently, it is designed to estimate an underlying state in noisy data, adjusting how much it “trusts” new price information versus prior estimates.
This script exposes that behavior through two key controls:
Measurement Noise: how noisy the observed price is assumed to be.
Process Noise: how much the underlying state is allowed to evolve from bar to bar.
Together, these settings let you tune the balance between smoothness and responsiveness without relying on blunt averaging alone.
Kalman filter mechanics (conceptual)
Each update cycle follows the classic structure:
Prediction: assume the state continues, and expand uncertainty by process noise.
Update: compute Kalman Gain, then blend the new price observation into the estimate.
Correction: reduce uncertainty based on how much the filter accepted the new information.
When measurement noise is higher, the filter becomes more conservative, smoothing harder. When process noise is higher, the filter adapts faster to regime changes, but can become more reactive.
Check out the original script:
Kalman Hull construction
The “Hull” component is not a standard HMA built from WMAs. Instead, it recreates the Hull idea using Kalman filtering as the smoothing primitive. The structure follows the same intent as HMA, reduce lag while keeping the line smooth, but does it with Kalman passes:
Apply Kalman smoothing over multiple effective lengths.
Combine them using the Hull-style weighting logic.
Run the combined output through another Kalman pass to finalize smoothing.
The result is a Kalman Hull filter that aims to track trend with less jitter than raw price, and less lag than slow averages.
Another Kalman Hull with Supertrend
Trend scoring logic
The trend score is computed by comparing the current Kalman Hull value to past Kalman Hull values over a fixed lookback range (1 to 45 bars in this script):
If current kalmanHMA > kalmanHMA , add +1
If current kalmanHMA < kalmanHMA , add -1
This produces a persistence score rather than a simple direction signal. Strong trends where the filter keeps advancing will accumulate positive comparisons. Weak trends, chop, or reversals will cause the score to flatten, decay, or flip negative.
Interpreting the score
Read the score as trend conviction and persistence:
High positive values: bullish persistence, the filtered trend is progressing consistently.
Low positive values: trend exists but is fragile, progress is slowing.
Near zero: indecision, range behavior, frequent challenges to structure.
Negative values: bearish persistence or sustained deterioration in the filtered trend.
The rate of change matters:
Score expansion suggests trend is gaining traction.
Score compression often signals consolidation or exhaustion.
Fast flips usually accompany regime transitions.
Signal thresholds and regime transitions
User-defined thresholds convert the score into regimes:
Long threshold: score must exceed this level to confirm bullish persistence.
Short threshold: a crossunder of the score triggers bearish regime transition.
This is intentionally conservative. Long bias is maintained while the score holds above the long threshold. Short transitions are event-triggered on breakdown via crossunder, helping avoid constant flipping during minor noise.
Signals are only plotted on regime changes (first bar of the flip), keeping them clean for alerts and backtests.
Visual presentation
The indicator provides multiple layers depending on how you want to use it:
Kalman Hull Trend Score oscillator, color-coded by active regime.
Optional Kalman Hull filter plotted on the price chart for structure context.
Optional threshold reference lines for quick regime mapping.
Optional candle coloring and background shading for instant readability.
You can run it as a pure score panel or as a combined panel + on-chart trend overlay.
How to use in practice
Trend filtering
Favor long setups when the score remains above the long threshold.
Reduce directional aggression when score compresses toward zero.
Treat a short-threshold breakdown as a regime risk event, not just a signal.
Trend quality assessment
Rising score supports continuation trades and adds confidence to breakouts.
Flat or falling score warns that trend persistence is fading.
If price trends but score fails to expand, trend may be weak or liquidity-driven.
Trade management
Use the Kalman Hull line as dynamic structure reference on chart.
Use score deterioration to scale out before a full regime flip.
Use regime flips as confirmation for bias shifts rather than prediction.
Tuning guidelines
Measurement Noise
Higher: smoother filter, fewer false shifts, slower to adapt.
Lower: more responsive, more sensitive to microstructure noise.
Process Noise
Higher: adapts quicker to sudden changes, but can become twitchy.
Lower: steadier state estimate, but slower during sharp regime transitions.
A practical approach is to first tune measurement noise until the Kalman Hull line matches the “clean trend structure” you want, then adjust process noise to control how quickly it reacts when the regime genuinely changes.
Summary
Kalman Hull Trend Score transforms a Kalman-based Hull-style trend filter into a quantified persistence oscillator. By combining adaptive Kalman smoothing with low-lag Hull logic and a rolling comparison score, it provides a cleaner read on trend quality than basic moving averages or single-condition trend tools. It is best used as a regime filter, trend strength gauge, and structure-aware trade management layer.

MINI Lead Osc v2_ CCI_ Impulse_ REG🔹 MINI Lead Osc v2 — Momentum, Impulse & Early Reversal Tool
MINI Lead Osc v2 is a leading momentum oscillator designed to detect early shifts in market strength, impulse exhaustion, and potential reversals before they become obvious on price.
This indicator is part of the ICT Suite ecosystem and is engineered to work in confluence with:
Regression SuperTrend (WAIT)
Liquidity Oscillator (Structure & Bias)
Used together, they form a complete top-down trading framework.
⚙️ Core Logic
MINI Lead Osc v2 blends multiple engines into a single clean signal:
• CCI + RSI slope momentum
• ATR volatility shift
• Pivot-based divergence detection
• Adaptive Sensitivity+ engine
• Regression channel (linreg + RMSE bands)
The output is a normalized lead line that reacts before classic lagging indicators.
🚀 What This Indicator Is Best For
✔ Early trend continuation signals
✔ Detecting impulse starts, weakness, and distribution
✔ Filtering noise during ranges
✔ Momentum confirmation for pullback entries
✔ Spotting divergence without repainting
This is not a standalone “buy/sell spam” indicator — it is a decision-quality tool.
🔁 How to Use (Recommended Setup)
For best results, use MINI Lead Osc v2 together with:
1️⃣ Regression SuperTrend (WAIT)
→ Defines dominant trend & market regime
→ Filters counter-trend signals
2️⃣ Liquidity Oscillator (Structure)
→ Confirms break → pullback → continuation logic
→ Adds HTF bias & session context
3️⃣ MINI Lead Osc v2 (this script)
→ Times entries
→ Detects early momentum shifts
→ Confirms impulse quality
📌 Trade only when all three align.
🧠 Important Notes
• Signals are non-repainting (bar-close confirmed)
• Designed for discretionary trading, not automation
• Works best on 5m – 15m – 1h timeframes
• Crypto, Futures, and FX friendly
⚠️ Disclaimer
This indicator is for educational and analytical purposes only.
It does not constitute financial advice.
Always manage risk and confirm with price action.

Trend Sniper ProTrend Sniper Pro - Advanced Trend & Breakout Strategy
## 🚀 Overview
Trend Sniper Pro is not just another indicator; it is a professional trading system designed to filter out market noise and capture only high-probability moves. By combining **Price Action**, **Volume Confirmation**, and **Multi-Timeframe Analysis**, it operates with "sniper" precision.
It avoids the trap of "overtrading"—a trader's worst enemy—by only pulling the trigger when conditions are perfect.
💡 **IMPORTANT TIP:** This strategy yields the best results on **Stocks** (e.g., US Equities, BIST) on **DAILY** charts. It is optimized for patient investors looking to catch major trends.
## 🔑 Key Features
* **Dual-Layer Trend Filter**: Utilizes a modified SuperTrend alongside a robust Moving Average Alignment system to filter out false signals.
* **Smart Volume Validation**: Rising prices without volume are often traps. Signals are only generated when accompanied by significant volume volume.
* **Dynamic Risk Management**: Automatically plots **Risk/Reward Boxes** and **Trailing Stop Lines** (Teal for Bullish, Red for Bearish) upon entry.
* **Yearly High/Low Filter**: A macro filter that prevents you from buying at historical tops or selling at historical bottoms.
* **Compounding**: Automatically optimizes position size to compound gains during strong trends.
## 🆕 Crypto Mode
A special mode has been added for the more volatile Crypto markets. When you check the **"Crypto Mode"** box in the settings, the strategy applies much stricter filters to filter out "pump & dump" wicks and noise.
## 🛠️ How It Works
1. **Trend Alignment**: If the long-term trend is not in your favor, no trade is taken.
2. **Breakout**: Detects a breakout when Volatility (ATR) and Volume thresholds are exceeded.
3. **Entry Trigger**: A position is opened only when Price, Volume, and Trend align perfectly.
4. **Exit**: Positions are closed via ATR-based Stop Loss or a profit-locking Trailing Stop.
## ⚙️ Settings Guide
* **Crypto Mode**: Check this box for Cryptocurrencies. Leave unchecked for Stocks.
* **Main Settings**: Adjust SuperTrend sensitivity.
* **Risk Management**: Personalize your Stop Loss multiplier and profit targets.
* **Visual Settings**: Toggle target lines or boxes on/off.
## ⚠️ Disclaimer
This script is for educational purposes only and does not constitute financial advice. Past performance is not indicative of future results. Always backtest strategies on your specific pairs and timeframes before live trading.
---
*Developed for professional traders looking for a systematic edge in trending markets.*

Time & Price Confirmation (TPC)This one i am in the midst of trying to make better but for now its actually making money.
Core Concept:
Uses SuperTrend on two timeframes: Higher Timeframe (HTF) for trend direction and Lower Timeframe (LTF) for entry timing
Only signals trades when BOTH timeframes align
Key Components:
HTF Time (Higher Timeframe) - Checks if the main trend is strong:
🟢 Healthy = Strong trend, good momentum
🟠 Slowing = Trend weakening but still valid
🔴 Tired = Trend exhausted, avoid trading
LTF Confirm (Lower Timeframe) - Waits for price confirmation via:
SuperTrend flip (trend reversal)
Displacement candle (large range breakout)
Strong momentum move
Action Signals:
🚀 ENTER = Both HTF healthy + LTF confirmed (best setup)
⏳ HOLD = HTF still good but waiting for LTF confirmation
⏹️ NO TRADE = HTF tired or conditions not met

Volatility Trend FollowerThe script combines several classic technical analysis techniques:
SuperTrend / Adaptive Band - The main idea comes from the SuperTrend indicator, which uses ATR (Average True Range) to create a trailing band that adapts to volatility
ATR (Average True Range) - A volatility measure developed by J. Welles Wilder Jr.
EMA (Exponential Moving Average) - Used as a global trend filter
Heikin Ashi - An option to smooth prices and reduce noise

Greater Moving AverageThe purpose for this indicator is to function as a comprehensive market-state detector, with the primary goal of avoiding a market crash.
Mendoza Lines (V-pattern detection) identify early crash conditions and warn when market structure becomes unstable.
RSI/volume-shaded candles + Supertrend confirm momentum and trend, creating a unified system to avoid major drawdowns.
Enhanced Wyckoff ranges with ATR.
Mendoza lines identify abrupt V-shaped reversals which often precede high-risk crash structures. By tracking both the formation and resolution of these patterns across multiple timeframes, the indicator provides early warning signals when the market is entering unstable territory, allowing traders to step aside before liquidity collapses or structural breakdowns begin.
Ideal configurations use Heikin Ashi to smooth out candle structure. Observe SPX on a Weekly Chart, which correctly identifies exits and entries during the 2001 and 2009 crashes. On a 6 hour chart, the Tariff low is correctly identified. The improved VWAP uses a cumulative metric rather than the built in ta.vwap calculation, and functions as a macro low beacon when crossed with the 200 EMA. Historically, these crosses have aligned closely with macro cycle lows.
To round out the system, the indicator overlays RSI-based and volume-weighted candle shading to reflect internal momentum and real buying/selling pressure directly on the chart, making shifts in strength immediately visible. A Supertrend confirmation layer acts as the final filter, smoothing noise and verifying trend direction before decisions are made.

Estrategia Trend Following: 52w/26w BreakoutThis is a classic long-term Trend Following strategy, heavily inspired by the Donchian Channel system and the legendary "Turtle Trading" rules. It is designed to capture major market moves (bull runs) while filtering out short-term market noise and volatility.
This script is ideal for investors and swing traders who prefer a "hands-off" approach, looking to catch large trends rather than day-trading small fluctuations.
How it Works:
1. Entry Condition (The Breakout):
52-Week High: The strategy enters a Long position when the price breaks above the highest high of the last 252 trading days (approx. 1 year).
SuperTrend Filter: An additional filter using the SuperTrend indicator ensures that the breakout is supported by positive momentum, helping to reduce false signals during choppy lateral markets.
2. Exit Condition (The Trailing Stop):
26-Week Low: The strategy ignores short-term corrections. It only closes the position if the price closes below the lowest low of the last 126 trading days (approx. 6 months).
This wide stop allows the trade to "breathe" and stay open during significant pullbacks, ensuring you stay in the trend for as long as possible.
Features & Settings:
Customizable Lookback Periods: You can adjust the Entry (default 252 days) and Exit (default 126 days) periods in the settings menu.
Visual Aids:
Blue Line: Represents the 1-Year High (Entry Threshold).
Red Line: Represents the 6-Month Low (Dynamic Stop Loss).
Channel Shading: Visualizes the trading range between the high and low.
Labels: Clearly marks "BUY" and "EXIT" points on the chart.
Recommended Usage:
Timeframe: Daily (1D). This logic is designed for daily candles.
Assets: Works best on assets with strong trending characteristics (e.g., Bitcoin/Crypto, Tech Stocks, Indices like SPX/NDX, and Commodities).
Patience Required: This strategy generates very few signals. It may stay quiet for months and then hold a position for over a year.

複合ガチイカ🦑🦑🦑 日本語説明は英文の後ーーーーーーーーーーーーーーー
🦑 Composite Gachi Squid Indicator – A fun and intuitive trading overlay combining SuperTrend, ATR, and RSI.
Body color shows trend direction and strength.
Tentacles visualize volatility.
Eyes indicate overbought/oversold conditions.
🦑↑ / 🦑↓ marks provide clear entry signals.
Perfect for visual traders who want both style and actionable insights.
日本語説明-------------------------------------------------------------
🦑 複合ガチイカ・インジケーター – SuperTrend、ATR、RSI を組み合わせた遊び心と実用性を両立したチャートオーバーレイ。
イカの体の色でトレンドの方向と強さを表示
触手でボラティリティを可視化
目で買われすぎ・売られすぎを表示
🦑↑ / 🦑↓ が分かりやすいエントリーシグナル
見た目も楽しく、トレード判断にも使えるインジケーターです。

Superior-Range Bound Renko - Alerts - 11-29-25 - Signal LynxSuperior-Range Bound Renko – Alerts Edition with Advanced Risk Management Template
Signal Lynx | Free Scripts supporting Automation for the Night-Shift Nation 🌙
1. Overview
This is the Alerts & Indicator Edition of Superior-Range Bound Renko (RBR).
The Strategy version is built for backtesting inside TradingView.
This Alerts version is built for automation: it emits clean, discrete alert events that you can route into webhooks, bots, or relay engines (including your own Signal Lynx-style infrastructure).
Under the hood, this script contains the same core engine as the strategy:
Adaptive Range Bounding based on volatility
Renko Brick Emulation on standard candles
A stack of Laguerre Filters for impulse detection
K-Means-style Adaptive SuperTrend for trend confirmation
The full Signal Lynx Risk Management Engine (state machine, layered exits, AATS, RSIS, etc.)
The difference is in what we output:
Instead of placing historical trades, this version:
Plots the entry and RM signals in a separate pane (overlay = false)
Exposes alertconditions for:
Long Entry
Short Entry
Close Long
Close Short
TP1, TP2, TP3 hits (Staged Take Profit)
This makes it ideal as the signal source for automated execution via TradingView Alerts + Webhooks.
2. Quick Action Guide (TL;DR)
Best Timeframe:
4H and above. This is a swing-trading / position-trading style engine, not a micro-scalper.
Best Assets:
Volatile but structured markets, e.g.:
BTC, ETH, XAUUSD (Gold), GBPJPY, and similar high-volatility majors or indices.
Script Type:
indicator() – Alerts & Visualization Only
No built-in order placement
All “orders” are emitted as alerts for your external bot or manual handling
Strategy Type:
Volatility-Adaptive Trend Following + Impulse Detection
using Renko-like structure and multi-layer Laguerre filters.
Repainting:
Designed to be non-repainting on closed candles.
The underlying Risk Management engine is built around previous-bar data (close , high , low ) for execution-critical logic.
Intrabar values can move while the bar is forming (normal for any advanced signal), but once a bar closes, the alert logic is stable.
Recommended Alert Settings:
Condition: one of the built-in signals (see section 3.B)
Options: “Once Per Bar Close” is strongly recommended for automation
Message: JSON, CSV, or simple tokens – whatever your webhook / relay expects
3. Detailed Report: How the Alerts Edition Works
A. Relationship to the Strategy Version
The Alerts Edition shares the same internal logic as the strategy version:
Same Adaptive Lookback and volatility normalization
Same Range and Close Range construction
Same Renko Brick Emulator and directional memory (renkoDir)
Same Fib structures, Laguerre stack, K-Means SuperTrend, and Baseline signals (B1, B2)
Same Risk Management Engine and layered exits
In the strategy script, these signals are wired into strategy.entry, strategy.exit, and strategy.close.
In the alerts script:
We still compute the final entry/exit signals (Fin, CloseEmAll, TakeProfit1Plot, etc.)
Instead of placing trades, we:
Plot them for visual inspection
Expose them via alertcondition(...) so that TradingView can fire alerts.
This ensures that:
If you use the same settings on the same symbol/timeframe, the Alerts Edition and Strategy Edition agree on where entries and exits occur.
(Subject only to normal intrabar vs. bar-close differences.)
B. Signals & Alert Conditions
The alerts script focuses on discrete, automation-friendly events.
Internally, the main signals are:
Fin – Final entry decision from the RM engine
CloseEmAll – RM-driven “hard close” signal (for full-position exits)
TakeProfit1Plot / 2Plot / 3Plot – One-time event markers when each TP stage is hit
On the chart (in the separate indicator pane), you get:
plot(Fin) – where:
+2 = Long Entry event
-2 = Short Entry event
plot(CloseEmAll) – where:
+1 = “Close Long” event
-1 = “Close Short” event
plot(TP1/TP2/TP3) (if Staged TP is enabled) – integer tags for TP hits:
+1 / +2 / +3 = TP1 / TP2 / TP3 for Longs
-1 / -2 / -3 = TP1 / TP2 / TP3 for Shorts
The corresponding alertconditions are:
Long Entry
alertcondition(Fin == 2, title="Long Entry", message="Long Entry Triggered")
Fire this to open/scale a long position in your bot.
Short Entry
alertcondition(Fin == -2, title="Short Entry", message="Short Entry Triggered")
Fire this to open/scale a short position.
Close Long
alertcondition(CloseEmAll == 1, title="Close Long", message="Close Long Triggered")
Fire this to fully exit a long position.
Close Short
alertcondition(CloseEmAll == -1, title="Close Short", message="Close Short Triggered")
Fire this to fully exit a short position.
TP 1 Hit
alertcondition(TakeProfit1Plot != 0, title="TP 1 Hit", message="TP 1 Level Reached")
First staged take profit hit (either long or short). Your bot can interpret the direction based on position state or message tags.
TP 2 Hit
alertcondition(TakeProfit2Plot != 0, title="TP 2 Hit", message="TP 2 Level Reached")
TP 3 Hit
alertcondition(TakeProfit3Plot != 0, title="TP 3 Hit", message="TP 3 Level Reached")
Together, these give you a complete trade lifecycle:
Open Long / Short
Optionally scale out via TP1/TP2/TP3
Close remaining via Close Long / Close Short
All while the Risk Management Engine enforces the same logic as the strategy version.
C. Using This Script for Automation
This Alerts Edition is designed for:
Webhook-based bots
Execution relays (e.g., your own Lynx-Relay-style engine)
Dedicated external trade managers
Typical setup flow:
Add the script to your chart
Same symbol, timeframe, and settings you use in the Strategy Edition backtests.
Configure Inputs:
Longs / Shorts enabled
Risk Management toggles (SL, TS, Staged TP, AATS, RSIS)
Weekend filter (if you do not want weekend trades)
RBR-specific knobs (Adaptive Lookback, Brick type, ATR vs Standard Brick, etc.)
Create Alerts for Each Event Type You Need:
Long Entry
Short Entry
Close Long
Close Short
TP1 / TP2 / TP3 (optional, if your bot handles partial closes)
For each:
Condition: the corresponding alertcondition
Option: “Once Per Bar Close” is strongly recommended
Message:
You can use structured JSON or a simple token set like:
{"side":"long","event":"entry","symbol":"{{ticker}}","time":"{{timenow}}"}
or a simpler text for manual trading like:
LONG ENTRY | {{ticker}} | {{interval}}
Wire Up Your Bot / Relay:
Point TradingView’s webhook URL to your execution engine
Parse the messages and map them into:
Exchange
Symbol
Side (long/short)
Action (open/close/partial)
Size and risk model (this script does not position-size for you; it only signals when, not how much.)
Because the alerts come from a non-repainting, RM-backed engine that you’ve already validated via the Strategy Edition, you get a much cleaner automation pipeline.
D. Repainting Protection (Alerts Edition)
The same protections as the Strategy Edition apply here:
Execution-critical logic (trailing stop, TP triggers, SL, RM state changes) uses previous bar OHLC:
open , high , low , close
No security() with lookahead or future-bar dependencies.
This means:
Alerts are designed to fire on states that would have been visible at bar close, not on hypothetical “future history.”
Important practical note:
Intrabar: While a bar is forming, internal conditions can oscillate.
Bar Close: With “Once Per Bar Close” alerts, the fired signal corresponds to the final state of the engine for that candle, matching your Strategy Edition expectations.
4. For Developers & Modders
You can treat this Alerts script as an ”RM + Alert Framework” and inject any signal logic you want.
Where to plug in:
Find the section:
// BASELINE & SIGNAL GENERATION
You’ll see how B1 and B2 are built from the RBR stack and then combined:
baseSig = B2
altSig = B1
finalSig = sigSwap ? baseSig : altSig
To use your own logic:
Replace or wrap the code that sets baseSig / altSig with your own conditions:
e.g., RSI, MACD, Heikin Ashi filters, candle patterns, volume filters, etc.
Make sure your final decision is still:
2 → Long / Buy signal
-2 → Short / Sell signal
0 → No trade
finalSig is then passed into the RM engine and eventually becomes Fin, which:
Drives the Long/Short Entry alerts
Interacts with the RM state machine to integrate properly with AATS, SL, TS, TP, etc.
Because this script already exposes alertconditions for key lifecycle events, you don’t need to re-wire alerts each time — just ensure your logic feeds into finalSig correctly.
This lets you use the Signal Lynx Risk Management Engine + Alerts wrapper as a drop-in chassis for your own strategies.
5. About Signal Lynx
Automation for the Night-Shift Nation 🌙
Signal Lynx builds tools and templates that help traders move from:
“I have an indicator” → “I have a structured, automatable strategy with real risk management.”
This Superior-Range Bound Renko – Alerts Edition is the automation-focused companion to the Strategy Edition. It’s designed for:
Traders who backtest with the Strategy version
Then deploy live signals with this Alerts version via webhooks or bots
While relying on the same non-repainting, RM-driven logic
We release this code under the Mozilla Public License 2.0 (MPL-2.0) to support the Pine community with:
Transparent, inspectable logic
A reusable Risk Management template
A reference implementation of advanced adaptive logic + alerts
If you are exploring full-stack automation (TradingView → Webhooks → Exchange / VPS), keep Signal Lynx in your search.
License: Mozilla Public License 2.0 (Open Source).
If you build improvements or helpful variants, please consider sharing them back with the community.

Filter Trend1. Indicator Name
Premium EMA Ribbon Filter (Pro Version)
(Advanced Trend & Momentum Filtering System Based on EMA Ribbons)
2. One-Line Introduction
A professional trend-analysis indicator that blends an advanced noise-filtering algorithm with an EMA ribbon system to extract only the pure bullish/bearish trend while smoothing out market noise.
3. Overall Description (7+ lines)
The Premium EMA Ribbon Filter is more than just a set of EMAs.
It analyzes the structure of a fast, medium, and slow EMA ribbon—along with the spacing and alignment between them—to determine whether the market is in a bullish trend, bearish trend, or a neutral/noise-heavy zone.
The core of this indicator is its noise-reduction algorithm and trend-strength calculation system.
Instead of relying on simple EMA cross signals, it evaluates how consistently the ribbon maintains bullish/bearish alignment over a specified period and highlights only strong trends with color coding, while weak or noisy areas are displayed in gray.
This helps traders avoid confusing or false signals and clearly focus only on the “meaningful zones.”
A Triple-Smoothing System is applied to create smoother, more refined ribbon movements, forming a stable “premium trend curve” that is less affected by short-term volatility.
As a result, this indicator works effectively for scalping, swing trading, and long-term trend following—staying true to the principle of removing noise and highlighting only the core market flow.
4. Short Advantages (6 items)
① Complete Noise Filtering
Using EMA ribbon comparison + tolerance logic, false reversals are largely eliminated, leaving only stable trend phases.
② Highly Readable Color System
Bullish trends are mint, bearish trends are red, and neutral/noise zones are gray—instantly visualizing market conditions.
③ Trend Strength Visualization
Not only trend direction but also trend strength is displayed via dynamic color transparency.
④ Smooth, Premium-Style Ribbon Design
Triple-smoothing creates a refined, luxury-level smoothness in movement.
⑤ Works Across All Timeframes
From 1-minute scalping to daily/weekly macro trend analysis.
⑥ Excellent Real-Trading Compatibility
Works extremely well when combined with ATR, SuperTrend, and volume-based indicators.
Indicator Manual (Required Section)
📌 Understanding the Core Concept
The indicator uses three EMAs (e.g., 20/50/100) arranged as a ribbon to analyze the structural alignment of the trend.
When the EMAs are cleanly aligned Top → Middle → Bottom, the market is in a bullish trend.
When aligned Bottom → Middle → Top, the market is in a bearish trend.
The indicator further evaluates the ribbon spread (gap) and the consistency of alignment to compute trend strength.
Noisy market conditions are shaded gray to clearly indicate “uncertain/indecisive” zones.
⚙️ Settings Description
Option Description
Fast EMA Most sensitive EMA; detects early trend signals
Mid EMA Stabilizes the primary trend direction
Slow EMA Defines the broader, long-term trend flow
Trend Lookback The period used to analyze trend strength
Noise Tolerance (%) Higher values = stronger noise removal
Smoothing Steps Controls how smooth the ribbon becomes
📈 Example Recognition
A bullish continuation/entry scenario forms when:
EMAs align in the order Fast → Mid → Slow (top side)
Ribbon color shifts into mint (strong bullish trend)
The ribbon begins to expand while price stays above the ribbon
📉 Example Recognition
A bearish continuation/entry occurs when:
EMAs align Fast → Mid → Slow (bottom side)
Ribbon color remains red
After contracting, the ribbon expands again during renewed downside strength
🧪 Recommended Usage
Combine with volume-based indicators (OBV, Volume Profile) → enhanced strong-trend detection
Use with SuperTrend or ATR Stop → clearer stop-loss placement
Combine with RSI/Stoch → avoid counter-trend entries in overheated conditions
Higher leverage traders should use higher tolerance settings
🔒 Cautions
EMA ribbons are trend-following tools; signals may weaken in ranging/sideways markets.
Never rely solely on this indicator—always confirm with volume, price patterns, or structure.
Very low Lookback values may cause excessive re-entry signals.
In high-volatility environments, ribbon spacing can contract/expand rapidly—use with caution.

MTF Intraday v2.0📊 Description
MTF Intraday v2.0 is an informative indicator for analyzing trend strength across multiple timeframes simultaneously. Designed specifically for intraday (session) trading during European and US market hours.
The indicator shows the real market picture without lagging signals - you see the trend strength right now for each timeframe.
🎯 Key Features
1. Multi-Timeframe Analysis (D1, H4, H1, M30, M15)
Analyzes 4 indicators on each TF: SuperTrend, RSI, EMA crossover, EMA200
Shows strength for each timeframe: STRONG / MED / WEAK
Color indication: 🟢 green (LONG strong), 🔴 red (SHORT strong), 🟡 yellow (medium), ⚪ gray (weak)
2. Intraday Trading Hierarchy
D1 - global context (affects quality assessment)
H4 - general (sets the main trend)
H1 - reference point for intraday
M30/M15 - finding entry points during sessions
3. Market Pulse
🔥 HOT - when both H4 and H1 are STRONG (best time to enter!)
✓ GOOD - when H4 or H1 is STRONG
L:45 S:20 - balance of power between LONG and SHORT (statistics instead of "wait")
4. Volume Indicator (24 hours)
Shows volume change over the last 24 hours
SPIKE! - when volume increased by the set % (default 50%)
Considers candle color: 🟢 LONG spike (rise + green candle), 🔴 SHORT spike (rise + red candle)
Works on any timeframe (automatically recalculates)
5. Compact Mode
OFF - shows all details: every indicator for each TF
ON - only strength per timeframe (for clean chart)
⚙️ Settings
Main:
SuperTrend Period (21) / Multiplier (6.3)
RSI Length (14)
EMA Short (50) / Long (100) / 200
Compact Mode - hide detailed indicators
Volume:
Show Volume - show/hide volume indicator
Volume Alerts ON/OFF - enable/disable volume alerts
Volume Spike (%) - spike threshold (30% / 50% / 100%)
🔔 Alerts
The indicator has 5 types of alerts:
Market HOT - H4 and H1 simultaneously became STRONG
VOL LONG - volume spike on bullish candle
VOL SHORT - volume spike on bearish candle
EMA200 UP - price crossed EMA200 upward
EMA200 DN - price crossed EMA200 downward
Set up in TradingView: Create Alert → Select desired alert from the list
📈 How to Use
For finding entry points:
Check H4 - should be at least MED (better STRONG)
Verify H1 - main filter for intraday
Wait for pulse "🔥 HOT" or at least "✓ GOOD"
Look at M30/M15 - seek confirmation
Check 24h VOL - if SPIKE, momentum has started
Quality Assessment:
EXCELLENT ⭐ - all stars aligned (D1 with us, high score)
GOOD - good setup
WARNING ⚠️ - D1 against trend (counter-trend, be careful!)
Color Indication:
🟢 Green cells - bullish signal
🔴 Red cells - bearish signal
🟡 Yellow cells - neutral/waiting
🟠 Orange TF labels - for readability
⚠️ Important
This is an informative indicator, not a trading system
Does not give "entry/exit" signals - shows trend strength in the moment
Use together with Price Action and your trading strategy
RSI on M15 is displayed but not counted (too much noise)
💡 Who is it for
✅ Intraday traders (Europe/US sessions)
✅ Scalpers on crypto and forex
✅ Swing traders for trend confirmation
✅ Those who trade on multiple timeframes simultaneously

my_strategy_2.0Overview:
This is a high-speed scalping strategy optimized for volatile crypto assets (BTC, ETH, etc.) on timeframes 1m–5m. It combines trend-following SuperTrend with confirmations from MACD, RSI, Bollinger Bands, and volume spikes for precise entries. Focus on quick profits (1–3 ATR) with strict risk control: partial take-profits, stop-loss, and trailing breakeven after the first TP.
Key Signals:
Long: SuperTrend flip up + MACD crossover up + RSI >50 + BB Upper breakout + volume spike + volatility filter (ATR >0.5%).
Short: Similar but downward.
Exits and Risks:
TP: 33% at +1 ATR, 33% at +2 ATR, 34% at +3 ATR (customizable).
SL: Initial at -1 ATR, after TP1 — to breakeven with trailing on BB midline (optional).
Filters: Minimum ATR to avoid flat markets; realistic commissions in backtests.
Recommendations:
Test on 2020–2025 data (out-of-sample 2024+). Expected Win Rate ~55%, Profit Factor >1.8, Drawdown <10%. Ideal for 1–2% risk per trade. Not for beginners — use paper trading.
Disclaimer: Past results do not guarantee future performance. Trade at your own risk.
(Pine v6 code, ready for publication. Author: gopog777 with expert fixes.)

Confluence Engine Confluence Engine is a practical, non-repainting decision aid that scores market conditions from −100…+100 by combining six proven modules: Trend, Momentum, Volatility, Volume, Structure, and an HTF confirmation. It’s designed for crypto, forex, indices, and stocks, and it fires entries only on confirmed bar closes.
What’s inside
Trend: EMA 20/50/200 alignment plus a Supertrend/KAMA toggle (you choose the baseline).
Momentum: RSI + MACD with confirmed-pivot divergence detection.
Volatility: ATR% and Bollinger Band width vs its average to favor expansion over chop.
Volume: OBV-style cumulative flow slope + volume surge vs SMA×multiplier.
Market Structure: Confirmed pivots, BOS (break of structure) and CHOCH (change of character).
HTF Filter: Closed higher-timeframe context via request.security(..., barmerge.gaps_on, barmerge.lookahead_off).
Why it does not repaint
Signals are computed and plotted on closed bars only.
Pivots/divergences use confirmed pivot points (no forward look).
HTF series are fetched with lookahead_off and use the last closed HTF bar in realtime.
No future bar references are used for entries or alerts.
How to use (3 steps)
Pick a timeframe pair: use a 4–6× HTF multiplier (5m→30m, 15m→1h, 1h→4h, 4h→1D, 1D→1W).
Trade with the HTF: take longs only when the HTF filter is bullish; shorts only when bearish.
Prefer expansion: act when BB width > its average and ATR% is elevated; skip most signals in compression.
Suggested presets (start here)
Crypto (BTC/ETH): 15m→1h, 1h→4h. stLen=10, stMult=3.0, bbLen=20, surgeMul=1.8–2.2, thresholds +40 / −40 (intraday can try +35 / −35).
Forex majors: 15m→1h, 1h→4h. stLen=10–14, stMult=2.5–3.0, surgeMul=1.5–1.8, thresholds +35 / −35 (swing: +45 / −45).
US equities (liquid): 5m→30m/1h, 15m→1h/2h. stMult=3.0–3.5, surgeMul=1.6–2.0, thresholds +45 / −45 to reduce chop.
Indices (ES/NQ): 5m→30m, 15m→1h. Defaults are fine; start at +40 / −40.
Gold/Oil: 15m→1h, 1h→4h. Thresholds +35 / −35, surgeMul=1.6–1.9.
Inputs (plain English)
Use Supertrend (off = KAMA): choose the trend baseline.
EMA Fast/Mid/Slow: 20/50/200 by default for classic stack.
RSI/MACD + divergence pivots: momentum and exhaustion context.
ATR Length & BB Length: volatility regime detection.
Volume SMA & Surge Multiplier: defines “meaningful” volume spikes.
Pivot left/right & “Confirm BOS/CHOCH on Close”: structure strictness.
Enable HTF & Higher Timeframe: confirms the lower timeframe direction.
Thresholds (+long / −short): when the score crosses these, you get signals.
Signals & alerts (IDs preserved)
Entry shapes plot at bar close when the score crosses thresholds.
Alerts you can enable:
CONFLUENCE LONG — long entry signal
CONFLUENCE SHORT — short entry signal
BULLISH BIAS — score turned positive
BEARISH BIAS — score turned negative
Best practices
Focus on signals with HTF agreement and volatility expansion; require volume participation (surge or rising OBV slope) for higher quality.
Raise thresholds (+45/−45 or +50/−50) to reduce whipsaws in choppy sessions.
Lower thresholds (+35/−35) only if you also require volatility/volume filters.
Performance & scope
Works across crypto/FX/equities/indices; no broker data or special feeds required.
No repainting by design; signals/alerts are computed on closed bars.
As with any tool, results vary by regime; always combine with risk management.
Disclosure
This script is for educational purposes only and is not financial advice. Trading involves risk. Test on historical data and paper trade before using live.

Trend Band Oscillator📌 Trend Band Oscillator
📄 Description
Trend Band Oscillator is a momentum-based trend indicator that calculates the spread between two EMAs and overlays it with a volatility filter using a standard deviation band. It helps traders visualize not only the trend direction but also the strength and stability of the trend.
📌 Features
🔹 EMA Spread Calculation: Measures the difference between a fast and slow EMA to quantify short-term vs mid-term trend dynamics.
🔹 Volatility Band Overlay: Applies an EMA of standard deviation to the spread to filter noise and highlight valid momentum shifts.
🔹 Color-Based Visualization: Positive spread values are shown in lime (bullish), negative values in fuchsia (bearish) for quick directional insight.
🔹 Upper/Lower Bands: Help detect potential overbought/oversold conditions or strong trend continuation.
🔹 Zero Line Reference: A horizontal baseline at zero helps identify trend reversals and neutral zones.
🛠️ How to Use
✅ Spread > 0: Indicates a bullish trend. Consider maintaining or entering long positions.
✅ Spread < 0: Indicates a bearish trend. Consider maintaining or entering short positions.
⚠️ Spread exceeds bands: May signal overextension or strong momentum; consider using with additional confirmation indicators.
🔄 Band convergence: Suggests weakening trend and potential transition to a ranging market.
Recommended timeframes: 1H, 4H, Daily
Suggested complementary indicators: RSI, MACD, OBV, SuperTrend
✅ TradingView House Rules Compliance
This script is open-source and published under Pine Script v5.
It does not repaint, spam alerts, or cause performance issues.
It is designed as an analytical aid only and should not be considered financial advice.
All calculations are transparent, and no external data sources or insecure functions are used.
====================================================================
📌 Trend Band Oscillator
📄 설명 (Description)
Trend Band Oscillator는 두 개의 EMA 간 스프레드(차이)를 기반으로 한 모멘텀 중심의 추세 오실레이터입니다. 여기에 표준편차 기반의 변동성 밴드를 적용하여, 추세의 방향뿐 아니라 강도와 안정성까지 시각적으로 분석할 수 있도록 설계되었습니다.
📌 주요 특징 (Features)
🔹 EMA 기반 스프레드 계산: Fast EMA와 Slow EMA의 차이를 활용해 시장 추세를 정량적으로 표현합니다.
🔹 표준편차 필터링: Spread에 대해 EMA 및 표준편차 기반의 밴드를 적용해 노이즈를 줄이고 유효한 추세를 강조합니다.
🔹 컬러 기반 시각화: 오실레이터 값이 양수일 경우 초록색, 음수일 경우 마젠타 색으로 추세 방향을 직관적으로 파악할 수 있습니다.
🔹 밴드 범위 시각화: 상·하위 밴드를 통해 스프레드의 평균 편차 범위를 보여주며, 추세의 강약과 포화 여부를 진단할 수 있습니다.
🔹 제로 라인 표시: 추세 전환 가능 지점을 시각적으로 확인할 수 있도록 중심선(0선)을 제공합니다.
🛠️ 사용법 (How to Use)
✅ 오실레이터가 0 이상 유지: 상승 추세 구간이며, 롱 포지션 유지 또는 진입 검토
✅ 오실레이터가 0 이하 유지: 하락 추세 구간이며, 숏 포지션 유지 또는 진입 검토
⚠️ 상·하위 밴드를 이탈: 일시적인 과매수/과매도 혹은 강한 추세 발현 가능성 있음 → 다른 보조지표와 함께 필터링 권장
🔄 밴드 수렴: 추세가 약해지고 있음을 나타냄 → 변동성 하락 또는 방향성 상실 가능성 있음
권장 적용 시간대: 1시간봉, 4시간봉, 일봉
보조 적용 지표: RSI, MACD, OBV, SuperTrend 등과 함께 사용 시 신호 필터링에 유리
✅ 트레이딩뷰 하우스룰 준수사항 (TV House Rules Compliance)
이 지표는 **무료 공개용(Open-Source)**이며, Pine Script Version 5로 작성되어 있습니다.
과도한 리페인트, 비정상적 반복 경고(alert spam), 실시간 성능 저하 등의 요소는 포함되어 있지 않습니다.
사용자는 본 지표를 투자 결정의 참고용 보조 도구로 활용해야 하며, 독립적인 매매 판단이 필요합니다.
데이터 소스 및 계산 방식은 완전히 공개되어 있으며, 외부 API나 보안 취약점을 유발하는 구성 요소는 없습니다.

Strategy Builder With IndicatorsThis strategy script is designed for traders who enjoy building systems using multiple indicators.
Please note: This script does not include any built-in indicators. Instead, it works by referencing the plot outputs of the indicators you’ve already added to your chart.
For example, if you add a MACD and an ATR indicator to your chart, you can assign their plot values as inputs in the settings panel of this strategy.
• MACD as a trigger
• ATR as a filter
How Filters Work
Filters check whether certain conditions are met before a trade can be opened. For instance, if you set a filter like ATR > 30, then no trade will be executed unless that condition is true — even if the trigger fires.
All filters are linked, meaning every active filter must be satisfied for a trade to occur.
How Triggers Work
Triggers are what actually fire a trade signal — such as a moving average crossover or RSI breaking above a specific level. Unlike filters, triggers are independent. Only one active trigger needs to be true for the trade to execute.
Thanks to its modular structure, this strategy can be used with any indicator of your choice.
⸻
Risk Management Features
In the settings, you’ll find flexible options for:
• Stop Loss (SL)
• Trailing Stop Loss (TSL)
• Multi Take-Profit (TP)
These features enhance trade safety and let you tailor your risk management.
SL types available:
• Tick-based SL
• Percent-based SL
• ATR-based SL
Once you select your preferred SL type, you can fine-tune its distance using the offset field.
Trailing SL allows your stop to follow price as it moves in your favor — helping to lock in profits.
Multi-TP lets you take profits at two different levels, helping you secure gains while leaving room for extended moves.
Breakeven option is also available to automatically move your SL to entry after reaching a profit threshold.
⸻
How to Build a Solid Strategy
Let’s break down a good setup into three key components:
1. Trend Filter
Avoid trading against the trend — that’s like swimming against the current.
Use a filter like:
• Supertrend
• Momentum indicators
• Candlestick bias, etc.
Example: In this case, I used Supertrend and filtered for trades only if the price is above the uptrend line.
2. Trigger Condition
Once we confirm the trend is on our side, we need a trigger to execute at the right moment. This can be:
• RSI cross
• Candlestick patterns
• Trendline breaks
• Moving average crossovers, etc.
Example: I used RSI crossing above 50 as the entry trigger.
3. Risk Management
Even in the right trend at the right time — anything can happen. That’s why you should always define Stop Loss and Take Profit levels.
⸻
And there you have it! Your strategy is ready to backtest, refine, and deploy with alerts for live trading.
Questions or suggestions? Feel free to reach out

KTUtilsLibrary "KTUtils"
Utility functions for technical analysis indicators, trend detection, and volatility confirmation.
MGz(close, length)
MGz
@description Moving average smoother used for signal processing
Parameters:
close (float) : float Price input (typically close)
length (int) : int Length of smoothing period
Returns: float Smoothed value
atrConf(length)
atrConf
@description Calculates Average True Range (ATR) for volatility confirmation
Parameters:
length (simple int) : int Length for ATR calculation
Returns: float ATR value
f(input)
f
@description Simple Moving Average with fixed length
Parameters:
input (float) : float Input value
Returns: float Smoothed average
bcwSMA(s, l, m)
bcwSMA
@description Custom smoothing function with weight multiplier
Parameters:
s (float) : float Signal value
l (int) : int Length of smoothing
m (int) : int Weighting multiplier
Returns: float Smoothed output
MGxx(close, length)
MGxx
@description Custom Weighted Moving Average (WMA) variant
Parameters:
close (float) : float Price input
length (int) : int Period length
Returns: float MGxx smoothed output
_PerChange(lengthTime)
_PerChange
@description Measures percentage price change over a period and range deviation
Parameters:
lengthTime (int) : int Period for change measurement
Returns: tuple Measured change, high deviation, low deviation
dirmov(len)
dirmov
@description Calculates directional movement components
Parameters:
len (simple int) : int Lookback period
Returns: tuple Plus and Minus DI values
adx(dilen, adxlen)
adx
@description Calculates Average Directional Index (ADX)
Parameters:
dilen (simple int) : int Length for DI calculation
adxlen (simple int) : int Length for ADX smoothing
Returns: float ADX value
trChopAnalysis()
trChopAnalysis
@description Identifies chop and trend phases based on True Range Bollinger Bands
Returns: tuple TR SMA, chop state, trending state
wtiAnalysis(haclose, close, filterValue)
wtiAnalysis
@description Wave Trend Indicator (WTI) with signal crossover logic
Parameters:
haclose (float) : float Heikin-Ashi close
close (float) : float Standard close
filterValue (simple int) : int Smoothing length
Returns: tuple WTI lines and direction states
basicTrend(hahigh, halow, close, open, filterValue)
basicTrend
@description Determines trend direction based on HA high/low and close
Parameters:
hahigh (float) : float Heikin-Ashi high
halow (float) : float Heikin-Ashi low
close (float) : float Standard close
open (float) : float Standard open
filterValue (simple int) : int Smoothing period
Returns: tuple Uptrend, downtrend flags
metrics(close, filterValue)
metrics
@description Common market metrics
Parameters:
close (float) : float Price input
filterValue (int) : int RSI smoothing length
Returns: tuple VWMA, SMA10, RSI, smoothed RSI
piff(close, trend_change)
piff
@description Price-Informed Forward Forecasting (PIFF) model for trend strength
Parameters:
close (float) : float Price input
trend_change (float) : float Change in trend
Returns: tuple Percent change, flags for trend direction
getMACD()
getMACD
@description Returns MACD, signal line, and histogram
Returns: tuple MACD line, Signal line, Histogram
getStoch()
getStoch
@description Returns K and D lines of Stochastic Oscillator
Returns: tuple K and D lines
getKDJ()
getKDJ
@description KDJ momentum oscillator
Returns: tuple K, D, J, Average
getBBRatio()
getBBRatio
@description Bollinger Band Ratio (BBR) and signal flags
Returns: tuple Basis, Upper, Lower, BBR, BBR Up, BBR Down
getSupertrend()
getSupertrend
@description Supertrend values and direction flags
Returns: tuple Supertrend, Direction, Up, Down

Exponential Trend [AlgoAlpha]OVERVIEW
This script plots an adaptive exponential trend system that initiates from a dynamic anchor and accelerates based on time and direction. Unlike standard moving averages or trailing stops, the trend line here doesn't follow price directly—it expands exponentially from a pivot determined by a modified Supertrend logic. The result is a non-linear trend curve that starts at a specific price level and accelerates outward, allowing traders to visually assess trend strength, persistence, and early-stage reversal points through both base and volatility-adjusted extensions.
CONCEPTS
This indicator builds on the idea that trend-following tools often need dynamic, non-static expansion to reflect real market behavior. It uses a simplified Supertrend mechanism to define directional context and anchor levels, then applies an exponential growth function to simulate trend acceleration over time. The exponential growth is unidirectional and resets only when the direction flips, preserving trend memory. This method helps avoid whipsaws and adds time-weighted confirmation to trends. A volatility buffer—derived from ATR and modifiable by a width multiplier—adds a second layer to indicate zones of risk around the main trend path.
FEATURES
Exponential Trend Logic : Once a directional anchor is set, the base trend line accelerates using an exponential formula tied to elapsed bars, making the trend stronger the longer it persists.
Volatility-Adjusted Extension : A secondary band is plotted above or below the base trend line, widened by ATR to visualize volatility zones, act as soft stop regions or as a better entry point (Dynamic Support/Resistance).
Color-Coded Visualization : Clear green/red base and extension lines with shaded fills indicate trend direction and confidence levels.
Signal Markers & Alerts : Triangle markers indicate confirmed trend reversals. Built-in alerts notify users of bullish or bearish direction changes in real-time.
USAGE
Use this script to identify strong trends early, visually measure their momentum over time, and determine safe areas for entries or exits. Start by adjusting the *Exponential Rate* to control how quickly the trend expands—the higher the rate, the more aggressive the curve. The *Initial Distance* sets how far the anchor band is placed from price initially, helping filter out noise. Increase the *Width Multiplier* to widen the volatility zone for more conservative entries or exits. When the price crosses above or below the base line, a new trend is assumed and the exponential projection restarts from the new anchor. The base trend and its extension both shift over time, but only reset on a confirmed reversal. This makes the tool especially useful for momentum continuation setups or trailing stop logic in trending markets.
