Dual Timeframe Williams Percent RangeThis is a dual timeframe Williams Percent Range indicator.
Function:
The idea behind this indicator is for trader to see what the Williams %r is doing on higher timeframes without the need to change the chart. I added the "Smoothing" function to take the jagged lines out of the higher timeframe. It has a better flow this way.
If we choose the 4H and the Daily timeframes for example. In this bullish situation I wait for the Daily WPR to cross above the -50 mid line. Then the faster 4H WPR will eventually hit the bottom and begin to rise again back into the trend.
This is the "Reset" of the 4H WPR and when the 4H WPR crosses up above the -50 mid line again it means price should begin to rise on the chart. I added the option to change the colour when the signal lines cross the -50. It is good to use a fast time frame so you can see the WPR hitting the bottom in an uptrend, but not too fast.
The Heiken Ashi candle sticks are a very good addition to this system. You can also use a colour changing 200 EMA if you run the "1H/Daily" in the WPR. Or the 50 EMA if you run the Daily 4H.
This system could be used on lower timeframes too but I have not tested it there.
The Dual WPR indicator, the colour changing 50 EMA and Heiken Ashi have been optimised for the 4H/Daily.
If you want to set alerts the the faster WPR line crossing the -50 is good, on candle close.
This way you will only need one alert per chart.
If you get an alert on the EURUSD 4H that the 4H WPR has crossed up then look to see what what the Daily WPR is doing. If it is also above the -50 mid line then EURUSD is probably trending up.
Thank you to TradingView for supplying the Williams %r template.
I hope this helps some other traders out there.
I combined the Supertrend and the Coloured EMA in the main screen into one indicator.
This is my first indicator published :-)
Have fun out there and good luck.
Eddie T.
ابحث في النصوص البرمجية عن "supertrend"

Indian Markets Dashboard The Mobile Dashboard indicator provides a compact and customizable table on your TradingView chart, summarizing key data for up to six selected financial instruments. It displays the close price, previous day high (PDH), previous day low (PDL), and SuperTrend direction (Bull/Bear). The table's position, size, and transparency can be adjusted to suit your preferences, making it a convenient tool for quickly monitoring multiple assets on the go. Ideal for traders who need a clear and concise overview of market conditions directly on their chart.
- TraderVK

Market Waves [BigBeluga]MARKET WAVES
Market Waves The Market Waves [ BigBeluga ] is an all in one toolkit focusing on trends, accumulations and identifying market structures right on your chart. It is lightweight and powerful in its approaches, taking unique mathematical approaches to classical tools.
⬤ Signals
The Beluga Signals combine tested powerful ideas into a single tool. They are designed to follow trends and reduce noise in the market using low pass filtering methods. There are two types of signals founds in this toolkit; normal and power signals. Power signals are signals with a + in them indicating that the signal may be more likely to play out.
These are great when used in confluence with other trend following tools to filter them for even greater performance. Naturally traders will want to use these with confluence to confirm the trend identification.
The signals come with take profits built in. Ticks are placed on the chart indicating a potential areas to be taking profit. Using these as exits can be powerful especially when using confluence. Max Profit labels are also produced suggesting it really is the ideal time to be exiting the market before a reversal comes.
By leveraging unique low lag methods and filtering approaches, these signals offer a unique edge when compared to classical TSL such as a SuperTrend or PSAR.
⬤ Smooth Trend
The Smooth Trend (shown here with green and red shadows) also focuses on low lag noise filtering. This unique system is perfect when used for entries or as a filter. Users are able to adjust how fast or slow the trend is identified.
In the example above, we see a sell signal during the time the smooth trend is green. Therefore using confluence we can filter out the signal and proceed to take our power buy signal.
Percentages are also provided at the start of the trend. These indicate the probability this really is a new trend. In the image above we again see the trends are both labelled as 100% and the system is fully confident what we were seeing was indeed a trend reversal.
Although it may appear as a classical trend following tool, again it's uniqueness lies in its ability to locate market bottoms and respond to trends.
⬤ The Trend Accumulations
This feature focuses on elegant trend and range identification making trader's lives easier. By not cluttering the chart this system allows traders to see an asset's behavior without overlays.
Uptrends, downtrends and ranges are identified with uptrends showing with a green base line, downtrends with a red one and ranges/accumulations in blue. As shown in the image above; this is a powerful system to avoid trading ranges/chop in the market. We see a blue accumulation zone, this means the market is best to avoid. We then transition to a faint green suggesting the market is starting to move upwards.
Leveraging range detection techniques, this gives responsive market structure identification at a glance.
⬤ Voltix Bands
The Voltix Bands are a type of volatility-based band used to gauge market volatility and identify potential trading opportunities. These bands consist of two components: an upper band and a lower band. The distance between the bands fluctuates based on market volatility. When the market is highly volatile, the bands widen, and when volatility is low, the bands contract. They are unique as they uniquely apply distributions and weight volatility accordingly.
How to Use Voltix Bands:
When the price moves outside the Voltix Bands, it often signals a potential breakout. A close above the upper band may indicate the start of an upward trend, while a close below the lower band might signal the beginning of a downward trend.
Traders often use these breakout signals to enter trades in the direction of the breakout.
Detecting Overbought and Oversold Conditions:
When the price touches or moves beyond the upper Voltix Band, it can suggest that the market is overbought, indicating a potential reversal or pullback.
Conversely, when the price touches or drops below the lower Voltix Band, it may indicate an oversold condition, suggesting a possible price increase or trend reversal.
Volatility Contraction and Expansion:
Tightening Voltix Bands (when the bands contract) often precedes a significant price movement. This phenomenon is known as the "squeeze." When the bands tighten, it indicates a period of low volatility, and traders often anticipate an imminent breakout in either direction.
Widening Voltix Bands (when the bands expand) signal increasing volatility. Traders can use this as a cue to either ride the trend or be cautious of potential reversals.
Trend Following:
In trending markets, the price often stays close to the upper or lower band for extended periods. Traders can use this characteristic to follow the trend, staying long when the price is near the upper band and short when it is near the lower band. The bands also provide color coding and are green during an uptrend and purple during a downtrend.
⬤ Candle Coloring
1. Volume-Based Candle Coloring
Volume-based candle coloring mode changes the color of each candlestick according to the trading volume associated with that period. This method helps traders quickly identify periods of high or low market activity and understand the strength behind price movements.
How It Works:
High Volume: Candles are colored differently (red bearish, bright blue for bullish) when the trading volume is significantly higher than the average. This indicates strong buying or selling interest.
This mode is useful for identifying potential breakouts or fakeouts. For example, a price breakout accompanied by high volume suggests a strong move, while a breakout on low volume might indicate a lack of conviction, potentially leading to a false breakout.
2. Trend-Based Candle Coloring
Trend-based candle coloring mode changes the color of candlesticks depending on the current market trend, helping traders visually distinguish between bullish and bearish phases and neutral periods.
How It Works:
Bullish Trend: Candles are colored green when the price is in an uptrend.
Bearish Trend: Candles are colored red when the price is in a downtrend.
Usage:
This mode is beneficial for trend-following strategies, allowing traders to quickly assess the overall market direction and align their trades with the prevailing trend.
3. Momentum-Based Candle Coloring
In this momentum-based candle coloring mode, candlesticks are colored yellow for strong bullish momentum and pink for strong bearish momentum. This visual approach highlights the intensity of market movements, helping traders quickly identify prevailing momentum and potential trend shifts.
How It Works:
Strong Bullish Momentum (Yellow Candles):
Candles turn yellow when the market exhibits strong upward momentum. This might be triggered by a proprietary technique that detects when buying pressure is significantly driving prices higher, indicating that the market is experiencing robust bullish activity.
Yellow candles suggest that the price is likely to continue rising, and traders may look to capitalize on this momentum.
Strong Bearish Momentum (Pink Candles):
Candles turn pink when strong downward momentum is detected. The same technique identifies when selling pressure is dominant, pushing prices lower at a significant pace.
Pink candles indicate that bearish forces are strong, with the price likely to keep declining, making it a potential opportunity for short-selling or exiting long positions.
This color scheme is particularly beneficial for traders who prioritize momentum-based strategies. The clear distinction between strong bullish (yellow) and bearish (pink) momentum provides an instant visual cue, enabling quick decision-making.
Entering Trades:
Traders might choose to enter long positions when a series of yellow candles appears, indicating strong bullish momentum.
Alternatively, pink candles may signal an opportune moment to enter short positions, capturing the market's downward momentum.
Exiting Trades:
A shift from pink to yellow candles in a previously bearish trend could indicate a reversal, prompting traders to exit short positions.
The Market Waves toolkit is a powerful collection of unique and powerful tools. Please use DD when trading and always manage risk.
Paid script

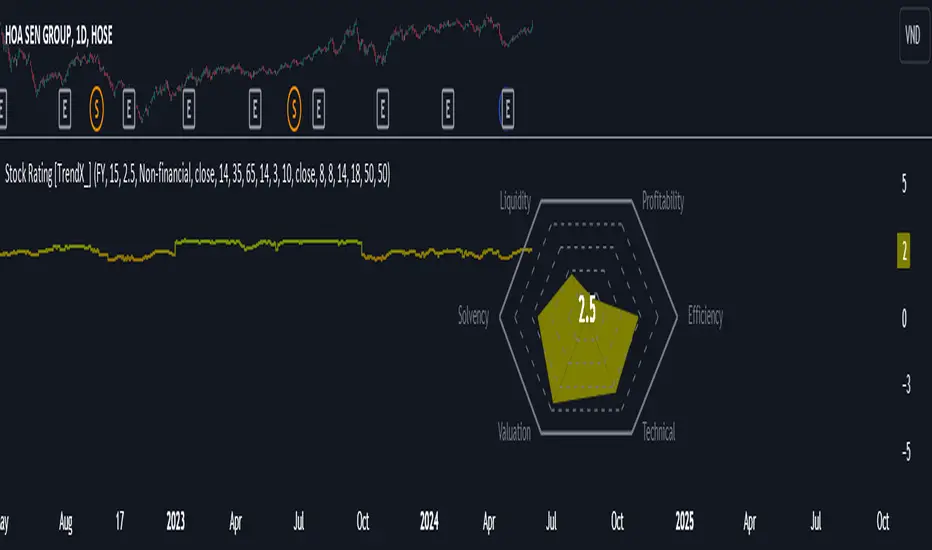
Stock Rating [TrendX_]# OVERVIEW
This Stock Rating indicator provides a thorough evaluation of a company (NON-FINANCIAL ONLY) ranging from 0 to 5. The rating is the average of six core financial metrics: efficiency, profitability, liquidity, solvency, valuation, and technical ratings. Each metric encompasses several financial measurements to ensure a robust and holistic evaluation of the stock.
## EFFICIENCY METRICS
1. Asset-to-Liability Ratio : Measures a company's ability to cover its liabilities with its assets.
2. Equity-to-Liability Ratio : Indicates the proportion of equity used to finance the company relative to liabilities.
3. Net Margin : Shows the percentage of revenue that translates into profit.
4. Operating Expense : Reflects the costs required for normal business operations.
5. Operating Expense Ratio : Compares operating expenses to total revenue.
6. Operating Profit Ratio : Measures operating profit as a percentage of revenue.
7. PE to Industry Relative PE/PB : Compares the company's PE ratio to the industry average.
## PROFITABILITY METRICS
1. ROA : Indicates how efficiently a company uses its assets to generate profit.
2. ROE : Measures profitability relative to shareholders' equity.
3. EBITDA : Reflects a company's operational profitability.
4. Free Cash Flow Margin : Shows the percentage of revenue that remains as free cash flow.
5. Revenue Growth : Measures the percentage increase in revenue over a period.
6. Gross Margin : Reflects the percentage of revenue exceeding the cost of goods sold.
7. Net Margin : Percentage of revenue that is net profit.
8. Operating Margin : Measures the percentage of revenue that is operating profit.
## LIQUIDITY METRICS
1. Current Ratio : Indicates the ability to cover short-term obligations with short-term assets.
2. Interest Coverage Ratio : Measures the ability to pay interest on outstanding debt.
3. Debt-to-EBITDA : Compares total debt to EBITDA.
4. Debt-to-Equity Ratio : Indicates the relative proportion of debt and equity financing.
## SOLVENCY METRICS
1. Altman Z-score : Predicts bankruptcy risk
2. Beneish M-score : Detects earnings manipulation.
3. Fulmer H-factor : Predicts business failure risk.
## VALUATION METRICS
1. Industry Relative PE/PB Comparison : Compares the company's PE and PB ratios to industry averages.
2. Momentum of PE, PB, and EV/EBITDA Multiples : Tracks the trends of PE, PB, and EV/EBITDA ratios over time.
## TECHNICAL METRICS
1. Relative Strength Index (RSI) : Measures the speed and change of price movements.
2. Supertrend : Trend-following indicator that identifies market trends.
3. Moving Average Golden-Cross : Occurs when a short-term MA crosses above mid-term and long-term MA which are determined by half-PI increment in smoothing period.
4. On-Balance Volume Golden-Cross : Measures cumulative buying and selling pressure.
Ocs Ai TraderThis script perform predictive analytics from a virtual trader perspective!
It acts as an AI Trade Assistant that helps you decide the optimal times to buy or sell securities, providing you with precise target prices and stop-loss level to optimise your gains and manage risk effectively.
System Components
The trading system is built on 4 fundamental layers :
Time series Processing layer
Signal Processing layer
Machine Learning
Virtual Trade Emulator
Time series Processing layer
This is first component responsible for handling and processing real-time and historical time series data.
In this layer Signals are extracted from
averages such as : volume price mean, adaptive moving average
Estimates such as : relative strength stochastics estimates on supertrend
Signal Processing layer
This second layer processes signals from previous layer using sensitivity filter comprising of an Probability Distribution Confidence Filter
The main purpose here is to predict the trend of the underlying, by converging price, volume signals and deltas over a dominant cycle as dimensions and generate signals of action.
Key terms
Dominant cycle is a time cycle that has a greater influence on the overall behaviour of a system than other cycles.
The system uses Ehlers method to calculate Dominant Cycle/ Period.
Dominant cycle is used to determine the influencing period for the underlying.
Once the dominant cycle/ period is identified, it is treated as a dynamic length for considering further calculations
Predictive Adaptive Filter to generate Signals and define Targets and Stops
An adaptive filter is a system with a linear filter that has a transfer function controlled by variable parameters and a means to adjust those parameters according to an optimisation algorithm. Because of the complexity of the optimisation algorithms, almost all adaptive filters are digital filters. Thus Helping us classify our intent either long side or short side
The indicator use Adaptive Least mean square algorithm, for convergence of the filtered signals into a category of intents, (either buy or sell)
Machine Learning
The third layer of the System performs classifications using KNN K-Nearest Neighbour is one of the simplest Machine Learning algorithms based on Supervised Learning technique.
K-NN algorithm assumes the similarity between the new case/data and available cases and put the new case into the category that is most similar to the available categories.
K-NN algorithm stores all the available data and classifies a new data point based on the similarity. This means when new data appears then it can be easily classified into a well suite category by using K- NN algorithm. K-NN algorithm can be used for Regression as well as for Classification but mostly it is used for the Classification problems.
Virtual Trade Emulator
In this last and fourth layer a trade assistant is coded using trade emulation techniques and the Lines and Labels for Buy / Sell Signals, Targets and Stop are forecasted!
How to use
The system generates Buy and Sell alerts and plots it on charts
Buy signal
Buy signal constitutes of three targets {namely T1, T2, T3} and one stop level
Sell signal
Sell signal constitutes of three targets {namely T1, T2, T3} and one stop level
What Securities will it work upon ?
Volume Informations must be present for the applied security
The indicator works on every liquid security : stocks, future, forex, crypto, options, commodities
What TimeFrames To Use ?
You can use any Timeframe, The indicator is Adaptive in Nature,
I personally use timeframes such as : 1m, 5m 10m, 15m, ..... 1D, 1W
This Script Uses Tradingview Premium features for working on lower timeframes
In case if you are not a Tradingview premium subscriber you should tell the script that after applying on chart, this can be done by going to settings and unchecking "Is your Tradingview Subscription Premium or Above " Option
How To Get Access ?
You will need to privately message me for access mentioning you want access to "Ocs Ai Trader" Use comment box only for constructive comments. Thanks !

Candlestick Patterns detection and backtester [TrendX_]INTRODUCTION:
The Candlestick Patterns detection and backtester is designed to empower traders by identifying and analyzing candlestick patterns. Leveraging the robust Pine Script's add-in “All Candlestick Patterns”, this indicator meticulously scans the market for candlestick formations, offering insights into potential market movements. With its backtesting capabilities, we evaluate historical data to present traders with performance metrics such as win rates, net profit, and profit factors for each pattern. This allows traders to make informed decisions based on empirical evidence. The customizable settings, including trend filters and exit conditions, provide a tailored experience, adapting to various trading styles and strategies.
CREDIT:
This indicator is powered by the Pinescript add-in, *All Candlestick Patterns*, which provides a comprehensive library of candlestick formations.
TABLE USAGE:
The indicator features a detailed usage table that presents backtested results of all candlestick patterns. This includes:
Win Rates: The percentage of trades that resulted in a profit.
Net Profit: The total profit after subtracting losses from gains.
Profit Factor: A measure of the indicator’s profitability (gross profit / gross loss).
Total Trades: The total number of trades taken for every candlestick pattern's appearance.
CHART CANDLESTICK USAGE:
The indicator integrates candlestick pattern detections directly into the chart, displaying:
Pattern Detections: Each detected pattern is marked on the chart.
Win Rates: The win rate of each pattern is shown in brackets next to the detection.
CHART SETTINGS:
Users can customize the indicator with a variety of trend filters and settings:
Trend Filters: Apply filters based on SMA50, SMA200, Supertrend, and RSI threshold to refine pattern detections.
Exit Condition: Set an exit condition based on the crossing of a simple moving average of customizable length.
Visibility: Choose to show or hide the candlestick patterns’ detections on the chart.

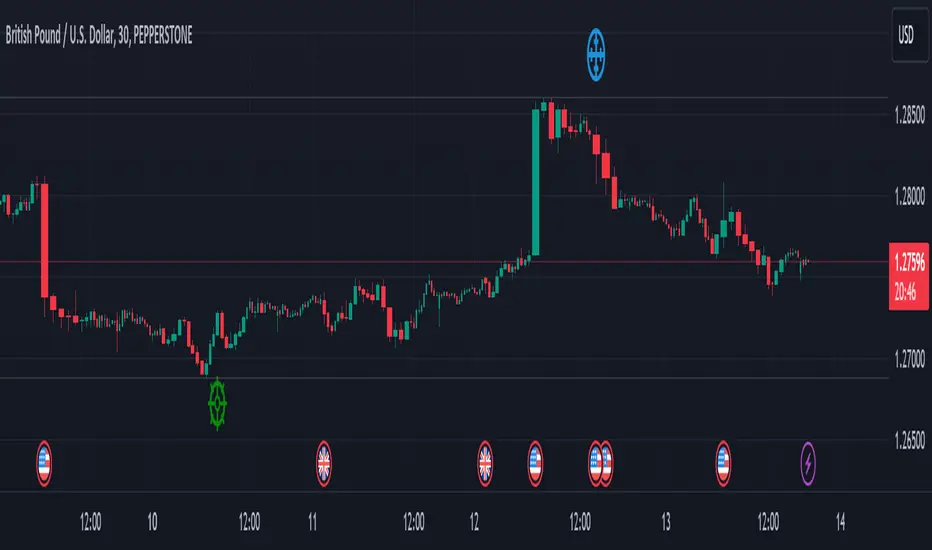
Swing Sniper by Republic of TradersSwing Sniper: A Comprehensive Market Reversal Indicator
Description:
Swing Sniper, developed by Republic of Traders, is a sophisticated trading indicator designed for traders who require precise market reversal signals. It performs optimally across all trading instruments and timeframes, offering both reliability and precision.
How It Works:
Swing Sniper employs a complex signal generation mechanism that activates only when six distinct conditions align within a specific timeframe. This includes:
A modified Commodity Channel Index (CCI) that helps identify short-term price fluctuations.
A Relative Momentum Index (RMI) utilized for recognizing long-term market trends.
A Supertrend indicator serves as a dynamic trend filter.
Several custom parameters that enhance signal reliability.
These components work synergistically to ensure that each trading signal is robust and well-founded. The indicator specializes in capturing significant market reversals by requiring a confirmation of trend reversal through a break and close above or below a previous supply/demand zone.
Usage Instructions:
Upon a valid signal, Swing Sniper advises traders that a potential market reversal has occurred and an entry may be considered in the direction of the new trend. Traders are recommended to set alerts for "once per candle close," allowing them to monitor multiple charts and timeframes simultaneously. Proper risk management is encouraged by placing stop losses just below or above the previous swing low or high and the signal candle's low or high. Take profits should similarly be set to capitalize on potential swings.
Why Choose Swing Sniper:
Swing Sniper is designed not only as a tool for generating entries but as a strategic component of your trading methodology. It brings a clear, analytical approach to navigating the markets, supported by detailed and logical indicator collaboration. This ensures users understand the underlying mechanics and can apply the tool effectively within their trading strategy.
Commitment to Originality and Utility:
Swing Sniper is a unique creation, adhering to TradingView’s standards by offering actionable insights that are distinct from other indicators available on the platform. It is meticulously crafted, featuring an original combination of technical analysis tools tailored to enhance market reversal detection.
Disclaimer:
Past performance is not indicative of future results. Always exercise due diligence and consider market conditions when trading.
Visualization Aid:
The accompanying chart visualization helps users identify signal examples, marked with a red triangle for market reversals short and a green triangle for market reversals long.
Embrace the strategic depth and precision of Swing Sniper and enhance your trading confidence and accuracy in financial markets.
TrendLine Toolkit w/ Breaks (Real-Time)The TrendLine Toolkit script introduces an innovating capability by extending the conventional use of trendlines beyond price action to include oscillators and other technical indicators. This tool allows traders to automatically detect and display trendlines on any TradingView built-in oscillator or community-built script, offering a versatile approach to trend analysis. With breakout detection and real-time alerts, this script enhances the way traders interpret trends in various indicators.
🔲 Methodology
Trendlines are a fundamental tool in technical analysis used to identify and visualize the direction and strength of a price trend. They are drawn by connecting two or more significant points on a price chart, typically the highs or lows of consecutive price movements (pivots).
Drawing Trendlines:
Uptrend Line - Connects a series of higher lows. It signals an upward price trend.
Downtrend Line - Connects a series of lower highs. It indicates a downward price trend.
Support and Resistance:
Support Line - A trendline drawn under rising prices, indicating a level where buying interest is historically strong.
Resistance Line - A trendline drawn above falling prices, showing a level where selling interest historically prevails.
Identification of Trends:
Uptrend - Prices making higher highs and higher lows.
Downtrend - Prices making lower highs and lower lows.
Sideways (or Range-bound) - Prices moving within a horizontal range.
A trendline helps confirm the existence and direction of a trend, providing guidance in aligning with the prevailing market sentiment. Additionally, they are usually paired with breakout analysis, a breakout occurs when the price breaches a trendline. This signals a potential change in trend direction or an acceleration of the existing trend.
The script adapts this methodology to oscillators and other indicators. Instead of relying on price pivots, which can only be detected in retrospect, the script utilizes a trailing stop on the oscillator to identify potential swings in real-time, you may find more info about it here (SuperTrend toolkit) . We detect swings or pivots simply by testing for crosses between the indicator and its trailing stop.
type oscillator
float o = Oscillator Value
float s = Trailing Stop Value
oscillator osc = oscillator.new()
bool l = ta.crossunder(osc.o, osc.s) => Utilized as a formed high
bool h = ta.crossover (osc.o, osc.s) => Utilized as a formed low
This approach enables the algorithm to detect trendlines between consecutive pivot highs or lows on the oscillator itself, providing a dynamic and immediate representation of trend dynamics.
🔲 Breakout Detection
The script goes beyond trendline creation by incorporating breakout detection directly within the oscillator. After identifying a trendline, the algorithm continuously monitors the oscillator for potential breakouts, signaling shifts in market sentiment.
🔲 Setup Guide
A simple example on one of my public scripts, Z-Score Heikin-Ashi Transformed
🔲 Settings
Source - Choose an oscillator source of which to base the Toolkit on.
Zeroing - The Mid-Line value of the oscillator, for example RSI & MFI use 50.
Sensitivity - Calibrates the Sensitivity of which TrendLines are detected, higher values result in more detections.
🔲 Alerts
Bearish TrendLine
Bullish TrendLine
Bearish Breakout
Bullish Breakout
As well as the option to trigger 'any alert' call.
By integrating trendline analysis into oscillators, this Toolkit enhances the capabilities of technical analysis, bringing a dynamic and comprehensive approach to identifying trends, support/resistance levels, and breakout signals across various indicators.

Divergence Toolkit (Real-Time)The Divergence Toolkit is designed to automatically detect divergences between the price of an underlying asset and any other @TradingView built-in or community-built indicator or script. This algorithm provides a comprehensive solution for identifying both regular and hidden divergences, empowering traders with valuable insights into potential trend reversals.
🔲 Methodology
Divergences occur when there is a disagreement between the price action of an asset and the corresponding indicator. Let's review the conditions for regular and hidden divergences.
Regular divergences indicate a potential reversal in the current trend.
Regular Bullish Divergence
Price Action - Forms a lower low.
Indicator - Forms a higher low.
Interpretation - Suggests that while the price is making new lows, the indicator is showing increasing strength, signaling a potential upward reversal.
Regular Bearish Divergence
Price Action - Forms a higher high.
Indicator - Forms a lower high.
Interpretation - Indicates that despite the price making new highs, the indicator is weakening, hinting at a potential downward reversal.
Hidden divergences indicate a potential continuation of the existing trend.
Hidden Bullish Divergence
Price Action - Forms a higher low.
Indicator - Forms a lower low.
Interpretation - Suggests that even though the price is retracing, the indicator shows increasing strength, indicating a potential continuation of the upward trend.
Hidden Bearish Divergence
Price Action - Forms a lower high.
Indicator - Forms a higher high.
Interpretation - Indicates that despite a retracement in price, the indicator is still strong, signaling a potential continuation of the downward trend.
In both regular and hidden divergences, the key is to observe the relationship between the price action and the indicator. Divergences can provide valuable insights into potential trend reversals or continuations.
The methodology employed in this script involves the detection of divergences through conditional price levels rather than relying on detected pivots. Traditionally, divergences are created by identifying pivots in both the underlying asset and the oscillator. However, this script employs a trailing stop on the oscillator to detect potential swings, providing a real-time approach to identifying divergences, you may find more info about it here (SuperTrend Toolkit) . We detect swings or pivots simply by testing for crosses between the indicator and its trailing stop.
type oscillator
float o = Oscillator Value
float s = Trailing Stop Value
oscillator osc = oscillator.new()
bool l = ta.crossunder(osc.o, osc.s) => Utilized as a formed high
bool h = ta.crossover (osc.o, osc.s) => Utilized as a formed low
// Note: these conditions alone could cause repainting when they are met but canceled at a later time before the bar closes. Hence, we wait for a confirmed bar.
// The script also includes the option to immediately alert when the conditions are met, if you choose so.
By testing for conditional price levels, the script achieves similar outcomes without the delays associated with pivot-based methods.
type bar
float o = open
float h = high
float l = low
float c = close
bar b = bar.new()
bool hi = b.h < b.h => A higher price level has been created
bool lo = b.l > b.l => A lower price level has been created
// Note: These conditions do not check for certain price swings hence they may seldom result in inaccurate detection.
🔲 Setup Guide
A simple example on one of my public scripts, Standardized MACD
🔲 Utility
We may auto-detect divergences to spot trend reversals & continuations.
🔲 Settings
Source - Choose an oscillator source of which to base the Toolkit on.
Zeroing - The Mid-Line value of the oscillator, for example RSI & MFI use 50.
Sensitivity - Calibrates the sensitivity of which Divergencies are detected, higher values result in more detections but less accuracy.
Lifetime - Maximum timespan to detect a Divergence.
Repaint - Switched on, the script will trigger Divergencies as they happen in Real-Time, could cause repainting when the conditions are met but canceled at a later time before bar closes.
🔲 Alerts
Bearish Divergence
Bullish Divergence
Bearish Hidden Divergence
Bullish Hidden Divergence
As well as the option to trigger 'any alert' call.
The Divergence Toolkit provides traders with a dynamic tool for spotting potential trend reversals and continuations. Its innovative approach to real-time divergence detection enhances the timeliness of identifying market opportunities.

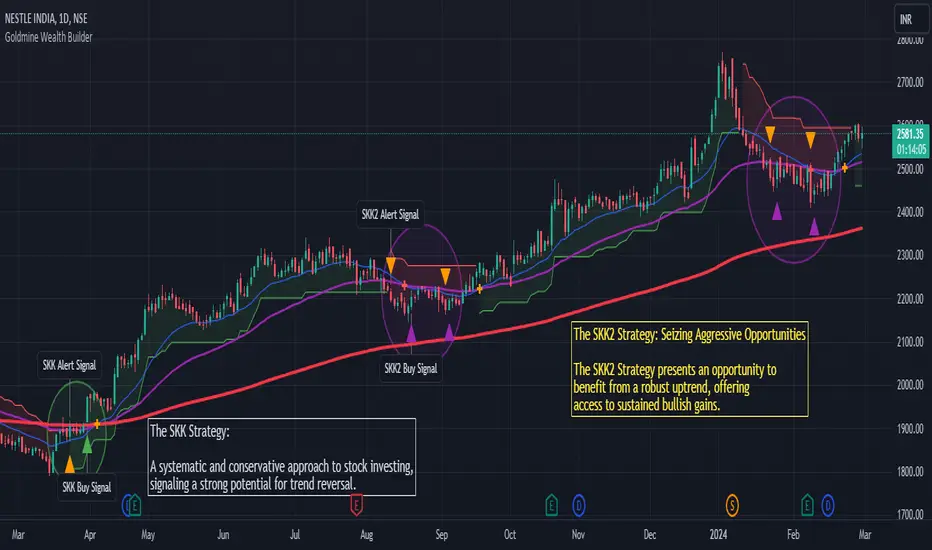
Goldmine Wealth BuilderGoldmine Wealth Builder
Version 1.0
Discover the Goldmine Wealth Builder, your ultimate partner in long-term investing. With a comprehensive array of strategies meticulously tailored to suit the varied needs and preferences of investors, we empower you to achieve your financial goals with confidence and ease. Whether you're seeking stability or growth, our platform is designed to provide personalized solutions that align perfectly with your aspirations. Welcome to a world of opportunity and prosperity with Goldmine Wealth Builder.
Long-Term Investment Strategies: DKK, SKK and SKK2
In the dynamic realm of long-term investing, the DKK, SKK, and SKK2 strategies stand as valuable pillars. These strategies, meticulously designed to assist investors in building robust portfolios, combine the power of Super Trend, RSI (Relative Strength Index), Exponential Moving Averages (EMAs), and their crossovers. By providing clear alerts and buy signals on a daily time frame, they equip users with the tools needed to make well-informed investment decisions and navigate the complexities of the financial markets. These strategies offer a versatile and structured approach to both conservative and aggressive investment, catering to the diverse preferences and objectives of investors.
Each part of this strategy provides a unique perspective and approach to the accumulation of assets, making it a versatile and comprehensive method for investors seeking to optimize their portfolio performance. By diligently applying this multi-faceted approach, investors can make informed decisions and effectively capitalize on potential market opportunities.
DKK Strategy for ETFs:
The DKK system is a strategy designed for accumulating only ETFs as long-term investments in your portfolio. It simplifies the process of identifying trend reversals and opportune moments to invest in listed ETFs, particularly during bull markets. Here's a detailed explanation of the DKK system:
Objective: The primary aim of the DKK system is to build a long-term investment portfolio by focusing on only ETFs. It facilitates the identification of ETFs that are in the process of reversing their trends, allowing investors to benefit from upward price movements in these financial instruments.
ETFs Selection Criteria: The DKK system employs specific criteria for selecting ETFs:
• 200EMA (Exponential Moving Average): The system monitors whether the prices of ETFs are consistently below the 200-day Exponential Moving Average. This is considered an indicator of weakness, especially on a daily time frame.
• RSI (Relative Strength Index): The system looks for an RSI value of less than 40. An RSI below 40 is often seen as an indication of a weak or oversold condition in a financial instrument.
Alert Signal: Once the DKK system identifies ETFs meeting these criteria, it provides an alert signal:
• Red Upside Triangle Sign: This signal is automatically generated on the daily chart of only ETFs. It serves as a clear indicator to investors that it's an opportune time to accumulate these financial instruments for long-term investment.
It's important to note that the DKK system is specifically designed for ETFs only, so it should be applied to these types of investments. Additionally, it's recommended to track index ETFs, in line with the DKK system's approach. This strategy simplifies the process of identifying investment opportunities within this asset class, particularly during periods of market weakness.
SKK Strategy for Conservative Stock Investment:
The SKK system is a stock investment strategy tailored for conservative investors seeking long-term portfolio growth with a focus on stability and prudent decision-making. This strategy is meticulously designed to identify pivotal market trends and stock price movements, allowing investors to make informed choices and capitalize on upward market trends while minimizing risk. Here's a comprehensive overview of the SKK system, emphasizing its suitability for conservative investors:
Objective: The primary objective of the SKK system is to accumulate stocks as long-term investments in your portfolio while prioritizing capital preservation. It offers a disciplined approach to pinpointing potential entry points for stocks, particularly during market corrections and trend reversals, thereby enabling you to actively participate in bullish market phases while adopting a conservative risk management stance.
Stock Selection Criteria: The SKK system employs a stringent set of criteria to select stocks for investment:
• Correction Mode: It identifies stocks that have undergone a correction, signifying a decline in stock prices from their recent highs. This conservative approach emphasizes the importance of seeking stocks with a history of stability.
• 200EMA (Exponential Moving Average): The system diligently analyses daily stock price movements, specifically looking for stocks that have fallen to or below the 200-day Exponential Moving Average. This indicator suggests potential overselling and aligns with a conservative strategy of buying low.
Trend Reversal Confirmation: The SKK system doesn't merely pinpoint stocks in correction mode; it takes an extra step to confirm a trend reversal. It employs the following indicators:
• Short-term Downtrends Reversal: This aspect focuses on identifying the reversal of short-term downtrends in stock prices, observed through the transition of the super trend indicator from the red zone to the green zone. This cautious approach ensures that the trend is genuinely shifting.
• Super Trend Zones: These zones are crucial for assessing whether a stock is in a bullish or bearish trend. The system consistently monitors these zones to confirm a potential trend reversal.
Alert & Buy Signals: When the SKK system identifies stocks that have reached a potential bottom and are on the verge of a trend reversal, it issues vital alert signals, aiding conservative investors in prudent decision-making:
• Orange Upside Triangle Sign: This signal serves as a cautious heads-up, indicating that a stock may be poised for a trend reversal. It advises investors to prepare funds for potential investment without taking undue risks.
• Green Upside Triangle Sign: This is the confirmation of a trend reversal, signifying a robust buy signal. Conservative investors can confidently enter the market at this point, accumulating stocks for a long-term investment, secure in the knowledge that the trend is in their favour.
• Additionally, if the Supertrend transitions from green to red zone during the alert signal is active and before the buy signal, the SKK setup will be considered invalid. This adjustment ensures precise trend reversal identification during corrections. The conservative investors to confidently enter the market, accumulating discounted stocks primarily at the bottom while avoiding unnecessary signals.
In summary, the SKK system is a systematic and conservative approach to stock investing. It excels in identifying stocks experiencing corrections and ensures that investors act when there's a strong indication of a trend reversal, all while prioritizing capital preservation and risk management. This strategy empowers conservative investors to navigate the intricacies of the stock market with confidence, providing a calculated and stable path toward long-term portfolio growth.
Note: The SKK strategy, known for its conservative approach to stock investment, also provides an option to extend its methodology to REIT (Real Estate Investment Trusts) and INVIT (Infrastructure Investment Trusts) Funds for those investors who wish to accumulate assets more aggressively. You can harness the SKK strategy's careful criteria and signal indicators to accumulate aggressive investments in REIT and INVIT Funds.
This flexible approach acknowledges that even within a conservative strategy, there may be opportunities for more assertive investments in assets like REIT and INVIT Funds. By making use of this option, you can strike a balance between a conservative stance in your stock portfolio while exploring an aggressive approach in other asset classes. It offers the versatility to cater to a variety of investment preferences, ensuring that you can adapt your strategy to suit your financial goals and risk tolerance.
SKK 2 Strategy for Aggressive Stock Investment:
The SKK 2 strategy is designed for those who are determined not to miss significant opportunities within a continuous uptrend and seek a way to enter a trend that doesn't present entry signals through the SKK strategy. While it offers a more aggressive entry approach, it is ideal for individuals willing to take calculated risks to potentially reap substantial long-term rewards. This strategy is particularly suitable for accumulating stocks for aggressive long-term investment. Here's a detailed description of the SKK 2 strategy:
Objective: The primary aim of the SKK 2 strategy is to provide an avenue for investors to identify short-term trend reversals and seize the opportunity to enter stocks during an uptrend, thereby capitalizing on a sustained bull run. It acknowledges that there may not always be clear entry signals through the SKK strategy and offers a more aggressive alternative.
Stock Selection Criteria: The SKK 2 strategy utilizes a specific set of criteria for stock selection:
1. 50EMA (Exponential Moving Average): It targets stocks that are trading below the 50-day Exponential Moving Average. This signals a short-term reversal from the top and indicates that the stock is in a downtrend.
2. RSI (Relative Strength Index): The strategy considers stocks with an RSI of less than 40, which is an indicator of weakness in the stock.
Alert Signals: The SKK 2 strategy provides distinct alert signals that facilitate entry during an aggressive reversal:
• Orange Downside Triangle Sign: This signal is triggered when the stock is below the 50EMA and has an RSI of less than 40. It serves as a clear warning of a short-term reversal from the top and a downtrend, displayed on the daily chart.
• Purple Upside Triangle Sign: This sign is generated when a reversal occurs through a bullish candle, and the RSI is greater than 40. It signifies the stock has bottomed out from a short-term downtrend and is now reversing. This purple upside triangle serves as an entry signal on the chart, presenting an attractive opportunity to accumulate stocks during a strong bullish phase, offering a chance to seize a potentially favourable long-term investment.
In essence, the SKK 2 strategy caters to aggressive investors who are willing to take calculated risks to enter stocks during a continuous uptrend. It focuses on identifying short-term reversals and provides well-defined signals for entry. While this strategy is more aggressive in nature, it has the potential to yield substantial rewards for those who are comfortable with a higher level of risk and are looking for opportunities to build a strong long-term portfolio.
Introduction to Strategy Signal Information Chart
This chart provides essential information on strategy signals for DKK, SKK, and SKK2. By quickly identifying "Buy" and "Alert" signals for each strategy, investors can efficiently gauge market conditions and make informed decisions to optimize their investment portfolios.
RSI Feature:
The Relative Strength Index (RSI) value is displayed on the indicator status line, providing quick reference and analysis for more informed decision-making. Explore this update to enhance your strategy with RSI trends. Alternatively, leverage RSI as a reference, a feature extensively utilized in both DKK and SKK2 strategies.
In Conclusion
These investment strategies, whether conservative like DKK and SKK or more aggressive like SKK2, offer a range of options for investors to navigate the complex world of long-term investments. The combination of Super Trend, RSI, and EMAs with their crossovers provides clear signals on a daily time frame, empowering users to make well-informed decisions and potentially capitalize on market opportunities. Whether you're looking for stability or are ready to embrace more risk, these strategies have something to offer for building and growing your investment portfolio.
In essence, with the Goldmine Wealth Builder, investors alike can access a comprehensive toolkit designed to unlock their financial potential and achieve their investment goals.
We appreciate your understanding and remain committed to providing a clear and focused investment tool. For any inquiries or feedback, feel free to reach out.
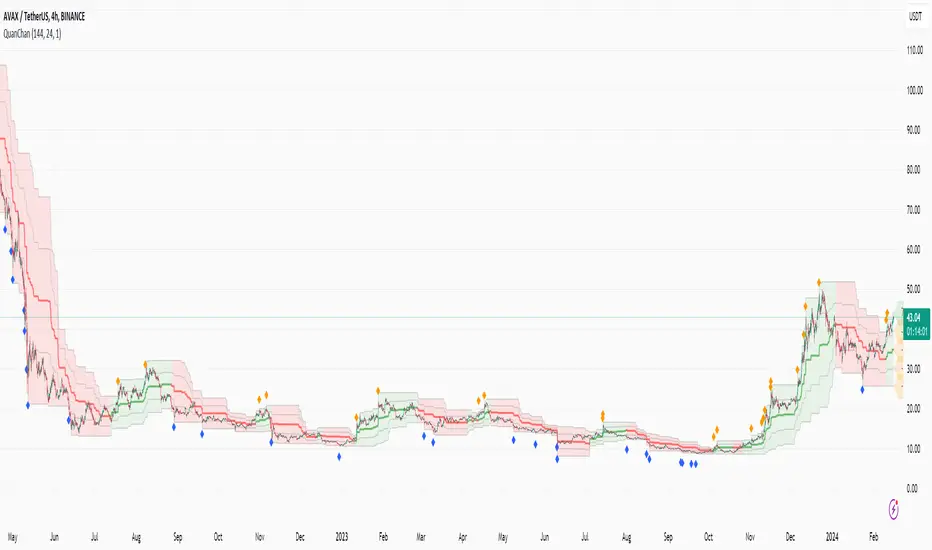
Quan Channel - Quan DaoI tried several channels, like the supertrend, ATR, Donchian or Bollingers, but they do not seem to fit my needs.
So I created a new channel to PREDICT the next impulse move of a price.
The current value of the top or bottom of the channel is based on 2 previous candles (not the candle itself), and it takes into account:
- The Direction of the previous candles (red or green) and
- The Width of their bodies
In my channel, the top or bottom lines will cover the price movement most of the time. But in some cases, when the price is on a big move, it will go out of the channel. And this is the time we need to consider a buy/sell (or take some profit) as well (not necessarily 100% of the time, though).
Personally, I like to use another oscillator in combination with this channel to predict whether it will reverse after the breakouts or continue to make another peak. If you are a DCA or long-term investor, I guess it would be safe to buy at the blue signals (out of bottom) and take some profits at the orange signals (out of top).
I also added an alert when the price breaks out of the channel for easier tracking.
Triple Trend OscillatorI developed the Triple Trend Oscillator (TTO) to combine the strengths of Supertrend, Sequential Filtered Trend, and Trend Magic indicators, offering a comprehensive view of market trends. This tool is designed to filter out market noise, highlight clear trends, and incorporate volume analysis to pinpoint momentum behind market moves.

Gap Removal IndicatorThis gap indicator shows the price of your chosen instrument as if no gaps had occurred overnight. It can be especially useful on highly-volatile exchange-listed instruments that track other 24/7 assets, because the normal candlestick chart of these instruments will create a large amount of noise that may decrease the accuracy of your indicators or make the trend harder to see.
Gaps are determined with the following code:
daychange = ta.change(dayofmonth)
gapup = daychange and open > math.max(open,close)
gapdown = daychange and open < math.min(open,close)
Whereas the gap value is determined by taking the overnight difference in prices:
downgap_change = math.min(open,close) - open
upgap_change = open - math.max(open,close)
The gap changes are cumulatively added and subtracted from the initial closing price to create the gap-adjusted price. The price will depend on how many bars your subscription allows, so pay more attention to the relative differences and/or trend than the cumulative gap-adjusted price itself.
The gap indicator comes pre-built with normal candlestick and Heikin-Ashi candle types, and four indicators (two EMAs, Bollinger bands, and a supertrend). All elements are configurable.

AUTO STOP LEVELThis is a simple yet highly efficient code that calculates stop levels, taking into account the market trend and its volatility.
This script calculates and displays (as a white point in the chart) a stop-loss by considering both volatility and the nearest support/resistance point.
The stop level is determined as the average of three specific values: firstly, two distinct volatility indicators - ATR and Bollinger Bands, and finally, the nearest support/resistance provided by the Supertrend indicator.
Moreover, it analyzes the trend to determine whether the stop should be set for long or short positions, providing insights into the most probable path of future prices. For instance, if the calculated stop level is below the current market prices, it suggests taking long positions, and vice versa.
Customization options include fine-tuning the standard parameters for the three indicators used in averaging and selecting multiple time frames.
ATR TrendTL;DR - An average true range (ATR) based trend
ATR trend uses a (customizable) ATR calculation and highest high & lowest low prices to calculate the actual trend. Basically it determines the trend direction by using highest high & lowest low and calculates (depending on the determined direction) the ATR trend by using a ATR based calculation and comparison method.
The indicator will draw one trendline by default. It is also possible to draw a second trendline which shows a 'negative trend'. This trendline is calculated the same way the primary trendline is calculated but uses a negative (-1 by default) value for the ATR calculation. This trendline can be used to detect early trend changes and/or micro trends.
How to use:
Due to its ATR nature the ATR trend will show trend changes by changing the trendline direction. This means that when the price crosses the trendline it does not automatically mean a trend change. However using the 'negative trend' option ATR trend can show early trend changes and therefore good entry points.
Some notes:
- A (confirmed) trend change is shown by a changing color and/or moving trendline (up/down)
- Unlike other indicators the 'time period' value is not the primary adjustment setting. This value is only used to calculate highest high & lowest low values and has medium impact on trend calculation. The primary adjustment setting is 'ATR weight'
- Every settings has a tooltip with further explanation
- I added additional color coding which uses a different color when the trend attempts to change but the trend change isn't confirmed (yet)
- Default values work fine (at least in my back testing) but the recommendation is to adjust the settings (especially ATR weight) to your trading style
- You can further finetune this indicator by using custom moving average types for the ATR calculation (like linear regression or Hull moving average)
- Both trendlines can be used to determine future support and resistance zones
- ATR trend can be used as a stop loss finder
- Alerts are using buy/sell signals
- You can use fancy color filling ;)
Happy trading!
Daniel

Alpha Schaff [AlgoAlpha]Description:
The Alpha Schaff indicator is a proprietary technical analysis tool that incorporates a modified version of the Schaff Trend Cycle (STC) to generate trading signals. The indicator is designed to identify potential overbought and oversold conditions in the market. It utilizes a combination of exponential moving averages (EMAs) and price volatility to generate trading signals. The plot of the indicator is derived from the opening price adjusted by a factor that depends on the Alpha Schaff value. A color scheme is used to indicate whether the current value is higher or lower than the previous value.
What is Alpha Schaff?:
Alpha Schaff is a technical indicator used in trading to identify potential trend reversals and confirm the strength of a current trend. It combines multiple moving averages and oscillators to generate buy and sell signals. Traders use Alpha Schaff to make informed decisions about entering or exiting positions based on its indications of trend momentum and market conditions.
Calculation:
The Alpha Schaff indicator calculates the difference between fast and slow EMAs based on the specified input lengths. It then measures the highest and lowest values of the difference over a defined sensitivity period. The indicator normalizes these values to a percentage scale to provide insights into the current market conditions.
How to use it?:
Monitor the color of the indicator line. A change in color indicates a potential trend reversal. For example, a switch from white to a purple color suggests a possible bullish trend, while a switch from a purple color to white indicates a potential bearish trend. Points of reversal can also be indicated by distinctive arrows pointing upwards or downward as well as visualized in bullish/bearish colors. The Distance between the indicator plot and the source can be interpreted as a measurement of price volatility. The script includes alert conditions that trigger when specific criteria are met. These alerts can notify users of potential buying or selling opportunities based on the indicator's signals.
Utility:
The Alpha Schaff is a trend-following indicator suitable for traders operating in trending markets. It offers clear and precise signals that provide valuable insights into bullish or bearish price movements. Additionally, this indicator stands out by incorporating distinctive arrows, indicating potential retracement points and allowing traders to anticipate mean reversion.
Originality:
The Alpha Schaff indicator, developed by AlgoAlpha introduces a proprietary modification to the Schaff Trend Cycle (STC) by incorporating multiple moving averages and oscillators. While the concept of the Schaff Trend Cycle exists, the specific implementation and combination of elements in the Alpha vSchaff indicator are unique to this tool. The inclusion of color schemes, arrow indicators, and volatility measurements sets it apart from other technical analysis indicators. Traders can benefit from its originality by utilizing its distinctive features to make more informed trading decisions in trending markets.
