Algo + Trendlines :: Long PeriodThis indicator helps me to avoid overlooking Trendlines / Algolines. So far it doesn't search explicitly for Algolines (I don't consider volume at all), but it's definitely now already not horribly bad.
These are meant to be used on logarithmic charts btw! The lines would be displayed wrong on linear charts.
The biggest challenge is that there are some technical restrictions in TradingView, f. e. a script stops executing if a for-loop would take longer than 0.5 sec.
So in order to circumvent this and still be able to consider as many candles from the past as possible, I've created multiple versions for different purposes that I use like this:
Algo + Trendlines :: Medium Period : This script looks for "temporary highs / lows" (meaning the bar before and after has lower highs / lows) on the daily chart, connects them and shows the 5 ones that are the closest to the current price (=most relevant). This one is good to find trendlines more thoroughly, but only up to 4 years ago.
Algo + Trendlines :: Long Period : This version looks instead at the weekly charts for "temporary highs / lows" and finds out which days caused these highs / lows and connects them, Taking data from the weekly chart means fewer data points to check whether a trendline is broken, which allows to detect trendlines from up to 12 years ago! Therefore it misses some trendlines. Personally I prefer this one with "Only Confirmed" set to true to really show only the most relevant lines. This means at least 3 candle highs / lows touched the line. These are more likely stronger resistance / support lines compared to those that have been touched only twice.
Very important: sometimes you might see dotted lines that suddenly stop after a few months (after 100 bars to be precise). This indicates you need to zoom further out for TradingView to be able to load the full line. Unfortunately TradingView doesn't render lines if the starting point was too long ago, so this is my workaround. This is also the script's biggest advantage: showing you lines that you might have missed otherwise since the starting bars were outside of the screen, and required you to scroll f. e back to 2015..
One more thing to know:
Weak colored line = only 2 "collision" points with candle highs/lows (= not confirmed)
Usual colored line = 3+ "collision" points (= confirmed)
Make sure to move this indicator above the ticker in the Object Tree, so that it is drawn on top of the ticker's candles!
More infos: www.reddit.com
ابحث في النصوص البرمجية عن "support"

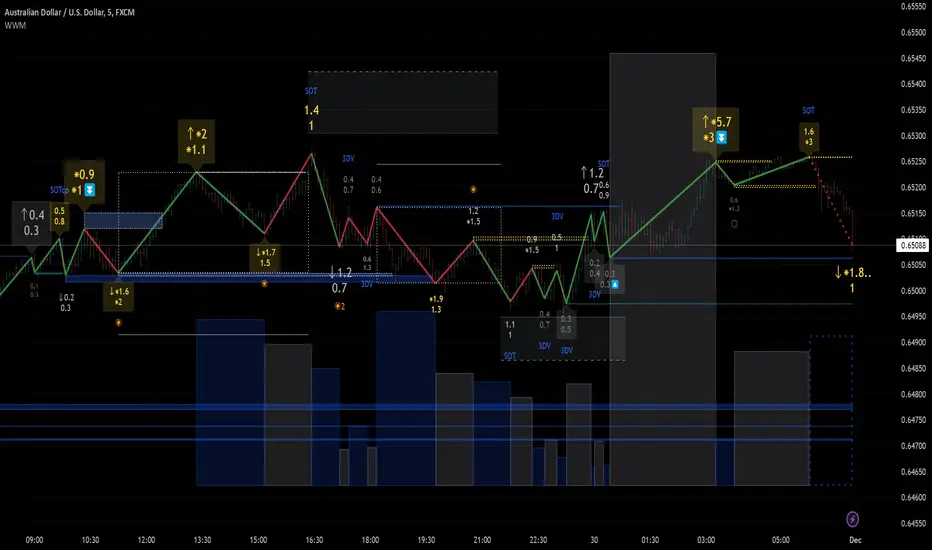
Institution Accumulation/DistributionLeveraging the Williams%R oscillator, the script has been optimized to pick out key turning point in the market specifically at Resistance (Overbought) or Support (Oversold)
The algo has been programmed to print both buy and sell alerts at extremes/when conditions flip eg a long position will be closed simultaneously opening a short position above resistance.
Best used as a scalping tool targeting 30m and below works well with currency pairs

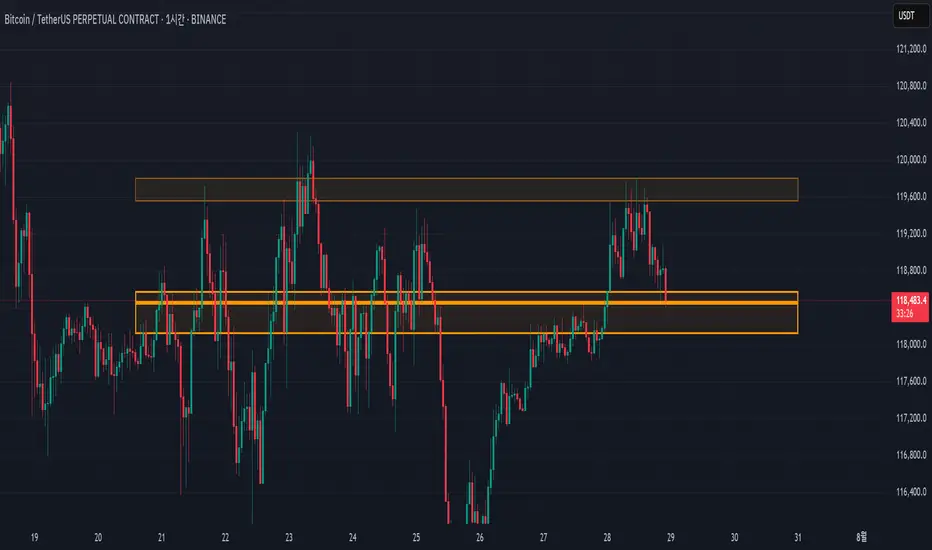
Support/Resistance MTF Merge ZonesIndicator Introduction
Support/Resistance MTF Merge Zones is an advanced technical analysis tool that automatically identifies and merges key support/resistance zones by analyzing highs and lows from multiple timeframes (15M, 1H, 4H, Daily).
Key Features
Multi-Timeframe Analysis: Integrates data from 15M, 1H, 4H, and Daily charts
Smart Zone Merging: Automatically consolidates levels within a specified percentage range into unified zones
Dynamic Color System: Distinguishes support/resistance zones based on position relative to current price
Strength Indication: Highlights zones where multiple levels converge as strong zones
Usage Guide
Configuration Parameters
Lookback Period (10): Period for calculating highs/lows
Adjustable range: 5-30
Higher values detect more long-term levels
Zone Merge % (0.5): Percentage threshold for zone merging
Range: 0.1-2.0%
Higher values merge levels across wider price ranges
Min Levels for Zone (2): Minimum number of levels required to form a zone
Range: 2-5 levels
Higher values display only more confirmed zones
Box Opacity (7): Transparency level of zone boxes
Range: 0-100%
Color Scheme
Red: Resistance zones above current price
Blue: Support zones below current price
Orange: Strong zones (3+ merged levels)
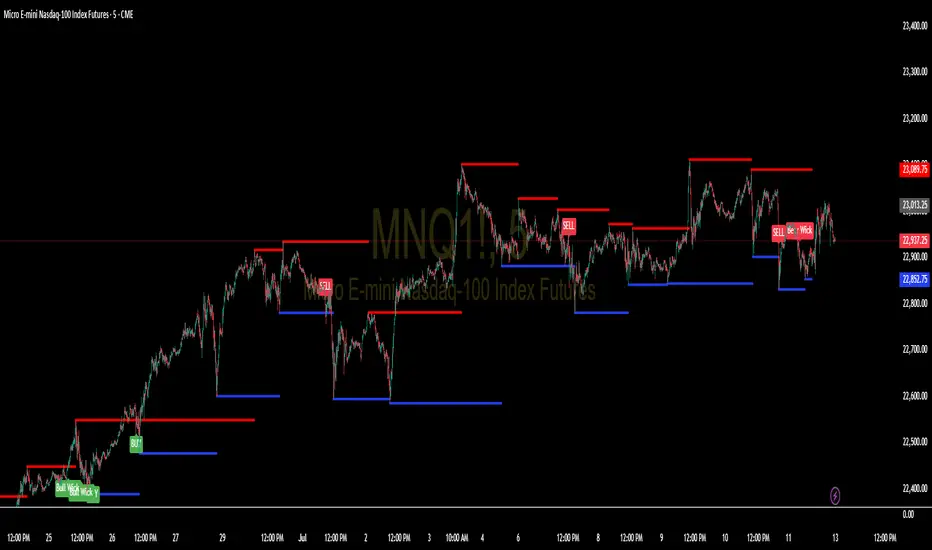
Advanced Range Theory - ART📊 Advanced Range Theory (ART): The Institutional Blueprint
Stop drawing lines. Start reading the blueprint of the market. Advanced Range Theory (ART) is not another support and resistance indicator; it is a military-grade market structure engine designed to decode the language of institutional capital. It operates on a single, powerful premise: markets move in phases of consolidation and expansion, and the key to anticipation lies in understanding the complete lifecycle of these phases.
ART provides a living, breathing map of the battlefield, identifying institutional accumulation zones and tracking them with unparalleled precision from their inception as "Pending" ranges to their ultimate classification after a breakout. This is your X-ray into the market's skeletal structure.
🔬 THEORETICAL FRAMEWORK: THE ARCHITECTURE OF PRICE ACTION
ART is built on a multi-layered system of logic that moves beyond static levels. It treats ranges as dynamic entities with a narrative—a beginning, a middle, and an end. The core of the system is the dynamic classification engine, which analyzes not just the range, but the character of the price action that resolves it.
1. The Range Lifecycle: From Accumulation to Classification
This is the revolutionary heart of ART. A range's true identity is only revealed by how it is broken.
Phase 1: PENDING (Yellow): A new range is identified based on a period of price consolidation (a "parent" candle followed by a minimum number of "inside" candles). At this stage, it is a neutral zone of potential energy—an area where institutions are likely building positions. It is a question the market has not yet answered.
Phase 2: MITIGATION & CLASSIFICATION: When price breaks out and reaches a calculated extension level, the range is considered "mitigated." At this exact moment, ART analyzes the breakout's DNA to classify the range's true intent:
TYPE 1 - BREAKOUT (Blue): Characterized by a strong, impulsive move with confirming volume. This is a high-conviction breakout, signaling aggressive institutional participation and the likely start of a new trend. It is a statement of intent.
TYPE 2 - REVERSAL (Orange): Occurs when price attempts to break one way but is aggressively rejected, reversing and breaking out the other side. This signals absorption and a "failed auction," often marking significant market turning points.
TYPE 3 - PIVOT (Green): A more balanced breakout, lacking the explosive momentum of a Type 1. This often represents a resolution after a period of indecision or a pivot within a larger trading range.
2. The Hierarchical Map: Source & S/R Levels
ART doesn't just draw boxes; it builds a genealogical map of market structure.
SOURCE LEVEL (Thick Gold Line): This is the "genesis" point—the most recently mitigated range. It acts as the primary point of origin for the current market swing and serves as a critical level for determining overall bias. Price action above the Source is generally bullish; below is bearish.
S/R LEVELS (Cyan Lines): When a range is mitigated, the price level where it broke becomes a key Support/Resistance zone for the future. ART tracks the two most recent S/R levels, as these often act as powerful magnets or rejection points for price.
3. The Multi-Factor Validation Engine
To eliminate noise and focus only on institutionally significant ranges, every potential range must pass a rigorous quality control check:
Time-Based Consolidation: Requires a minimum number of consecutive inside candles (minInsideCandles), ensuring a true period of balance.
Volatility-Based Significance: The range's size must be greater than a multiple of the Average True Range (minRangeSize), filtering out insignificant micro-consolidations.
Participation Confirmation: The parent candle of the range is checked against average volume to ensure there was meaningful activity during its formation.
⚙️ THE COMMAND CONSOLE: CONFIGURING YOUR ART ENGINE
Every input is designed to give you granular control over the detection engine, allowing you to tune ART to any market or timeframe with precision. Each tooltip in the script provides a deep dive, but here is a summary of the core controls.
🎯 ART Detection Engine
Minimum Inside Candles: The soul of the detection algorithm. It defines the minimum number of bars that must be contained within a single "parent" candle to qualify as a range. Higher values (3-4) find major, significant consolidation zones. Lower values (1-2) are more sensitive and will identify shorter-term accumulation patterns.
Extension Multiplier & Fibonacci Extension: These control the profit target projections. The Extension Multiplier uses a simple measured move (e.g., 1.0 = a 1:1 projection of the range's height). The Fibonacci Extension uses the golden ratio (1.618) for harmonically-derived targets.
Mitigation Method (Cross vs. Close): Determines how a breakout is confirmed. Cross is more responsive, triggering as soon as price touches the extension. Close is more conservative, requiring a full candle to close beyond the level, which helps filter out fake-outs from wicks.
Min Range Size (ATR): A crucial noise filter. It ensures that ART ignores tiny, insignificant ranges by requiring a range's height to be a certain multiple of the current market volatility (ATR).
📊 Display & Visual Configuration
These settings give you full control over the visual interface. You can toggle every single element—from the Webb Scanner to the S/R Levels—to create a clean or a comprehensive view. Choose a color theme that suits your charting environment or define a fully custom palette.
🕸️ Webb Analysis Scanner
This is a unique real-time flow analysis tool. It draws dynamic, animated lines from the current price to recent historical points. This visualization helps reveal hidden "tendrils" of momentum and short-term support/resistance that are not immediately obvious, acting as a "sonar" for immediate price flow.
📊 THE ANALYTICS HUB: YOUR DASHBOARD DECODED
The dashboard provides a real-time, at-a-glance intelligence briefing on the current state of market structure as seen by the ART engine.
RANGE METRICS: This section is a "census" of the market's structure. It tells you the total number of ranges identified, how many are still Pending (awaiting a breakout), how many are Unmitigated (active but not yet broken), and how many have been Mitigated (classified and complete).
TYPE BREAKDOWN: This is a powerful gauge of market character. A high count of Type 1 (Breakout) ranges suggests a strong, trending environment. A rising number of Type 2 (Reversal) ranges can signal market exhaustion and potential trend changes. A dominant Type 3 (Pivot) count indicates a balanced, rotational market.
KEY GUIDE: The Large dashboard includes a full legend, so you never have to guess what a line or color represents. It's your built-in user manual.
🎨 DECODING THE BLUEPRINT: A VISUAL INTERPRETATION GUIDE
Every line and color in ART is designed for instant, intuitive understanding.
The Range Lines:
Yellow Lines: A Pending range. This is an active zone of accumulation. Pay close attention.
Colored Lines (Blue/Orange/Green): An unmitigated, classified range. The color tells you its breakout character.
Dotted Lines: A Mitigated range. Its story has been told. These historical levels can still act as support or resistance.
The Identification Zones: These colored boxes appear at a range's origin point after it has been classified. They are the "birth certificate" of the range, permanently marking its type (Breakout, Reversal, or Pivot) and providing an immediate visual history of market behavior.
The Hierarchical Lines:
Thick Gold Line (Source): The most important line on your chart. It is the anchor for your bias.
Cyan Lines (S/R): High-probability decision points. Expect reactions here.
Purple Dotted Lines (Extensions): Logical, calculated profit targets for breaking ranges.
🔧 THE ARCHITECT'S VISION: THE DEVELOPMENT JOURNEY
ART was born from a deep frustration with the static and subjective nature of traditional market structure analysis. Drawing lines by hand is inconsistent, and most indicators are reactive, only confirming what has already happened. The goal was to create a proactive, objective, and dynamic framework that could think about the market in terms of phases and lifecycles.
The breakthrough came from a simple shift in perspective: a range's true character isn't defined when it forms, but by how it resolves. This led to the development of the "post-breakout classification engine," which waits for the market to show its hand before assigning a definitive type. The Webb Scanner was inspired by the desire to visualize the unseen, to create a tool that could feel the immediate "pull" and "push" of price flow. The result is not just an indicator; it is a new language for interpreting price action, built on a foundation of logic, clarity, and precision.
⚠️ RISK DISCLAIMER & BEST PRACTICES
Advanced Range Theory is a professional-grade analytical tool designed to enhance a trader's decision-making process. It does not provide direct buy or sell signals. The levels and classifications it generates are based on historical price action and mathematical probabilities. All trading involves substantial risk, and past performance is not indicative of future results. Always use this tool in conjunction with a robust risk management plan.
"I fear not the man who has practiced 10,000 kicks once, but I fear the man who has practiced one kick 10,000 times."
— Dskyz, Trade with insight. Trade with anticipation.
— Bruce Lee

Candle close on high time frameOVERVIEW
This indicator plots persistent closing levels of higher time frame candles (H1, H4, and Daily) on the active intraday chart in real time. Unlike similar tools, it offers granular control over line projection length, fully independent toggles per timeframe, and a built-in mechanism that automatically limits the total number of historical levels to avoid chart clutter and performance issues.
CONCEPTS
Key levels from higher time frames often act as areas where price reacts or consolidates. By projecting each candle's exact closing price forward as a horizontal reference, traders can quickly identify dynamic support and resistance zones relevant to the current price action. This indicator enables seamless multi-timeframe analysis without the need to manually switch chart intervals or re-draw lines.
FEATURES
Independent Time Frame Selection: Enable or disable H1, H4, and Daily levels individually to tailor the analysis.
Custom Extension Length: Each timeframe's closing level can be projected forward for a user-defined number of bars.
Performance Optimization: The script maintains an internal limit (default: 100) on the number of active lines. When this threshold is exceeded, the oldest lines are removed automatically.
Visual Differentiation: Colors for each timeframe are fully customizable, enabling immediate recognition of level origin.
Immediate Update: New levels appear as soon as a higher timeframe candle closes, ensuring real-time reference.
USAGE
From the indicator inputs, select which timeframes you want to track.
Adjust the extension lengths to fit your trading style and time horizon.
Customize the line colors for clarity and personal preference.
Use these projected levels as part of your confluence criteria for entries, exits, or stop placement.
Combine with trend indicators or price action tools to enhance your multi-timeframe strategy.
ORIGINALITY AND ADDED VALUE
While similar scripts exist that plot higher timeframe levels, this implementation differs in:
Its efficient automatic cleanup of old lines to preserve chart performance.
The independent extension and color settings per timeframe.
Immediate reaction to new candle closes without repainting.
Simplicity of use combined with precise customization.
This combination makes it a practical and flexible tool for traders who rely on clear HTF level visualization without manual drawing or the limitations of built-in TradingView tools.
LICENSE
This script is published open-source under the Mozilla Public License 2.0.

Support and Resistance Levels with BreaksThis indicator identifies dynamic support and resistance levels using pivot point analysis and provides clear trading signals when these levels are broken with volume confirmation. Enhanced version with improved signal clarity for better trading decisions.
## 🔧 Key Features
### Support & Resistance Detection
- Automatically identifies key pivot high and low levels
- Draws clear visual lines (red for resistance, blue for support)
- Configurable sensitivity with left/right bar settings
### Enhanced Trading Signals
- **BUY** signals when resistance is broken with volume confirmation
- **SELL** signals when support is broken with volume confirmation
- **Bull Wick** alerts for potential reversals at resistance
- **Bear Wick** alerts for potential reversals at support
### Volume Confirmation
- Built-in volume oscillator using 5 and 10-period EMAs
- Filters out low-volume false breakouts
- Adjustable volume threshold (default: 20%)
### Complete Alert System
- Support Broken alerts
- Resistance Broken alerts
- Bull Wick reversal alerts
- Bear Wick reversal alerts
## ⚙️ Settings
- **Show Breaks**: Toggle signal display
- **Left Bars**: Pivot detection lookback (default: 15)
- **Right Bars**: Pivot detection lookforward (default: 15)
- **Volume Threshold**: Minimum volume increase for valid signals (default: 20%)
## 📈 Best For
- Swing trading strategies
- Breakout confirmation
- Support/resistance trading
- Volume-based entry signals
## 🔍 How It Works
1. Identifies pivot highs/lows using configurable periods
2. Calculates volume oscillator for confirmation
3. Generates BUY signals on resistance breaks with volume
4. Generates SELL signals on support breaks with volume
5. Detects wick patterns for potential reversals
## 📋 Updates in This Version
- Enhanced BUY/SELL signal clarity (replaced generic "B" labels)
- Added Bull Wick and Bear Wick alert conditions
- Updated to Pine Script v6 compatibility
- Improved signal filtering and accuracy
## ⚠️ Disclaimer
This indicator is for educational and informational purposes only. Always conduct your own analysis and risk management before making trading decisions. Past performance does not guarantee future results.
---
**Original Script**: "Support and Resistance Levels with Breaks" by LuxAlgo
**License**: CC BY-NC-SA 4.0
**Enhanced by**: profitgang
**Version**: Pine Script v6
Fibonacci Retracement Engine (DFRE) [PhenLabs]📊 Fibonacci Retracement Engine (DFRE)
Version: PineScript™ v6
📌 Description
Dynamic Fibonacci Retracement Engine (DFRE) is a sophisticated technical analysis tool that automatically detects important swing points and draws precise Fibonacci retracement levels on various timeframes. The intelligent indicator eliminates the subjectivity of manual Fibonacci drawing using intelligent swing detection algorithms combined with multi timeframe confluence analysis.
Built for professional traders who demand accuracy and consistency, DFRE provides real time Fibonacci levels that adapt to modifications in market structure without sacrificing accuracy in changing market conditions. The indicator excels at identifying key support and resistance levels where price action is more likely to react, giving traders a potent edge in entry and exit timing.
🚀 Points of Innovation
Intelligent Swing Detection Algorithm : Advanced pivot detection with customizable confirmation bars and minimum swing percentage thresholds
Multi-Timeframe Confluence Engine : Simultaneous analysis across three timeframes to identify high-probability zones
Dynamic Level Management : Automatically updates and manages multiple Fibonacci sets while maintaining chart clarity
Adaptive Visualization System : Smart labeling that shows only the most relevant levels based on user preferences
Real-Time Confluence Detection : Identifies zones where multiple Fibonacci levels from different timeframes converge
Automated Alert System : Comprehensive notifications for level breakouts and confluence zone formations
🔧 Core Components
Swing Point Detection Engine : Uses pivot high/low calculations with strength confirmation to identify significant market turns
Fibonacci Calculator : Automatically computes standard retracement levels (0.236, 0.382, 0.5, 0.618, 0.786, 0.886) plus extensions (1.272, 1.618)
Multi-Timeframe Security Function : Safely retrieves Fibonacci data from higher timeframes without repainting
Confluence Analysis Module : Mathematically identifies zones where multiple levels cluster within specified thresholds
Dynamic Drawing Management : Efficiently handles line and label creation, updates, and deletion to maintain performance
🔥 Key Features
Customizable Swing Detection : Adjust swing length (3-50 bars) and strength confirmation (1-10 bars) to match your trading style
Selective Level Display : Choose which Fibonacci levels to show, from core levels to full extensions
Multi-Timeframe Analysis : Analyze up to 3 different timeframes simultaneously for confluence identification
Intelligent Labeling System : Options to show main levels only or all levels, with latest-set-only functionality
Visual Customization : Adjustable line width, colors, and extension options for optimal chart clarity
Performance Optimization : Limit maximum Fibonacci sets (1-5) to maintain smooth chart performance
Comprehensive Alerting : Get notified on level breakouts and confluence zone formations
🎨 Visualization
Dynamic Fibonacci Lines : Color-coded lines (green for uptrends, red for downtrends) with customizable width and extension
Smart Level Labels : Precise level identification with both ratio and price values displayed
Confluence Zone Highlighting : Visual emphasis on areas where multiple timeframe levels converge
Clean Chart Management : Automatic cleanup of old drawing objects to prevent chart clutter
Responsive Design : All visual elements adapt to different chart sizes and timeframes
📖 Usage Guidelines
Swing Detection Settings
Swing Detection Length - Default: 25 | Range: 3-50 | Controls the lookback period for identifying pivot points. Lower values detect more frequent swings but may include noise, while higher values focus on major market turns.
Swing Strength (Confirmation Bars) - Default: 2 | Range: 1-10 | Number of bars required to confirm a swing point. Higher values reduce false signals but increase lag.
Minimum Swing % Change - Default: 1.0% | Range: 0.1-10.0% | Minimum percentage change required to register a valid swing. Filters out insignificant price movements.
Fibonacci Level Settings
Individual Level Toggles : Enable/disable specific Fibonacci levels (0.236, 0.382, 0.5, 0.618, 0.786, 0.886)
Extensions : Show projection levels (1.272, 1.618) for target identification
Multi-Timeframe Settings
Timeframe Selection : Choose three higher timeframes for confluence analysis
Confluence Threshold : Percentage tolerance for level clustering (0.5-5.0%)
✅ Best Use Cases
Swing Trading : Identify optimal entry and exit points at key retracement levels
Confluence Trading : Focus on high-probability zones where multiple timeframe levels align
Support/Resistance Trading : Use dynamic levels that adapt to changing market structure
Breakout Trading : Monitor level breaks for momentum continuation signals
Target Setting : Utilize extension levels for profit target placement
⚠️ Limitations
Lagging Nature : Requires confirmed swing points, which means levels appear after significant moves
Market Condition Dependency : Works best in trending markets; less effective in extremely choppy conditions
Multiple Signal Complexity : Multiple timeframe analysis may produce conflicting signals requiring experience to interpret
Performance Considerations : Multiple Fibonacci sets and MTF analysis may impact indicator loading time on slower devices
💡 What Makes This Unique
Automated Precision : Eliminates manual drawing errors and subjective level placement
Multi-Timeframe Intelligence : Combines analysis from multiple timeframes for superior confluence detection
Adaptive Management : Automatically updates and manages multiple Fibonacci sets as market structure evolves
Professional-Grade Alerts : Comprehensive notification system for all significant level interactions
🔬 How It Works
Step 1 - Swing Point Identification : Scans price action using pivot high/low calculations with specified lookback periods, applies confirmation logic to eliminate false signals, and calculates swing strength based on surrounding price action for quality assessment.
Step 2 - Fibonacci Level Calculation : Automatically computes retracement and extension levels between confirmed swing points, creates dynamic level sets that update as new swing points are identified, and maintains multiple active Fibonacci sets for comprehensive market analysis.
Step 3 - Multi-Timeframe Confluence : Retrieves Fibonacci data from higher timeframes using secure request functions, analyzes level clustering across different timeframes within specified thresholds, and identifies high-probability zones where multiple levels converge.
💡 Note: This indicator works best when combined with other technical analysis tools and proper risk management. The multi-timeframe confluence feature provides the highest probability setups, but always confirm signals with additional analysis before entering trades.

Interest Zones | @CRYPTOKAZANCEVEnglish Description.
🧠 What This Script Does
This script automatically detects price interest zones — areas where the price repeatedly reacts by forming local swing highs or lows , suggesting heightened supply/demand or market attention. It uses a custom volatility-adjusted range (pseudo-ATR) to dynamically group significant swing points and highlights these zones visually on the chart.
The script is not a mashup or copy of built-in indicators. It’s an original implementation that performs a meaningful calculation based on market structure and volatility to help traders identify important price areas.
⚙️ How It Works
1. Swing Point Detection:
The script identifies swing highs and lows using a configurable lookback window.
2. Zone Candidate Evaluation:
Each swing is checked against a custom zone width (based on ATR and your multiplier). If multiple swings fall within this range, it’s marked as a potential zone.
3. Filtering:
The script keeps only those zones that:
• Contain at least a user-defined number of swing points.
• Do not overlap with stronger (higher swing count) zones.
4. Visualization:
• The strongest zones are drawn as semi-transparent boxes.
• Zones are limited by time (last X candles).
• Optional: Swing highs/lows can be shown on chart.
📊 How to Use
• Use it on any timeframe or asset to identify price regions of interest.
• Combine with volume, trend, or candlestick analysis for entries/exits.
• The number of touches (swing points in a zone) gives insight into zone significance.
This tool is particularly useful for identifying support/resistance areas based on actual price structure rather than arbitrary levels.
🔧 Settings
• Swing Lookback Period: Controls how many candles on each side of a pivot the script checks to detect a local high/low.
• Zone Width Multiplier: Adjusts the volatility-based range. Larger values create wider zones.
• Min Swing Count: Zones with fewer swing points than this won't be shown.
• Max Zones Displayed: Limits the number of zones shown on screen.
• Max Candles for Analysis: Old swing points beyond this range are ignored.
📌 Notes
• No third-party code or mashups used.
• This is a standalone implementation of a concept similar to market structure mapping, tailored to be dynamic and responsive to volatility.
• Ideal for traders who prefer clean, price-action-based analysis.
🇷🇺 Русское описание
🧠 Что делает этот индикатор:
Индикатор автоматически определяет зоны интереса цены — области, где цена многократно формирует локальные максимумы или минимумы (свинги) . Эти зоны могут сигнализировать о повышенном внимании рынка, предложении или спросе. Скрипт использует псевдо-ATR (волатильность на основе среднего диапазона), чтобы динамически определять такие области и выделяет их на графике.
Это не копия стандартных индикаторов и не микс чужих скриптов — это оригинальная разработка , полезная для всех, кто ищет автоматическую разметку важных ценовых уровней.
⚙️ Как работает индикатор
1. Поиск свинг-точек:
Определяются локальные экстремумы с учетом указанного периода.
2. Формирование кандидатов в зоны:
Каждая свинг-точка проверяется, есть ли в её диапазоне другие свинги. Если таких достаточно — зона считается потенциальной.
3. Фильтрация зон:
• Учитываются только зоны с минимумом заданных свингов.
• Перекрывающиеся зоны удаляются в пользу более значимых.
4. Визуализация:
• Отображаются зоны с наибольшим числом касаний.
• Зоны ограничиваются последними X свечами.
• При желании можно отобразить сами свинг-точки.
📊 Как использовать
• Работает на любом таймфрейме и инструменте.
• Используйте совместно с объёмами, трендом или свечным анализом.
• Количество касаний помогает оценить важность зоны.
Полезен тем, кто предпочитает анализ на основе структуры цены, а не произвольных уровней.
🔧 Настройки
• Период свингов: Сколько свечей учитывается по бокам для поиска экстремумов.
• Множитель зоны: Увеличивает диапазон зоны на основе волатильности.
• Мин. количество свингов: Минимум точек в зоне для её отображения.
• Макс. зон на графике: Ограничение по количеству отображаемых зон.
• Макс. свечей анализа: Старые точки за пределами не учитываются.
📌 Примечания
• Не содержит чужих индикаторов или шаблонов.
• Самостоятельная реализация механизма анализа структуры рынка.

FibSync - DynamicFibSupportWhat is this indicator?
FibSync – DynamicFibSupport overlays your chart with both static and dynamic Fibonacci retracement levels, making it easy to spot potential areas of support and resistance.
Static Fibs: Calculated from the highest and lowest price over a user-defined lookback period.
Dynamic Fibs: Calculated from the most recent swing high and swing low, automatically adapting as new swings form.
How to use
Add the indicator to your chart.
Configure the settings:
Static Fib Period: Sets the lookback window for static fib levels.
Show Dynamic Fibonacci Levels: Toggle dynamic fibs on/off.
Dynamic Fib Swing Search Window: How far back to search for valid swing highs/lows.
Swing Strength (bars left/right): How many bars define a swing high/low (higher = stronger swing).
Interpret the levels:
Solid lines are static fibs.
Transparent lines are dynamic fibs (if enabled).
Colors match standard fib conventions (yellow = 0.236, red = 0.382, blue = 0.618, green = 0.786, gray = 0.5).
Tips
Static and dynamic fibs can overlap-this often highlights especially important support/resistance zones.
Adjust the swing strength for your trading style: lower values for short-term, higher for long-term swings.
Hide/show individual lines using the indicator’s style settings in TradingView.
Trading Ideas (for higher timeframes and static fibs)
Close above the blue line (0.618 static fib):
This can be interpreted as a potential long (buy) signal, suggesting the market is breaking above a key resistance level.
Close below the red line (0.382 static fib):
This can be interpreted as a potential short (sell) signal, indicating the market is breaking below a key support level.
Note: These signals are most meaningful on higher timeframes and when using the static fib lines. Always confirm with your own strategy and risk management.

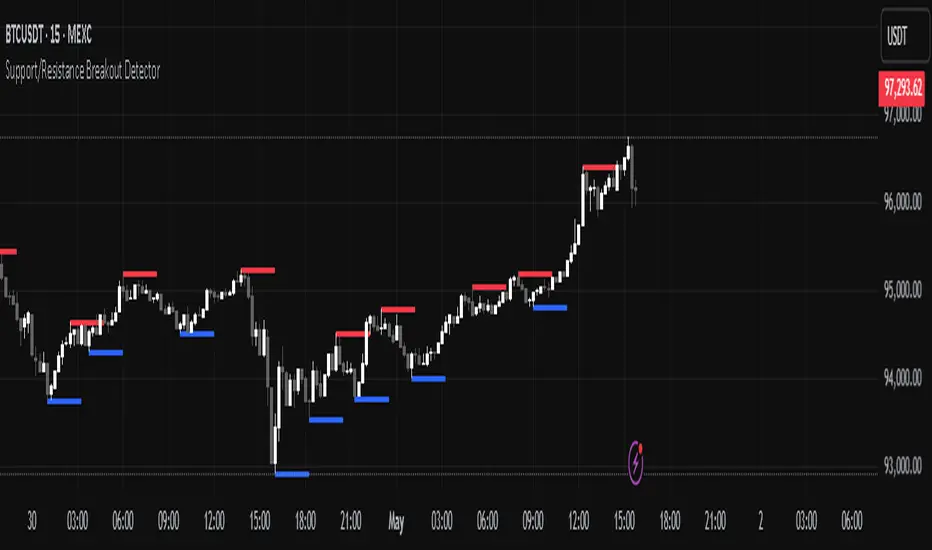
Support/Resistance Breakout DetectorThis indicator automatically detects and plots dynamic support and resistance levels using pivot highs and lows.
✅ It draws red resistance lines and blue support lines,
✅ The lines extend forward but automatically stop when the price touches them,
✅ It monitors for breakouts with strong volume,
✅ When a breakout happens, it shows labels like “B” or “Bull Wick” / “Bear Wick” on the chart,
✅ It also triggers alerts when support or resistance breaks with high volume.
Main settings:
Pivot lookback period
Show/hide breakout labels
Minimum volume for breakout
Maximum extension length for lines
This tool helps traders easily spot key price levels and watch for meaningful breakouts.
All-Time, Yearly & Monthly High/LowThis indicator visually tracks and displays:
• All-Time High (ATH) – The highest price the asset has ever reached
• All-Time Low (ATL) – The lowest price the asset has ever reached
• Yearly High/Low – The highest and lowest prices recorded in the current calendar year
• Monthly High/Low – The highest and lowest prices in the current calendar month
It helps traders quickly identify major support/resistance levels and historical price extremes across different timeframes. Level
Color
Updates When
All-Time High
Red
A new highest price ever is reached
All-Time Low
Green
A new lowest price ever is reached
Yearly High
Orange
New yearly high occurs or changes with new year
Yearly Low
Teal
New yearly low occurs or changes with new year
Monthly High
Fuchsia
New monthly high or at the start of each new month
Monthly Low
Navy Blue
New monthly low or at the start of each new month This indicator is especially useful for:
• Swing traders watching monthly or yearly trend zones
• Breakout traders looking to spot price levels where breakouts might occur
• Reversal traders using all-time levels for high-risk reward zones
• Long-term investors gauging historical extremes for entries/exits

Pre-Market High/Low (Static Lines + Labels)
Pre-Market Range ✅
Draws the Pre-Market High & Low from 4:00 AM to 9:30 AM ET using accurate 1-minute intraday data.
Static Lines 📏
Plots dashed horizontal lines that remain visible all day across all timeframes — including 1m, 5m, 15m, 1h, 4h, and Daily.
Price Labels 🔖
Includes real-time price labels so you can easily reference exact pre-market levels on the chart.
Session Lock 🕒
Lines are locked in after 9:30 AM and remain visible even if you switch timeframes or turn off extended hours.
Trading Utility 🎯
Ideal for identifying key breakout levels, intraday support/resistance zones, and setting risk parameters.

Opal Title: Opal Lines
Short Title: Opal Lines
Description:
Opal Lines is a dynamic overlay indicator that plots horizontal price levels at the open of key market sessions throughout the trading day, based on Eastern Time (ET). Designed for traders who rely on session-based price action, it marks significant intraday events such as the European Open (3:00 AM ET), Gold Open (8:20 AM ET), Regular Market Open (9:30 AM ET), and Globex Open (6:00 PM ET), among others. Each line is color-coded and toggleable via inputs, allowing users to customize which sessions they want to track.
Unlike generic time-based tools, Opal Lines captures the opening price at precise minute intervals and extends these levels across the chart until the daily reset at 5:00 PM ET (except for the Globex line, which persists into the next day). This makes it ideal for identifying support/resistance zones, breakout levels, or reference points tied to major market openings. Traders can use it across forex, futures, equities, or commodities to align their strategies with global session dynamics.
Key Features:
Seven toggleable session lines with distinct colors for easy identification.
Time-specific logic using ET, adaptable to any chart timeframe.
Persistent lines that reset daily, with Globex extending overnight.
Lightweight and overlay-friendly, preserving chart clarity.
How to Use:
Add the indicator to your chart and enable the sessions relevant to your trading style. Watch for price interactions with these levels—e.g., bounces, breaks, or retests—especially during high-volume periods. Combine with other tools like volume or oscillators for confirmation.
Note: Ensure your chart’s timezone is set to “America/New_York” (ET) for accurate alignment.

Support & Resistance + EMA + Swing SL (3 Min)### **📌 Brief Description of the Script**
This **Pine Script indicator** for TradingView displays **Support & Resistance levels, EMAs (21 & 26), and Swing High/Low-based Stop-Loss (SL) points** on a **3-minute timeframe**.
---
### **🔹 Key Features & Functionality**
1️⃣ **🟥 Support & Resistance Calculation:**
- Finds the **highest & lowest price over the last 50 candles**
- Plots **Resistance (Red) & Support (Green) levels**
2️⃣ **📈 EMA (Exponential Moving Averages):**
- **21 EMA (Blue)** and **26 EMA (Orange)** for trend direction
- Helps in identifying bullish or bearish momentum
3️⃣ **📊 Swing High & Swing Low Detection:**
- Identifies **Swing Highs (Higher than last 5 candles) as SL for Short trades**
- Identifies **Swing Lows (Lower than last 5 candles) as SL for Long trades**
- Plots these levels as **Purple (Swing High SL) & Yellow (Swing Low SL) dotted lines**
4️⃣ **📌 Labels on Swing Points:**
- **"HH SL"** is placed on Swing Highs
- **"LL SL"** is placed on Swing Lows
5️⃣ **⚡ Breakout Detection:**
- Detects if **price crosses above Resistance** (Bullish Breakout)
- Detects if **price crosses below Support** (Bearish Breakout)
- Background color changes to **Green (Bullish)** or **Red (Bearish)**
6️⃣ **🚨 Alerts for Breakouts:**
- Sends alerts when **price breaks above Resistance or below Support**
---
### **🎯 How to Use This Indicator?**
- **Trade with Trend:** Follow **EMA crossovers** and Support/Resistance levels
- **Set Stop-Loss:** Use **Swing High as SL for Shorts** & **Swing Low as SL for Longs**
- **Look for Breakouts:** Enter trades when price **crosses Resistance or Support**
This script is **ideal for scalping & intraday trading** in a **3-minute timeframe** 🚀🔥
Let me know if you need **any modifications or improvements!** 📊💹

AEST High-Low MarkerOverview
This TradingView indicator, AEST High-Low Marker, is designed to mark the highest and lowest price levels observed between 5:00 PM and 6:00 PM AEST and extend these levels visually on the chart only between 5:00 PM and 12:00 AM AEST.
Functionality
Time Conversion for AEST
Since TradingView operates in UTC, the script translates AEST (UTC+10 or UTC+11 during daylight savings) into UTC time.
The script starts tracking from 5:00 PM AEST (7 AM UTC) to 6:00 PM AEST (8 AM UTC).
The high and low lines will be displayed only between 5:00 PM and 12:00 AM AEST (7 AM to 2 PM UTC).
Real-Time High & Low Calculation
The indicator dynamically updates the session high and low as new candles form during the 5 PM - 6 PM AEST period.
It captures the maximum high and minimum low during this timeframe.
Line Display Restrictions
The session high and low lines will only be drawn between 5:00 PM and 12:00 AM AEST to prevent chart clutter.
The lines disappear after 12:00 AM AEST.
Visual Representation
Blue Line: Marks the session high recorded between 5 PM - 6 PM AEST.
Red Line: Marks the session low recorded between 5 PM - 6 PM AEST.
Both lines extend until 12 AM AEST and then disappear.
Use Case
This indicator is useful for traders looking to track key price levels formed between 5 PM and 6 PM AEST and observe how price interacts with these levels until midnight.
It is particularly beneficial for intraday and short-term trading strategies, allowing users to identify potential support and resistance zones based on early evening price action.

Support Resistance - Percentile LevelsKey Features:
1. Percentile Calculations:
The indicator calculates the 95th percentile (PercentilePlot100) and the 5th percentile (PercentilePlot5) of the high and low prices over specified lengths.
The lengths for these calculations are adjustable via input fields, allowing users to customize the periods used for percentile calculations.
2. Percentile Levels:
Resistance Levels (R1, R2, R3, R4): Plots resistance levels based on the 95th percentile of the high prices over different lengths (100, 200, 750, 4500).
Support Levels (S1, S2, S3, S4): Plots support levels based on the 5th percentile of the low prices over different lengths (100, 200, 750, 4500).
3. High-Timeframe Average:
Calculates and plots the average of the 750-period high and low percentiles (htfavg), which acts as a pivot point on the chart.
How to Use This Indicator:
1. Identify Key Support and Resistance Levels:
Use the plotted resistance (R1, R2, R3, R4) and support (S1, S2, S3, S4) levels to identify key areas where price may reverse or consolidate.
2. Pivot Point Analysis:
The plotted pivot point (htfavg) can be used to identify potential areas of trend change or consolidation. It represents the average price level based on higher timeframe percentiles.
3. Trend Analysis:
By observing how price interacts with these percentile levels, traders can gain insights into market trends and potential reversal points.
Customization:
The input fields allow you to customize the lengths of the percentiles and the percentile plot values according to your trading strategy and timeframe preference.
In summary, this indicator can help traders identify significant support and resistance levels, potential pivot points, and overall market trends based on percentile calculations of high and low prices over various periods. This can be valuable for making informed trading decisions and setting entry and exit points.
If you have any specific questions or need further customization, feel free to ask! 😊

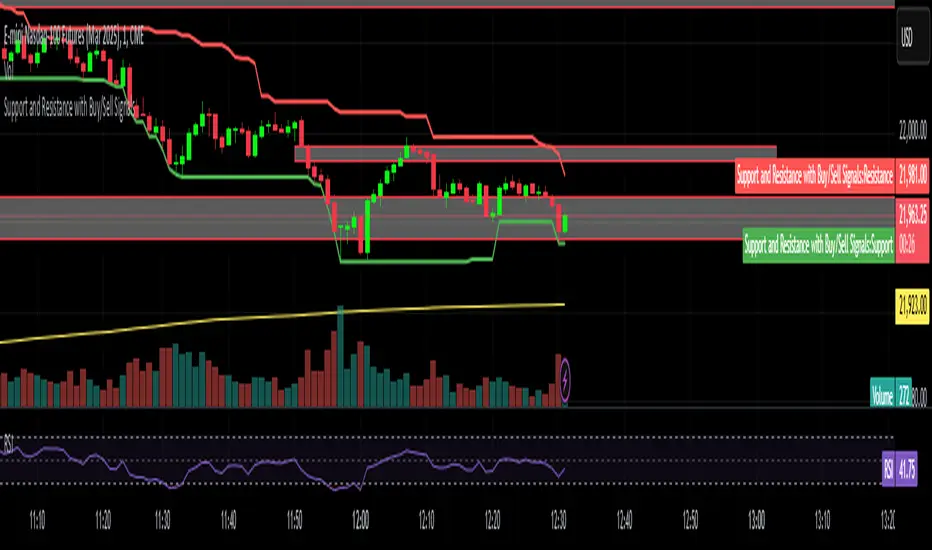
Support and Resistance with Buy/Sell SignalsSwing Highs and Lows:
The script identifies swing highs and lows using the ta.highest and ta.lowest functions over a user-defined swing_length period.
Swing highs are treated as resistance levels.
Swing lows are treated as support levels.
Buy Signal:
A buy signal is generated when the price closes above the resistance level (ta.crossover(close, swing_high)).
Sell Signal:
A sell signal is generated when the price closes below the support level (ta.crossunder(close, swing_low)).
Plotting:
Support and resistance levels are plotted on the chart.
Buy and sell signals are displayed as labels on the chart.
Background Highlighting:
The background is highlighted in green for buy signals and red for sell signals (optional).
Adaptive Supply and Demand [EdgeTerminal]Adaptive Supply and Demand is a dynamic supply and demand indicator with a few unique twists. It considers volume pressure, volatility-based adjustments and multi-time frame momentum for confidence scoring (multi-step confirmation) to generate dynamic lines that adjust based on the market and also to generate dynamic support/resistance levels for the supply and demand lines.
The dynamic support and resistance lines shown gives you a better situational awareness of the current state of the market and add more context to why the market is moving into a certain direction.
> Trading Scenarios
When the confidence score is over 80%, strong volume pressure in trend direction (up or down), volatility is low and momentum is aligned across timeframes, there is an indication of a strong upward or downward trend.
When the supply and demand line crossover, the confidence score is over 75% and the volume pressure is shifting, this can be an indicator of trend reversal. Use tight initial stops, scale into position as trend develops, monitor the volume pressure for continuation and wait for confidence confirmation.
When the confiance score is below 60%, the volume pressure is choppy, volatility is high, you want to avoid trading or reduce position size, wait for confidence improvements, use support and resistance for entries/exits and use tighter stops due to market conditions. This is an indication of a ranging market.
Another scenario is when there is a sudden volume pressure increase, and a raising confidence score, the volatility is expanding and the bar momentum is aligning the volatility direction. This can indicate a breakout scenario.
> How it Works
1. Volume Pressure Analysis
Volume Pressure Analysis is a key component that measures the true buying and selling force in the market. Here's a detailed breakdown. The idea is to standardize volume to prevent large spikes from skewing results.
The indicator employs an adaptive volume normalization technique to detect genuine buying and selling pressure.
It takes current volume and divides it by average volume.
If normVol > 1: Current volume is above average
If normVol < 1: Current volume is below average
An example if this would be If current volume is 1500 and average is 1000, normVol = 1.5 (50% above average)
Another component of the volume pressure analysis is the Price Change Calculation sub-module. The purpose of this is to measure price movement relative to recent average.
It works by subtracting the average price from the current price. If the value is positive, price is average and if negative, price is below average.
Finally, the volume pressure is calculated to combine volume and price for true pressure reading.
2. Savitzky-Golay Filtering
SG filtering implements advanced signal smoothing while preserving important trend features. It uses weighted moving average approximation, preserves higher moments of data and reduces noise while maintaining signal integrity.
This results in smoother signal lines, reduced false crossovers and better trend identification. Traditional moving averages tend to lag and smooth out important features. Additionally, simple moving averages can miss critical turning points and regular smoothing can delay signal generation.
SG filtering preserves higher moments such as peaks, valleys and trends, reduces noise while maintaining signal sharpness.
It works by creating a symmetric weighting scheme. This way center points get the highest weights while edge points get the lowest weight.
3. Parkinson's Volatility
Parkinson's Volatility is an advanced volatility measurement formula using high-low range data. It uses high-low range for volatility calculation, incorporates logarithmic returns and annualized the volatility measure.
This results in more accurate volatility measurement, better risk assessment and dynamic signal sensitivity.
4. Multi-timeframe Momentum
This combines signals from each module for each timeframe to calculate momentum across three timeframes. It also applies weighted importance to each timeframe and generates a composite momentum signal.
This results in a more comprehensive trend analysis, reduced timeframe bias and better trend confirmation.
> Indicator Settings
Short-term Period:
Lower values makes it more sensitive, meaning it will generate more signals. Higher values makes it less sensitive, resulting in fewer signals. We recommend a 5 to 15 range for day trading, and 10 to 20 for swing trading
Medium-term Period:
Lower values result in faster trend confirmation and higher values show slower and more reliable confirmation. We recommend a range of 15-25 for day trading and 20-30 for swing trading.
Long-term Period:
Lower values makes it more responsive to trend changes and higher values are better for major trend identification. We recommend a range of 40-60 for day trading and 50-100 for swing trading.
Volume Analysis Window:
Lower values result in more sensitivity to volume changes and higher values result in smoother volume analysis. The optimal range is 15-25 for most trading styles.
Confidence Threshold:
Lower values generate more signals but quality decreases. Higher values generate fewer signals but accuracy increases.The optimal range is 0.65-0.8 for most trading conditions.

Sma Indicator with Ratio (pr)SMA Indicator with Ratio (PR) is a technical analysis tool designed to provide insights into the relationship between multiple Simple Moving Averages (SMAs) across different time frames. This indicator combines three key SMAs: the 111-period SMA, 730-period SMA, and 1400-period SMA. Additionally, it introduces a ratio-based approach, where the 730-period SMA is multiplied by factors of 2, 3, 4, and 5, allowing users to analyze potential market trends and price movements in relation to different SMA levels.
What Does This Indicator Do?
The primary function of this indicator is to track the movement of prices in relation to several SMAs with varying periods. By visualizing these SMAs, users can quickly identify:
Short-term trends (111-period SMA)
Medium-term trends (730-period SMA)
Long-term trends (1400-period SMA)
Additionally, the multiplied versions of the 730-period SMA provide deeper insights into potential price reactions at different levels of market volatility.
How Does It Work?
The 111-period SMA tracks the shorter-term price trend and can be used for identifying quick market movements.
The 730-period SMA represents a longer-term trend, helping users gauge overall market sentiment and direction.
The 1400-period SMA acts as a very long-term trend line, giving users a broad perspective on the market’s movement.
The ratio-based SMAs (2x, 3x, 4x, 5x of the 730-period SMA) allow for an enhanced understanding of how the price reacts to higher or lower volatility levels. These ratios are useful for identifying key support and resistance zones in a dynamic market environment.
Why Use This Indicator?
This indicator is useful for traders and analysts who want to track the interaction of price with different moving averages, enabling them to make more informed decisions about potential trend reversals or continuations. The added ratio-based values enhance the ability to predict how the market might react at different levels.
How to Use It?
Trend Confirmation: Traders can use the indicator to confirm the direction of the market. If the price is above the 111, 730, or 1400-period SMA, it may indicate an uptrend, and if below, a downtrend.
Support/Resistance Levels: The multiplied versions of the 730-period SMA (2x, 3x, 4x, 5x) can be used as dynamic support or resistance levels. When the price approaches or crosses these levels, it might indicate a change in the trend.
Volatility Insights: By observing how the price behaves relative to these SMAs, traders can gauge market volatility. Higher multiples of the 730-period SMA can signal more volatile periods where price movements are more pronounced.

Support and Resistance Levels (MMNOMICS)This indicator, titled "Support and Resistance Levels", is designed to identify and visualize critical price levels on a chart using Pine Script (version 5). It calculates support and resistance based on the highest and lowest prices over a user-defined lookback period (default: 20 bars). The support level represents the lowest low during this period, acting as a potential price floor, while the resistance level represents the highest high, serving as a potential price ceiling. These levels are plotted as green and red lines, respectively. To enhance visualization, dynamic zones are created with semi-transparent background colors—green when the price is near or below the support level, and red when the price is near or above the resistance level. Additionally, the indicator uses visual markers to highlight potential reversals: green triangles appear below bars near the support level, and red triangles above bars near the resistance level. This tool helps traders quickly identify areas of potential price action, aiding in decision-making and strategy development.

Ultra Round NumbersThe Ultra Round Numbers indicator is designed to improve your market analysis by visually emphasizing significant price levels. These round numbers often act as psychological levels where traders and investors tend to make decisions. With this tool, you can easily spot these levels, adjust their precision, and customize their appearance.
Detailed Description
Ultra Round Numbers dynamically plots horizontal lines at key price intervals based on user-defined step sizes. These intervals represent round-numbered price levels, which can serve as critical support and resistance zones.
Step Configurations
The indicator features three customizable steps: Biggest, Middle, and Smallest.
Each step allows you to define:
The step size in price to determine the intervals for the lines.
The maximum number of lines above and below the current price.
The color, style, and thickness of the lines for better visualization.
The script efficiently handles the creation and deletion of lines to prevent clutter on the chart. It ensures only the relevant lines (from biggest step to lowest step) are displayed based on your settings and the current price movement.
This indicator is a powerful yet user-friendly indicator for identifying psychological price levels on your charts. With fully customizable steps, dynamic line management, and clean visuals, this tool empowers traders of all skill levels to make more informed trading decisions.

WhalenatorThis custom TradingView indicator combines multiple analytic techniques to help identify potential market trends, areas of support and resistance, and zones of heightened trading activity. It incorporates a SuperTrend-like line based on ATR, Keltner Channels for volatility-based price envelopes, and dynamic order blocks derived from significant volume and pivot points. Additionally, it highlights “whale” activities—periods of exceptionally large volume—along with an estimated volume profile level and approximate bid/ask volume distribution. Together, these features aim to offer traders a more comprehensive view of price structure, volatility, and institutional participation.
This custom TradingView indicator integrates multiple trading concepts into a single, visually descriptive tool. Its primary goal is to help traders identify directional bias, volatility levels, significant volume events, and potential support/resistance zones on a price chart. Below are the main components and their functionalities:
SuperTrend-Like Line (Trend Bias):
At the core of the indicator is a trend-following line inspired by the SuperTrend concept, which uses Average True Range (ATR) to adaptively set trailing stop levels. By comparing price to these levels, the line attempts to indicate when the market is in an uptrend (price above the line) or a downtrend (price below the line). The shifting levels can provide a dynamic sense of direction and help traders stay with the predominant trend until it shifts.
Keltner Channels (Volatility and Range):
Keltner Channels, based on an exponential moving average and Average True Range, form volatility-based envelopes around price. They help traders visualize whether price is extended (touching or moving outside the upper/lower band) or trading within a stable range. This can be useful in identifying low-volatility consolidations and high-volatility breakouts.
Dynamic Order Blocks (Approximations of Supply/Demand Zones):
By detecting pivot highs and lows under conditions of significant volume, the indicator approximates "order blocks." Order blocks are areas where institutional buying or selling may have occurred, potentially acting as future support or resistance zones. Although these approximations are not perfect, they offer a visual cue to areas on the chart where price might react strongly if revisited.
Volume Profile Proxy and Whale Detection:
The indicator highlights price levels associated with recent maximum volume activity, providing a rough "volume profile" reference. Such levels often become key points of price interaction.
"Whale" detection logic attempts to identify bars where exceptionally large volume occurs (beyond a defined threshold). By tracking these "whale bars," traders can infer where heavy participation—often from large traders or institutions—may influence market direction or create zones of interest.
Approximate Bid/Ask Volume and Dollar Volume Tracking:
The script estimates whether volume within each bar leans more towards the bid or the ask side, aiming to understand which participant (buyers or sellers) might have been more aggressive. Additionally, it calculates dollar volume (close price multiplied by volume) and provides an average to gauge the relative participation strength over time.
Labeling and Visual Aids:
Dynamic labels display Whale Frequency (the ratio of bars with exceptionally large volume), average dollar volume, and approximate ask/bid volume metrics. This gives traders at-a-glance insights into current market conditions, participation, and sentiment.
Strengths:
Multifaceted Analysis:
By combining trend, volatility, volume, and order block logic in one place, the indicator saves chart space and simplifies the analytical process. Traders gain a holistic view without flipping between multiple separate tools.
Adaptable to Market Conditions:
The use of ATR and Keltner Channels adapts to changing volatility conditions. The SuperTrend-like line helps keep traders aligned with the prevailing trend, avoiding constant whipsaws in choppy markets.
Volume-Based Insights:
Integrating whale detection and a crude volume profile proxy helps traders understand where large players might be interacting. This perspective can highlight critical levels that might not be evident from price action alone.
Convenient Visual Cues and Labels:
The indicator provides quick reference points and textual information about the underlying volume dynamics, making decision-making potentially faster and more informed.
Weaknesses:
Heuristic and Approximate Nature:
Many of the indicator’s features, like the "order blocks," "whale detection," and the approximate bid/ask volume, rely on heuristics and assumptions that may not always be accurate. Without actual Level II data or true volume profiles, the insights are best considered as supplementary, not definitive signals.
Lagging Components:
Indicators that rely on past data, like ATR-based trends or moving averages for Keltner Channels, inherently lag behind price. This can cause delayed signals, particularly in fast-moving markets, potentially missing some early opportunities or late in confirming market reversals.
No Guaranteed Predictive Power:
As with any technical tool, it does not forecast the future with certainty. Strong volume at a certain level or a bullish SuperTrend reading does not guarantee price will continue in that direction. Market conditions can change unexpectedly, and false signals will occur.
Complexity and Overreliance Risk:
With multiple signals combined, there’s a risk of information overload. Traders might feel compelled to rely too heavily on this one tool. Without complementary analysis (fundamentals, news, or additional technical confirmation), overreliance on the indicator could lead to misguided trades.
Conclusion:
This integrated indicator offers a comprehensive visual guide to market structure, volatility, and activity. Its strength lies in providing a multi-dimensional viewpoint in a single tool. However, traders should remain aware of its approximations, inherent lags, and the potential for conflicting signals. Sound risk management, position sizing, and the use of complementary analysis methods remain essential for trading success.
Risks Associated with Trading:
No indicator can guarantee profitable trades or accurately predict future price movements. Market conditions are inherently unpredictable, and reliance on any single tool or combination of tools carries the risk of financial loss. Traders should practice sound risk management, including the use of stop losses and position sizing, and should not trade with funds they cannot afford to lose. Ultimately, decisions should be guided by a thorough trading plan and possibly supplemented with other forms of market analysis or professional advice.
Risks and Important Considerations:
• Not a Standalone Tool:
• This indicator should not be used in isolation. It is essential to incorporate additional technical analysis tools, fundamental analysis, and market context when making trading decisions.
• Relying solely on this indicator may lead to incomplete assessments of market conditions.
• Market Volatility and False Signals:
• Financial markets can be highly volatile, and indicators based on historical data may not accurately predict future movements.
• The indicator may produce false signals due to sudden market changes, low liquidity, or atypical trading activity.
• Risk Management:
• Always employ robust risk management strategies, including setting stop-loss orders, diversifying your portfolio, and not over-leveraging positions.
• Understand that no indicator guarantees success, and losses are a natural part of trading.
• Emotional Discipline:
• Avoid making impulsive decisions based on indicator signals alone.
• Emotional trading can lead to significant financial losses; maintain discipline and adhere to a well-thought-out trading plan.
• Continuous Learning and Adaptation:
• Stay informed about market news, economic indicators, and global events that may impact trading conditions.
• Continuously evaluate and adjust your trading strategies as market dynamics evolve.
• Consultation with Professionals:
• Consider seeking advice from financial advisors or professional traders to understand better how this indicator can fit into your overall trading strategy.
• Professional guidance can provide personalized insights based on your financial goals and risk tolerance.
Disclaimer:
Trading financial instruments involves substantial risk and may not be suitable for all investors. Past performance is not indicative of future results. This indicator is provided for informational and educational purposes only and should not be considered investment advice. Always conduct your own research and consult with a licensed financial professional before making any trading decisions.
Note: The effectiveness of any technical indicator can vary based on market conditions and individual trading styles. It's crucial to test indicators thoroughly using historical data and possibly paper trading before applying them in live trading scenarios.

Weis Wave Max█ Overview
Weis Wave Max is the result of my weis wave study.
David Weis said,
"Trading with the Weis Wave involves changes in behavior associated with springs, upthrusts, tests of breakouts/breakdowns, and effort vs reward. The most common setup is the low-volume pullback after a bullish/bearish change in behavior."
THE STOCK MARKET UPDATE (February 24, 2013)
I inspired from his sentences and made this script.
Its Main feature is to identify the largest wave in Weis wave and advantageous trading opportunities.
█ Features
This indicator includes several features related to the Weis Wave Method.
They help you analyze which is more bullish or bearish.
Highlight Max Wave Value (single direction)
Highlight Abnormal Max Wave Value (both directions)
Support and Resistance zone
Signals and Setups
█ Usage
Weis wave indicator displays cumulative volume for each wave.
Wave volume is effective when analyzing volume from VSA (Volume Spread Analysis) perspective.
The basic idea of Weis wave is large wave volume hint trend direction. This helps identify proper entry point.
This indicator highlights max wave volume and displays the signal and then proper Risk Reward Ratio entry frame.
I defined Change in Behavior as max wave volume (single direction).
Pullback is next wave that does not exceed the starting point of CiB wave (LH sell entry, HL buy entry).
Change in Behavior Signal ○ appears when pullback is determined.
Change in Behavior Setup (Entry frame) appears when condition of Min/Max Pullback is met and follow through wave breaks end point of CiB wave.
This indicator has many other features and they can also help a user identify potential levels of trade entry and which is more bullish or bearish.
In the screenshot below we can see wave volume zones as support and resistance levels. SOT and large wave volume /delta price (yellow colored wave text frame) hint stopping action.
█ Settings
Explains the main settings.
-- General --
Wave size : Allows the User to select wave size from ① Fixed or ② ATR. ② ATR is Factor x ATR(Length).
Display : Allows the User to select how many wave text and zigzag appear.
-- Wave Type --
Wave type : Allows the User to select from Volume or Volume and Time.
Wave Volume / delta price : Displays Wave Volume / delta price.
Simplified value : Allows the User to select wave text display style from ① Divisor or ② Normalized. Normalized use SMA.
Decimal : Allows the User to select the decimal point in the Wave text.
-- Highlight Abnormal Wave --
Highlight Max Wave value (single direction) : Adds marks to the Wave text to highlight the max wave value.
Lookback : Allows the User to select how many waves search for the max wave value.
Highlight Abnormal Wave value (both directions) : Changes wave text size, color or frame color to highlight the abnormal wave value.
Lookback : Allows the User to select SMA length to decide average wave value.
Large/Small factor : Allows the User to select the threshold large wave value and small wave value. Average wave value is 1.
delta price : Highlights large delta price by large wave text size, small by small text size.
Wave Volume : Highlights large wave volume by yellow colored wave text, small by gray colored.
Wave Volume / delta price : highlights large Wave Volume / delta price by yellow colored wave text frame, small by gray colored.
-- Support and Resistance --
Single side Max Wave Volume / delta price : Draws dashed border box from end point of Max wave volume / delta price level.
Single side Max Wave Volume : Draws solid border box from start point of Max wave volume level.
Bias Wave Volume : Draws solid border box from start point of bias wave volume level.
-- Signals --
Bias (Wave Volume / delta price) : Displays Bias mark when large difference in wave volume / delta price before and after.
Ratio : Decides the threshold of become large difference.
3Decrease : Displays 3D mark when a continuous decrease in wave volume.
Shortening Of the Thrust : Displays SOT mark when a continuous decrease in delta price.
Change in Behavior and Pullback : Displays CiB mark when single side max wave volume and pullback.
-- Setups --
Change in Behavior and Pullback and Breakout : Displays entry frame when change in behavior and pullback and then breakout.
Min / Max Pullback : Decides the threshold of min / max pullback.
If you need more information, please read the indicator's tooltip.
█ Conclusion
Weis Wave is powerful interpretation of volume and its tell us potential trend change and entry point which can't find without weis wave.
It's not the holy grail, but improve your chart reading skills and help you trade rationally (at least from VSA perspective).