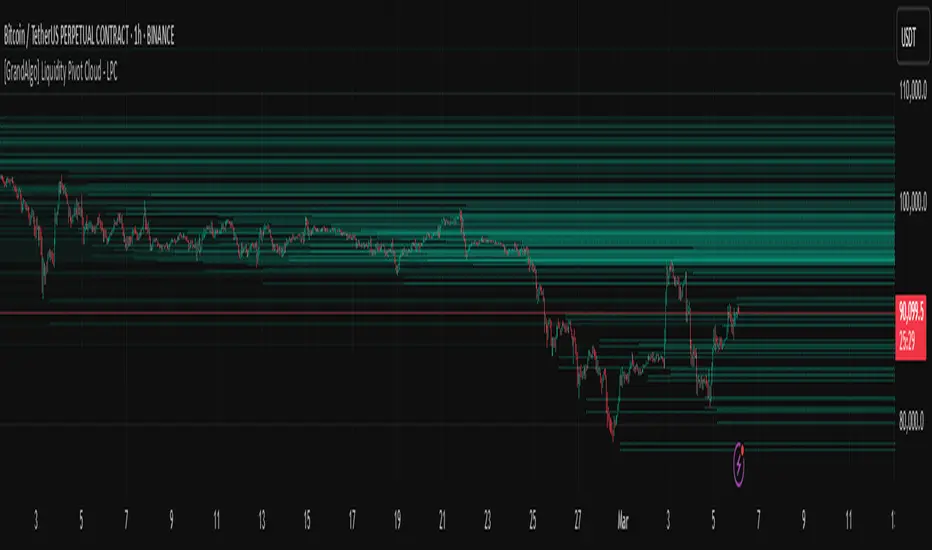
[GrandAlgo] Liquidity Pivot Cloud - LPCLiquidity Pivot Cloud (LPC) is a visualization tool that extends all pivot levels to the right, creating a structured liquidity map across the chart. Instead of treating pivot points as static levels, LPC transforms them into a dynamic cloud, highlighting key areas where price has historically reacted.
Key Features:
Extended Pivot Levels – Automatically stretches all pivot highs and lows, forming a continuous liquidity zone.
Clear Structure – Provides an organized view of price action, making it easy to identify reaction zones.
Dynamic Liquidity Map – Helps traders spot potential liquidity sweeps and areas of price absorption.
How to Use:
Identify Liquidity Zones – Areas with multiple overlapping pivots signal strong liquidity pools.
Look for Reactions – Price often consolidates, wicks, or reverses around extended pivot clouds.
Combine with Confluence – Use alongside Fair Value Gaps, Institutional Price Blocks, or Market Structure shifts for higher probability setups.
LPC aligns with smart money concepts by revealing key liquidity areas where stop hunts, liquidity grabs, and institutional activity are likely to occur. It helps traders see where price is likely to be drawn before a major move, making it a valuable tool for those trading liquidity-based strategies.
ابحث في النصوص البرمجية عن "sweep"
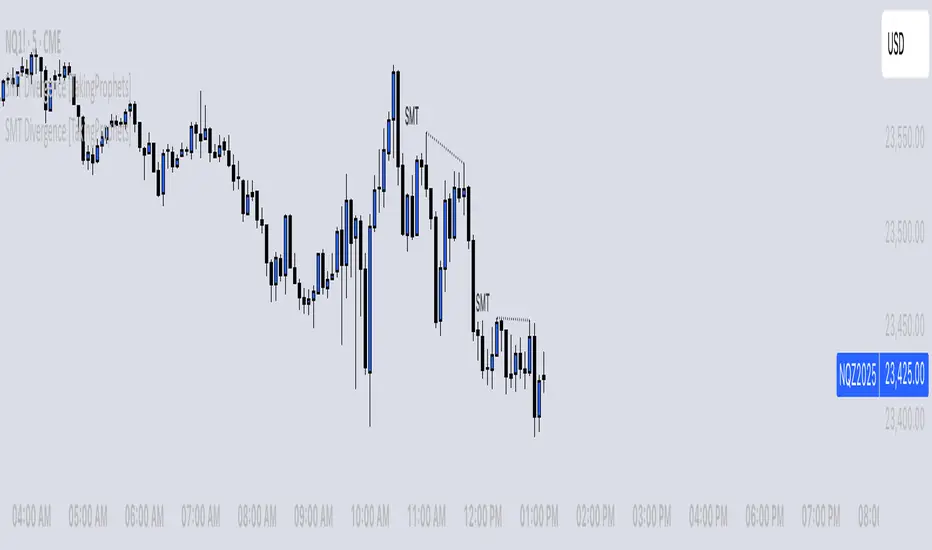
SMT Divergence [TakingProphets]The SMT (Smart Money Technique) Divergence indicator identifies potential market manipulation and smart money footprints by comparing price action between correlated instruments. It uses a dual-detection system to catch both frequent local SMTs and larger structural SMTs:
• Primary detection uses a shorter lookback period (default 5) to identify common SMT patterns
• Secondary detection uses a longer lookback period (default 8) to catch larger structural SMTs
• Automatically filters significant moves to prevent noise
• Labels are placed clearly outside of price action for better visibility
• Toggle between showing all SMTs or only significant liquidity sweeps
Compare any two instruments to spot divergences in their price action. Particularly useful for:
- Futures vs Spot markets
- Related currency pairs
- Index vs its components
- Any correlated instruments
Default settings are optimized for intraday trading but can be adjusted for different timeframes.
Note: This indicator works best when comparing closely correlated instruments and should be used alongside other technical analysis tools.
Reversal rehersal v1This indicator was designed to identify potential market reversal zones using a combination of RSI thresholds (shooting range/falling range), candlestick patterns, and Fair Value Gaps (FVGs). By combining all these elements into one indicator, it allow for outputting high probability buy/sell signals for use by scalpers on low timeframes like 1-15 mins, for quick but small profits.
Note: that this has been mainly tested on DE40 index on the 1 min timeframe, and need to be adjusted to whichever timeframe and symbol you intend to use. Refer to the backtester feature for checking if this indicator may work for you.
The indicator use RSI ranges from two timeframes to highlight where momentum is building up. During these areas, it will look for certain candlestick patterns (Sweeps as the primary one) and check for existance of fair value gaps to further enhance the hitrate of the signal.
The logic for FVG detection was based on ©pmk07's work with MTF FVG tiny indicator. Several major changes was implemented though and incorporated into this indicator. Among these are:
Automatically adjustments of FVG boxes when mitigated partially and options to extend/cull boxes for performance and clarity.
Backtesting Table (Experimental):
This indicator also features an optional simplified table to review historical theoretical performance of signals, including win rate, profit/loss, and trade statistics. This does not take commision or slippage into consideration.
Usage Notes:
Setup:
1. Add the indicator to your chart.
2. Decide if you want to use Long or Short (or both).
3. If you're scalping on ie. 1 min time frame, make sure to set FVG's to higher timeframes (ie. 5, 15, 60).
4. Enable the 'Show backtest results' and adjust the 'Signals' og 'Take profit' and 'Stop loss' values until you are satisfied with the results.
Use:
1. Setup an alert based on either of the 'BullishShooting range' or 'BearishFalling range' alerts. This will draw your attention to watch for the possible setups.
2. Verify if there's a significant imbalance prior to the signal before taking the trade. Otherwise this may invalidate the setup.
3. Once a signal is shown on the graph (either Green arrow up for buys/Red arrow down for sells) - you should enter a trade with the given 'Take profit' and 'Stop loss' values.
4. (optional) Setup an alert for either the Strong/Weak signals. Which corresponds to when one of the arrows are printed.
Important: This is the way I use it myself, but use at own risk and remember to combine with other indicators for further confluence. Remember this is no crystal ball and I do not guarantee profitable results. The indicator merely show signals with high probability setups for scalping.

Time-Based VWAP (TVWAP)(TVWAP) Indicator
The Time-Based Volume Weighted Average Price (TVWAP) indicator is a customized version of VWAP designed for intraday trading sessions with defined start and end times. Unlike the traditional VWAP, which calculates the volume-weighted average price over an entire trading day, this indicator allows you to focus on specific time periods, such as ICT kill zones (e.g., London Open, New York Open, Power Hour). It helps crypto scalpers and advanced traders identify price deviations relative to volume during key trading windows.
Key Features:
Custom Time Interval:
You can set the exact start and end times for the VWAP calculation using input settings for hours and minutes (24-hour format).
Ideal for analyzing short, high-liquidity periods.
Dynamic Accumulation of Price and Volume:
The indicator resets at the beginning of the specified session and accumulates price-volume data until the end of the session.
Ensures that the TVWAP reflects the weighted average price specific to the chosen session.
Visual Representation:
The indicator plots the TVWAP line only during the specified time window, providing a clear visual reference for price action during that period.
Outside the session, the TVWAP line is hidden (na).
Use Cases:
ICT Scalp Trading:
Monitor price rebalances or potential liquidity sweeps near TVWAP during important trading sessions.
Mean Reversion Strategies:
Detect pullbacks toward the session’s average price for potential entry points.
Breakout Confirmation:
Confirm price direction relative to TVWAP during kill zones or high-volume times to determine if a breakout is supported by volume.
Inputs:
Start Hour/Minute: The time when the TVWAP calculation starts.
End Hour/Minute: The time when the TVWAP calculation ends.
Technical Explanation:
The indicator uses the timestamp function to create time markers for the session start and end.
During the session, the price-volume (close * volume) is accumulated along with the total volume.
TVWAP is calculated as:
TVWAP = (Sum of (Price × Volume)) ÷ (Sum of Volume)
Once the session ends, the TVWAP resets for the next trading period.
Customization Ideas:
Alerts: Add notifications when the price touches or deviates significantly from TVWAP.
Different Colors: Use different line colors based on upward or downward trends.
Multiple Sessions: Add support for multiple TVWAP lines for different time periods (e.g., London + New York).

[DarkTrader] Pivot Point HeatmapThe indicator calculates pivot points using price data from different timeframes such as 12M, 1M, 1W, 3D, and 1D. For each timeframe, it retrieves the high, low, open, and close prices of the previous bar. The pivot point is calculated as the average of the high, low, and close prices, which provides a central level where market sentiment may shift. This calculation is repeated for each timeframe, ensuring a multi-dimensional view of potential interest zones.
Importance of Pivot Points :
Pivot points are essential tools in technical analysis, providing traders with levels that act as potential support and resistance zones. These zones help identify price levels where reversals or breakouts are more likely to occur.
Visual Representation :
The core feature of this indicator is its ability to visualize pivot points as a heatmap on the chart. Instead of showing just the latest pivot points, it tracks the historical pivot swipe, providing a dynamic view of how price interacts with these key levels. Each pivot point is represented by a line, color-coded based on its position relative to other points, creating a gradient effect that highlights the most critical price areas.
Customization Options :
Traders can customize various aspects of the heatmap to suit their preferences. The indicator offers options to toggle pivot swipe history, enabling traders to either focus on the most recent price interactions or consider how price has behaved over time. The background color and pivot line colors are fully customizable, making it easy to match the heatmap with your chart's theme or emphasize certain price levels.
Detecting Sweeps and Price Interaction :
Another important feature is the detection of price interactions with pivot levels. If the current bar's high and low cross a pivot point, it signals that the pivot level has been "swept" by price action, potentially indicating a change in market sentiment. The indicator either extends the line if the pivot point remains relevant or deletes it if price has broken through. This dynamic adjustment helps traders stay updated on which pivot levels are still valid.

Macro Times [Blu_Ju]About ICT Macro Times:
The Inner Circle Trader (ICT) has taught that there are certain time sessions when the Interbank Price Delivery Algorithm (IPDA) is running a macro. The macro itself could be a repricing macro, a consolidation macro, etc. - this depends on where price currently is in relation to its draw. The times the macro is active do not change however, and are always the following (in New York local time):
8:50-9:10 (premarket macro)
9:50-10:10 (AM macro 1)
10:50-11:10 (AM macro 2)
11:50-12:10 (lunch macro)
13:10-13:40 (PM macro)
15:15-15:45 (final hour macro)
Because these times are fixed, traders can anticipate a setup is likely to form in or around these sessions. Setups may involve sweeps of liquidity (highs/lows), repricing to inefficiencies (e.g., fair value gaps), breaker setups, etc. (The specific setup involved is beyond the scope of this script; this script is concerned with visually marking the time sessions only.)
About this Script:
The scope of this script is to visually identify the macro active time sessions. This script draws vertical lines to mark the start and end of the macro time sessions. Optionally, the user can use a background color for the macro session with or without the vertical lines. The user can also toggle on or off any of the macro sessions, if he or she is only interested in certain ones. The user also has the freedom to change the times of the macro sessions if he or she is interested in a different time.
What makes this script unique is that it plots the macro time sessions after midnight for each day, before the real-time bar reaches the macro times. This is advantageous to the trader, as it gives the trader a visual cue that the macro times are approaching. When watching price it is easy to lose track of time, and the purpose of this script is to help the trader maintain where price is in relation to the macro time sessions in a simple, visual way.

Smart Money Setup 06 [TradingFinder] Liquidity Sweeps + OB Swing🔵 Introduction
Smart Money, managed by large investors, injects significant capital into financial markets by entering real capital markets.
Capital entering the market by this group of individuals is called smart money. Traders can profit from financial markets by following such individuals.
Therefore, smart money can be considered one of the effective methods for analyzing financial markets.
Sometimes, before a market movement, fluctuation movements that create price movement cause many traders' "Stop Loss" to be triggered. These movements are created in various patterns.
One of these patterns is similar to an "Expanding Triangle", which touches the stop loss of individuals who have placed their stop loss in the cash area in the form of 5 consecutive openings.
To better understand this setup, pay attention to the images below.
Bullish Setup Details :
Bearish Setup Details :
🔵 How to Use
After adding the indicator to the chart, wait for trading opportunities to appear. By changing the "Time Frame" and "Pivot Period", you can see different trading positions.
In general, the smaller the "Time Frame" and "Pivot Period", the more likely trading opportunities will appear.
Bullish Setup Details on Chart :
Bearish Setup Details on Chart :
🔵 Settings
You have access to "Pivot Period", "Order Block Refine", and "Refine Mode" through settings.
By changing the "Pivot Period", you can change the range of zigzag that identifies the setup.
Through "Order Block Refine", you can specify whether you want to refine the width of the order blocks or not. It is set to "On" by default.
Through "Refine Mode", you can specify how to improve order blocks.
If you are "risk-averse", you should set it to "Defensive" mode because in this mode, the width of the order blocks decreases, the number of your trades decreases, and the "reward-to-risk ratio "increases.
If you are on the opposite side and are "risk-taker", you can set it to "Aggressive" mode. In this mode, the width of the order blocks increases, and the likelihood of losing positions decreases.

ICT Concept [TradingFinder] Order Block | FVG | Liquidity Sweeps🔵 Introduction
The "ICT" style is one of the subsets of "Price Action" technical analysis. ICT is a method created by "Michael Huddleston", a professional forex trader and experienced mentor. The acronym ICT stands for "Inner Circle Trader".
The main objective of the ICT trading strategy is to combine "Price Action" and the concept of "Smart Money" to identify optimal entry points into trades. However, finding suitable entry points is not the only strength of this approach. With the ICT style, traders can better understand price behavior and adapt their trading approach to market structure accordingly.
Numerous concepts are discussed in this style, but the key practical concepts for trading in financial markets include "Order Block," "Liquidity," and "FVG".
🔵 How to Use
🟣Order Block
Order blocks are a specific type of "Supply and Demand" zones formed when a series of orders are placed in a block. These orders could be created by banks or other major players. Banks typically execute large orders in blocks during their trading sessions. If they were to enter the market directly with a small quantity, significant price movements would occur before the orders are fully executed, resulting in less profit. To avoid this, they divide their orders into smaller, manageable positions. Traders should look for "buy" opportunities in "demand order blocks" areas and "sell" opportunities in "supply order blocks".
🟣Liquidity
These levels are where traders aim to exit their trades. "Market Makers" or smart money usually collects or distributes their trading positions near levels where many retail traders have placed their "Stop Loss" orders. When the liquidity resulting from these losses is collected, the price often reverses direction.
A "Stop Hunt" is a move designed to neutralize liquidity generated by triggered stop losses. Banks often use significant news events to trigger stop hunts and acquire the liquidity released in the market. If, for example, they intend to execute heavy buy orders, they encourage others to sell through stop hunts.
As a result, if there is liquidity in the market before reaching the order block region, the credibility of that order block is higher. Conversely, if liquidity is near the order block, meaning the price reaches the order block before reaching the liquidity area, the credibility of that order block is lower.
🟣FVG (Fair Value Gap)
To identify the "Fair Value Gap" on the chart, one must analyze candle by candle. Focus on candles with large bodies, examining one candle and the one before it. The candles before and after this central candle should have long shadows, and their bodies should not overlap with the body of the central candle. The distance between the shadows of the first and third candles is called the FVG range.
These zone function in two ways :
•Supply and Demand zone: In this case, the price reacts to these zone, and its trend reverses.
•Liquidity zone: In this scenario, the price "fills" the zone and then reaches the order block.
Important Note: In most cases, FVG zone with very small width act as supply and demand zone, while zone with a significant width act as liquidity zone, absorbing the price.
🔵 Setting
🟣Order Block
Refine Order Block : When the option for refining order blocks is Off, the supply and demand zones encompass the entire length of the order block (from Low to High) in their standard state and remain unaltered. On the option for refining order blocks triggers the improvement of supply and demand zones using the error correction algorithm.
Refine Type : The enhancement of order blocks via the error correction algorithm can be executed through two methods: Defensive and Aggressive. In the Aggressive approach, the widest possible range is taken into account for order blocks.
Show High Levels : If major high levels are to be displayed, set the option for showing high level to Yes.
Show Low Levels : If major low levels are to be displayed, set the option for showing low level to Yes.
Show Last Support : If showing the last support is desired, set the option for showing last support to Yes.
Show Last Resistance : If showing the last resistance is desired, set the option for showing last resistance to Yes.
🟣 FVG
FVG Filter : When FVG filtering is activated, the number of FVG areas undergoes filtration based on the specified algorithm.
FVG Filter Types :
1. Very Aggressive : Apart from the initial condition, an additional condition is introduced. For an upward FVG, the maximum price of the last candle should exceed the maximum price of the middle candle. Similarly, for a downward FVG, the minimum price of the last candle should be lower than the minimum price of the middle candle. This mode eliminates a minimal number of FVGs.
2. Aggressive : In addition to the conditions of the Very Aggressive mode, this mode considers the size of the middle candle; it should not be small. Consequently, a larger number of FVGs are eliminated in this mode.
3. Defensive : Alongside the conditions of the Very Aggressive mode, this mode takes into account the size of the middle candle, which should be relatively large with the majority of it comprising the body. Furthermore, to identify upward FVGs, the second and third candles must be positive, whereas for downward FVGs, the second and third candles must be negative. This mode filters out a considerable number of FVGs, retaining only those of suitable quality.
4. Very Defensive : In addition to the conditions of the Defensive mode, the first and third candles should not be very small-bodied doji candles. This mode filters out the majority of FVGs, leaving only the highest quality ones. Show Demand FVG: Enables the display of demand-related boxes, which can be toggled between off and on. Show Supply FVG: Enables the display of supply-related boxes along the path, which can also be toggled between off and on.
🟣 Liquidity
Statics Liquidity Line Sensitivity : A value ranging from 0 to 0.4. Increasing this value reduces the sensitivity of the "Statics Liquidity Line Detection" function and increases the number of identified lines. The default value is 0.3.
Dynamics Liquidity Line Sensitivity : A value ranging from 0.4 to 1.95. Increasing this value enhances the sensitivity of the "Dynamics Liquidity Line Detection" function and decreases the number of identified lines. The default value is 1.
Statics Period Pivot : Default value is set to 8. By adjusting this value, you can specify the period for static liquidity line pivots.
Dynamics Period Pivot : Default value is set to 3. By adjusting this value, you can specify the period for dynamic liquidity line pivots.
You can activate or deactivate liquidity lines as necessary using the buttons labeled "Show Statics High Liquidity Line," "Show Statics Low Liquidity Line," "Show Dynamics High Liquidity Line," and "Show Dynamics Low Liquidity Line".

Consecutive Unswept Lower Highs/ Higher Lows CounterCounts consecutive Lower Highs and Higher Lows; number resets to zero when previous pivot high or low gets swept
-To help give an idea of when a retracement / run-on-stops may be overdue. i.e. the higher the counter number grows, the longer we've gone without a proper retracement.
//inputs//
~pivot lookback/lookforward: increase this for more significant pivot highs and lows.
~number of pivot high 'counter' labels (pairs) to show in history.
~formatting options.

Mark Structure ShdwMark Structure Show is building the market swing structure, minor and sub structure and marks all possible insignificant pivots
This indicator is the alternative version of Mark Structure indicator, I had to create another indicator in order to avoid programming limitation of TreadingView.
This version uses confirmation approach as confirming by body, it means every swing low/high is confirmed when the body (of newly creating swing low/high correspondingly) takes place and intercepts it. the same behaviour is with breaking structure its confirmed only by body.
From trading prospective with this kind of approach we can easily detect manipulations (caused by sweeps) and disregard those manipulation as elements which are breaking the structure. so its extremely useful for those who are trading smart money price actions and basing on swing structure POI
it supports:
- Marking all pivots with labels or join them continuously with trend lines.
- Marking minor and sub structured swings with labels or join them continuously with trend lines. Marking last actual CHoCH and BOS. Minor and substructure are structures inside swing structure and it can differ from the structure of lower timeframe
- Marking swings of swing structure with labels or join them continuously with trend lines.
- Changing bullish and bearish colors of each kind of structures
- Changing pivot labelings
- Changing colors
Remarks:
- Don't expect to have minor and sub structure in each swing waves, its totally fine when you don't have them at all
- Swing structure is the most significant structure and shows real price direction.
- The last swing is not able to be confirmed it tries to build 2 swings that most likely would be either substructure or SMS BOS

DOJI FU IndicatorIndicator is designed to paint a doji, the size of which can be adjusted in settings.
Provided there is a valid doji, the following candle is a 'FU candle' or an 'Institution' candle. This candle wicks above/below the doji and takes liquidity from above or below.
Colours can be changed
Red = Doji candle
Yellow = FU candle
Example shown on the 1hr chart, red doji indicating a change of trend upwards, the FU candle (yellow) takes liquidity from above and sweeps down.

[blackcat] L1 Ehlers Phasor IndicatorLevel: 1
Background
This script was requested by @pips_v1. "A cycle is one market characteristic that can be scientifically measured. Although they can be measured, they are still maddening because they are in essence ephemeral; they come and they go. Our recent research, however, indicates there is a fundamental cycle parameter that leads us to the correct trading strategy for any current market mode." by John Ehlers
Function
John Ehlers describe the principle of phasor indicator as "One easy way to picture a cycle is as an indicator arrow bolted to a rotating shaft, as can be seen in a phasor diagram. Each time the arrowhead sweeps through one complete rotation, a cycle is completed. The phase increases uniformly throughout the cycle. The phase continues for the next cycle but is usually drawn as reset to zero to start the next cycle." The parameter we use is the phase of the cycle. The measured phase tells us with great sensitivity when we are in the trend mode, enabling the capture of a large fraction of the trend movement.
Key Signal
Phase --> Ehlers Phasor signal
Pros and Cons
100% John F. Ehlers definition translation of his publications, even variable names are the same. This help readers who would like to use pine to read his book.
Remarks
The 102th script for Blackcat1402 John F. Ehlers Week publication.
Readme
In real life, I am a prolific inventor. I have successfully applied for more than 60 international and regional patents in the past 12 years. But in the past two years or so, I have tried to transfer my creativity to the development of trading strategies. Tradingview is the ideal platform for me. I am selecting and contributing some of the hundreds of scripts to publish in Tradingview community. Welcome everyone to interact with me to discuss these interesting pine scripts.
The scripts posted are categorized into 5 levels according to my efforts or manhours put into these works.
Level 1 : interesting script snippets or distinctive improvement from classic indicators or strategy. Level 1 scripts can usually appear in more complex indicators as a function module or element.
Level 2 : composite indicator/strategy. By selecting or combining several independent or dependent functions or sub indicators in proper way, the composite script exhibits a resonance phenomenon which can filter out noise or fake trading signal to enhance trading confidence level.
Level 3 : comprehensive indicator/strategy. They are simple trading systems based on my strategies. They are commonly containing several or all of entry signal, close signal, stop loss, take profit, re-entry, risk management, and position sizing techniques. Even some interesting fundamental and mass psychological aspects are incorporated.
Level 4 : script snippets or functions that do not disclose source code. Interesting element that can reveal market laws and work as raw material for indicators and strategies. If you find Level 1~2 scripts are helpful, Level 4 is a private version that took me far more efforts to develop.
Level 5 : indicator/strategy that do not disclose source code. private version of Level 3 script with my accumulated script processing skills or a large number of custom functions. I had a private function library built in past two years. Level 5 scripts use many of them to achieve private trading strategy.

eBacktesting - Learning: InducementeBacktesting - Learning: Inducement
Inducement is the “trap” move that often shows up right before a real push. Price briefly takes an internal swing level (a small high/low), pulls traders in the wrong direction, and then snaps back — usually right before continuing toward the larger objective.
How to study it:
- First, get a simple trend bias (are we making higher highs/higher lows, or lower highs/lower lows?).
- Watch the most recent internal swing level inside that trend.
- An inducement often looks like a quick sweep through that internal level, followed by a close back on the “correct” side.
These indicators are built to pair perfectly with the eBacktesting extension, where traders can practice these concepts step-by-step. Backtesting concepts visually like this is one of the fastest ways to learn, build confidence, and improve trading performance.
Educational use only. Not financial advice.

SMC + Dual UT Bot buy and sell AlertsMise a jour avec un EMA 20/50 et vwap
his script is a composite indicator for TradingView (Pine Script v5) that merges Smart Money Concepts (SMC) with a Dual-instance UT Bot. It has been styled with a high-contrast "Neon Cyberpunk" theme (Cyan/Pink) and is fully compliant with the CC BY-NC-SA 4.0 license.
Here is a breakdown of its two main components:
1. Smart Money Concepts (SMC)
This portion, originally by LuxAlgo, is designed to identify institutional price levels and structural market shifts. It provides a detailed map of market structure rather than simple entry/exit signals.
Market Structure (BOS & CHoCH):
BOS (Break of Structure): Marks trend continuation (e.g., breaking a higher high in an uptrend).
CHoCH (Change of Character): Marks potential trend reversals (e.g., the first time a higher low is broken in an uptrend).
Order Blocks (OB):
Highlights specific candles where institutional buying or selling likely occurred. These act as high-probability support/resistance zones.
Neon Blue/Cyan for Bullish OBs.
Neon Pink for Bearish OBs.
Fair Value Gaps (FVG):
Identifies imbalances (gaps) in price action where the market often returns to "fill" orders.
Neon Mint for Bullish FVGs.
Neon Red for Bearish FVGs.
Premium/Discount Zones: Automatically plots the range equilibrium (50% level) to help you buy in "Discount" (low) and sell in "Premium" (high) areas.
Liquidity (EQH/EQL): Automatically detects "Equal Highs" and "Equal Lows," which are magnets for price as they represent liquidity pools (stop losses).
2. Dual UT Bot Alerts
This portion provides the actual Entry Signals. It runs two separate instances of the "UT Bot" strategy simultaneously with different sensitivity settings to filter noise.
Instance 1 (Buy Only):
Settings: Key Value = 4, ATR Period = 10 (Faster, more sensitive).
Visual: Plots a Neon Cyan "Buy" label.
Function: Looks for bullish reversals earlier to catch the start of a move.
Instance 2 (Sell Only):
Settings: Key Value = 7, ATR Period = 20 (Slower, smoother).
Visual: Plots a Neon Pink "Sell" label.
Function: Uses a wider ATR band to avoid getting shaken out of shorts too early, focusing on major downtrends.
How to Use It
The strength of this script is confluence.
Wait for a Signal: Look for a UT Bot "Buy" or "Sell" tag.
Confirm with SMC: Check if the signal aligns with SMC concepts.
Example Buy: Did the UT Bot give a "Buy" signal while price was bouncing off a Bullish Order Block?
Example Buy: Did price just sweep Liquidity (EQL) before the Buy signal?
Example Sell: Is the "Sell" signal happening inside a Premium Zone or a Bearish Fair Value Gap?
avant-hier
Notes de version
1. "Pro" Badge Buy/Sell Labels
The standard text signals have been replaced with modern, professional Badge Labels that provide more information at a glance.
Visuals: Instead of simple text, the script now uses label.new to create high-visibility badges.
BUY: A Neon Cyan badge with a Rocket icon (🚀).
SELL: A Neon Pink badge with a Chart icon (📉).
Price Details: Each badge displays the exact Entry Price directly on the label.
Tooltips: If you hover your mouse over a Buy or Sell badge, a tooltip will appear showing the exact Take Profit (TP) and Stop Loss (SL) prices calculated for that trade.
2. Dynamic Take Profit (TP)
The script now automatically calculates a profit target for every trade the moment a signal is generated.
Calculation: It measures the distance between your Entry Price and the initial Stop Loss (the ATR Trailing Stop).
Risk:Reward: It multiplies that distance by your chosen Risk:Reward Ratio (default is 1.5) to project a TP target.
Visual Line: A Green Line is drawn on the chart at the TP level. It remains active until price hits it or the stop loss.
3. Active Trailing Stop Loss (SL)
The Stop Loss is no longer static; it is now "alive" and manages the trade for you.
Trailing Logic: If Use Trailing SL? is enabled (default), the SL line will automatically move up (for longs) or move down (for shorts) as the trend continues in your favor. It locks in profit by following the UT Bot's ATR trailing band.
Visual Line: A Red Line is drawn at the SL level. You can see it physically step up or down on the chart as the trend progresses.
4. Real-Time Trade Simulation
The script now simulates the lifecycle of a trade directly on the chart:
Active State: When a trade is live, the TP and SL lines extend to the right of the current candle (bar_index + 1), showing you exactly where your exit points are in real-time.
Closed State: Once the price hits either the Green TP line or the Red SL line, the script detects the "Exit." The lines stop extending and turn dotted, indicating that the trade is closed and waiting for the next signal.
Summary of New Settings
You will find a new group in the settings panel called "UT Bot: Trade Management":
TP Risk:Reward Ratio: Adjust this to change how far the Green TP line is placed (e.g., set to 2.0 for 2x return).
Use Trailing SL?: Uncheck this if you want the Red SL line to stay fixed at the initial entry risk level.
avant-hier
Notes de version
1. Live Strategy Performance Dashboard (Backtester)
Since this is an indicator, TradingView does not automatically calculate PnL (Profit and Loss). I have built a custom Simulation Engine inside the script that tracks every UT Bot signal as if you had taken the trade.
Location: Bottom Right of your chart.
Win Rate: Displays the percentage of trades that hit the Take Profit target versus the Stop Loss.
Trades (W/L): Shows the total number of signals generated, broken down by Wins and Losses.
Net Profit (R): Calculates your theoretical profit in "R-Multiples" (Risk Units).
Example: If you set your Risk:Reward to 2.0, every win adds +2R, and every loss subtracts -1R.
Dynamic Colors: The Win Rate and Profit cells turn Neon Cyan if positive (>50% or >0R) and Neon Pink if negative.
2. Multi-Timeframe Trend Dashboard
A new panel at the Top Right gives you an instant "Market Bias" reading so you don't have to scan the whole chart.
SMC Trend: Reads the Smart Money structure (Break of Structure/Change of Character) to determine if the high-level timeframe is BULLISH or BEARISH.
UT Bot Status: Displays the current active signal state:
BUY (Active): You are currently in a Long trade.
SELL (Active): You are currently in a Short trade.
NEUTRAL: No active signal or the last trade hit TP/SL.
3. Integrated Alert System
I have connected the visual lines to the alert system. You can now set a single alert on this indicator, and it will trigger for:
Entry Signals: "UT Long Entry" / "UT Short Entry"
Exits: "Take Profit Hit" / "Stop Loss Hit"
4. Consolidated Settings
To make the script easier to manage, I organized the settings into clear groups:
Dashboards: Toggle the visibility of the new panels or move the Performance Panel to a different corner.
UT Bot: Trade Management: Quickly adjust your Risk:Reward Ratio (e.g., change from 1.5 to 2.0) to see how it affects your Win Rate in real-time on the dashboard.
avant-hier
Notes de version
1. Multi-Timeframe (MTF) Trend Scanner
I have replaced the basic "Market Bias" panel with a comprehensive MTF Trend Dashboard located at the Top Right of your chart.
What it tracks: It simultaneously monitors the trend direction on 5 distinct timeframes:
15 Minute
1 Hour
4 Hour
Daily
Weekly
How it works: It runs a background calculation (using UT Bot settings Key=5, ATR=15) on these higher timeframes without you needing to switch charts.
Visuals:
BULLISH: Highlighted in Neon Cyan.
BEARISH: Highlighted in Neon Pink.
2. Strategic Confluence (How to use it)
This new dashboard transforms the script from a simple "signal generator" into a complete trading system by allowing you to filter trades based on the bigger picture.
The "All-Green" Rule: If you are scalping on a 5-minute chart and you get a BUY signal, check the dashboard. If the 1H, 4H, and Daily are all Neon Cyan (Bullish), that trade has a significantly higher probability of success.
Avoid Counter-Trend Trades: If your main chart says BUY, but the dashboard shows the 4H and Daily are Neon Pink (Bearish), you are trading against the major trend. You might want to skip that trade or reduce your risk size.
3. Summary of Dashboards
You now have two professional-grade panels on your screen:
Bottom Right (Performance): Shows the past results of the strategy on your current timeframe (Win Rate, Profit Factor).
Top Right (Trend): Shows the current state of the market across all timeframes.

eBacktesting - Learning: Equal Highs & LowseBacktesting - Learning: Equal Highs & Lows helps you spot Equal Highs (EQH) and Equal Lows (EQL) — price areas where the market has paused or reacted multiple times at nearly the same level.
These zones often act like “magnets” because many traders place stops and pending orders around them. When price returns, it can lead to a quick grab (a sweep) and reversal, or it can break through and continue. Learning to recognize EQH/EQL can improve your timing, help you anticipate where volatility may appear, and give you clearer areas for invalidation and targets.
These indicators are built to pair perfectly with the eBacktesting extension, where traders can practice these concepts step-by-step. Backtesting concepts visually like this is one of the fastest ways to learn, build confidence, and improve trading performance.
Educational use only. Not financial advice.

SMC + Dual UT Bot buy and sell AlertsThis script is a composite indicator for TradingView (Pine Script v5) that merges Smart Money Concepts (SMC) with a Dual-instance UT Bot. It has been styled with a high-contrast "Neon Cyberpunk" theme (Cyan/Pink) and is fully compliant with the CC BY-NC-SA 4.0 license.
Here is a breakdown of its two main components:
1. Smart Money Concepts (SMC)
This portion, originally by LuxAlgo, is designed to identify institutional price levels and structural market shifts. It provides a detailed map of market structure rather than simple entry/exit signals.
Market Structure (BOS & CHoCH):
BOS (Break of Structure): Marks trend continuation (e.g., breaking a higher high in an uptrend).
CHoCH (Change of Character): Marks potential trend reversals (e.g., the first time a higher low is broken in an uptrend).
Order Blocks (OB):
Highlights specific candles where institutional buying or selling likely occurred. These act as high-probability support/resistance zones.
Neon Blue/Cyan for Bullish OBs.
Neon Pink for Bearish OBs.
Fair Value Gaps (FVG):
Identifies imbalances (gaps) in price action where the market often returns to "fill" orders.
Neon Mint for Bullish FVGs.
Neon Red for Bearish FVGs.
Premium/Discount Zones: Automatically plots the range equilibrium (50% level) to help you buy in "Discount" (low) and sell in "Premium" (high) areas.
Liquidity (EQH/EQL): Automatically detects "Equal Highs" and "Equal Lows," which are magnets for price as they represent liquidity pools (stop losses).
2. Dual UT Bot Alerts
This portion provides the actual Entry Signals. It runs two separate instances of the "UT Bot" strategy simultaneously with different sensitivity settings to filter noise.
Instance 1 (Buy Only):
Settings: Key Value = 4, ATR Period = 10 (Faster, more sensitive).
Visual: Plots a Neon Cyan "Buy" label.
Function: Looks for bullish reversals earlier to catch the start of a move.
Instance 2 (Sell Only):
Settings: Key Value = 7, ATR Period = 20 (Slower, smoother).
Visual: Plots a Neon Pink "Sell" label.
Function: Uses a wider ATR band to avoid getting shaken out of shorts too early, focusing on major downtrends.
How to Use It
The strength of this script is confluence.
Wait for a Signal: Look for a UT Bot "Buy" or "Sell" tag.
Confirm with SMC: Check if the signal aligns with SMC concepts.
Example Buy: Did the UT Bot give a "Buy" signal while price was bouncing off a Bullish Order Block?
Example Buy: Did price just sweep Liquidity (EQL) before the Buy signal?
Example Sell: Is the "Sell" signal happening inside a Premium Zone or a Bearish Fair Value Gap?

First 15 min of Each Hour First 15 Minutes of Each Hour – Background Highlighter
This indicator visually highlights the first 15 minutes of every hour by coloring the chart background. It is designed to help traders quickly identify key intraday time windows often associated with increased volatility, session opens, or strategy-specific execution periods.
The highlight automatically repeats every hour and adapts to the chart’s timeframe and timezone. It works best on intraday charts (1m, 3m, 5m, 15m), where precise time-based structure is important.
Key Features:
Automatically marks minutes 00–14 of every hour
Clean, non-intrusive background shading
Fully customizable color and transparency
No future bar repainting
Ideal for scalping, session-based, and time-window strategies
Use Cases:
Identifying opening volatility each hour
Time-based entries and confirmations
Liquidity sweep or breakout models
Algo execution timing visualization
This indicator does not generate trade signals. It is a visual time-management tool intended to improve clarity and discipline in intraday trading.

Liquidation Bubbles [OmegaTools]🔴🟢 Liquidation Bubbles — Advanced Volume & Price Stress Detector
Liquidation Bubbles is a professional-grade analytical tool designed to identify forced positioning events, stop-runs, and liquidation clusters by combining price displacement and volume imbalance into a single, statistically normalized framework.
This indicator is not a repainting signal tool and not a simple volume spike detector. It is a contextual market stress mapper, built to highlight areas where one-sided positioning becomes unstable and the probability of forced order execution (liquidations, stops, margin calls) materially increases.
---
## 🔬 Core Concept
Market liquidations do not occur randomly.
They emerge when price deviates aggressively from its volume-weighted equilibrium while volume itself becomes abnormal.
Liquidation Bubbles detects exactly this condition by:
* Estimating a **dynamic equilibrium price** using an *inverted volume-weighted moving average*
* Measuring **directional price stress** relative to that equilibrium
* Measuring **volume stress** relative to its own adaptive baseline
* Normalizing both into **Z-score–like metrics**
* Highlighting only **statistically extreme, asymmetric events**
The result is a clear visual map of stress points where market participants are most vulnerable.
---
⚙️ Methodology (How It Works)
1️⃣ Advanced Inverted VWMA (Equilibrium Engine)
The script uses a custom Advanced VWMA, where:
* High volume bars receive less weight
* Low volume bars receive more weight
This produces a **robust equilibrium level**, resistant to manipulation and volume bursts.
This equilibrium is used for **both price and volume normalization**, creating a consistent statistical framework.
---
2️⃣ Price Stress (Directional)
Price stress is calculated as:
* The **maximum deviation** between high/low and equilibrium
* Directionally signed (upside vs downside)
* Normalized by its own historical volatility
This allows the script to distinguish:
* Aggressive upside exhaustion
* Aggressive downside capitulation
---
3️⃣ Volume Stress
Volume stress is measured as:
* Deviation from volume equilibrium
* Normalized by historical volume dispersion
This filters out:
* Normal high-volume sessions
* Illiquid noise
And isolates abnormal participation imbalance.
---
4️⃣ Liquidation Logic
A liquidation event is flagged when:
* Both price stress and volume stress exceed adaptive thresholds
* The imbalance is directional and statistically extreme
Optional Combined Score Mode allows aggregation of price & volume stress into a single composite metric for smoother signals.
---
🔵 Bubble System (Signal Hierarchy)
The indicator plots **two tiers of bubbles**:
🟢🔴 Small Bubbles
* Early warning stress points
* Localized stop-runs
* Micro-liquidations
* Often precede reactions or short-term reversals
🟢🔴 Big Bubbles
* Full liquidation clusters
* Forced unwinds
* High probability exhaustion zones
* Frequently align with:
* Intraday extremes
* Range boundaries
* Reversal pivots
* Volatility expansions
Bubble color:
* **Green** → Downside liquidation (sell-side exhaustion)
* **Red** → Upside liquidation (buy-side exhaustion)
Bubble placement is **ATR-adjusted**, ensuring visual clarity without overlapping price.
---
🔄 Cross-Market Volume Analysis
The script allows optional **external volume sourcing**, enabling:
* Futures volume applied to CFDs
* Index volume applied to ETFs
* Spot volume applied to derivatives
This is critical when:
* Your traded instrument has unreliable volume
* You want **institutional-grade confirmation**
---
🧠 How to Use Liquidation Bubbles
This indicator is **not meant to be traded alone**.
Best use cases:
* 🔹 Confluence with support & resistance
* 🔹 Contextual confirmation for reversals
* 🔹 Identifying fake breakouts
* 🔹 Liquidity sweep detection
* 🔹 Risk management (avoid entering into liquidation zones)
Ideal for:
* Futures
* Indices
* Crypto
* High-liquidity FX pairs
* Intraday & swing trading
---
🎯 Who This Tool Is For
Liquidation Bubbles is designed for:
* Advanced discretionary traders
* Order-flow & liquidity-based traders
* Macro & index traders
* Professionals seeking **context**, not signals
If you want **where the market is fragile**, not just where price moved — this tool was built for you.
---
📌 Key Characteristics
✔ Non-repainting
✔ Statistically normalized
✔ Adaptive to volatility
✔ Works on all timeframes
✔ Futures & crypto ready
✔ No lagging indicators
✔ No moving average crosses
---
Liquidation Bubbles does not predict the future.
It shows you where the market is most likely to break.
— OmegaTools

Simple PDH / PDL Clean Entries (NZ Time)Simple PDH / PDL Liquidity Entry Indicator
This indicator is designed for clean, stress-free intraday trading on Gold. It identifies high-probability buy and sell opportunities based on a liquidity sweep and reclaim of the previous day’s high or low (PDH / PDL). Signals are limited to one trade per session using New Zealand time, helping prevent overtrading. Each signal prints a clear BUY or SELL icon directly on the candle, along with a concise label showing entry price, stop loss, and take profit. No indicators, no clutter — just key levels, disciplined execution, and institutional-style simplicity.

MindEdge 2-7am (utc +1)This indicator highlights the 2-7am time for me to trade the opposite direction of a m15 sweep

ATR Momentum StatusThis indicator measures whether volatility (ATR) is increasing or decreasing, and classifies momentum strength into four clear states:
- WEAK
- STRONG
- EXPANSION
- DECREASING
It helps traders avoid fake moves and only trade when real participation enters the market, especially when used together with FVG CE Acceptance (SMC).
ATR Momentum States (Very Important)
Status Meaning Market Condition
WEAK Small ATR increase Low participation
STRONG Healthy ATR increase Real buyers/sellers entering
EXPANSION Large ATR spike Aggressive momentum / breakout
DECREASING ATR falling Momentum dying / trap risk
What This Indicator Is NOT
❌ Not a buy/sell signal
❌ Not direction bias
❌ Not entry by itself
👉 It is a trade quality filter
✅ Best Use Case (SMC / FVG Traders)
This indicator shines when combined with:
- FVG
- CE (Consequent Encroachment)
- Liquidity Sweep
- Acceptance Candle
Important Risk Filter (Golden Rule):
ATR Status Trade Quality
EXPANSION + Acceptance ⭐⭐⭐⭐⭐ (Best)
STRONG + Acceptance ⭐⭐⭐⭐
WEAK + Acceptance ❌ Avoid
DECREASING ❌ No Trade
Why This Works (Conceptually):
- FVG CE acceptance = price is accepted
- ATR expansion = participation is real
- Together = institutional momentum, not retail noise

Chainbey Ai - Previous Day High & Low📌 Chainbey Ai – Previous Day High & Low (Source Candle)
This indicator automatically plots the Previous Day High (PDH) and Previous Day Low (PDL) on any intraday chart, starting from the exact candle where those levels were formed — not from the new day open. This removes visual gaps and gives a more accurate market structure view.
🔹 Key Features
✅ Accurate PDH & PDL levels based on the full previous trading day
🎯 Lines start from the actual high/low candle (no artificial gap)
🏷️ Optional PDH / PDL labels placed directly on source candles
🟦 Optional range background fill between PDH and PDL
📊 Works perfectly on 5m, 15m, 30m, 1H intraday charts
⚡ Lightweight, clean, and repaint-safe
🧠 Best Use Cases
Liquidity sweep & stop-hunt detection
Breakout vs fake-breakout analysis
Support / resistance from prior session
London & New York session bias confirmation
⚠️ Notes
Levels are calculated using the broker’s daily session
Designed for intraday trading, not daily/weekly charts

Auction Session Ranges (AMT Edition) [ Alerts] Auction Session Ranges (AMT Edition)
► Overview
The Session Ranges ( AMT Edition) is a session-based market structure and auction analysis tool designed to visually reveal acceptance, rejection, imbalance, and continuation across the Asia, London, and New York CME trading sessions.
Unlike typical indicators, this script is grounded in Auction Market Theory (AMT) and session-based structure, focusing on how price behaves at session extremes rather than relying on lagging calculations, oscillators, or predictive algorithms. Its purpose is to highlight areas where the market has earned the right to be traded, providing traders with a clear, rules-based framework for high-probability directional trades.
Important for backtesting: To properly backtest session extremes, Interaction Lines, and Closest Opposite Extreme Lines, you must use TradingView’s replay mode, as real-time bar-by-bar progression is required to observe how the market interacts with session extremes over time.
► Key Innovations
This is not a conventional session high/low indicator. Its originality comes from several unique design elements:
Differentiates interaction from true acceptance: Price touching an extreme does not automatically indicate directional intent.
Separates directional confirmation from range-bound indecision: Only confirmed crossings beyond the Interaction Line signal actionable bias.
Tracks failed auctions and partial acceptance: No volume profile or order book data required.
Visual, rule-based trade permission: Signals are objective, minimizing subjective interpretation.
Interaction & Closest Opposite Extreme Lines: Together, these lines map how far an auction progresses after an extreme is tested, highlighting continuation, partial acceptance, or failed auctions.
► Core Concepts Explained
1. Session Highs & Lows (Solid Lines)
Plotted continuously for each CME session (Asia, London, New York).
Represent the current auction boundaries for that session.
2. True Interaction Lines (Thick Dotted Lines)
Drawn when price touches or breaks a session extreme:
Touching session high → dotted line at the low of that candle
Touching session low → dotted line at the high of that candle
Auction context:
Touching alone ≠ acceptance
Acceptance occurs only when price moves beyond the Interaction Line and holds
Trading principle:
Price has not crossed → no directional bias → do not trade
Price crosses and holds → directional bias established
3. Acceptance vs Rejection
Accepted direction: Price crosses and holds beyond the Interaction Line
Rejected direction: Price crosses the line but immediately reverses
Neutral / No-Trade: Price trapped between extreme and Interaction Line
Important: Acceptance is conditional and dynamic. Each time price crosses back over the Interaction Line, acceptance is lost.
4. New Extremes = Continuation
Once an Interaction Line is crossed, each new session extreme in that direction reinforces the trend.
Traders should only look for continuation setups along the established directional bias.
AMT interpretation:
Repeated new extremes → directional imbalance
Failure to make new extremes → potential balance or rotation
5. Closest Opposite Extreme Lines (Thin Dotted Lines)
After acceptance, the script tracks price progress toward the opposite session extreme.
Plotted only if price reaches a user-defined percentage of the session range.
Helps identify:
Full acceptance (price reaches opposite extreme)
Partial acceptance (price stalls)
Failed auctions (price cannot progress meaningfully)
Trading guidance once Closest Lines appear:
Partial acceptance: Price stalls near the Closest Line but does not fully reach the opposite extreme → bias remains valid, but the move may be weakening; consider scaling out or tightening stops.
Full acceptance: Price reaches the opposite extreme → directional auction fully confirmed; bias continues, but expect potential rotation or balance afterward.
Failed auction (cannot progress meaningfully): Price reverses before reaching the Closest Line → signals exhaustion; avoid chasing the move and treat as potential trend failure.
Note: Only relevant after Interaction Line is crossed; if price never crosses the Interaction Line, Closest Lines have no trading significance.
► Step-by-Step Usage
Wait for a session extreme
Let price interact with the session high or low.
Observe the Interaction Line
No cross → do not trade
Cross and hold → directional bias established
Trade in the direction of new extremes only
Ignore counter-trend trades unless the Interaction Line is lost
Manage risk using structure
Interaction Line acts as a dynamic invalidation level
Use Closest Lines for context
Partial acceptance → bias valid, watch for weakening
Full acceptance → bias strong, continuation likely
Failed attempt → potential exhaustion, do not chase
Useful for trade management, scaling, and expectation setting
► Price Retests & Pullbacks
Scenario:
Price crosses above the Interaction Line (e.g., from a low interaction).
Over the next 3–4 15-minute bars, price dips back toward the Interaction Line, with wicks touching it but no decisive close below.
Interpretation:
Initial Acceptance Confirmed: Bias remains valid while price holds above/below the line.
Temporary Pullback / Retest: Market is re-evaluating the auction; testing participant agreement.
Wicks Touching the Line: Partial probing or liquidity sweep; market still respects original acceptance.
Trading Implication:
Continuation bias remains intact.
Pullbacks near the Interaction Line offer lower-risk entries.
Decisive close below → acceptance lost, signaling trend failure or invalidation.
Market Psychology:
Healthy auction behavior: extreme tested → acceptance confirmed → boundary retested for liquidity → continuation.
Failure to hold above signals weak acceptance or exhaustion.
✅ Key Takeaways:
Holding above Interaction Line → bias intact, pullback = opportunity
Closing below Interaction Line → acceptance lost, bias invalidated
Wicks touching only → normal retest, still valid
► No-Trade Conditions
Avoid trading when:
Price never crosses the Interaction Line
Price remains trapped between the extreme and the Interaction Line
Market rotates without forming new extremes
These indicate balance, not directional opportunity.
► Alerts
Optional alerts trigger when price crosses an Interaction Line for:
Asia session
London session
New York session
Alerts signal possible acceptance, not automatic trade entries.
► Who This Script Is For
Best suited for traders who:
Trade session structure in futures, indices, or FX
Follow Auction Market Theory principles
Prefer objective, rules-based confirmation
Want fewer but higher-quality trade opportunities
Not intended for:
Indicator stacking
Predictive trading
High-frequency scalping without structure
► Final Notes
This script does not tell you when to buy or sell.
It shows where the market has earned the right to be traded.
Use it as a decision filter, not a prediction engine.
