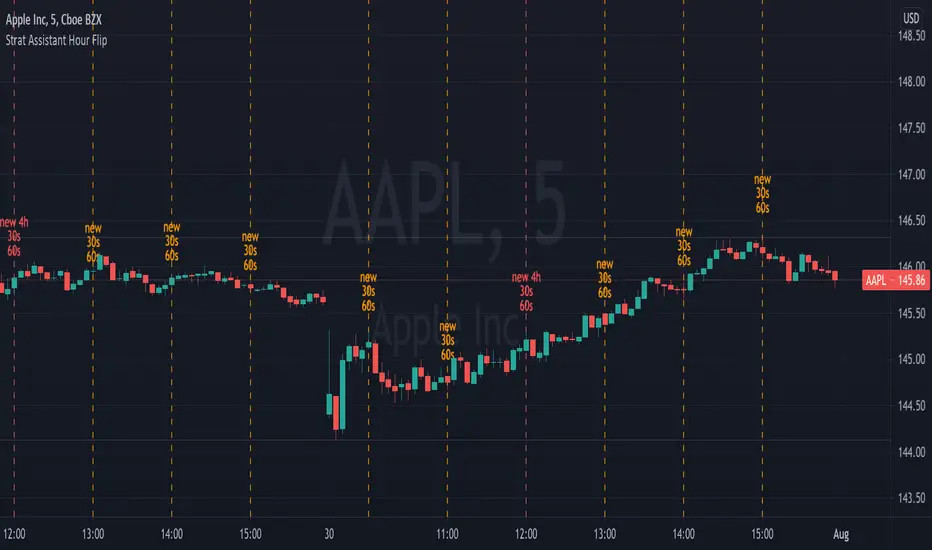
Strat Assistant Hour FlipStrat Assistant Hour Flip
----------------------------
█ OVERVIEW
This script is intended to provide a vertical line indicator for the hourly "flips" to easily indicate when the hour turns. Ideally used in timeframes less than an hour.
Input
----------
Hour Color: the color of the line and the text for the hourly indicator
Four Hour Color: the color of the line and the text for the four hour indicator
Show Label Text?: an on/off (active/inactive) flag to display the text (new 30s/60s). I can't figure out how to get a label vertical, so sometimes it gets in the way.
Output
----------
Vertical Dotted Line Indicator: vertical lines that allow a user to quickly see when the hour flips
Hour Flip Labels: quick visual labels with the same color as the lines that will display new 4h/60s/30s
Best Practices
----------
Trading view may limit the number of lines drawn, so probably not best to be use in larger time frames (like days/month worth of data on the chart) for smaller intervals
Best if used for intervals under 30 minutes
ابحث في النصوص البرمجية عن "text"
DAYOFWEEK performance1 -Objective
"What is the ''best'' day to trade .. Monday, Tuesday...."
This script aims to determine if there are different results depending on the day of the week.
The way it works is by dividing data by day of the week (Monday, Tuesday, Wednesday ... ) and perform calculations for each day of the week.
1 - Objective
2 - Features
3 - How to use (Examples)
4 - Inputs
5 - Limitations
6 - Notes
7 - Final Tooughs
2 - Features
AVG OPEN-CLOSE
Calculate de Percentage change from day open to close
Green % (O-C)
Percentage of days green (open to close)
Average Change
Absolute day change (O-C)
AVG PrevD. Close-Close
Percentage change from the previous day close to the day of the week close
(Example: Monday (C-C) = Friday Close to Monday close
Tuesday (C-C) = Monday C. to Tuesday C.
Green % (C1-C)
Percentage of days green (open to close)
AVG Volume
Day of the week Average Volume
Notes:
*Mon(Nº) - Nº = Number days is currently calculated
Example: Monday (12) calculation based on the last 12 Mondays. Note: Discrepancies in numbers example Monday (12) - Friday (11) depend on the initial/end date or the market was closed (Holidays).
3 - How to use (Examples)
For the following example, NASDAQ:AAPL from 1 Jan 21 to 1 Jul 21 the results are following.
The highest probability of a Close being higher than the Open is Monday with 52.17 % and the Lowest Tuesday with 38.46 %. Meaning that there's a higher chance (for NASDAQ:AAPL ) of closing at a higher value on Monday while the highest chance of closing is lower is Tuesday. With an average gain on Tuesday of 0.21%
Long - The best day to buy (long) at open (on average) is Monday with a 52.2% probability of closing higher
Short - The best day to sell (short) at open (on average) is Tuesday with a 38.5% probability of closing higher (better chance of closing lower)
Since the values change from ticker to ticker, there is a substantial change in the percentages and days of the week. For example let's compare the previous example ( NASDAQ:AAPL ) to NYSE:GM (same settings)
For the same period, there is a substantial difference where there is a 62.5% probability Friday to close higher than the open, while Tuesday there is only a 28% probability.
With an average gain of 0.59% on Friday and an average loss of -0.34%
Also, the size of the table (number of days ) depends if the ticker is traded or not on that day as an example COINBASE:BTCUSD
4 - Inputs
DATE RANGE
Initial Date - Date from which the script will start the calculation.
End Date - Date to which the script will calculate.
TABLE SETTINGS
Text Color - Color of the displayed text
Cell Color - Background color of table cells
Header Color - Color of the column and row names
Table Location - Change the position where the table is located.
Table Size - Changes text size and by consequence the size of the table
5 - LIMITATIONS
The code determines average values based on the stored data, therefore, the range (Initial data) is limited to the first bar time.
As a consequence the lower the timeframe the shorter the initial date can be and fewer weeks can be calculated. To warn about this limitation there's a warning text that appears in case the initial date exceeds the bar limit.
Example with initial date 1 Jan 2021 and end date 18 Jul 2021 in 5m and 10 m timeframe:
6 - Notes and Disclosers
The script can be moved around to a new pane if need. -> Object Tree > Right Click Script > Move To > New pane
The code has not been tested in higher subscriptions tiers that allow for more bars and as a consequence more data, but as far I can tell, it should work without problems and should be in fact better at lower timeframes since it allows more weeks.
The values displayed represent previous data and at no point is guaranteed future values
7 - Final Tooughs
This script was quite fun to work on since it analysis behavioral patterns (since from an abstract point a Tuesday is no different than a Thursday), but after analyzing multiple tickers there are some days that tend to close higher than the open.
PS: If you find any mistake ex: code/misspelling please comment.

Contextual Moving AveragesThis indicator customizes moving averages, allowing you to show or hide them on specific timeframes.
Lets say you want to show MA8 on the 5m timeframe but not on the Daily timeframe , now you can!
You can also timeframe lock a moving average and see it on the other timeframes, for example: You would like to see the Daily MA20 on the all other timeframes.
If you think that the indicator parameters texts are too long when viewing charts, right click on the indicator name and unclick "Show Indicator Arguments"

Trend ChannelMarket engineers can use channels to find out when a market has entered an undervalued or overvalued zone. Purchases and sales take place in these zones. Professionals use trending channels to find out when the market has overtaken itself and where it is likely to reverse.
Upper channel line = EMA + EMA x channel coefficient
Lower channel line = EMA - EMA x channel coefficient
The topline reflects the bulls' strength in raising prices above the average value consensus. This line marks the normal limit of optimism in the market.
The bottom line of the channel reflects the strength of the bears pushing prices below the average consensus of values. This line marks the normal limit of pessimism in the market.
The coefficient is used to correct the distance to the moving average until the channel contains 95% of all prices. Only the tips and the lowest bottoms are allowed to protrude. For these peaks and curves and sideways trends, I have added two more switchable lines to the border lines, with a distance of 23.6% (light blue).
The larger the time frame, the wider the channel.
If you buy near a rising moving average, you take profits near the upper line of the channel.
If you are short near a falling moving average, you should close out near the bottom of the channel.
If the moving average is essentially flat, then you should be long on the bottom of the channel and short on the top of the channel. You realize profits when the prices have returned to their moving average to normal.
Interesting for day traders:
Adjust the moving average so that it has the same slope as the quotes on the hourly chart. With the coefficient you set the distance between the border lines. Perhaps adding the 23.6% lines will help, where the sideways trends are starting. Set the resolution to "1 hour". If you want to trade with these settings in short time units, e.g. in the 3 minute chart or in the 1 minute chart, then you now have target marks and indications in which direction the prices will possibly move when the prices have reached the moving average or one of the border lines.
The text contains excerpts from "Come into my Trading Room" by Dr. Alexander Elder.
The indicator has an additional exponential moving average with adjustable period, adjustable shift and adjustable source for the narrow range of quotations and final determination of direction.
The chart shows how the trend channel and the Fibonacc trading indicator can complement each other.
The text contains excerpts from "Come into my Trading Room" by Dr. Alexander Elder.
Markttechniker können Kanäle verwenden um heraus zu finden, wann ein Markt eine unterbewertete oder überbewertete Zone erreicht hat. An diesen Zonen finden Käufe und Verkäufe statt. Profis benutzen Trendkanäle um herauszufinden, wann der Markt sich selbst überholt hat und wo er wahrscheinlich eine Umkehrbewegung vollziehen wird.
Obere Kanallinie = EMA + EMA x Kanalkoeffizient
Untere Kanallinie = EMA - EMA x Kanalkoeffizient
Die Oberlinie reflektiert die Kraft der Bullen, mit der sie die Kurse über den durchschnittlichen Wertekonsens anheben. Diese Linie kennzeichnet die normale Grenze des Optimismus im Markt.
Die untere Linie des Kanals reflektiert die Kraft der Bären, mit der sie die Kurse unter den durchschnittlichen Wertekonsens drücken. Diese Linie kennzeichnet die normale Grenze des Pessimismus im Markt.
Mit dem Koeffizienten wird der Abstand zum gleitenden Durchschnitt so lange korrigiert, bis der Kanal 95% aller Kurse enthält. Lediglich die Spitzen und die niedrigsten Böden dürfen herausragen. Für diese Spitzen und Bögen und Seitwärtstrends habe ich zu den Grenzlinien zwei weitere zuschaltbare Linien, mit einem Abstand von 23,6%, hinzugefügt (hellblau).
Je größer der Zeitrahmen ist, um so breiter ist der Kanal.
Wenn Sie in der Nähe eines ansteigenden gleitenden Durchschnitts kaufen, nehmen Sie die Gewinne in der Nähe der oberen Grenzlinie des Kanals mit.
Wenn Sie in der Nähe eines fallenden gleitenden Durchschnitts leerverkaufen, sollten Sie in der Nähe der unteren Grenzlinie des Kanals glattstellen.
Wenn der gleitende Durchschnitt im Wesentlichen flach ist, dann sollten Sie an der unteren Kanalbegrenzung eine Long-Position und an der oberen Kanalbegrenzung eine Short-Position einnehmen. Gewinne realisieren Sie jeweils, wenn die Kurse zu ihrem gleitenden Durchschnitt, zur Normalität zurückgekehrt sind.
Für Daytrader interessant:
Stellen Sie den gleitenden Durchschnitt so ein, dass er die gleiche Steigung wie die Notierungen im Stunden-Chart hat. Mit dem Koeffizienten Stellen Sie den Abstand der Grenzlinien ein. Vielleicht hilft die Zuschaltung der 23,6%-Linien, wo die Seitwärtstrends anstoßen. Stellen Sie die Auflösung auf „1 Stunde“. Wenn Sie mit diesen Einstellungen in niedrigen Zeiteinheiten traden wollen, z.B. im 3 Minuten-Chart oder im 1 Minuten-Chart, dann haben Sie jetzt Zielmarken und Hinweise in welche Richtung die Notierungen möglicherweise laufen werden, wenn die Notierungen den gleitenden Durchschnitt oder eine der Grenzlinien erreicht haben.
Der Text enthält Auszüge aus „Come into my Trading Room“ von Dr. Alexander Elder.
Der Indikator besitzt zur engen Umfang der Notierungen und endgültigen Richtungsbestimmung einen zusätzlichen exponentiellen gleitenden Durchschnitt mit einstellbarer Periode, einstellbarer Verschiebung und einstellbarer Quelle.
Der Chart zeigt wie sich Trendkanal und Fibonacc-Trading-Indikator ergänzen könne.
Der Text enthält Auszüge aus „Come into my Trading Room“ von Dr . Alexander Elder.

Developing Range v1.0Developing Range v1.0
----------------------------
Azimuth Dynamics
Scalping tool for help finding potentially high probability reactive levels. I suggest using on a 5min chart.
GRAY BAND: yesterday's High-Low range
BLUE BAND: today's Developing Range. Mean of today's High-Low range so far and yesterday's High-Low range, this is calculated for each of today's bars
THIN BLUE LINE: the mean of today's range median and yesterday's range median.
Note: we do not use the DAILY bar via 'security()' to obtain today's high and low. This would essentially be forward looking, instead we use iteration to check from the current bar back to midnight, bar by bar. This then allows a developing range to be established as the day prints new highs and lows.
Inspired by volatility trading textbook.

Any MA bands (TMA bands V2)Hi everyone
Website will be opening very shortly :) Sorting out the last details and we're so excited to finally roll-out our different Algorithm Builders for you guys
Forewords
This present script is an evolution of the TMA bands . I would never have expected that script to become so popular to be honest
This is not only a study or idea but a really proven method and I'm glad that many of you are using it already. But please, whenever you see a new script out there, even if it looks cool and promising, please test it on a demo account for a week or on a LIVE account but with tiny amounts every time.
Many times, what you see on the chart is not what will happen in reality. I know that most of you will agree and I know exactly why we see this behavior... I'll give more details in a later post
I have plenty of methods like that one and I'll detail them on my website (and a bit on TradingView) starting next month
TMA bands on steroids
Someone asked me privately to make a generic version of the TMA bands and make it compatible with other standards Moving Average types. That's it for the specifications really as I didn't do much than re-using some piece of my own code
Suggested (but not mandatory) methodology
1) The Take Profit 1 is the middle line, Take Profit 2 is the opposite band.
2) Once the TP1 is hit, set your Stop Loss to breakeven
3) Once the TP2 is hit, if you still want to stay in the trade, set your Stop Loss to the TP1
It will be a powerful tool in your arsenal for some scalp/intraday trades
Wishing you all of you a great and profitable day
PS
It's strictly forbidden to republish this script without my explicit approval. All my posts are copyrighted from now on
Obviously you can use but not republish and get the credit or even worse... some money from your own clients
Dave
____________________________________________________________
Be sure to hit the thumbs up. Building those indicators take a lot of time and likes are always rewarding for me :) (tips are accepted too)
- If you want to suggest some indicators that I can develop and share with the community, please use my personal TRELLO board
- I'm an officially approved PineEditor/LUA/MT4 approved mentor on codementor. You can request a coaching with me if you want and I'll teach you how to build kick-ass indicators and strategies
Jump on a 1 to 1 coaching with me
- You can also hire for a custom dev of your indicator/strategy/bot/chrome extension/python
Disclaimer:
Trading involves a high level of financial risk, and may not be appropriate because you may experience losses greater than your deposit. Leverage can be against you.
Do not trade with capital that you can not afford to lose. You must be aware and have a complete understanding of all the risks associated with the market and trading. We can not be held responsible for any loss you incur.
Trading also involves risks of gambling addiction.
Please notice I do not provide financial advice - my indicators, strategies, educational ideas are intended to provide only some source code for anyone interested in improving their trading
The proprietary indicators and strategies developed by Best Trading Indicator, the object of intellectual property rights are and remain the exclusive property of Best Trading Indicator, at the exclusion of images and videos and texts free of rights or provided by the Company or external legal or physical person.
No assignment of intellectual property rights is carried out through these Terms and Conditions.
Any total or partial reproduction, modification or use of these properties for any reason whatsoever is strictly prohibited without the express written authorization of the Company.

Trend Direction Helper (ZigZag and S/R and HH/LL labels)Hey everyone
First of all, I'd like to thank Ricardo Santos, Backtest Rookies for the inspiration for this script.
Actually, most of it is coming from them and I only mixed them up (and added my secret sauce ^^). If some of you are not thinking about a trading secret sauce, please get serious for a moment :)
Some of you asked me how I do to set the trend direction. You all understood that if you get an UP label, then the price should go up and vice-versa for down.
But it's not so easy to define the good signals for each asset and each timeframe. I'm going to repeat what I said yesterday because ... well... that's what trading is about
So quoting myself here "The inputs set by default will have to be changed for your asset/timeframe and can't be generic for everything. You have to play with the inputs until the signals will make sense to you
The indicator/strategy with a unique configuration that you'll never check or update according to the market condition DOES NOT exit. "
BUT... a bit of patience and practice and you might do wonders.
The Method
I never realized until now but by connecting the higher highs/lower lows, I was drawing zigzag lines.
The Zig Zag Master is Ricardo Santos . Please give him a follow, he's awesome
For those who don't want to draw on the chart or (my preferred choice) need some inspiration to define your trend directions, this script is for YOU (and your family, your pet, your girlfriend/boyfriend, ...)
I think that each asset/timeframe chart has its own history. What worked in a post could work in the future.
In that regard, if a trend direction worked in the past, that's the parameter that I'll use to trade with it in a demo account and make sure it's relevant. If not then I will adjust
If you're trading with new indicators or a new method right away on your real trading account, you're gonna have a bad time imgflip.com
Lines EVERYWHERE
The script draws the classical horizontal pivots + the zig zag lines + the Higher Highs/Lower Lows label in just 1 script. I'm very excited to share a script (on which I coded 100 lines out of 500) but no one else did it
The horizontal pivots part are coming from Backtest Rookies
For more security, you can add a pullback on a moving average after getting a signal. Pullbacks are necessary to limit any eventual loss or maximize your gains by getting in the trend sooner.
I really give you a solid method and a great script in my opinion. 6 years of experience given away for FREE :p (when Dave will start thinking as a business man instead :O)
Does it repaint ?
Getting this question twice a day. You guys are obsessed with the repainting :)
Short answer, yes because it will calculate the pivots and zig zags whenever new higher highs/lower lows will be formed.
However, the trend direction code is based on the candle close so it shouldn't repaint. If it does, please let me know
See you all on Monday
Love you all
Dave
____________________________________________________________
Be sure to hit the thumbs up. Building those indicators take a lot of time and likes are always rewarding for me :) (tips are accepted too)
- If you want to suggest some indicators that I can develop and share with the community, please use my personal TRELLO board
- I'm an officially approved PineEditor/LUA/MT4 approved mentor on codementor. You can request a coaching with me if you want and I'll teach you how to build kick-ass indicators and strategies
Jump on a 1 to 1 coaching with me
- You can also hire for a custom dev of your indicator/strategy/bot/chrome extension/python
Disclaimer:
Trading involves a high level of financial risk, and may not be appropriate because you may experience losses greater than your deposit. Leverage can be against you.
Do not trade with capital that you can not afford to lose. You must be aware and have a complete understanding of all the risks associated with the market and trading. We can not be held responsible for any loss you incur.
Trading also involves risks of gambling addiction.
Please notice I do not provide financial advice - my indicators, strategies, educational ideas are intended to provide only some source code for anyone interested in improving their trading
The proprietary indicators and strategies developed by Best Trading Indicator, the object of intellectual property rights are and remain the exclusive property of Best Trading Indicator, at the exclusion of images and videos and texts free of rights or provided by the Company or external legal or physical person.
No assignment of intellectual property rights is carried out through these Terms and Conditions.
Any total or partial reproduction, modification or use of these properties for any reason whatsoever is strictly prohibited without the express written authorization of the Company.

CCI Stochastic and a quick lesson on Scalping & Trading SystemsHello traders
Still on holidays but I don't and will never forget you <3
I realize more and more that you guys don't only want some indicators and learn about pinescript. You also want some guidance and get some mentors providing you with comprehensive and simple trading methods and tricks.
I'm against those posting many scripts a day that in the end will make you lose your money because they don't give you the methodology to use them
It might look nice on the charts but we're not here to do some painting.... but to improve our lifestyle right :)
The today indicator is based on an indicator that I used for scalping : Fxcodebase CCI Stochastic
A CCI stochastic is very reactive and allows us to take many scalps trades per day with a few pips/USD gain for each trade. I don't recommend novice traders to use it and I strongly recommend everyone reading my disclaimer below basically saying "I'm not a financial advisor, don't be dumb, stay safe"
(I also recommend the few scripts copy-pasters to read my disclaimer as well)
What's a novice trader, sir? Well... thanks for asking. A novice trader is any trader with less than 5 years of live trading experience
From a pinescript perspective, this script will be however interesting for everyone :)
How to use it?
The indicator gives 3 possible entries for Longs and Shorts:
- Arrows at Enter - Will give signals whenever the Stoch CCI will enter in the BUY/SELL zone
- Arrows at Exit - Will give signals whenever the Stoch CCI will exit the BUY/SELL zone
- Arrows at Center - Signals whenever the Stoch CCI will cross the mid-line (50)
All arrows have different colors because ... painting is cool and nice.... kidding.... it gives clearer and more readable signals on the chart (but painting sir...)
A possible trading method could be to use the 3 modes at the same time to get the maximum of opportunities.
The safer bet is to use the "Arrows at Exit" only mode but for those who want to accumulate more scalping positions, adding the "Arrows at Enter" mode is an option as well. In other words, you accumulate a few scalping positions whenever the Stoch CCI get in the BUY/SELL zone and will stop accumulating whenever it will exit the BUY/SELL zone
You can add a few extra positions whenever the Stoch CCI will cross the mid-line as it often translates in a trend continuation
Life hack
Very important note : (probably the most important gem I shared until now) The inputs set by default will have to be changed for your asset/timeframe and can't be generic for everything. You have to play with the inputs until the signals will make sense to you
The indicator/strategy with a unique configuration that you'll never check or update according to the market condition DOES NOT exit.
If you find such a tool and prove me that you're making constant gains with it over a year, please patent it and then show it to me as I'd like to study it to replicate :) But most likely this is a myth/unicorn
Who I am to say this? Well, I worked in a Bank with real traders and I have a good sense of what works and what will certainly not work
My guru said scalping crypto in 1 second timeframe was the way to get rich quick. Do you agree sir?
But in trading, this is not because you take the maximum of trades possible that your gains will increase. This is the contrary.
There is a strong and proven inverse correlation between the number of trades taken and how fast you'll burn your capital. A swing trader taking 2/3 trades a month is more likely to beat 99% of the scalpers out there trying to predict all market movements. (and I'm not even talking about how dangerous it is to scalp with leverage)
You're starting to know me a bit more right now. I prefer to tell you what you need to hear vs what you want to hear because the second option doesn't allow to stay in the game very long.
I might lose some futures clients along the way by saying that but for my own conscience and ethics, I prefer to warn about the true risks of trading and to select who you listen very carefully (the advice also works for me, if you feel what I said doesn't make sense, this is totally your right but I hope this is because I'm french and not because of the content ^^).
See you tomorrow for another indicator or idea
Love you all
Dave
____________________________________________________________
Be sure to hit the thumbs up. Building those indicators take a lot of time and likes are always rewarding for me :) (tips are accepted too)
- If you want to suggest some indicators that I can develop and share with the community, please use my personal TRELLO board
- I'm an officially approved PineEditor/LUA/MT4 approved mentor on codementor. You can request a coaching with me if you want and I'll teach you how to build kick-ass indicators and strategies
Jump on a 1 to 1 coaching with me
- You can also hire for a custom dev of your indicator/strategy/bot/chrome extension/python
Disclaimer:
Trading involves a high level of financial risk, and may not be appropriate because you may experience losses greater than your deposit. Leverage can be against you.
Do not trade with capital that you can not afford to lose. You must be aware and have a complete understanding of all the risks associated with the market and trading. We can not be held responsible for any loss you incur.
Trading also involves risks of gambling addiction.
Please notice I do not provide financial advice - my indicators, strategies, educational ideas are intended to provide only some source code for anyone interested in improving their trading
The proprietary indicators and strategies developed by Best Trading Indicator, the object of intellectual property rights are and remain the exclusive property of Best Trading Indicator, at the exclusion of images and videos and texts free of rights or provided by the Company or external legal or physical person.
No assignment of intellectual property rights is carried out through these Terms and Conditions.
Any total or partial reproduction, modification or use of these properties for any reason whatsoever is strictly prohibited without the express written authorization of the Company.

Multi SMA EMA WMA HMA BB (4x3 MAs Bollinger Bands) Pro MTF - RRBMulti SMA EMA WMA HMA 4x3 Moving Averages with Bollinger Bands Pro MTF by RagingRocketBull 2018
Version 1.0
This indicator shows multiple MAs of any type SMA EMA WMA HMA etc with BB and MTF support, can show MAs as dynamically moving levels.
There are 4 MA groups + 1 BB group. You can assign any type/timeframe combo to a group, for example:
- EMAs 50,100,200 x H1, H4, D1, W1 (4 TFs x 3 MAs x 1 type)
- EMAs 8,13,21,55,100,200 x M15, H1 (2 TFs x 6 MAs x 1 type)
- D1 EMAs and SMAs 12,26,50,100,200,400 (1 TF x 6 MAs x 2 types)
- H1 WMAs 7,77,231; H4 HMAs 50,100,200; D1 EMAs 144,169,233; W1 SMAs 50,100,200 (4 TFs x 3 MAs x 4 types)
- +1 extra MA type/timeframe for BB
compile time: 25-30 sec
full redraw time after parameter change in UI: 3 sec
There are several versions: Simple, MTF, Pro MTF, Advanced MTF and Ultimate MTF. This is the Pro MTF version. The Differences are listed below. All versions have BB
- Simple: you have 2 groups of MAs that can be assigned any type (5+5)
- MTF: +2 custom Timeframes for each group (2x5 MTF)
- Pro MTF: +4 custom Timeframes for each group (4x3 MTF), MA levels and show max bars back options
- Advanced MTF: +2 extra MAs/group (4x5 MTF), custom Ticker/Symbol, backreferences for type, TF and MA lengths in UI
- Ultimate MTF: +individual settings for each MA, custom Ticker/Symbols
Features:
- 4x3 = 12 MAs of any type including Hull Moving Average (HMA)
- 4x MTF groups with step line smoothing
- BB +1 extra TF/type for BB MAs
- 12 MA levels with adjustable group offsets, indents and shift
- show max bars back
- you can show/hide both groups of MAs/levels and individual MAs
Notes:
1. based on 3EmaBB, uses plot*, barssince and security functions
2. you can't set certain constants from input due to Pinescript limitations - change the code as needed, recompile and use as a private version
3. Levels = trackprice implementation
4. Show Max Bars Back = show_last implementation
5. uses timeframe textbox instead of input resolution to allow for 120 240 and other custom TFs. Also supports TFs in hours: 2H or H2
6. swma has a fixed length = 4, alma and linreg have additional offset and smoothing params
7. Smoothing is applied by default for visual aesthetics on MTF. To use exact ma mtf values (lines with stair stepping) - disable it
MTF Notes:
- uses simple timeframe textbox instead of input resolution dropdown to allow for 120, 240 and other custom TFs, also supports timeframes in H: 2H, H2
- Groups that are not assigned a Custom TF will use Current Timeframe (0).
- MTF will work for any MA type assigned to the group
- MTF works both ways: you can display a higher TF MA/BB on a lower TF or a lower TF MA/BB on a higher TF.
- MTF MA values are normally aligned at the boundary of their native timeframe. This produces stair stepping when a higher TF MA is viewed on a lower TF.
Therefore X Y Point Density/Smoothing is applied by default on MA MTF for visual aesthetics. Set both to 0 to disable and see exact ma mtf values (lines with stair stepping and original mtf alignment).
- Smoothing is disabled for BB MTF bands because fill doesn't work with smoothed MAs after duplicate values are replaced with na.
- MTF MA Value fluctuation is possible on the current bar due to default security lookahead
Smoothing:
- X,Y == 0 - X,Y smoothing disabled (stair stepping on high TFs)
- X == 0, Y > 0 - X,Y smoothing applied to all TFs
- Y == 0, X > 0 - X smoothing applied to all TFs < deltaX_max_tf, Y smoothing disabled
- X > 0, Y > 0 - Y smoothing applied to all TFs, then X smoothing applied to all TFs < deltaX_max_tf
X Smoothing with Y == 0 - shows only every deltaX-th point starting from the first bar.
X Smoothing with Y > 0 - shows only every deltaX-th point starting from the last shown Y point, essentially filling huge gaps remaining after Y Smoothing with points and preserving the curve's general shape
X Smoothing on high TFs with already scarce points produces weird curve shapes, it works best only on high density lower TFs
Y Smoothing reduces points on all TFs, removes adjacent points with prices within deltaY, while preserving the smaller curve details.
A combination of X,Y produces the most accurate smoothing. Higher delta value - larger range, more points removed.
Show Max Bars Back:
- can't set plot show_last from input -> implemented using a timenow based range check
- you can't delete/modify history once plotted, so essentially it just sets a start point for plotting (from num_bars bars back) that works only in realtime mode (not in replay)
Levels:
You can plot current MA value using plot trackprice=true or by checking Show Price Line in Style. Problem is:
- you can only change color (not the dashed line style, width), have both ma + price line (not just the line), and it's full screen wide
- you can't set plot trackprice from input => implemented using plotshape/plotchar with fixed text labels serving as levels
- there's no other way of creating a dynamic level: hline, plot, offset - nothing else works.
- you can't plot a text var - all text strings must be constants, so you can't change the style, width and text labels without recompiling.
- from input you can only adjust offset, indent and shift for each level group, and change color
- the dot below each level line is the exact MA value. If you want just the line swap plotshape with plotchar, recompile and save as your private version, adjust Y shift.
To speed up redraw times: reduce last_bars to ~2000, recompile and use as your own private version
Pinescript is a rudimentary language (should be called Painscript instead) that can basically only plot data. You can't do much else. Please see the code for tips and hints.
Certain things just can't be done or require shady workarounds and weeks of testing trying to resolve weird node.js compiler errors.
Feel free to learn from/reuse/change the code as needed and use as your own private version. See comments in code. Good Luck!

Trend Strength Meter [Eˣ]📊 Trend Strength Meter - Free Indicator
Overview
The Trend Strength Meter quantifies market momentum with a simple 0-100 score. No more guessing if a trend is strong or weak - this indicator gives you an objective, numerical measurement of trend strength that combines trend direction, momentum, volatility, and moving average alignment into one clear reading.
━━━━━━━━━━━━━━━━━━━━━━━━━━━━
🎯 What This Indicator Does
Quantifies Trend Strength:
• Measures trend on a scale from -100 (extreme bearish) to +100 (extreme bullish)
• Combines 4 key components: Trend Direction, Momentum, Volatility, MA Alignment
• Provides objective measurement instead of subjective interpretation
• Works on all timeframes and instruments
Visual Display:
• Green Histogram Bars = Bullish strength (0 to +100)
• Red Histogram Bars = Bearish strength (0 to -100)
• Smooth Overlay Line = Trend direction (filters noise)
• Triangle Markers = Trend reversals (zero-line crosses)
• Background Zones = Visual strength categories
Multi-Timeframe Analysis:
• See strength readings from 3 timeframes simultaneously
• Identify when trends align across multiple timeframes
• "ALIGNED" indicator shows when all timeframes agree
• Spot divergences between timeframes
Clean & Professional:
• Minimal clutter, maximum clarity
• Compact info panel in top-right corner
• No overwhelming indicators or text
• Easy to read at a glance
━━━━━━━━━━━━━━━━━━━━━━━━━━━━
📊 Understanding The Strength Scale
Bullish Readings (0 to +100)
+75 to +100 - VERY STRONG BULL
• Extremely powerful uptrend
• All components aligned bullishly
• Best time for aggressive long positions
• Trend likely to continue
• Strategy: Hold longs, avoid shorts
+50 to +75 - STRONG BULL
• Strong uptrend with good momentum
• High probability of continuation
• Quality long setups
• Pullbacks are buying opportunities
• Strategy: Enter longs on dips
+25 to +50 - BULL
• Moderate bullish trend
• Decent upward momentum
• Trend following longs work
• Watch for weakening signals
• Strategy: Ride the trend, trail stops
+10 to +25 - WEAK BULL
• Weak bullish bias
• Trend may be exhausting
• Lower probability setups
• Consider taking profits
• Strategy: Caution, reduce position sizes
-10 to +10 - NEUTRAL
• No clear trend
• Choppy, range-bound market
• Conflicting signals
• Low probability for trend trades
• Strategy: Stay flat or trade ranges
Bearish Readings (0 to -100)
-10 to -25 - WEAK BEAR
• Weak bearish bias
• Trend may be exhausting
• Lower probability setups
• Consider taking profits on shorts
• Strategy: Caution, reduce position sizes
-25 to -50 - BEAR
• Moderate bearish trend
• Decent downward momentum
• Trend following shorts work
• Watch for weakening signals
• Strategy: Ride the trend down, trail stops
-50 to -75 - STRONG BEAR
• Strong downtrend with momentum
• High probability of continuation
• Quality short setups
• Bounces are selling opportunities
• Strategy: Enter shorts on rallies
-75 to -100 - VERY STRONG BEAR
• Extremely powerful downtrend
• All components aligned bearishly
• Best time for aggressive short positions
• Trend likely to continue
• Strategy: Hold shorts, avoid longs
━━━━━━━━━━━━━━━━━━━━━━━━━━━━
📊 How To Use This Indicator
Basic Usage
1. Check Current Strength
• Look at the histogram height and color
• Read the exact number in the info panel
• Note the status label (STRONG BULL, WEAK BEAR, etc.)
• Higher absolute value = stronger trend
2. Watch For Reversals
• Triangle markers appear when strength crosses zero
• 🟢 Green triangle up = Bullish reversal signal
• 🔴 Red triangle down = Bearish reversal signal
• These mark potential trend changes
3. Monitor Multi-Timeframe Alignment
• Check if all timeframes show same direction
• "✓ ALIGNED" = All timeframes agree (high confidence)
• "✗ Mixed" = Timeframes disagree (lower confidence)
• Aligned trends have higher probability
4. Observe Strength Changes
• Rising strength = Trend strengthening
• Falling strength = Trend weakening
• Strength near extremes (+75/-75) = Potential exhaustion
• Strength near zero = Indecision/consolidation
━━━━━━━━━━━━━━━━━━━━━━━━━━━━
💡 Trading Strategies
Strategy 1: Trend Following
Best For: Capturing major moves
Timeframes: 1H, 4H, Daily
Rules:
1. Wait for strength to reach +50 or higher (or -50 or lower)
2. Check MTF alignment - all timeframes should agree
3. Enter on pullbacks in the direction of strength
4. Hold position while strength remains above +25 (or below -25)
5. Exit when strength crosses back to weak zone or reverses
Example - Long Setup:
• Strength crosses above +50 = Strong bull trend
• All MTF readings positive and aligned
• Wait for minor pullback to support
• Enter long with stop below recent swing low
• Hold while strength stays above +25
• Exit if strength drops below +10 or reverses to negative
Strategy 2: Reversal Trading
Best For: Catching trend changes early
Timeframes: 15min, 1H, 4H
Rules:
1. Watch for strength to reach extreme levels (+75 or -75)
2. Look for divergence (price new high/low but strength declining)
3. Wait for zero-line cross (triangle marker appears)
4. Enter in direction of new trend
5. Use tight stops since you're catching early
Example - Bullish Reversal:
• Strength at -80 (very strong bear)
• Price makes new low but strength only at -70 = Divergence
• Green triangle appears = Zero-line cross
• Enter long on confirmation
• Stop below recent swing low
• Target: Strength reaching +50
Strategy 3: Avoid Bad Trades
Best For: Improving win rate
Timeframes: All
Rules:
• DON'T trade when strength is between -10 and +10 (neutral zone)
• DON'T go long when strength is negative
• DON'T go short when strength is positive
• DON'T trade against MTF alignment
• DO wait for clear strength readings
Why It Works: Most losses come from trading in choppy markets or against the trend
Strategy 4: Position Sizing Based On Strength
Best For: Risk management
Timeframes: All
Rules:
• Strength +75 to +100 or -75 to -100 = Full position size (2-3% risk)
• Strength +50 to +75 or -50 to -75 = Normal position (1.5-2% risk)
• Strength +25 to +50 or -25 to -50 = Reduced position (1% risk)
• Strength -10 to +10 = No trades or minimal size (0.5% risk)
Why It Works: Bigger positions in stronger trends, smaller in weak trends
━━━━━━━━━━━━━━━━━━━━━━━━━━━━
⚙️ Settings Explained
Multi-Timeframe Analysis
• Toggle ON/OFF the MTF readings in the info panel
• Turn OFF for cleaner display if you only trade one timeframe
Timeframe 1, 2, 3 (Default: 15min, 1H, 4H)
• Choose which timeframes to analyze
• For day trading: Use 5min, 15min, 1H
• For swing trading: Use 1H, 4H, Daily
• For position trading: Use 4H, Daily, Weekly
• Higher timeframes show bigger picture trends
MA Length (Default: 20)
• Moving average period for trend direction component
• Lower values (10-15): More responsive, more signals
• Higher values (25-50): Smoother, fewer signals
• Recommended: 20 for most styles
ATR Length (Default: 14)
• Period for measuring volatility
• Standard setting works well for most markets
• Recommended: Keep at 14
RSI Length (Default: 14)
• Period for momentum measurement
• Standard setting works well for most markets
• Recommended: Keep at 14
Show Trend Labels on Chart
• Toggle ON to display "BULL" / "BEAR" text at reversals
• Keep OFF for cleaner chart (default)
• Useful when backtesting to see historical signals
Show Reversal Signals
• Toggle triangle markers at zero-line crosses
• Keep ON to catch trend changes
• Turn OFF if you only care about current strength
━━━━━━━━━━━━━━━━━━━━━━━━━━━━
🎓 How The Calculation Works
The indicator measures 4 components, each worth 25 points (total = 100):
1. Trend Direction (25 points)
• Compares price to moving average
• Checks if MA is rising or falling
• Perfect score: Price above rising MA
• Minimum score: Price below falling MA
2. Momentum (25 points)
• Uses RSI to measure momentum strength
• RSI > 70 = Maximum bullish points
• RSI < 30 = Maximum bearish points
• RSI near 50 = Neutral points
3. Volatility Alignment (25 points)
• Checks if price moves align with volatility
• Strong moves in trending direction = High score
• Weak moves or counter-trend = Low score
• Uses ATR to measure volatility
4. Moving Average Alignment (25 points)
• Checks EMA 8, 21, and 55 positioning
• Perfect bullish: 8 > 21 > 55 above price
• Perfect bearish: 8 < 21 < 55 below price
• Misaligned = Reduced score
Final Score = Sum of all 4 components (-100 to +100)
━━━━━━━━━━━━━━━━━━━━━━━━━━━━
📱 Info Panel Guide
Current
• Shows exact strength number for current timeframe
• Color-coded background (green = bullish, red = bearish)
• Larger number for quick visibility
Status
• Text description of current trend state
• Examples: "STRONG BULL", "WEAK BEAR", "NEUTRAL"
• Quick interpretation without looking at number
Timeframe Readings
• Shows strength for each selected timeframe
• Color-coded for quick reading
• Compare to spot divergences
MTF Alignment
• ✓ ALIGNED = All timeframes show same direction (high confidence)
• ✗ Mixed = Timeframes disagree (proceed with caution)
• Most reliable trades happen when aligned
━━━━━━━━━━━━━━━━━━━━━━━━━━━━
📱 Alert Setup
This indicator includes 4 alert types:
1. Bullish Reversal
• Triggers when strength crosses from negative to positive
• Potential trend change from bearish to bullish
• Early warning of new uptrend
2. Bearish Reversal
• Triggers when strength crosses from positive to negative
• Potential trend change from bullish to bearish
• Early warning of new downtrend
3. Very Strong Bull
• Triggers when strength reaches +75 or higher
• Extreme bullish conditions
• Aggressive long opportunity
4. Very Strong Bear
• Triggers when strength reaches -75 or lower
• Extreme bearish conditions
• Aggressive short opportunity
To Set Up Alerts:
1. Click "Alert" button (clock icon)
2. Select "Trend Strength Meter"
3. Choose your alert type
4. Configure notifications
5. Click "Create"
━━━━━━━━━━━━━━━━━━━━━━━━━━━━
💎 Pro Tips & Best Practices
✅ DO:
• Trust the extremes - Readings above +75 or below -75 are highly reliable
• Wait for alignment - Best trades happen when MTF shows "ALIGNED"
• Use with price action - Combine with support/resistance for entries
• Respect the neutral zone - Avoid trading when strength is -10 to +10
• Scale position size - Bigger positions in stronger trends
• Watch for divergence - Price new high but strength declining = Warning
• Follow the trend - Don't fight strong readings (±50 or more)
⚠️ DON'T:
• Don't trade neutral readings - Wait for clear strength above ±25
• Don't fade extremes - Very strong trends (+75/-75) can stay extreme
• Don't ignore MTF - Mixed timeframes = Lower probability
• Don't overtrade - Wait for quality setups with good strength
• Don't use alone - Combine with support/resistance and risk management
• Don't expect perfection - Even strong trends can reverse suddenly
🎯 Best Timeframes:
• Scalping: 1min, 5min (fast readings, quick changes)
• Day Trading: 5min, 15min, 1H (balanced view)
• Swing Trading: 1H, 4H, Daily (stable trends)
• Position Trading: 4H, Daily, Weekly (major trends)
🔥 Best Markets:
• Trending markets (crypto, indices, commodities)
• High liquidity instruments (BTC, ES, NQ, EUR/USD)
• Avoid on low-volume stocks or exotic pairs
⏰ Works Best When:
• Market has clear direction
• Good volatility (not too choppy, not too quiet)
• Multiple timeframes aligned
• Away from major news events
━━━━━━━━━━━━━━━━━━━━━━━━━━━━
🚀 What Makes This Different?
Unlike subjective trend analysis, the Trend Strength Meter:
• Objective Measurement - No guessing, exact numerical score
• Multi-Component - Combines 4 factors, not just one indicator
• Multi-Timeframe - See alignment across timeframes instantly
• Clean Visual - Professional display, easy to interpret
• Actionable - Clear signals for entries, exits, and position sizing
• Universal - Works on all timeframes and instruments
• Proven Components - Based on trend, momentum, volatility, MA alignment
Perfect For:
• Trend followers who want confirmation
• Swing traders seeking high-probability setups
• Risk managers wanting to size positions properly
• Anyone tired of subjective "is this trend strong?" questions
━━━━━━━━━━━━━━━━━━━━━━━━━━━━
📈 Common Patterns To Watch
Pattern 1: The Steady Climb
• Strength gradually rises from +25 to +50 to +75
• Indicates building momentum
• Trade: Hold longs, add on pullbacks
Pattern 2: The Quick Spike
• Strength jumps from 0 to +75 in few bars
• Indicates explosive momentum
• Trade: Enter quickly, but expect pullback
Pattern 3: The Exhaustion
• Strength at +80, price new high, strength drops to +70
• Bearish divergence forming
• Trade: Take profits, prepare for reversal
Pattern 4: The Whipsaw
• Strength oscillates between +10 and -10
• Choppy, range-bound market
• Trade: Stay flat, wait for breakout
Pattern 5: The False Breakout
• Strength briefly crosses +50 then drops back
• Weak momentum, trend not confirmed
• Trade: Wait for sustained strength above +50
━━━━━━━━━━━━━━━━━━━━━━━━━━━━
📈 Upgrade Your Trading System
This free indicator quantifies trend strength objectively. Want more?
🔥 Check out my premium scripts for:
• Automated entry and exit signals with trend confirmation
• Advanced multi-timeframe strategy systems
• Dynamic position sizing based on trend strength
• Backtested performance with statistics
• Complete trading solutions
• And much more...
👉 Visit my profile for professional-grade trading tools!
━━━━━━━━━━━━━━━━━━━━━━━━━━━━
📝 Important Notes
• This indicator measures trend strength, not direction alone
• Strong readings don't guarantee continuation (manage risk)
• Always use with proper stop losses
• Combine with support/resistance analysis
• Test on demo before live trading
• Past performance doesn't guarantee future results
• Adjust settings to match your trading style
Disclaimer: For educational purposes only. Trading involves substantial risk. Always do your own research and never risk more than you can afford to lose.
━━━━━━━━━━━━━━━━━━━━━━━━━━━━
🙏 Support This Work
If this indicator helps your trading:
• ⭐ Give it a thumbs up
• 💬 Share your best strength-based trades in comments
• 🔔 Follow for more free professional tools
• 🚀 Share with traders who need objective trend analysis
Questions about trend strength? Drop a comment and I'll help!
━━━━━━━━━━━━━━━━━━━━━━━━━━━━
Developed with ❤️ for traders who want objective, quantified analysis
━━━━━━━━━━━━━━━━━━━━━━━━━━━━
Version History
• v1.0 - Initial release with 4-component strength calculation and MTF analysis

Gemini Hibrit Avcı (Supertrend + StochRSI)SupertrendOption 1: Natural & Conversational (Best Match for Original Tone)
This version captures the explanatory, "speaking to a friend" vibe of your Turkish text.
Supertrend: When you look at the chart, you'll see Green or Red clouds in the background. This basically tells you, "Should you only be thinking about buying right now, or selling?"
Stoch RSI: You know how the price sometimes makes a correction (drops slightly) even when the Supertrend is green? This indicator catches the exact moment that correction ends and the price starts heading back up (the K and D crossover).
EMA 200 Filter: This comes enabled by default in your settings. It means: "If the price is below the 200-day average, do not—under any circumstances—enter a trade, even if the Supertrend gives a BUY signal." This protects you from fake rallies (bull traps) during a bear market.

Momentum Permission + Pivot Entry + Exit (v1.4 FULL)//@version=5
indicator("Momentum Permission + Pivot Entry + Exit (v1.4 FULL)", overlay=true)
// ──────────────────────────────────────────────
// Inputs
// ──────────────────────────────────────────────
smaLength = input.int(50, "SMA Length")
relVolThresh = input.float(1.3, "Relative Volume Threshold")
pivotLookback = input.int(3, "Pivot Lookback Bars")
// ──────────────────────────────────────────────
// Core Calculations
// ──────────────────────────────────────────────
sma50 = ta.sma(close, smaLength)
vwap = ta.vwap(close)
relVol = volume / ta.sma(volume, 10)
aboveSMA = close > sma50
aboveVWAP = close > vwap
relStrong = relVol > relVolThresh
greenCandle = close > open
crossUp = ta.crossover(close, sma50)
// ──────────────────────────────────────────────
// One-Time Daily Permission
// ──────────────────────────────────────────────
var bool permission = false
if ta.change(time("D"))
permission := false
permitSignal = crossUp and aboveVWAP and relStrong and not permission
if permitSignal
permission := true
// ──────────────────────────────────────────────
// Entry: Pivot Break Continuation
// ──────────────────────────────────────────────
pivotHighBreak = close > ta.highest(high , pivotLookback)
entrySignal = (
permission and
aboveSMA and
aboveVWAP and
relStrong and
greenCandle and
pivotHighBreak
)
// ──────────────────────────────────────────────
// Exit: Trend Exhaustion / VWAP Breakdown
// ──────────────────────────────────────────────
smaChange = sma50 - sma50
exitSignal = (
permission and
close < vwap and
close < open and
relStrong and
smaChange < 0
)
// ──────────────────────────────────────────────
// VISUAL PLOTS (same as before)
// ──────────────────────────────────────────────
plot(sma50, title="SMA50", color=color.orange, linewidth=2)
plot(vwap, title="VWAP", color=color.new(color.blue, 0), linewidth=2)
plotshape(
permitSignal,
title="Trend Permission",
style=shape.triangleup,
location=location.belowbar,
color=color.new(color.green, 0),
size=size.large,
text="PERMIT"
)
plotshape(
entrySignal,
title="Entry Trigger",
style=shape.triangleup,
location=location.abovebar,
color=color.new(color.aqua, 0),
size=size.normal,
text="ENTRY"
)
plotshape(
exitSignal,
title="Exit Signal",
style=shape.triangledown,
location=location.abovebar,
color=color.new(color.red, 0),
size=size.large,
text="EXIT"
)
// ──────────────────────────────────────────────
// SCREENER OUTPUT (persistent 0/1 for the day)
// ──────────────────────────────────────────────
var bool permitToday = false
var bool entryToday = false
var bool exitToday = false
if ta.change(time("D"))
permitToday := false
entryToday := false
exitToday := false
if permitSignal
permitToday := true
if entrySignal
entryToday := true
if exitSignal
exitToday := true
// Hidden plots for screener columns
plot(permitToday ? 1 : 0, title="PERMIT", display=display.none)
plot(entryToday ? 1 : 0, title="ENTRY", display=display.none)
plot(exitToday ? 1 : 0, title="EXIT", display=display.none)
// Alerts
alertcondition(permitSignal, title="PERMIT", message="Momentum PERMISSION fired")
alertcondition(entrySignal, title="ENTRY", message="Momentum ENTRY fired")
alertcondition(exitSignal, title="EXIT", message="Momentum EXIT fired")

Momentum Permission + Pivot Entry + Exit (v1.4)//@version=5
indicator("Momentum Permission + Pivot Entry + Exit (v1.4)", overlay=true)
// ──────────────────────────────────────────────
// Inputs
// ──────────────────────────────────────────────
smaLength = input.int(50, "SMA Length")
relVolThresh = input.float(1.3, "Relative Volume Threshold")
pivotLookback = input.int(3, "Pivot Break Lookback")
// ──────────────────────────────────────────────
// Core Calculations
// ──────────────────────────────────────────────
sma50 = ta.sma(close, smaLength)
vwap = ta.vwap(close)
relVol = volume / ta.sma(volume, 10)
crossUp = ta.crossover(close, sma50)
aboveSMA = close > sma50
aboveVWAP = close > vwap
relStrong = relVol > relVolThresh
greenCandle = close > open
// ──────────────────────────────────────────────
// One-Time Daily Trend Permission
// ──────────────────────────────────────────────
var bool permission = false
if ta.change(time("D"))
permission := false
trendStart = crossUp and aboveVWAP and relStrong and not permission
if trendStart
permission := true
// ──────────────────────────────────────────────
// Pullback Pivot Breakout Entry (Continuation Long)
// ──────────────────────────────────────────────
pivotHighBreak = close > ta.highest(high , pivotLookback)
entryTrigger = (
permission and
aboveSMA and
aboveVWAP and
relStrong and
greenCandle and
pivotHighBreak
)
// ──────────────────────────────────────────────
// EXIT Signal (Trend Exhaustion)
// ──────────────────────────────────────────────
smaChange = sma50 - sma50
exitSignal = (
permission and // only after trend started
close < vwap and // VWAP breakdown
close < open and // red candle body
relVol > relVolThresh and // volume spike on selling
smaChange < 0 // SMA turning down / flattening
)
// ──────────────────────────────────────────────
// Plots
// ──────────────────────────────────────────────
plot(sma50, title="SMA50", color=color.orange, linewidth=2)
plot(vwap, title="VWAP", color=color.new(color.blue, 0), linewidth=2)
// Permission marker (1 per day)
plotshape(
trendStart,
title="Trend Permission",
style=shape.triangleup,
location=location.belowbar,
color=color.new(color.green, 0),
size=size.large,
text="PERMIT"
)
// Entry trigger markers
plotshape(
entryTrigger,
title="Entry Trigger",
style=shape.triangleup,
location=location.abovebar,
color=color.new(color.aqua, 0),
size=size.normal,
text="ENTRY"
)
// EXIT marker (trend exhaustion)
plotshape(
exitSignal,
title="Exit Signal",
style=shape.triangledown,
location=location.abovebar,
color=color.new(color.red, 0),
size=size.large,
text="EXIT"
)

TMT Sessions - Hitesh NimjeTMT Sessions - Hitesh Nimje Indicator
Overview
The TMT Sessions indicator is a comprehensive trading tool designed to visualize and analyze the four major global trading sessions. It provides session-based technical analysis including ranges, trends, averages, and statistical metrics for each trading session.
Key Features
Four Global Trading Sessions
1. Session A - New York (13:00-22:00 UTC)
Color: Blue (#0000FF)
Default timeframe: US/Eastern market hours
2. Session B - London (07:00-16:00 UTC)
Color: Black (#000000)
Default timeframe: European market hours
3. Session C - Tokyo (00:00-09:00 UTC)
Color: Red (#FF0000)
Default timeframe: Asian market hours
4. Session D - Sydney (21:00-06:00 UTC)
Color: Orange (#FFA500)
Default timeframe: Australian market hours
Technical Analysis Tools
Range Analysis:
* Visual range boxes showing session high/low boundaries
* Transparent background areas with configurable transparency
* Range outline borders
* Session labels with customizable text display
Trend Analysis:
* Linear regression trendlines for each session
* Statistical metrics including:
R-squared values for trend strength
Standard deviation calculations
Correlation measurements
Statistical Indicators:
* Session Averages: Simple Moving Averages (SMA) calculated within each session
* VWAP: Volume Weighted Average Price for session-based intraday analysis
* Max/Min Lines: Highest and lowest prices recorded during each session
Visual Elements
Session Dividers:
* Visual markers showing session start/end points
* Session identification symbols (NYE, LDN, TYO, SYD)
* Configurable divider display options
Dashboard Features:
* Basic Dashboard: Session status (Active/Inactive) with color-coded indicators
* Advanced Dashboard: Additional metrics including:
Session trend strength (R-squared values)
Volume data
Standard deviation statistics
* Multiple dashboard positions (Top Right, Bottom Right, Bottom Left)
* Configurable text sizes (Tiny, Small, Normal)
Customization Options
Timezone Management:
* UTC offset adjustment (+/- hours)
* Exchange timezone option for automatic adjustment
* Session time customization
Display Settings:
* Individual session enable/disable
* Color customization for each session
* Range area transparency control
* Line description display toggle
* Session text label configuration
Use Cases
1. Session-Based Trading: Identify optimal trading times for each global session
2. Range Trading: Use session ranges as support/resistance levels
3. Trend Analysis: Track session-specific trends and momentum
4. Statistical Analysis: Monitor session volatility and trend strength
5. Market Structure: Understand how price moves across different trading sessions
Technical Specifications
* Pine Script Version: 6
* Overlays: True (displays on price chart)
* Performance: Optimized for up to 500 bars back
* Multi-element Support: Handles up to 500 lines, boxes, and labels
* Data Source: Compatible with all trading instruments and timeframes
Benefits for Traders
1. Global Market Awareness: Visual representation of all major trading sessions
2. Session Analysis: Automated calculation of key session statistics
3. Trading Strategy Development: Session-based entry and exit signals
4. Risk Management: Session ranges for stop-loss and take-profit levels
5. Market Timing: Optimal trading session identification
This indicator is particularly valuable for forex traders, day traders, and anyone who needs to understand price behavior across different global market sessions. It combines multiple technical analysis concepts into a unified, session-focused trading tool.
TRADING DISCLAIMER
RISK WARNING
Trading involves substantial risk of loss and is not suitable for all investors. Past performance is not indicative of future results. You should carefully consider whether trading is suitable for you in light of your circumstances, knowledge, and financial resources.
NO FINANCIAL ADVICE
This indicator is provided for educational and informational purposes only. It does not constitute:
* Financial advice or investment recommendations
* Buy/sell signals or trading signals
* Professional investment advice
* Legal, tax, or accounting guidance
LIMITATIONS AND DISCLAIMERS
Technical Analysis Limitations
* Pivot points are mathematical calculations based on historical price data
* No guarantee of accuracy of price levels or calculations
* Markets can and do behave irrationally for extended periods
* Past performance does not guarantee future results
* Technical analysis should be used in conjunction with fundamental analysis
Data and Calculation Disclaimers
* Calculations are based on available price data at the time of calculation
* Data quality and availability may affect accuracy
* Pivot levels may differ when calculated on different timeframes
* Gaps and irregular market conditions may cause level failures
* Extended hours trading may affect intraday pivot calculations
Market Risks
* Extreme market volatility can invalidate all technical levels
* News events, economic announcements, and market manipulation can cause gaps
* Liquidity issues may prevent execution at calculated levels
* Currency fluctuations, inflation, and interest rate changes affect all levels
* Black swan events and market crashes cannot be predicted by technical analysis
USER RESPONSIBILITIES
Due Diligence
* You are solely responsible for your trading decisions
* Conduct your own research before using this indicator
* Verify calculations with multiple sources before trading
* Consider multiple timeframes and confirm levels with other technical tools
* Never rely solely on one indicator for trading decisions
Risk Management
* Always use proper risk management and position sizing
* Set appropriate stop-losses for all positions
* Never risk more than you can afford to lose
* Consider the inherent risks of leverage and margin trading
* Diversify your portfolio and trading strategies
Professional Consultation
* Consult with qualified financial advisors before trading
* Consider your tax obligations and legal requirements
* Understand the regulations in your jurisdiction
* Seek professional advice for complex trading strategies
LIMITATION OF LIABILITY
Indemnification
The creator and distributor of this indicator shall not be liable for:
* Any trading losses, whether direct or indirect
* Inaccurate or delayed price data
* System failures or technical malfunctions
* Loss of data or profits
* Interruption of service or connectivity issues
No Warranty
This indicator is provided "as is" without warranties of any kind:
* No guarantee of accuracy or completeness
* No warranty of uninterrupted or error-free operation
* No warranty of merchantability or fitness for a particular purpose
* The software may contain bugs or errors
Maximum Liability
In no event shall the liability exceed the purchase price (if any) paid for this indicator. This limitation applies regardless of the theory of liability, whether contract, tort, negligence, or otherwise.
REGULATORY COMPLIANCE
Jurisdiction-Specific Risks
* Regulations vary by country and region
* Some jurisdictions prohibit or restrict certain trading strategies
* Tax implications differ based on your location and trading frequency
* Commodity futures and options trading may have additional requirements
* Currency trading may be regulated differently than stock trading
Professional Trading
* If you are a professional trader, ensure compliance with all applicable regulations
* Adhere to fiduciary duties and best execution requirements
* Maintain required records and reporting
* Follow market abuse regulations and insider trading laws
TECHNICAL SPECIFICATIONS
Data Sources
* Calculations based on TradingView data feeds
* Data accuracy depends on broker and exchange reporting
* Historical data may be subject to adjustments and corrections
* Real-time data may have delays depending on data providers
Software Limitations
* Internet connectivity required for proper operation
* Software updates may change calculations or functionality
* TradingView platform dependencies may affect performance
* Third-party integrations may introduce additional risks
MONEY MANAGEMENT RECOMMENDATIONS
Conservative Approach
* Risk only 1-2% of capital per trade
* Use position sizing based on volatility
* Maintain adequate cash reserves
* Avoid over-leveraging accounts
Portfolio Management
* Diversify across multiple strategies
* Don't put all capital into one approach
* Regularly review and adjust trading strategies
* Maintain detailed trading records
FINAL LEGAL NOTICES
Acceptance of Terms
* By using this indicator, you acknowledge that you have read and understood this disclaimer
* You agree to assume all risks associated with trading
* You confirm that you are legally permitted to trade in your jurisdiction
Updates and Changes
* This disclaimer may be updated without notice
* Continued use constitutes acceptance of any changes
* It is your responsibility to stay informed of updates
Governing Law
* This disclaimer shall be governed by the laws of the jurisdiction where the indicator was created
* Any disputes shall be resolved in the appropriate courts
* Severability clause: If any part of this disclaimer is invalid, the remainder remains enforceable
REMEMBER: THERE ARE NO GUARANTEES IN TRADING. THE MAJORITY OF RETAIL TRADERS LOSE MONEY. TRADE AT YOUR OWN RISK.
Contact Information:
* Creator: Hitesh_Nimje
* Phone: Contact@8087192915
* Source: Thought Magic Trading
© HiteshNimje - All Rights Reserved
This disclaimer should be prominently displayed whenever the indicator is shared, sold, or distributed to ensure users are fully aware of the risks and limitations involved in trading.

X AVWAP DSOA powerful, non-overlay momentum indicator designed to measure the relationship between current price action and key Volume Weighted Average Price (VWAP) structures. It provides traders with a refined, configurable view of momentum by combining the **magnitude of price separation** with the **trend momentum** of the volume anchor.
---
### Core Calculation and Principle
This oscillator moves beyond simple price-vs-average separation by integrating the momentum (slope) of the volume average itself. The indicator is built around two primary components:
1. **Distance (D):** This is the magnitude of separation, calculated as the difference between the **closing price** and the selected **AVWAP Anchor Source** ($D = \text{Close} - \text{AVWAP}$).
2. **Slope (S):** This represents the **trend momentum** of the VWAP, calculated as the change in the smoothed AVWAP over a defined lookback period.
The final oscillator value is determined by the selected **Combination Method**, giving the user control over how these two factors interact:
* **Addition (Baseline):** The oscillator value is $D + S$. This provides a balanced view where the price separation is slightly adjusted by the VWAP's momentum.
* **Weighted Addition:** The oscillator value is $D + (S \times \text{Weight})$. This is a powerful feature that **allows the user to prioritize the impact of the Slope (trend momentum) over the Distance (magnitude)** using a customizable multiplier called the **Slope Weight**.
---
### Customization and Flexibility
The indicator's value lies in its deep configurability, allowing it to adapt to different trading strategies and timeframes:
* **AVWAP Anchor Source:** You can toggle between two critical VWAP reset structures for context:
* **4H Session VWAP:** Uses fixed, sequential 4-hour VWAP segments (e.g., 18:00, 22:00 NY Time) for tracking short-term structural shifts.
* **Daily AVWAP (ETH 18:00):** Uses a single, continuous VWAP anchored from the Electronic Trading Hours (ETH) open at 18:00 NY Time, providing a broader, sustained volume-weighted average context.
* **VWAP Price Source:** The underlying price used to calculate the VWAP itself is selectable (options include Close, OHLC4, HLC3, Open, High, and Low).
* **Plot Style:** Toggle between a continuous **Line** plot (for tracking fine movements) and a color-coded **Histogram** (for clear magnitude and directional reading, with Blue for positive and Red for negative).
### Trading Application
The AVWAP Distance & Slope Oscillator is a sophisticated tool best used to identify:
* **Zero-Line Crosses:** Signifying price crossing the underlying volume anchor while accounting for the anchor's own momentum.
* **Momentum Confirmation:** A high positive reading indicates price is strongly above the VWAP, and the VWAP itself is actively rising (strong bullish momentum).
* **Filtered Signals:** By adjusting the **Slope Weight** (in the Weighted Addition method), traders can amplify signals when the structural trend (VWAP slope) is strong, helping to filter out minor price fluctuations that occur when the VWAP is relatively flat.

Market Maker Position Bars (Position Size)**Market Maker Position Bars (Position Size) – Indicator Description for TradingView**
This indicator is a clean, professional visualization tool designed for traders who track suspected **market maker / institutional positioning** (especially popular in ICT/SMC communities) on indices like the SPX, NDX, ES, etc.
It draws up to **20 horizontal position bars** directly on the chart, anchored to the very last bar, representing hypothetical long and short positions at specific price levels with corresponding position sizes.
### Key Features & Visual Logic
- **Green bars (Boxes 1–10)** → Extend to the **right** of the last bar
Represent **long positions** (bullish interest)
Default translucent green fill
- **Red bars (Boxes 11–20)** → Extend to the **left** of the last bar
Represent **short positions** (bearish interest)
Default translucent red fill
- **Bar width = Position size**
The length of each box is automatically scaled based on the absolute value you enter in “Position Size”.
Larger position → wider (longer) bar
- Each box displays **Price / Position Size** text inside (e.g., `5720.50 / 1250`)
### Fully Customizable Settings
**Global Geometry**
- Total Box Height (default 10.0) – controls vertical thickness of all boxes
**Position Size Scaling**
- Base Box Width (bars)
- Width per Position Unit – fine-tune how aggressively width grows with size
- Minimum & Maximum Bar Width – prevents boxes from becoming too tiny or excessively long
**Global Text Settings**
- Text color, size (Tiny → Huge), and bold option
**Individual Box Controls (20 independent boxes)**
- Show/Hide toggle
- SPX Price (or any symbol price level)
- Position Size (any positive/negative number; absolute value determines width)
- Fill color (override default green/red if desired)
### How It Works Internally
- All boxes are drawn only on the **last confirmed bar** (`barstate.islast`)
- Width calculation:
`Width = BaseWidth + (|Position Size| × Width per Unit)`
Clamped between Min and Max Bar Width
- Green boxes start at the current bar and extend forward (right)
- Red boxes end at the current bar and extend backward (left)
- Uses Pine Script v6 `box.new()` with `xloc.bar_index` for perfect alignment and performance
### Ideal Use Cases
- Visualizing daily/weekly **order block** or **fair value gap** interest levels with estimated size
- Mapping **dealer positioning**, gamma exposure levels, or large options interest
- Quickly seeing where the “smart money” is theoretically stacked on both sides of the market
- Clean chart markup for screenshots, mentoring, or live trading journals
A minimalist yet powerful tool favored by ICT, SMC, and footprint-style traders who want to see **where the big players might be positioned** — all in one glance without cluttering the chart with hundreds of objects.
Clean. Visual. Size-aware. Perfect for high-level market profiling.

Daily ATR Dashboard - NIRALADaily ATR Dashboard: Volatility at a Glance
What is this?
The "Daily ATR Dashboard" is a simple, non-intrusive utility tool designed for intraday traders. It places a clean information table in the top-right corner of your chart, displaying the Daily Average True Range (DATR) for the current session and the previous two days.
Why is it useful?
Understanding daily volatility is crucial for setting realistic targets and stop-losses.
Know the Range: Instantly see how much the instrument typically moves in a day.
Context: Compare today's volatility with yesterday's and the day before to gauge if the market is expanding (becoming more volatile) or contracting (consolidating).
Clean Charts: Instead of plotting a messy ATR line indicator below your price action, this dashboard gives you the raw data you need without cluttering your workspace.
Features:
Real-Time Data: The "Today" row updates in real-time as the current daily candle develops.
Historical Context: Automatically fetches and displays the final DATR values for the previous two sessions ("Yesterday" and "Day Before").
Highlighted Current Day: The current day's data is highlighted in yellow for immediate visibility.
Customizable: You can adjust the ATR length (default is 14) and the text size to fit your screen perfectly.
How to Read It:
Today: The current volatility of the ongoing daily session.
Yesterday / Day Before: The finalized volatility of past sessions.
Tip: If "Today's" ATR is significantly lower than the previous days, expect potential expansion or a breakout soon. If it is significantly higher, the market may be overextended.
Settings:
DATR Length: The lookback period for the ATR calculation (Default: 14).
Text Size: Adjust the size of the table text (Tiny, Small, Normal, Large).

HTF FVG + SessionsThis indicator combines multi-timeframe FVG A–C detection with intraday session boxes on a single chart.
It automatically finds bullish and bearish Fair Value Gaps on 15m, 30m, 1H, 4H, 1D and 1W timeframes.
Fresh FVGs are drawn in a transparent gold color, then dynamically shrink as price trades back into the gap.
Once price fully fills the gap, the FVG box and its label are automatically removed from the chart.
After the first touch, each FVG changes to a per-timeframe gray shade, making overlapping HTF gaps easy to see.
You can toggle each timeframe on/off and also globally enable/disable all FVGs from the settings panel.
Session boxes highlight Asia, London, NY AM, NY Lunch and NY PM using soft colored rectangles.
Each session box is plotted from the high to the low of that session and labeled with its name in white text.
A global “Show all session boxes” switch allows you to quickly hide or display the session structure.
This tool is designed for traders who want to combine FVG liquidity maps with clear intraday session context.

SCALPING PRO V2 - INTERMÉDIANT (Dashboard + TP/SL + Alerts)//@version=5
indicator("SCALPING PRO V2 - INTERMÉDIANT (Dashboard + TP/SL + Alerts)", overlay=true, max_labels_count=500)
// ---------------- INPUTS ----------------
emaFastLen = input.int(9, "EMA Fast")
emaSlowLen = input.int(21, "EMA Slow")
atrLen = input.int(14, "ATR Length")
atrMultSL = input.float(1.2, "SL = ATR *")
tp1mult = input.float(1.0, "TP1 = ATR *")
tp2mult = input.float(1.5, "TP2 = ATR *")
tp3mult = input.float(2.0, "TP3 = ATR *")
minBars = input.int(3, "Min bars between signals")
showDashboard = input.bool(true, "Show Dashboard")
// ---------------- INDICATORS ----------------
emaFast = ta.ema(close, emaFastLen)
emaSlow = ta.ema(close, emaSlowLen)
atr = ta.atr(atrLen)
bullTrend = emaFast > emaSlow
bearTrend = emaFast < emaSlow
crossUp = ta.crossover(emaFast, emaSlow) and bullTrend
crossDown = ta.crossunder(emaFast, emaSlow) and bearTrend
var int lastSignal = na
okSignal = na(lastSignal) or (bar_index - lastSignal > minBars)
buySignal = crossUp and okSignal
sellSignal = crossDown and okSignal
if buySignal or sellSignal
lastSignal := bar_index
// ---------------- TP & SL ----------------
var float sl = na
var float tp1 = na
var float tp2 = na
var float tp3 = na
if buySignal
sl := close - atr * atrMultSL
tp1 := close + atr * tp1mult
tp2 := close + atr * tp2mult
tp3 := close + atr * tp3mult
if sellSignal
sl := close + atr * atrMultSL
tp1 := close - atr * tp1mult
tp2 := close - atr * tp2mult
tp3 := close - atr * tp3mult
// ---------------- ALERTS ----------------
alertcondition(buySignal, title="BUY", message="BUY Signal")
alertcondition(sellSignal, title="SELL", message="SELL Signal")
alertcondition(ta.cross(close, tp1), title="TP1", message="TP1 Hit")
alertcondition(ta.cross(close, tp2), title="TP2", message="TP2 Hit")
alertcondition(ta.cross(close, tp3), title="TP3", message="TP3 Hit")
alertcondition(ta.cross(close, sl), title="SL", message="Stop Loss Hit")
// ---------------- DASHBOARD ----------------
if showDashboard
var table dash = table.new(position.top_right, 1, 5)
if barstate.islast
table.cell(dash, 0, 0, "SCALPING PRO V2", bgcolor=color.new(color.black, 0), text_color=color.white)
table.cell(dash, 0, 1, "Trend: " + (bullTrend ? "Bull" : bearTrend ? "Bear" : "Neutral"))
table.cell(dash, 0, 2, "ATR: " + str.tostring(atr, format.mintick))
table.cell(dash, 0, 3, "Last Signal: " + (buySignal ? "BUY" : sellSignal ? "SELL" : "NONE"))
table.cell(dash, 0, 4, "EMA Fast/Slow OK")

Student Wyckoff Target Shooter
**Target Shooter — Equal Move Target Tool (Larry Williams idea)**
**1. What this indicator does**
Target Shooter is a tool that measures the last meaningful price swing and projects an **equal move target** in the direction of the breakout.
The logic is simple:
* The market makes a move from point A to point B (a swing high to a swing low, or vice versa).
* Then price breaks out above or below this swing range.
* Target Shooter takes the size of that swing and **adds it in the direction of the breakout**, showing a logical **price target zone** where the move may:
* slow down,
* react,
* or potentially reverse.
This is a practical implementation of the “Equal Moves” idea often referenced by Larry Williams.
---
**2. Core idea (example)**
Example from the classic explanation:
* Price drops from **80 down to 20** → the move is **60 points**.
* The swing range is now: **High = 80, Low = 20**.
* Later, price **breaks above 80**.
Target Shooter assumes:
> “If the market could move 60 points in one direction, after a breakout it may travel another 60 points in the opposite direction.”
So the upside target becomes:
* Move size: 80 − 20 = 60
* Breakout above 80
* **Target = 80 + 60 = 140**
The indicator finds such swings automatically and draws:
* **UT (Upper Target)** on upside breakouts
* **DT (Down Target)** on downside breakouts
---
**3. What you see on the chart**
1. **Target lines**
* When price breaks **above** a previous swing range, the indicator plots a horizontal **UT (Upper Target)** line — the projected equal move target.
* When price breaks **below** the previous swing range, it plots a **DT (Down Target)** line — the downside target.
* Each line is drawn from the breakout bar and extended to the right for a user-defined number of bars.
2. **Price labels**
* A small label “UT” or “DT” is shown at the end of the line with the exact target price.
* This makes it easy to see where the projected target is without checking the scale.
3. **Optional swing range (debug view)**
* There is an option to display the **swing range** that the target is based on (similar to a Donchian channel on previous bars).
* This shows the upper (swing high) and lower (swing low) boundaries the indicator used to define the last move.
---
**4. Key inputs (plain language)**
* **Swing window length (bars)**
How many bars back the indicator looks to find the last meaningful swing (highest high and lowest low).
This is like the length of a Donchian channel used to define the previous range.
Smaller values → more frequent, shorter targets.
Larger values → bigger swings and more distant targets.
* **Minimum move size (in ticks)**
This is a noise filter.
If the distance between the swing high and swing low is smaller than this threshold, no targets are drawn.
The indicator will only react to moves that are big enough to matter for your trading.
* **Breakout type: Close vs High/Low**
* **Breakout by Close**:
The target appears only when the **bar closes** above/below the swing range.
More conservative and fewer false signals.
* **Breakout by High/Low**:
The target appears as soon as the **high** or **low** of the bar breaks the swing range.
Faster and more aggressive, but more sensitive to noise.
* **Target line length (bars)**
How far to the right the UT/DT lines should be extended.
Shorter length → local target zones.
Longer length → important levels visible far into the future.
* **Appearance settings**
* Separate color, width and style for **UT** and **DT** lines.
* Option to show or hide labels with price and “UT/DT” text.
---
**5. How to use Target Shooter in trading**
> Important: this is **not** an entry signal indicator.
> Target Shooter is a **targeting and context tool**, not a standalone system.
Typical uses:
1. **Planning take-profit zones**
* You already have an entry signal from your own strategy (Wyckoff, Larry Williams patterns, levels, volume, whatever you use).
* Target Shooter shows a **logical equal move target** where the current wave can reasonably “shoot”.
* You can:
* place your main take-profit around the target,
* scale out part of the position,
* tighten stops when price approaches the target.
2. **Finding potential reaction / reversal areas**
* Equal move targets often act as **zones of interest**.
* If price reaches a UT/DT level and then shows weakness/absorption/volume spikes or reversal candles, this might be a good place to take profits or look for counter-trend opportunities (for experienced traders).
3. **Assessing trend strength**
* If price **easily exceeds** the equal move target and keeps going without any reaction, it suggests a very strong trend.
* If price **fails to reach** the target and reverses early, the move is weaker than expected.
---
**6. Timeframes**
Target Shooter can be used on:
* **Intraday** (M5, M15, M30, H1) — for shorter-term targets within the day,
* **Higher timeframes** (H4, D1 and above) — for swing and position trades.
General rule:
The **higher the timeframe and the larger the swing**, the **more important** the target level tends to be.
---
**7. Notes and limitations**
* The indicator does **not** predict the future.
It simply projects a geometric equal move from the last swing.
* It should be combined with your own trading framework:
* support/resistance,
* Wyckoff / VSA,
* trend tools,
* volume/flow, etc.
* Always keep proper risk management.
A target is a **scenario**, not a guarantee.
.

Multi-Timeframe EMA & SMA Scanner - Price Level LabelsOverview
A powerful multi-timeframe moving average scanner that displays EMA and SMA levels from up to 8 different timeframes simultaneously on your chart. Perfect for identifying key support/resistance levels, confluence zones, and multi-timeframe trend analysis.
Key Features
📊 Multi-Timeframe Analysis
Monitor up to 8 different timeframes simultaneously (5m, 10m, 15m, 30m, 1H, 4H, 1D, 1W)
Each timeframe can be independently enabled/disabled
Fully customizable timeframe selection
📈 Comprehensive Moving Averages
5 configurable EMA periods (default: 8, 21, 50, 100, 200)
2 configurable SMA periods (default: 200, 400)
All periods are fully customizable to match your trading strategy
🎯 Smart Price Level Labels
Labels positioned at actual price levels (not in a list)
Color-coded labels for easy identification
Dynamic text color: Green when price is above, Red when below
Compact notation: E8-5m means EMA 8 on 5-minute timeframe
Adjustable label offset from current price
📉 Optional Horizontal Lines
Dotted reference lines at each MA level
Color-matched to corresponding MA type
Can be toggled on/off independently
📋 Comprehensive Data Table
Shows all MA values organized by timeframe
Displays percentage distance from current price
Trend indicator (Strong Up/Up/Neutral/Down/Strong Down)
EMA alignment status (Bullish/Bearish/Mixed)
Color-coded cells for quick visual analysis
🎨 Full Customization
Individual color settings for each MA type
Adjustable table size (Tiny/Small/Normal/Large)
Choose table position (Left/Right)
Toggle any MA or timeframe on/off
🔔 Built-in Alerts
Golden Cross detection (EMA 50 crosses above EMA 200)
Death Cross detection (EMA 50 crosses below EMA 200)
Price crossing major EMAs
Available for multiple timeframes
How to Use
For Day Traders:
Enable lower timeframes (5m, 10m, 15m, 30m)
Focus on faster EMAs (8, 21, 50)
Watch for confluence zones where multiple timeframe MAs cluster
For Swing Traders:
Enable higher timeframes (1H, 4H, 1D)
Use all EMAs plus SMAs for broader perspective
Look for alignment across timeframes for high-probability setups
For Position Traders:
Focus on daily and weekly timeframes
Emphasize 100, 200 EMAs and 200, 400 SMAs
Use for long-term trend confirmation
Understanding the Labels
Label Format: E8-5m 45250.50
E8 = EMA with period 8
5m = 5-minute timeframe
45250.50 = Current price level
Green text = Price is currently above this level (potential support)
Red text = Price is currently below this level (potential resistance)
For SMAs: S200-1D 44500.00
S200 = SMA with period 200
1D = Daily timeframe
Trading Applications
Support/Resistance Identification
MAs act as dynamic support and resistance levels
Multiple timeframe MAs create stronger zones
Confluence Trading
When multiple MAs from different timeframes cluster together, it creates high-probability zones
These areas often result in strong reactions
Trend Analysis
Check the Alignment column: Bullish alignment = all EMAs in ascending order
Trend column shows overall price position relative to all MAs
Entry/Exit Timing
Use lower timeframe MAs for precise entries
Use higher timeframe MAs for trend direction and exits
Settings Guide
Timeframes Section:
Select and enable/disable up to 8 timeframes
Default: 5m, 10m, 15m, 30m, 1H, 4H, 1D, 1W
MA Periods Section:
Customize all EMA and SMA periods
Default EMAs: 8, 21, 50, 100, 200
Default SMAs: 200, 400
Display Section:
Toggle price labels and horizontal lines
Adjust label offset (distance from right edge)
Show/hide data table
Choose table position and size
Colors Section:
Customize colors for each MA type
Each MA has independent color control
Pro Tips
✅ Start with default settings and adjust based on your trading style
✅ Disable timeframes/MAs you don't use to reduce chart clutter
✅ Use the data table for quick overview, labels for precise levels
✅ Look for "confluence clusters" where multiple MAs from different timeframes align
✅ Green labels = potential support, Red labels = potential resistance
✅ Set alerts on key crossovers for automated notifications
Technical Specifications
Pine Script v6
Overlay indicator (displays on main chart)
Maximum 500 labels supported
Real-time updates on each bar close
Compatible with all instruments and timeframes
Perfect For:
Day traders seeking multi-timeframe confirmation
Swing traders looking for high-probability setups
Position traders monitoring long-term trends
Anyone using moving averages as part of their strategy
Note: This indicator does not provide buy/sell signals. It's a tool for analysis and should be used in conjunction with your trading strategy and risk management rules.
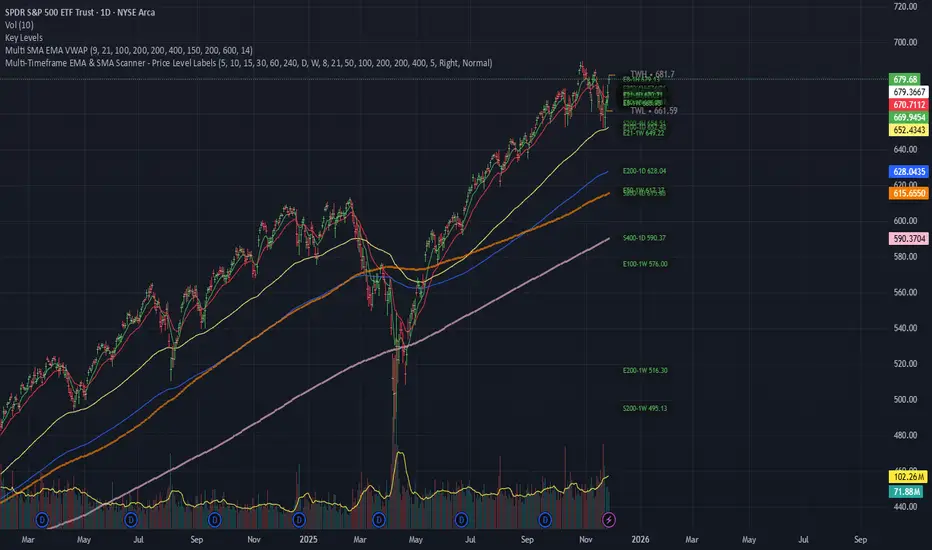
Luxy Super-Duper SuperTrend Predictor Engine and Buy/Sell signalA professional trend-following grading system that analyzes historical trend
patterns to provide statistical duration estimates using advanced similarity
matching and k-nearest neighbors analysis. Combines adaptive Supertrend with
intelligent duration statistics, multi-timeframe confluence, volume confirmation,
and quality scoring to identify high-probability setups with data-driven
target ranges across all timeframes.
Note: All duration estimates are statistical calculations based on historical data, not guarantees of future performance.
WHAT MAKES THIS DIFFERENT
Unlike traditional SuperTrend indicators that only tell you trend direction, this system answers the critical question: "What is the typical duration for trends like this?"
The Statistical Analysis Engine:
• Analyzes your chart's last 15+ completed SuperTrend trends (bullish and bearish separately)
• Uses k-nearest neighbors similarity matching to find historically similar setups
• Calculates statistical duration estimates based on current market conditions
• Learns from estimation errors and adapts over time (Advanced mode)
• Displays visual duration analysis box showing median, average, and range estimates
• Tracks Statistical accuracy with backtest statistics
Complete Trading System:
• Statistical trend duration analysis with three intelligence levels
• Adaptive Supertrend with dynamic ATR-based bands
• Multi-timeframe confluence analysis (6 timeframes: 5M to 1W)
• Volume confirmation with spike detection and momentum tracking
• Quality scoring system (0-70 points) rating each setup
• One-click preset optimization for all trading styles
• Anti-repaint guarantee on all signals and duration estimates
METHODOLOGY CREDITS
This indicator's approach is inspired by proven trading methodologies from respected market educators:
• Mark Minervini - Volatility Contraction Pattern (VCP) and pullback entry techniques
• William O'Neil - Volume confirmation principles and institutional buying patterns (CANSLIM methodology)
• Dan Zanger - Volatility expansion entries and momentum breakout strategies
Important: These are educational references only. This indicator does not guarantee any specific trading results. Always conduct your own analysis and risk management.
KEY FEATURES
1. TREND DURATION ANALYSIS SYSTEM - The Core Innovation
The statistical analysis engine is what sets this indicator apart from standard SuperTrend systems. It doesn't just identify trend changes - it provides statistical analysis of potential duration.
How It Works:
Step 1: Historical Tracking
• Automatically records every completed SuperTrend trend (duration in bars)
• Maintains separate databases for bullish trends and bearish trends
• Stores up to 15 most recent trends of each type
• Captures market conditions at each trend flip: volume ratio, ATR ratio, quality score, price distance from SuperTrend, proximity to support/resistance
Step 2: Similarity Matching (k-Nearest Neighbors)
• When new trend begins, system compares current conditions to ALL historical flips
• Calculates similarity score based on:
- Volume similarity (30% weight) - Is volume behaving similarly?
- Volatility similarity (30% weight) - Is ATR/volatility similar?
- Quality similarity (20% weight) - Is setup strength comparable?
- Distance similarity (10% weight) - Is price distance from ST similar?
- Support/Resistance proximity (10% weight) - Similar structural context?
• Selects the 15 MOST SIMILAR historical trends (not just all trends)
• This is like asking: "When conditions looked like this before, how long did trends last?"
Step 3: Statistical Analysis
• Calculates median duration (most common outcome)
• Calculates average duration (mean of similar trends)
• Determines realistic range (min to max of similar trends)
• Applies exponential weighting (recent trends weighted more heavily)
• Outputs confidence-weighted statistical estimate
Step 4: Advanced Intelligence (Advanced Mode Only)
The Advanced mode applies five sophisticated multipliers to refine estimates:
A) Market Structure Multiplier (±30%):
• Detects nearby support/resistance levels using pivot detection
• If flip occurs NEAR a key level: Estimate adjusted -30% (expect bounce/rejection)
• If flip occurs in open space: Estimate adjusted +30% (clear path for continuation)
• Uses configurable lookback period and ATR-based proximity threshold
B) Asset Type Multiplier (±40%):
• Adjusts duration estimates based on asset volatility characteristics
• Small Cap / Biotech: +40% (explosive, extended moves)
• Tech Growth: +20% (momentum-driven, longer trends)
• Blue Chip / Large Cap: 0% (baseline, steady trends)
• Dividend / Value: -20% (slower, grinding trends)
• Cyclical: Variable based on macro regime
• Crypto / High Volatility: +30% (parabolic potential)
C) Flip Strength Multiplier (±20%):
• Analyzes the QUALITY of the trend flip itself
• Strong flip (high volume + expanding ATR + quality score 60+): +20%
• Weak flip (low volume + contracting ATR + quality score under 40): -20%
• Logic: Historical data shows that powerful flips tend to be followed by longer trends
D) Error Learning Multiplier (±15%):
• Tracks Statistical accuracy over last 10 completed trends
• Calculates error ratio: (estimated duration / Actual Duration)
• If system consistently over-estimates: Apply -15% correction
• If system consistently under-estimates: Apply +15% correction
• Learns and adapts to current market regime
E) Regime Detection Multiplier (±20%):
• Analyzes last 3 trends of SAME TYPE (bull-to-bull or bear-to-bear)
• Compares recent trend durations to historical average
• If recent trends 20%+ longer than average: +20% adjustment (trending regime detected)
• If recent trends 20%+ shorter than average: -20% adjustment (choppy regime detected)
• Detects whether market is in trending or mean-reversion mode
Three analysis modes:
SIMPLE MODE - Basic Statistics
• Uses raw median of similar trends only
• No multipliers, no adjustments
• Best for: Beginners, clean trending markets
• Fastest calculations, minimal complexity
STANDARD MODE - Full Statistical Analysis
• Similarity matching with k-nearest neighbors
• Exponential weighting of recent trends
• Median, average, and range calculations
• Best for: Most traders, general market conditions
• Balance of accuracy and simplicity
ADVANCED MODE - Statistics + Intelligence
• Everything in Standard mode PLUS
• All 5 advanced multipliers (structure, asset type, flip strength, learning, regime)
• Highest Statistical accuracy in testing
• Best for: Experienced traders, volatile/complex markets
• Maximum intelligence, most adaptive
Visual Duration Analysis Box:
When a new trend begins (SuperTrend flip), a box appears on your chart showing:
• Analysis Mode (Simple / Standard / Advanced)
• Number of historical trends analyzed
• Median expected duration (most likely outcome)
• Average expected duration (mean of similar trends)
• Range (minimum to maximum from similar trends)
• Advanced multipliers breakdown (Advanced mode only)
• Backtest accuracy statistics (if available)
The box extends from the flip bar to the estimated endpoint based on historical data, giving you a visual target for trend duration. Box updates in real-time as trend progresses.
Backtest & Accuracy Tracking:
• System backtests its own duration estimates using historical data
• Shows accuracy metrics: how well duration estimates matched actual durations
• Tracks last 10 completed duration estimates separately
• Displays statistics in dashboard and duration analysis boxes
• Helps you understand statistical reliability on your specific symbol/timeframe
Anti-Repaint Guarantee:
• duration analysis boxes only appear AFTER bar close (barstate.isconfirmed)
• Historical duration estimates never disappear or change
• What you see in history is exactly what you would have seen real-time
• No future data leakage, no lookahead bias
2. INTELLIGENT PRESET CONFIGURATIONS - One-Click Optimization
Unlike indicators that require tedious parameter tweaking, this system includes professionally optimized presets for every trading style. Select your approach from the dropdown and ALL parameters auto-configure.
"AUTO (DETECT FROM TF)" - RECOMMENDED
The smartest option: automatically selects optimal settings based on your chart timeframe.
• 1m-5m charts → Scalping preset (ATR: 7, Mult: 2.0)
• 15m-1h charts → Day Trading preset (ATR: 10, Mult: 2.5)
• 2h-4h-D charts → Swing Trading preset (ATR: 14, Mult: 3.0)
• W-M charts → Position Trading preset (ATR: 21, Mult: 4.0)
Benefits:
• Zero configuration - works immediately
• Always matched to your timeframe
• Switch timeframe = automatic adjustment
• Perfect for traders who use multiple timeframes
"SCALPING (1-5M)" - Ultra-Fast Signals
Optimized for: 1-5 minute charts, high-frequency trading, quick profits
Target holding period: Minutes to 1-2 hours maximum
Best markets: High-volume stocks, major crypto pairs, active futures
Parameter Configuration:
• Supertrend: ATR 7, Multiplier 2.0 (very sensitive)
• Volume: MA 10, High 1.8x, Spike 3.0x (catches quick surges)
• Volume Momentum: AUTO-DISABLED (too restrictive for fast scalping)
• Quality minimum: 40 points (accepts more setups)
• Duration Analysis: Uses last 15 trends with heavy recent weighting
Trading Logic:
Speed over precision. Short ATR period and low multiplier create highly responsive SuperTrend. Volume momentum filter disabled to avoid missing fast moves. Quality threshold relaxed to catch more opportunities in rapid market conditions.
Signals per session: 5-15 typically
Hold time: Minutes to couple hours
Best for: Active traders with fast execution
"DAY TRADING (15M-1H)" - Balanced Approach
Optimized for: 15-minute to 1-hour charts, intraday moves, session-based trading
Target holding period: 30 minutes to 8 hours (within trading day)
Best markets: Large-cap stocks, major indices, established crypto
Parameter Configuration:
• Supertrend: ATR 10, Multiplier 2.5 (balanced)
• Volume: MA 20, High 1.5x, Spike 2.5x (standard detection)
• Volume Momentum: 5/20 periods (confirms intraday strength)
• Quality minimum: 50 points (good setups preferred)
• Duration Analysis: Balanced weighting of recent vs historical
Trading Logic:
The most balanced configuration. ATR 10 with multiplier 2.5 provides steady trend following that avoids noise while catching meaningful moves. Volume momentum confirms institutional participation without being overly restrictive.
Signals per session: 2-5 typically
Hold time: 30 minutes to full day
Best for: Part-time and full-time active traders
"SWING TRADING (4H-D)" - Trend Stability
Optimized for: 4-hour to Daily charts, multi-day holds, trend continuation
Target holding period: 2-15 days typically
Best markets: Growth stocks, sector ETFs, trending crypto, commodity futures
Parameter Configuration:
• Supertrend: ATR 14, Multiplier 3.0 (stable)
• Volume: MA 30, High 1.3x, Spike 2.2x (accumulation focus)
• Volume Momentum: 10/30 periods (trend stability)
• Quality minimum: 60 points (high-quality setups only)
• Duration Analysis: Favors consistent historical patterns
Trading Logic:
Designed for substantial trend moves while filtering short-term noise. Higher ATR period and multiplier create stable SuperTrend that won't flip on minor corrections. Stricter quality requirements ensure only strongest setups generate signals.
Signals per week: 2-5 typically
Hold time: Days to couple weeks
Best for: Part-time traders, swing style
"POSITION TRADING (D-W)" - Long-Term Trends
Optimized for: Daily to Weekly charts, major trend changes, portfolio allocation
Target holding period: Weeks to months
Best markets: Blue-chip stocks, major indices, established cryptocurrencies
Parameter Configuration:
• Supertrend: ATR 21, Multiplier 4.0 (very stable)
• Volume: MA 50, High 1.2x, Spike 2.0x (long-term accumulation)
• Volume Momentum: 20/50 periods (major trend confirmation)
• Quality minimum: 70 points (excellent setups only)
• Duration Analysis: Heavy emphasis on multi-year historical data
Trading Logic:
Conservative approach focusing on major trend changes. Extended ATR period and high multiplier create SuperTrend that only flips on significant reversals. Very strict quality filters ensure signals represent genuine long-term opportunities.
Signals per month: 1-2 typically
Hold time: Weeks to months
Best for: Long-term investors, set-and-forget approach
"CUSTOM" - Advanced Configuration
Purpose: Complete manual control for experienced traders
Use when: You understand the parameters and want specific optimization
Best for: Testing new approaches, unusual market conditions, specific instruments
Full control over:
• All SuperTrend parameters
• Volume thresholds and momentum periods
• Quality scoring weights
• analysis mode and multipliers
• Advanced features tuning
Preset Comparison Quick Reference:
Chart Timeframe: Scalping (1M-5M) | Day Trading (15M-1H) | Swing (4H-D) | Position (D-W)
Signals Frequency: Very High | High | Medium | Low
Hold Duration: Minutes | Hours | Days | Weeks-Months
Quality Threshold: 40 pts | 50 pts | 60 pts | 70 pts
ATR Sensitivity: Highest | Medium | Lower | Lowest
Time Investment: Highest | High | Medium | Lowest
Experience Level: Expert | Advanced | Intermediate | Beginner+
3. QUALITY SCORING SYSTEM (0-70 Points)
Every signal is rated in real-time across three dimensions:
Volume Confirmation (0-30 points):
• Volume Spike (2.5x+ average): 30 points
• High Volume (1.5x+ average): 20 points
• Above Average (1.0x+ average): 10 points
• Below Average: 0 points
Volatility Assessment (0-30 points):
• Expanding ATR (1.2x+ average): 30 points
• Rising ATR (1.0-1.2x average): 15 points
• Contracting/Stable ATR: 0 points
Volume Momentum (0-10 points):
• Strong Momentum (1.2x+ ratio): 10 points
• Rising Momentum (1.0-1.2x ratio): 5 points
• Weak/Neutral Momentum: 0 points
Score Interpretation:
60-70 points - EXCELLENT:
• All factors aligned
• High conviction setup
• Maximum position size (within risk limits)
• Primary trading opportunities
45-59 points - STRONG:
• Multiple confirmations present
• Above-average setup quality
• Standard position size
• Good trading opportunities
30-44 points - GOOD:
• Basic confirmations met
• Acceptable setup quality
• Reduced position size
• Wait for additional confirmation or trade smaller
Below 30 points - WEAK:
• Minimal confirmations
• Low probability setup
• Consider passing
• Only for aggressive traders in strong trends
Only signals meeting your minimum quality threshold (configurable per preset) generate alerts and labels.
4. MULTI-TIMEFRAME CONFLUENCE ANALYSIS
The system can simultaneously analyze trend alignment across 6 timeframes (optional feature):
Timeframes analyzed:
• 5-minute (scalping context)
• 15-minute (intraday momentum)
• 1-hour (day trading bias)
• 4-hour (swing context)
• Daily (primary trend)
• Weekly (macro trend)
Confluence Interpretation:
• 5-6/6 aligned - Very strong multi-timeframe agreement (highest confidence)
• 3-4/6 aligned - Moderate agreement (standard setup)
• 1-2/6 aligned - Weak agreement (caution advised)
Dashboard shows real-time alignment count with color-coding. Higher confluence typically correlates with longer, stronger trends.
5. VOLUME MOMENTUM FILTER - Institutional Money Flow
Unlike traditional volume indicators that just measure size, Volume Momentum tracks the RATE OF CHANGE in volume:
How it works:
• Compares short-term volume average (fast period) to long-term average (slow period)
• Ratio above 1.0 = Volume accelerating (money flowing IN)
• Ratio above 1.2 = Strong acceleration (institutional participation likely)
• Ratio below 0.8 = Volume decelerating (money flowing OUT)
Why it matters:
• Confirms trend with actual money flow, not just price
• Leading indicator (volume often leads price)
• Catches accumulation/distribution before breakouts
• More intuitive than complex mathematical filters
Integration with signals:
• Optional filter - can be enabled/disabled per preset
• When enabled: Only signals with rising volume momentum fire
• AUTO-DISABLED in Scalping mode (too restrictive for fast trading)
• Configurable fast/slow periods per trading style
6. ADAPTIVE SUPERTREND MULTIPLIER
Traditional SuperTrend uses fixed ATR multiplier. This system dynamically adjusts the multiplier (0.8x to 1.2x base) based on:
• Trend Strength: Price correlation over lookback period
• Volume Weight: Current volume relative to average
Benefits:
• Tighter bands in calm markets (less premature exits)
• Wider bands in volatile conditions (avoids whipsaws)
• Better adaptation to biotech, small-cap, and crypto volatility
• Optional - can be disabled for classic constant multiplier
7. VISUAL GRADIENT RIBBON
26-layer exponential gradient fill between price and SuperTrend line provides instant visual trend strength assessment:
Color System:
• Green shades - Bullish trend + volume confirmation (strongest)
• Blue shades - Bullish trend, normal volume
• Orange shades - Bearish trend + volume confirmation
• Red shades - Bearish trend (weakest)
Opacity varies based on:
• Distance from SuperTrend (farther = more opaque)
• Volume intensity (higher volume = stronger color)
The ribbon provides at-a-glance trend strength without cluttering your chart. Can be toggled on/off.
8. INTELLIGENT ALERT SYSTEM
Two-tier alert architecture for flexibility:
Automatic Alerts:
• Fire automatically on BUY and SELL signals
• Include full context: quality score, volume state, volume momentum
• One alert per bar close (alert.freq_once_per_bar_close)
• Message format: "BUY: Supertrend bullish + Quality: 65/70 | Volume: HIGH | Vol Momentum: STRONG (1.35x)"
Customizable Alert Conditions:
• Appear in TradingView's "Create Alert" dialog
• Three options: BUY Signal Only, SELL Signal Only, ANY Signal (BUY or SELL)
• Use TradingView placeholders: {{ticker}}, {{interval}}, {{close}}, {{time}}
• Fully customizable message templates
All alerts use barstate.isconfirmed - Zero repaint guarantee.
9. ANTI-REPAINT ARCHITECTURE
Every component guaranteed non-repainting:
• Entry signals: Only appear after bar close
• duration analysis boxes: Created only on confirmed SuperTrend flips
• Informative labels: Wait for bar confirmation
• Alerts: Fire once per closed bar
• Multi-timeframe data: Uses lookahead=barmerge.lookahead_off
What you see in history is exactly what you would have seen in real-time. No disappearing signals, no changed duration estimates.
HOW TO USE THE INDICATOR
QUICK START - 3 Steps to Trading:
Step 1: Select Your Trading Style
Open indicator settings → "Quick Setup" section → Trading Style Preset dropdown
Options:
• Auto (Detect from TF) - RECOMMENDED: Automatically configures based on your chart timeframe
• Scalping (1-5m) - For 1-5 minute charts, ultra-fast signals
• Day Trading (15m-1h) - For 15m-1h charts, balanced approach
• Swing Trading (4h-D) - For 4h-Daily charts, trend stability
• Position Trading (D-W) - For Daily-Weekly charts, long-term trends
• Custom - Manual configuration (advanced users only)
Choose "Auto" and you're done - all parameters optimize automatically.
Step 2: Understand the Signals
BUY Signal (Green Triangle Below Price):
• SuperTrend flipped bullish
• Quality score meets minimum threshold (varies by preset)
• Volume confirmation present (if filter enabled)
• Volume momentum rising (if filter enabled)
• duration analysis box shows expected trend duration
SELL Signal (Red Triangle Above Price):
• SuperTrend flipped bearish
• Quality score meets minimum threshold
• Volume confirmation present (if filter enabled)
• Volume momentum rising (if filter enabled)
• duration analysis box shows expected trend duration
Duration Analysis Box:
• Appears at SuperTrend flip (start of new trend)
• Shows median, average, and range duration estimates
• Extends to estimated endpoint based on historical data visually
• Updates mode-specific intelligence (Simple/Standard/Advanced)
Step 3: Use the Dashboard for Context
Dashboard (top-right corner) shows real-time metrics:
• Row 1 - Quality Score: Current setup rating (0-70)
• Row 2 - SuperTrend: Direction and current level
• Row 3 - Volume: Status (Spike/High/Normal/Low) with color
• Row 4 - Volatility: State (Expanding/Rising/Stable/Contracting)
• Row 5 - Volume Momentum: Ratio and trend
• Row 6 - Duration Statistics: Accuracy metrics and track record
Every cell has detailed tooltip - hover for full explanations.
SIGNAL INTERPRETATION BY QUALITY SCORE:
Excellent Setup (60-70 points):
• Quality Score: 60-70
• Volume: Spike or High
• Volatility: Expanding
• Volume Momentum: Strong (1.2x+)
• MTF Confluence (if enabled): 5-6/6
• Action: Primary trade - maximum position size (within risk limits)
• Statistical reliability: Highest - duration estimates most accurate
Strong Setup (45-59 points):
• Quality Score: 45-59
• Volume: High or Above Average
• Volatility: Rising
• Volume Momentum: Rising (1.0-1.2x)
• MTF Confluence (if enabled): 3-4/6
• Action: Standard trade - normal position size
• Statistical reliability: Good - duration estimates reliable
Good Setup (30-44 points):
• Quality Score: 30-44
• Volume: Above Average
• Volatility: Stable or Rising
• Volume Momentum: Neutral to Rising
• MTF Confluence (if enabled): 3-4/6
• Action: Cautious trade - reduced position size, wait for additional confirmation
• Statistical reliability: Moderate - duration estimates less certain
Weak Setup (Below 30 points):
• Quality Score: Below 30
• Volume: Low or Normal
• Volatility: Contracting or Stable
• Volume Momentum: Weak
• MTF Confluence (if enabled): 1-2/6
• Action: Pass or wait for improvement
• Statistical reliability: Low - duration estimates unreliable
USING duration analysis boxES FOR TRADE MANAGEMENT:
Entry Timing:
• Enter on SuperTrend flip (signal bar close)
• duration analysis box appears simultaneously
• Note the median duration - this is your expected hold time
Profit Targets:
• Conservative: Use MEDIAN duration as profit target (50% probability)
• Moderate: Use AVERAGE duration (mean of similar trends)
• Aggressive: Aim for MAX duration from range (best historical outcome)
Position Management:
• Scale out at median duration (take partial profits)
• Trail stop as trend extends beyond median
• Full exit at average duration or SuperTrend flip (whichever comes first)
• Re-evaluate if trend exceeds estimated range
analysis mode Selection:
• Simple: Clean trending markets, beginners, minimal complexity
• Standard: Most markets, most traders (recommended default)
• Advanced: Volatile markets, complex instruments, experienced traders seeking highest accuracy
Asset Type Configuration (Advanced Mode):
If using Advanced analysis mode, configure Asset Type for optimal accuracy:
• Small Cap: Stocks under $2B market cap, low liquidity
• Biotech / Speculative: Clinical-stage pharma, penny stocks, high-risk
• Blue Chip / Large Cap: S&P 500, mega-cap tech, stable large companies
• Tech Growth: High-growth tech (TSLA, NVDA, growth SaaS)
• Dividend / Value: Dividend aristocrats, value stocks, utilities
• Cyclical: Energy, materials, industrials (macro-driven)
• Crypto / High Volatility: Bitcoin, altcoins, highly volatile assets
Correct asset type selection improves Statistical accuracy by 15-20%.
RISK MANAGEMENT GUIDELINES:
1. Stop Loss Placement:
Long positions:
• Place stop below recent swing low OR
• Place stop below SuperTrend level (whichever is tighter)
• Use 1-2 ATR distance as guideline
• Recommended: SuperTrend level (built-in volatility adjustment)
Short positions:
• Place stop above recent swing high OR
• Place stop above SuperTrend level (whichever is tighter)
• Use 1-2 ATR distance as guideline
• Recommended: SuperTrend level
2. Position Sizing by Quality Score:
• Excellent (60-70): Maximum position size (2% risk per trade)
• Strong (45-59): Standard position size (1.5% risk per trade)
• Good (30-44): Reduced position size (1% risk per trade)
• Weak (Below 30): Pass or micro position (0.5% risk - learning trades only)
3. Exit Strategy Options:
Option A - Statistical Duration-Based Exit:
• Exit at median estimated duration (conservative)
• Exit at average estimated duration (moderate)
• Trail stop beyond average duration (aggressive)
Option B - Signal-Based Exit:
• Exit on opposite signal (SELL after BUY, or vice versa)
• Exit on SuperTrend flip (trend reversal)
• Exit if quality score drops below 30 mid-trend
Option C - Hybrid (Recommended):
• Take 50% profit at median estimated duration
• Trail stop on remaining 50% using SuperTrend as trailing level
• Full exit on SuperTrend flip or quality collapse
4. Trade Filtering:
For higher win-rate (fewer trades, better quality):
• Increase minimum quality score (try 60 for swing, 50 for day trading)
• Enable volume momentum filter (ensure institutional participation)
• Require higher MTF confluence (5-6/6 alignment)
• Use Advanced analysis mode with appropriate asset type
For more opportunities (more trades, lower quality threshold):
• Decrease minimum quality score (40 for day trading, 35 for scalping)
• Disable volume momentum filter
• Lower MTF confluence requirement
• Use Simple or Standard analysis mode
SETTINGS OVERVIEW
Quick Setup Section:
• Trading Style Preset: Auto / Scalping / Day Trading / Swing / Position / Custom
Dashboard & Display:
• Show Dashboard (ON/OFF)
• Dashboard Position (9 options: Top/Middle/Bottom + Left/Center/Right)
• Text Size (Auto/Tiny/Small/Normal/Large/Huge)
• Show Ribbon Fill (ON/OFF)
• Show SuperTrend Line (ON/OFF)
• Bullish Color (default: Green)
• Bearish Color (default: Red)
• Show Entry Labels - BUY/SELL signals (ON/OFF)
• Show Info Labels - Volume events (ON/OFF)
• Label Size (Auto/Tiny/Small/Normal/Large/Huge)
Supertrend Configuration:
• ATR Length (default varies by preset: 7-21)
• ATR Multiplier Base (default varies by preset: 2.0-4.0)
• Use Adaptive Multiplier (ON/OFF) - Dynamic 0.8x-1.2x adjustment
• Smoothing Factor (0.0-0.5) - EMA smoothing applied to bands
• Neutral Bars After Flip (0-10) - Hide ST immediately after flip
Volume Momentum:
• Enable Volume Momentum Filter (ON/OFF)
• Fast Period (default varies by preset: 3-20)
• Slow Period (default varies by preset: 10-50)
Volume Analysis:
• Volume MA Length (default varies by preset: 10-50)
• High Volume Threshold (default: 1.5x)
• Spike Threshold (default: 2.5x)
• Low Volume Threshold (default: 0.7x)
Quality Filters:
• Minimum Quality Score (0-70, varies by preset)
• Require Volume Confirmation (ON/OFF)
Trend Duration Analysis:
• Show Duration Analysis (ON/OFF) - Display duration analysis boxes
• analysis mode - Simple / Standard / Advanced
• Asset Type - 7 options (Small Cap, Biotech, Blue Chip, Tech Growth, Dividend, Cyclical, Crypto)
• Use Exponential Weighting (ON/OFF) - Recent trends weighted more
• Decay Factor (0.5-0.99) - How much more recent trends matter
• Structure Lookback (3-30) - Pivot detection period for support/resistance
• Proximity Threshold (xATR) - How close to level qualifies as "near"
• Enable Error Learning (ON/OFF) - System learns from estimation errors
• Memory Depth (3-20) - How many past errors to remember
Box Visual Settings:
• duration analysis box Border Color
• duration analysis box Background Color
• duration analysis box Text Color
• duration analysis box Border Width
• duration analysis box Transparency
Multi-Timeframe (Optional Feature):
• Enable MTF Confluence (ON/OFF)
• Minimum Alignment Required (0-6)
• Individual timeframe enable/disable toggles
• Custom timeframe selection options
All preset configurations override manual inputs except when "Custom" is selected.
ADVANCED FEATURES
1. Scalpel Mode (Optional)
Advanced pullback entry system that waits for healthy retracements within established trends before signaling entry:
• Monitors price distance from SuperTrend levels
• Requires pullback to configurable range (default: 30-50%)
• Ensures trend remains intact before entry signal
• Reduces whipsaw and false breakouts
• Inspired by Mark Minervini's VCP pullback entries
Best for: Swing traders and day traders seeking precision entries
Scalpers: Consider disabling for faster entries
2. Error Learning System (Advanced analysis mode Only)
The system learns from its own estimation errors:
• Tracks last 10-20 completed duration estimates (configurable memory depth)
• Calculates error ratio for each: estimated duration / Actual Duration
• If system consistently over-estimates: Applies negative correction (-15%)
• If system consistently under-estimates: Applies positive correction (+15%)
• Adapts to current market regime automatically
This self-correction mechanism improves accuracy over time as the system gathers more data on your specific symbol and timeframe.
3. Regime Detection (Advanced analysis mode Only)
Automatically detects whether market is in trending or choppy regime:
• Compares last 3 trends to historical average
• Recent trends 20%+ longer → Trending regime (+20% to estimates)
• Recent trends 20%+ shorter → Choppy regime (-20% to estimates)
• Applied separately to bullish and bearish trends
Helps duration estimates adapt to changing market conditions without manual intervention.
4. Exponential Weighting
Option to weight recent trends more heavily than distant history:
• Default decay factor: 0.9
• Recent trends get higher weight in statistical calculations
• Older trends gradually decay in importance
• Rationale: Recent market behavior more relevant than old data
• Can be disabled for equal weighting
5. Backtest Statistics
System backtests its own duration estimates using historical data:
• Walks through past trends chronologically
• Calculates what duration estimate WOULD have been at each flip
• Compares to actual duration that occurred
• Displays accuracy metrics in duration analysis boxes and dashboard
• Helps assess statistical reliability on your specific chart
Note: Backtest uses only data available AT THE TIME of each historical flip (no lookahead bias).
TECHNICAL SPECIFICATIONS
• Pine Script Version: v6
• Indicator Type: Overlay (draws on price chart)
• Max Boxes: 500 (for duration analysis box storage)
• Max Bars Back: 5000 (for comprehensive historical analysis)
• Security Calls: 1 (for MTF if enabled - optimized)
• Repainting: NO - All signals and duration estimates confirmed on bar close
• Lookahead Bias: NO - All HTF data properly offset, all duration estimates use only historical data
• Real-time Updates: YES - Dashboard and quality scores update live
• Alert Capable: YES - Both automatic alerts and customizable alert conditions
• Multi-Symbol: Works on stocks, crypto, forex, futures, indices
Performance Optimization:
• Conditional calculations (duration analysis can be disabled to reduce load)
• Efficient array management (circular buffers for trend storage)
• Streamlined gradient rendering (26 layers, can be toggled off)
• Smart label cooldown system (prevents label spam)
• Optimized similarity matching (analyzes only relevant trends)
Data Requirements:
• Minimum 50-100 bars for initial duration analysis (builds historical database)
• Optimal: 500+ bars for robust statistical analysis
• Longer history = more accurate duration estimates
• Works on any timeframe from 1 minute to monthly
KNOWN LIMITATIONS
• Trending Markets Only: Performs best in clear trends. May generate false signals in choppy/sideways markets (use quality score filtering and regime detection to mitigate)
• Lagging Nature: Like all trend-following systems, signals occur AFTER trend establishment, not at exact tops/bottoms. Use duration analysis boxes to set realistic profit targets.
• Initial Learning Period: Duration analysis system requires 10-15 completed trends to build reliable historical database. Early duration estimates less accurate (first few weeks on new symbol/timeframe).
• Visual Load: 26-layer gradient ribbon may slow performance on older devices. Disable ribbon if experiencing lag.
• Statistical accuracy Variables: Duration estimates are statistical estimates, not guarantees. Accuracy varies by:
- Market regime (trending vs choppy)
- Asset volatility characteristics
- Quality of historical pattern matches
- Timeframe traded (higher TF = more reliable)
• Not Best Suitable For:
- Ultra-short-term scalping (sub-1-minute charts)
- Mean-reversion strategies (designed for trend-following)
- Range-bound trading (requires trending conditions)
- News-driven spikes (estimates based on technical patterns, not fundamentals)
FREQUENTLY ASKED QUESTIONS
Q: Does this indicator repaint?
A: Absolutely not. All signals, duration analysis boxes, labels, and alerts use barstate.isconfirmed checks. They only appear after the bar closes. What you see in history is exactly what you would have seen in real-time. Zero repaint guarantee.
Q: How accurate are the trend duration estimates?
A: Accuracy varies by mode, market conditions, and historical data quality:
• Simple mode: 60-70% accuracy (within ±20% of actual duration)
• Standard mode: 70-80% accuracy (within ±20% of actual duration)
• Advanced mode: 75-85% accuracy (within ±20% of actual duration)
Best accuracy achieved on:
• Higher timeframes (4H, Daily, Weekly)
• Trending markets (not choppy/sideways)
• Assets with consistent behavior (Blue Chip, Large Cap)
• After 20+ historical trends analyzed (builds robust database)
Remember: All duration estimates are statistical calculations based on historical patterns, not guarantees.
Q: Which analysis mode should I use?
A:
• Simple: Beginners, clean trending markets, want minimal complexity
• Standard: Most traders, general market conditions (RECOMMENDED DEFAULT)
• Advanced: Experienced traders, volatile/complex markets (biotech, small-cap, crypto), seeking maximum accuracy
Advanced mode requires correct Asset Type configuration for optimal results.
Q: What's the difference between the trading style presets?
A: Each preset optimizes ALL parameters for a specific trading approach:
• Scalping: Ultra-sensitive (ATR 7, Mult 2.0), more signals, shorter holds
• Day Trading: Balanced (ATR 10, Mult 2.5), moderate signals, intraday holds
• Swing Trading: Stable (ATR 14, Mult 3.0), fewer signals, multi-day holds
• Position Trading: Very stable (ATR 21, Mult 4.0), rare signals, week/month holds
Auto mode automatically selects based on your chart timeframe.
Q: Should I use Auto mode or manually select a preset?
A: Auto mode is recommended for most traders. It automatically matches settings to your timeframe and re-optimizes if you switch charts. Only use manual preset selection if:
• You want scalping settings on a 15m chart (overriding auto-detection)
• You want swing settings on a 1h chart (more conservative than auto would give)
• You're testing different approaches on same timeframe
Q: Can I use this for scalping and day trading?
A: Absolutely! The preset system is specifically designed for all trading styles:
• Select "Scalping (1-5m)" for 1-5 minute charts
• Select "Day Trading (15m-1h)" for 15m-1h charts
• Or use "Auto" mode and it configures automatically
Volume momentum filter is auto-disabled in Scalping mode for faster signals.
Q: What is Volume Momentum and why does it matter?
A: Volume Momentum compares short-term volume (fast MA) to long-term volume (slow MA). It answers: "Is money flowing into this asset faster now than historically?"
Why it matters:
• Volume often leads price (early warning system)
• Confirms institutional participation (smart money)
• No lag like price-based indicators
• More intuitive than complex mathematical filters
When the ratio is above 1.2, you have strong evidence that institutions are accumulating (bullish) or distributing (bearish).
Q: How do I set up alerts?
A: Two options:
Option 1 - Automatic Alerts:
1. Right-click on chart → Add Alert
2. Condition: Select this indicator
3. Choose "Any alert() function call"
4. Configure notification method (app, email, webhook)
5. You'll receive detailed alerts on every BUY and SELL signal
Option 2 - Customizable Alert Conditions:
1. Right-click on chart → Add Alert
2. Condition: Select this indicator
3. You'll see three options in dropdown:
- "BUY Signal" (long signals only)
- "SELL Signal" (short signals only)
- "ANY Signal" (both BUY and SELL)
4. Choose desired option and customize message template
5. Uses TradingView placeholders: {{ticker}}, {{close}}, {{time}}, etc.
All alerts fire only on confirmed bar close (no repaint).
Q: What is Scalpel Mode and should I use it?
A: Scalpel Mode waits for healthy pullbacks within established trends before signaling entry. It reduces whipsaws and improves entry timing.
Recommended ON for:
• Swing traders (want precision entries on pullbacks)
• Day traders (willing to wait for better prices)
• Risk-averse traders (prefer fewer but higher-quality entries)
Recommended OFF for:
• Scalpers (need immediate entries, can't wait for pullbacks)
• Momentum traders (want to enter on breakout, not pullback)
• Aggressive traders (prefer more opportunities over precision)
Q: Why do some duration estimates show wider ranges than others?
A: Range width reflects historical trend variability:
• Narrow range: Similar historical trends had consistent durations (high confidence)
• Wide range: Similar historical trends had varying durations (lower confidence)
Wide ranges often occur:
• Early in analysis (fewer historical trends to learn from)
• In volatile/choppy markets (inconsistent trend behavior)
• On lower timeframes (more noise, less consistency)
The median and average still provide useful targets even when range is wide.
Q: Can I customize the dashboard position and appearance?
A: Yes! Dashboard settings include:
• Position: 9 options (Top/Middle/Bottom + Left/Center/Right)
• Text Size: Auto, Tiny, Small, Normal, Large, Huge
• Show/Hide: Toggle entire dashboard on/off
Choose position that doesn't overlap important price action on your specific chart.
Q: Which timeframe should I trade on?
A: Depends on your trading style and time availability:
• 1-5 minute: Active scalping, requires constant monitoring
• 15m-1h: Day trading, check few times per session
• 4h-Daily: Swing trading, check once or twice daily
• Daily-Weekly: Position trading, check weekly
General principle: Higher timeframes produce:
• Fewer signals (less frequent)
• Higher quality setups (stronger confirmations)
• More reliable duration estimates (better statistical data)
• Less noise (clearer trends)
Start with Daily chart if new to trading. Move to lower timeframes as you gain experience.
Q: Does this work on all markets (stocks, crypto, forex)?
A: Yes, it works on all markets with trending characteristics:
Excellent for:
• Stocks (especially growth and momentum names)
• Crypto (BTC, ETH, major altcoins)
• Futures (indices, commodities)
• Forex majors (EUR/USD, GBP/USD, etc.)
Best results on:
• Trending markets (not range-bound)
• Liquid instruments (tight spreads, good fills)
• Volatile assets (clear trend development)
Less effective on:
• Range-bound/sideways markets
• Ultra-low volatility instruments
• Illiquid small-caps (use caution)
Configure Asset Type (in Advanced analysis mode) to match your instrument for best accuracy.
Q: How many signals should I expect per day/week?
A: Highly variable based on:
By Timeframe:
• 1-5 minute: 5-15 signals per session
• 15m-1h: 2-5 signals per day
• 4h-Daily: 2-5 signals per week
• Daily-Weekly: 1-2 signals per month
By Market Volatility:
• High volatility = more SuperTrend flips = more signals
• Low volatility = fewer flips = fewer signals
By Quality Filter:
• Higher threshold (60-70) = fewer but better signals
• Lower threshold (30-40) = more signals, lower quality
By Volume Momentum Filter:
• Enabled = Fewer signals (only volume-confirmed)
• Disabled = More signals (all SuperTrend flips)
Adjust quality threshold and filters to match your desired signal frequency.
Q: What's the difference between entry labels and info labels?
A:
Entry Labels (BUY/SELL):
• Your primary trading signals
• Based on SuperTrend flip + all confirmations (quality, volume, momentum)
• Include quality score and confirmation icons
• These are actionable entry points
Info Labels (Volume Spike):
• Additional market context
• Show volume events that may support or contradict trend
• 8-bar cooldown to prevent spam
• NOT necessarily entry points - contextual information only
Control separately: Can show entry labels without info labels (recommended for clean charts).
Q: Can I combine this with other indicators?
A: Absolutely! This works well with:
• RSI: For divergences and overbought/oversold conditions
• Support/Resistance: Confluence with key levels
• Fibonacci Retracements: Pullback targets in Scalpel Mode
• Price Action Patterns: Flags, pennants, cup-and-handle
• MACD: Additional momentum confirmation
• Bollinger Bands: Volatility context
This indicator provides trend direction and duration estimates - complement with other tools for entry refinement and additional confluence.
Q: Why did I get a low-quality signal? Can I filter them out?
A: Yes! Increase the Minimum Quality Score in settings.
If you're seeing signals with quality below your preference:
• Day Trading: Set minimum to 50
• Swing Trading: Set minimum to 60
• Position Trading: Set minimum to 70
Only signals meeting the threshold will appear. This reduces frequency but improves win-rate.
Q: How do I interpret the MTF Confluence count?
A: Shows how many of 6 timeframes agree with current trend:
• 6/6 aligned: Perfect agreement (extremely rare, highest confidence)
• 5/6 aligned: Very strong alignment (high confidence)
• 4/6 aligned: Good alignment (standard quality setup)
• 3/6 aligned: Moderate alignment (acceptable)
• 2/6 aligned: Weak alignment (caution)
• 1/6 aligned: Very weak (likely counter-trend)
Higher confluence typically correlates with longer, stronger trends. However, MTF analysis is optional - you can disable it and rely solely on quality scoring.
Q: Is this suitable for beginners?
A: Yes, but requires foundational knowledge:
You should understand:
• Basic trend-following concepts (higher highs, higher lows)
• Risk management principles (position sizing, stop losses)
• How to read candlestick charts
• What volume and volatility mean
Beginner-friendly features:
• Auto preset mode (zero configuration)
• Quality scoring (tells you signal strength)
• Dashboard tooltips (hover for explanations)
• duration analysis boxes (visual profit targets)
Recommended for beginners:
1. Start with "Auto" or "Swing Trading" preset on Daily chart
2. Use Standard Analysis Mode (not Advanced)
3. Set minimum quality to 60 (fewer but better signals)
4. Paper trade first for 2-4 weeks
5. Study methodology references (Minervini, O'Neil, Zanger)
Q: What is the Asset Type setting and why does it matter?
A: Asset Type (in Advanced analysis mode) adjusts duration estimates based on volatility characteristics:
• Small Cap: Explosive moves, extended trends (+30-40%)
• Biotech / Speculative: Parabolic potential, news-driven (+40%)
• Blue Chip / Large Cap: Baseline, steady trends (0% adjustment)
• Tech Growth: Momentum-driven, longer trends (+20%)
• Dividend / Value: Slower, grinding trends (-20%)
• Cyclical: Macro-driven, variable (±10%)
• Crypto / High Volatility: Parabolic potential (+30%)
Correct configuration improves Statistical accuracy by 15-20%. Using Blue Chip settings on a biotech stock may underestimate trend length (you'll exit too early).
Q: Can I backtest this indicator?
A: Yes! TradingView's Strategy Tester works with this indicator's signals.
To backtest:
1. Note the entry conditions (SuperTrend flip + quality threshold + filters)
2. Create a strategy script using same logic
3. Run Strategy Tester on historical data
Additionally, the indicator includes BUILT-IN duration estimate validation:
• System backtests its own duration estimates
• Shows accuracy metrics in dashboard and duration analysis boxes
• Helps assess reliability on your specific symbol/timeframe
Q: Why does Volume Momentum auto-disable in Scalping mode?
A: Scalping requires ultra-fast entries to catch quick moves. Volume Momentum filter adds friction by requiring volume confirmation before signaling, which can cause missed opportunities in rapid scalping.
Scalping preset is optimized for speed and frequency - the filter is counterproductive for that style. It remains enabled for Day Trading, Swing Trading, and Position Trading presets where patience improves results.
You can manually enable it in Custom mode if desired.
Q: How much historical data do I need for accurate duration estimates?
A:
Minimum: 50-100 bars (indicator will function but duration estimates less reliable)
Recommended: 500+ bars (robust statistical database)
Optimal: 1000+ bars (maximum Statistical accuracy)
More history = more completed trends = better pattern matching = more accurate duration estimates.
New symbols or newly-switched timeframes will have lower Statistical accuracy initially. Allow 2-4 weeks for the system to build historical database.
IMPORTANT DISCLAIMERS
No Guarantee of Profit:
This indicator is an educational tool and does not guarantee any specific trading results. All trading involves substantial risk of loss. Duration estimates are statistical calculations based on historical patterns and are not guarantees of future performance.
Past Performance:
Historical backtest results and Statistical accuracy statistics do not guarantee future performance. Market conditions change constantly. What worked historically may not work in current or future markets.
Not Financial Advice:
This indicator provides technical analysis signals and statistical duration estimates only. It is not financial, investment, or trading advice. Always consult with a qualified financial advisor before making investment decisions.
Risk Warning:
Trading stocks, options, futures, forex, and cryptocurrencies involves significant risk. You can lose all of your invested capital. Never trade with money you cannot afford to lose. Only risk capital you can lose without affecting your lifestyle.
Testing Required:
Always test this indicator on a demo account or with paper trading before risking real capital. Understand how it works in different market conditions. Verify Statistical accuracy on your specific instruments and timeframes before trusting it with real money.
User Responsibility:
You are solely responsible for your trading decisions. The developer assumes no liability for trading losses, incorrect duration estimates, software errors, or any other damages incurred while using this indicator.
Statistical Estimation Limitations:
Trend Duration estimates are statistical estimates based on historical pattern matching. They are NOT guarantees. Actual trend durations may differ significantly from duration estimates due to unforeseen news events, market regime changes, or lack of historical precedent for current conditions.
CREDITS & ACKNOWLEDGMENTS
Methodology Inspiration:
• Mark Minervini - Volatility Contraction Pattern (VCP) concepts and pullback entry techniques
• William O'Neil - Volume analysis principles and CANSLIM institutional buying patterns
• Dan Zanger - Momentum breakout strategies and volatility expansion entries
Technical Components:
• SuperTrend calculation - Classic ATR-based trend indicator (public domain)
• Statistical analysis - Standard median, average, range calculations
• k-Nearest Neighbors - Classic machine learning similarity matching concept
• Multi-timeframe analysis - Standard request.security implementation in Pine Script
For questions, feedback, or support, please comment below or send a private message.
Happy Trading!

Mancini Levels (with alerts, majors only option)This indicator displays Support and Resistance levels on ES or MES (E-mini and Micro E-mini S&P 500 Index Futures) charts by parsing text copied and pasted by the user.
(The levels displayed on the chart above are not valid, they are for illustration only)
Features
Option to display only the major levels
The chart on the left displays both major and minor levels, distinguished by color and line style. The chart on the right shows only the major levels; minor levels are disabled:
Alert function for when the price approaches a major level or zone (within a customizable distance).
The script provides a trigger for alerts. When creating an alert, you can then choose your desired frequency (Only once/Once per bar/Once per bar close/Once per minute) from the TradingView alert pop-up.
The alert message contains the current price and the approached major level price.
Customizable Lookback Period
Set how many days into the past the lines should appear (Subject to a maximum of 5000 bars).
To display lines for the current day only, set this value to 1.
Functions only on ES or MES (E-mini and Micro E-mini S&P 500 Index Futures) charts, as the text format is intended for these instruments.
How to Use
Copy and paste the support and resistance levels into the indicator's "Supports" and "Resistances" input fields.
Format Example:
For the "Supports" input: 6772-6770 (major), 6764 (major), 6757, 6751-54
For the "Resistances" input: 6799 (major), 6814, 6828-30, 6839-40 (major)
The indicator supports the display of zone levels in multiple formats
(e.g., 6235-45 and 6235-6245 and 6245-6235 are all valid).
For hundred- or thousand-point rollovers, please use only the full number format: 5995-6005.
The indicator includes an error-checking system to help you troubleshoot common setup issues.
An on-chart error label will be displayed on the chart if:
The chart instrument is not ES or MES.
The "Supports" and "Resistances" fields are both empty.
A data formatting error is detected (e.g., non-numeric characters, incomplete zones, etc.).
How It Works
For optimal resource efficiency and performance, the script executes all computationally intensive tasks only once, on the very first bar when the chart loads (if barstate.isfirst).
One-time Parsing: The parsing, splitting, and conversion of the text (string) formatted levels, which are provided in the settings, occurs only once.
Persistent Objects: The lines (line.new), fills (linefill.new), and price labels (label.new) that mark the levels are all persistent graphical objects. The script creates these on the first bar and stores their references in arrays declared with the var keyword.
No Redrawing: On subsequent bars, the indicator does not delete and redraw these objects. It merely updates the x-axis position of the existing lines and labels (line.set_x1, line.set_x2, label.set_x) on the last bar (if barstate.islast), ensuring they always remain on the right edge of the chart, following the formation of new bars.
By default, TradingView charts have a limit of 50 lines and 50 labels. Given that the number of levels often exceeds this, the script's drawing logic is as follows:
The number of displayable lines and labels has been increased (to 500) in the indicator's declaration line.
The script applies a prioritized order when drawing levels and labels. Major levels have priority over minor levels during drawing.
Disclaimer
This indicator is provided for educational and informational purposes only. It is not financial advice.
Trading involves substantial risk of loss and is not suitable for every investor. Past performance shown in examples is not indicative of future results.
The indicator provides signals and calculations, but trading decisions are solely your responsibility. Always:
Test strategies on paper before using real money
Never risk more than you can afford to lose
Understand that all trading involves risk
Consider seeking advice from a licensed financial advisor
The publisher makes no guarantees regarding accuracy, profitability, or performance. Use at your own risk.