ADX Cross 30 & EMA 20 Touch SignalHOLY GRAIL: ADX Cross 30 & EMA 20 Touch Signal
This TradingView script is a powerful tool designed to help traders identify high-probability trend-following opportunities, drawing inspiration from the renowned "HOLY GRAIL" strategy outlined in the Street Smarts book by Linda Bradford Raschke and Laurence A. Connors. It combines the Average Directional Index (ADX) with the Exponential Moving Average (EMA) to generate precise trading signals directly on your chart.
How it Works (Inspired by the "HOLY GRAIL" Strategy):
The script generates a "Buy Signal" when two crucial technical conditions align simultaneously on the same price bar, mirroring the core principles of the "HOLY GRAIL" setup:
ADX Trend Strength Confirmation (ADX Cross Above 30):
The ADX indicator, which measures the strength of a trend (regardless of its direction), crosses above the 30 level.
An ADX reading above 30 typically indicates that a strong and well-defined trend is developing and gaining momentum. This condition filters out choppy or range-bound markets, focusing on clear trending environments, as emphasized in the "HOLY GRAIL" approach.
Price Retest/Interaction with EMA (EMA 20 Touch):
The current price candle (its body or wick) touches or encompasses the 20-period Exponential Moving Average (EMA). This means the low of the candle is at or below the EMA, and the high of the candle is at or above the EMA.
This condition identifies moments within a strong trend where price retraces or consolidates to interact with the EMA, which often acts as a dynamic support or resistance level. This interaction, a key component of the "HOLY GRAIL" strategy, can signal a potential entry point for a continuation of the prevailing trend.
The combination of these two conditions aims to provide a robust signal for trend continuation, ensuring both strong trend presence and a favorable entry point, as per the strategy's design.
Key Features & On-Chart Visuals:
Customizable Parameters:
ADX Length: Easily adjust the lookback period for the ADX calculation (default: 14).
EMA Length: Customize the length of the Exponential Moving Average (default: 20).
20 EMA Plot: The 20-period EMA is clearly plotted on your main price chart as a prominent dark blue line, making it easy to observe price interaction.
Combined Buy Signal: When both the ADX cross above 30 and the EMA touch conditions are met, a green upward-pointing triangle (▲) is displayed directly below the relevant price bar, indicating a confirmed buy signal.
Background Highlight: The background of the chart is subtly highlighted in a soft green color when a combined buy signal is active, drawing your attention to the signal bar for quick identification.
Debugging & Analysis Aids:
To assist traders in understanding the individual components of the signal and for fine-tuning the indicator, the script includes two helpful debugging plots:
"ADX Cross Only" (Orange Circle (●) above bar): This small orange circle appears above the price bar when only the ADX has crossed above 30, but the EMA touch condition was not met. This helps identify periods of strong trend development without an EMA retest.
"EMA Touch Only" (Purple Square (■) above bar): A small purple square is plotted above the price bar when only the price has touched the 20 EMA, but the ADX has not yet crossed above 30. This highlights instances of EMA interaction without strong trend confirmation.
These debugging plots are invaluable for refining your understanding of the script's logic and for optimizing input parameters for different market conditions.
Important Recommendation for Users:
To gain a deeper insight into the ADX and its directional components (+DI and -DI) and to cross-reference the script's signals, it is strongly recommended to:
Navigate to your TradingView chart.
Click on the "Indicators" or "fx" icon.
Search for and add the built-in "ADX / DMI" indicator to a separate pane below your main chart.
Ensure that its "Length" setting is synchronized with the ADX Length input you are using in this custom script (default 14).
This will provide a clear visual representation of the ADX indicator itself, which is crucial for comprehensive analysis and informed decision-making based on the "HOLY GRAIL" principles.
ابحث في النصوص البرمجية عن "the strat"
Enhanced Daily Sentiment & Auction Area Trading StrategyDetermine Daily Sentiment (Anchor Chart - Daily TF):
Analyze Yesterday's Daily Candle: Look at the previous day's daily candlestick (high, low, open, close). This is the "most important information."
Establish Bias: If yesterday's candle was bullish (closed higher), the bias for today is generally long (approx. 80% of the time). If bearish, the bias is short.
Moving Average Context: Note if the daily price is above or below its short-term moving average (e.g., 21 or 50 MA). This should align with the candle's bias (e.g., bullish daily candle above its MA).
Pre-Market & Opening Analysis (Information Gathering):
Check for Gaps: Observe if the market is gapping up or down in the pre-market session relative to yesterday's close. This provides an early clue to current sentiment.
Consider Overall Sentiment: Briefly factor in relevant news or overarching market sentiment (e.g., data releases, overall market feeling from yields, gold etc.). Trading Window: Focus primarily on trading within the first hour of the U.S. market open, as this is when volatility is typically highest, which the strategy relies on.
Setup 5-Minute Chart for Execution (Trading TF - 5-min):
Apply Moving Average: Use the same short-term moving average (e.g., 21 or 50 MA) as on the daily chart.
Seek Alignment (Crucial): The 5-minute chart's trend and price action relative to its MA must align with the daily chart's bias and MA relationship.
If Daily bias is LONG (price above daily MA), the 5-minute chart should also show price establishing itself above its 5-min MA, ideally with a similar "45-degree angle" uptrend.
If Daily bias is SHORT (price below daily MA), the 5-minute chart should also show price establishing itself below its 5-min MA, with a similar downtrend. If there's no clear alignment between the daily and 5-minute chart structure/MA, do not trade.
Identify the "Auction Area" (Value/Congestion) on the 5-Minute Chart:
This is a recent area of congestion, a small support/resistance flip, or where price has paused, consolidated, and is retesting, often near the 5-minute MA.
Uptrend (Long Bias): Look for a pullback (a small "V" shape dip) towards the 5-minute MA or a recent small resistance-turned-support area. This is the "auction retest" before a potential breakout higher.
Downtrend (Short Bias): Look for a pullback rally (an inverted "V" shape) towards the 5-minute MA or a recent small support-turned-resistance area.

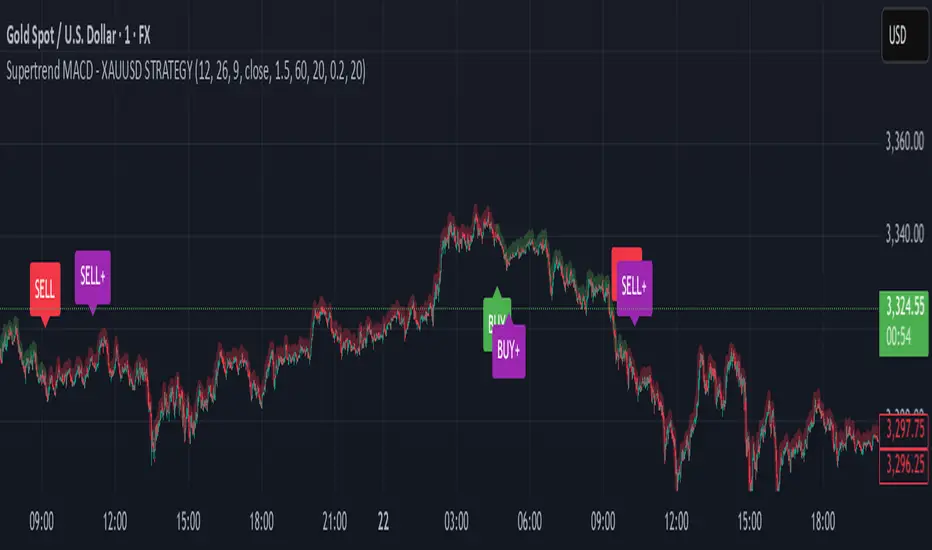
Supertrend MACD - XAUUSD STRATEGY 🔶 Supertrend MACD - XAUUSD STRATEGY (v6) (XAUUSD ONLY FOR NOW)
A high-performance, multi-filtered MACD-based strategy tailored for XAUUSD (Gold) traders seeking precision entries during trending conditions. This indicator intelligently combines multiple technical layers—momentum, trend strength, volatility, and market structure—to help identify high-probability trade setups with improved reliability.
🧠 Core Logic & Features Explained:
🔸 MACD Momentum Engine
At the heart of the strategy lies the traditional MACD indicator (Moving Average Convergence Divergence), calculating the difference between two EMAs (fast and slow) and smoothing it with a signal line.
Buy Signal: Triggered when the MACD line crosses above the signal line.
Sell Signal: Triggered when the MACD line crosses below the signal line.
These signals are the foundation, but only the beginning of a layered decision-making process.
🔸 Higher Timeframe (HTF) Trend Confirmation
To filter out noise and false breakouts, the indicator references MACD values from a higher timeframe (configurable by the user). This powerful multi-timeframe approach ensures that entries only occur in alignment with the dominant macro-trend.
Ensures entries are not taken counter to larger market movements.
Helps identify momentum continuation setups and avoid chop.
🔸 Support Arrow Display (Optional)
For visual traders, an option to display support arrows on the chart can be enabled. These assist in identifying visually intuitive entry points and enhance situational awareness.
⚙️ User-Customizable Inputs:
MACD Settings: Fast EMA, Slow EMA, Signal EMA lengths.
Signal Offset: For visual alignment and candle matching.
HTF MACD Settings: Select any timeframe for higher timeframe filtering.
ATR and ADX Thresholds: Fine-tune filters to match your trading style.
Structure Break Lookback: Adjust BOS+ logic sensitivity.
Arrow Toggles: Enable or disable visual support arrows as needed.
THIS indicator is in its alpha stage, currently it only works on XAUUSD pairs, i plan to update this indicator so that it functions on every single pair available on Trading view
Another note, the signals given only become solid after the second the candlestick, after this the signal becomes solid. REPAINTING CAN HAPPEN AFTER THE FIRST CANDLE STICK OF THE SIGNAL BUT NOT AFTER THE SECOND
As this indicator is only in its alpha stage it should be used as such, every person is responsible for there own personal investments
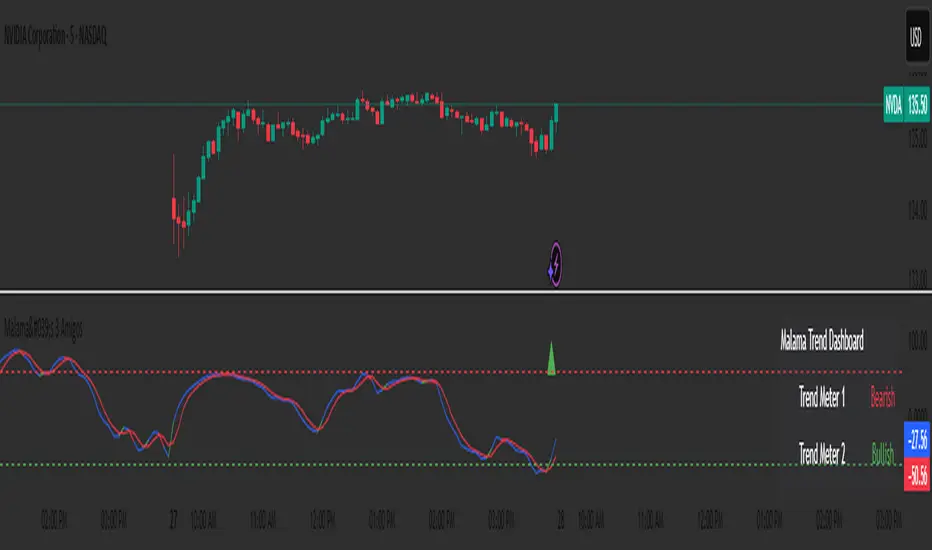
Malama's 3 AmigosThe "Malama's 3 Amigos" is an original script that combines several well-known technical indicators, including MACD, RSI, and wave trend analysis, to create a robust trading signal generator. The integration of these components allows for a more nuanced understanding of market dynamics:
MACD and RSI: These indicators provide insights into momentum and trend direction, helping to identify potential reversals or continuations.
Wave Trend Analysis: This component adds a layer of volatility assessment, allowing traders to gauge overbought and oversold conditions.
Volume Filtering: By incorporating volume analysis, the script ensures that signals are validated by market participation, reducing the likelihood of false signals.
This script stands out from public open-source alternatives by offering a unique combination of trend meters and wave trend analysis, tailored for traders seeking a comprehensive dashboard for market analysis.
Detailed Methodology ("How It Works")
Core Logic
Wave Trend Calculation: The script employs a wave trend calculation that utilizes exponential moving averages (EMAs) to assess price momentum. The wave trend indicator generates two lines, which are used to identify potential bullish and bearish conditions based on crossovers and overbought/oversold levels.
Trend Meter Signals: The script features three customizable trend meters that can be set to various configurations (e.g., MACD crossovers, RSI conditions). Each trend meter evaluates market conditions and provides a bullish or bearish signal based on the selected method.
Signal Generation:
Long Entry Signal: A long signal is generated when all three trend meters indicate bullish conditions, the wave trend shows a bullish crossover, the RSI delta is above a specified threshold, and the price is above a defined moving average.
Short Entry Signal: Conversely, a short signal is triggered when all trend meters indicate bearish conditions, the wave trend shows a bearish crossover, the RSI delta is below a specified threshold, and the price is below a defined moving average.
Signal Strength Calculation: The script calculates the strength of the generated signals by summing the number of bullish or bearish conditions met. This provides traders with a clear indication of the reliability of the signal.
Backtesting and Probability Features
The script does not include built-in backtesting features; however, traders can manually backtest the signals generated by the indicator. It is recommended to consider realistic trading conditions, including commission, slippage, and risk management parameters, when evaluating the effectiveness of the signals.
Strategy Results and Risk Management
The "Malama's 3 Amigos" indicator does not inherently include backtesting capabilities, but traders are encouraged to apply the following assumptions for effective risk management:
Commission and Slippage: Traders should account for realistic trading costs when evaluating performance.
Account Sizing: It is advisable to limit risk to 5-10% of equity per trade.
Trade Frequency: A sufficient number of trades should be executed to validate the strategy's effectiveness.
Default Settings
The default settings are designed to provide a balanced approach to trading. Traders can customize parameters such as lookback periods for moving averages and volume filters to suit their trading style.
User Settings and Customization
The script includes several user-customizable inputs:
Trend Meter Selections: Traders can choose from various trend meter configurations to tailor the indicator to their preferences.
Volume Filter: Users can enable or disable volume filtering and set the lookback period for volume analysis.
RSI Delta Threshold: This parameter allows traders to define the sensitivity of the RSI delta condition for signal generation.
Moving Average Types and Lengths: Traders can select between Simple Moving Averages (SMA) and Exponential Moving Averages (EMA) and adjust their lengths.
These settings influence the behavior of the indicator and the signals generated, allowing for a personalized trading experience.
Visualizations and Chart Setup
The "Malama's 3 Amigos" indicator plots several key elements on the chart:
Wave Trend Lines: Two wave trend lines are displayed, with color coding to indicate bullish (green) and bearish (red) conditions.
Signal Markers: Buy (green triangle) and sell (red triangle) signals are plotted on the chart to indicate potential entry points.
Info Panel: An information panel can be displayed on the chart, providing real-time updates on the status of trend meters, wave trend conditions, and entry signals.
The visual elements are designed to be clear and concise, ensuring that traders can quickly interpret the information presented.
Composite Index Divergences This is an automated trading strategy for TradingView designed to trade based on divergences between the price and a custom technical indicator called the "CMB Composite Index."
Main Functions:
"Composite Index Divergence" Calculation:
It generates a composite index by combining information from two RSIs (a long-period RSI and its rate of change, and a smoothed short-period RSI). This index is the primary tool for divergence detection.
Divergence Detection:
It identifies four types of divergences:
Regular Bullish: Lower lows in price but higher lows on the "CMB Composite Index."
Regular Bearish: Higher highs in price but lower highs on the "CMB Composite Index."
Hidden Bullish: Higher lows in price but lower lows on the "CMB Composite Index."
Hidden Bearish: Lower highs in price but higher highs on the "CMB Composite Index."
It uses pivot points (significant highs and lows) of both the price and the indicator to find these divergences within a user-defined range of bars.
Entry and Exit Logic:
It enters long (buy) or short (sell) positions when one of the user-selected divergences is confirmed and no position is currently open.
It manages trades with:
Stop Loss (SL): Based on a multiple of the ATR (Average True Range).
Take Profit (TP): Also based on a multiple of the ATR.
Close on Opposite Signal: Optionally, it can close a position if a divergence signal in the opposite direction appears.
Position size is calculated as a percentage of available equity.
Orders are processed at the close of the bar where the signal is confirmed.
Visualization (Optional):
It can draw lines on the chart to highlight the detected divergences.
It displays labels to identify the type of divergence.
It plots the Stop Loss and Take Profit levels for active trades.
In essence, the strategy looks for discrepancies between price action and momentum to generate trading signals, while managing risk with volatility-based Stop Loss and Take Profit levels.

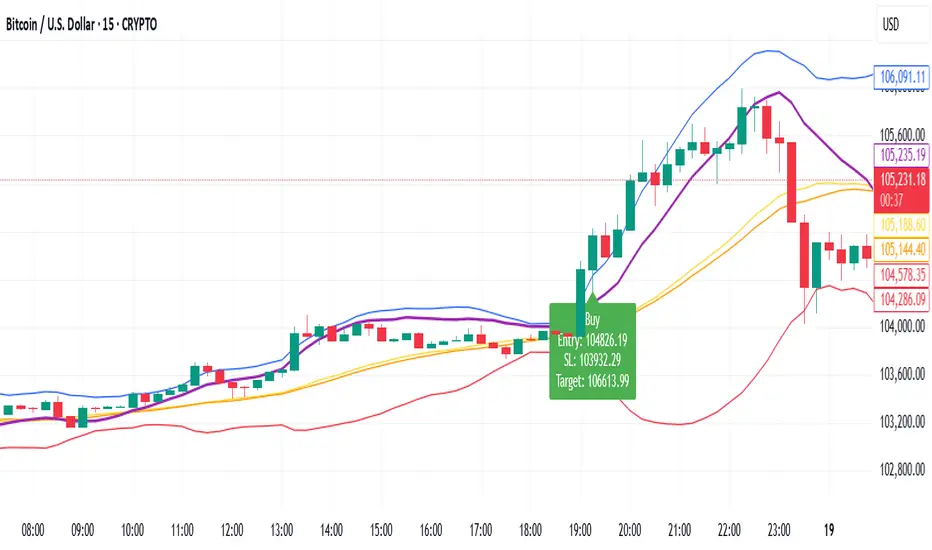
Enhanced BTC Order Block IndicatorThe script you provided is an "Enhanced BTC Order Block Indicator" written in Pine Script v5 for TradingView. It is designed to identify and visually mark Order Blocks (OBs) on a Bitcoin (BTC) price chart, specifically tailored for a high-frequency scalping strategy on the 5-minute (M5) timeframe. Order Blocks are key price zones where institutional traders are likely to have placed significant buy or sell orders, making them high-probability areas for reversals or continuations. The script incorporates customizable filters, visual indicators, and alert functionality to assist traders in executing the strategy outlined earlier.
Key Features and Functionality
Purpose:
The indicator detects bullish Order Blocks (buy zones) and bearish Order Blocks (sell zones) based on a predefined percentage price movement (default 0.5–1%) and volume confirmation.
It marks these zones on the chart with colored boxes and provides alerts when an OB is detected.
User-Configurable Inputs:
Price Move Range: minMovePercent (default 0.5%) and maxMovePercent (default 1.0%) define the acceptable price movement range for identifying OBs.
Volume Threshold: volumeThreshold (default 1.5x average volume) ensures OB detection is backed by significant trading activity.
Lookback Period: lookback (default 10 candles) determines how many previous candles are analyzed to find the last candle before a strong move.
Wick/Body Option: useWick (default false) allows users to choose whether the OB zone is based on the candle’s wick or body.
Colors: bullishOBColor (default green) and bearishOBColor (default red) set the visual appearance of OB boxes.
Box Extension: boxExtension (default 100 bars) controls how far the OB box extends to the right on the chart.
RSI Filter: useRSI (default true) enables an RSI filter, with rsiLength (default 14), rsiBullishThreshold (default 50), and rsiBearishThreshold (default 50) for trend confirmation.
M15 Support/Resistance: useSR (default true) and srLookback (default 20) integrate M15 timeframe swing highs and lows for additional OB validation.
Core Logic:
Bullish OB Detection: Identifies a strong upward move (0.5–1%) with volume above the threshold. It then looks back to the last bearish candle before the move to define the OB zone. RSI > 50 and proximity to M15 support/resistance (optional) enhance confirmation.
Bearish OB Detection: Identifies a strong downward move (0.5–1%) with volume confirmation, tracing back to the last bullish candle. RSI < 50 and M15 resistance proximity (optional) add validation.
The OB zone is drawn as a rectangle from the high to low of the identified candle, extended rightward.
Visual Output:
Boxes: Uses box.new to draw OB zones, with left set to the previous bar (bar_index ), right extended by boxExtension, top and bottom defined by the OB’s high and low prices. Each box includes a text label ("Bullish OB" or "Bearish OB") and is semi-transparent.
Colors distinguish between bullish (green) and bearish (red) OBs.
Alerts:
Global alertcondition definitions trigger notifications for "Bullish OB Detected" and "Bearish OB Detected" when the respective conditions are met, displaying the current close price in the message.
Helper Functions:
f_priceChangePercent: Calculates the percentage price change between open and close prices.
isNearSR: Checks if the price is within 0.2% of M15 swing highs or lows for support/resistance confluence.
How It Works
The script runs on each candle, evaluating the current price action against the user-defined criteria.
When a bullish or bearish move is detected (meeting the percentage, volume, RSI, and S/R conditions), it identifies the preceding candle to define the OB zone.
The OB is then visualized on the chart, and an alert is triggered if configured in TradingView.
Use Case
This indicator is tailored for your BTC scalping strategy, where trades last 1–15 minutes targeting 0.3–0.5% gains. It helps traders spot institutional order zones on the M5 chart, confirmed by secondary M1 analysis, and integrates with your use of EMAs, RSI, and volume. The customizable settings allow adaptation to varying market conditions or personal preferences.
Limitations
The M15 S/R detection is simplified (using swing highs/lows), which may not always align perfectly with manual support/resistance levels.
Alerts depend on TradingView’s alert system and require manual setup.
Performance may vary with high volatility or low-volume periods, necessitating parameter adjustments.

Bollinger Band StrategyDescription of the Bollinger Band Breakout Strategy
This trading strategy, credited to Siddhart Bhanushali, is a momentum-based approach that uses Bollinger Bands and a 22-period Simple Moving Average (SMA) to identify high-probability breakout trades. It focuses on detecting periods of low volatility (contraction) followed by high volatility (expansion) to enter trades with a favorable risk-reward ratio. The strategy is designed to capture significant price movements in trending markets, with clear rules for entry, stop loss, and profit targets.
Strategy Overview
The strategy generates buy and sell signals based on specific conditions involving the 22-period SMA and Bollinger Bands. It aims to enter trades when the price breaks out of a consolidation phase, confirmed by the direction of the SMA and the behavior of a green or red candle relative to the Bollinger Bands. The minimum target for each trade is a 1:2 risk-reward ratio.
Credit
This strategy is credited to Siddhart Bhanushali, who designed it to leverage Bollinger Band breakouts in trending markets, providing a clear and systematic approach to trading with defined risk-reward parameters.
LANZ Strategy 4.0🔷 LANZ Strategy 4.0 — Trend Impulse Detection with Risk Management
LANZ Strategy 4.0 is a multi-indicator trend strategy designed for short to medium-term trading on any asset or timeframe. It combines Parabolic SAR, Supertrend, ADX, and time zone highlighting to detect and confirm trend impulses, while managing entries with dynamic Stop Loss (SL) and Take Profit (TP) levels.
🧠 Core Components:
Parabolic SAR: Identifies short-term trend reversals.
Supertrend: Highlights trend continuation zones.
ADX Filter: Ensures trend strength by filtering entries when ADX exceeds a defined threshold.
Impulse Detection Logic: Detects and confirms movement impulses with a counter, only generating trade signals on confirmed sequences.
Risk Management: Calculates dynamic SL/TP with a default risk-reward ratio of 1:2, minimum SL of 4 pts, and maximum of 12 pts.
📊 Visual Features:
Trend lines from Supertrend and SAR.
Colored background zones for different sessions (Asia, NY).
Labels and lines for entry, SL, and TP.
Movement number labels help visualize impulse progression.
Alerts when a new impulse is confirmed.
⚙️ How It Works:
The strategy waits for a confirmed impulse (i.e., change in SAR + Supertrend + ADX filter).
Once a valid impulse is confirmed:
A trade signal (BUY/SELL) is shown.
SL and TP levels are calculated and drawn.
The script monitors live price to determine if SL or TP is hit.
Impulse counter advances to label movement progression.
🔔 Alerts:
You will receive an alert each time a new valid impulse is confirmed, indicating a potential trading opportunity.
📝 Notes:
Script is intended for discretionary or assisted trading, not automated execution.
Works best during active sessions with visible trend direction.
You can adjust ATR period, multiplier, SL padding, and impulse thresholds.
Credits:
Developed by LANZ combines established technical indicators and original impulse-count logic.

MTS📊 MTS (Murrey Math System) Trading Strategy for TradingView 📊
Introduction:
This script implements the Murrey Math System (MTS), a market analysis tool based on a set of pivot points and price ranges, designed to help traders identify key levels of support and resistance.
MTS calculates key price levels based on historical price swings and helps identify price targets, stop-loss levels, and potential breakout zones.
The strategy also includes an adaptive bias panel, showing buy or sell suggestions based on current price action relative to Murrey Math levels.
Key Components:
1. Pivot Calculation and Conditions:
Pivot Lookback & Spikeyness Index:
The pivots: lookback/forward input defines how far back (and forward) the script looks to identify potential pivot points (high and low). A smaller value focuses on more recent swings, while larger values consider a broader range.
The Spikeyness Index (atrMult) allows you to adjust sensitivity to market spikes, utilizing the Average True Range (ATR) to detect sharp price movements that could indicate potential turning points.
Pivot Conditions:
isPivHigh and isPivLow detect local high and low pivot points, respectively.
Spiky Conditions: The spikyH and spikyL conditions filter out pivots that do not meet the spikiness criteria, which is based on ATR and moving averages.
2. Swing High and Swing Low Identification:
The script identifies and stores previous swing highs (HR_prev) and lows (LR_prev), updating them based on the current market structure.
3. Proprietary Calculation:
The propCalc input enables a proprietary calculation method for determining higher or lower levels beyond the typical Murrey Math levels, offering a more adaptive approach to price targets and support/resistance levels.
4. Murrey Math Lines (MML):
MML Calculation:
The code calculates a set of Murrey Math Lines (EightEight, FourEight, ZeroEight), which are key price levels based on the range of the price over a given time period. These levels represent major support and resistance zones, with the EightEight line indicating extremely overbought conditions and ZeroEight signaling deeply oversold conditions.
Level and Extension Lines:
The script also plots additional levels and extensions based on the range between HR and LR, representing key support/resistance levels. These levels are dynamically drawn on the chart, offering clear insights into where price might reverse or break out.
Strategy Logic:
- Breakout and Breakdown:
The Bias Box panel dynamically displays a trade bias, either suggesting to "Buy on Dip" or "Sell on Rise," depending on whether the current price is above or below the midpoint of the Murrey Math range (BEP). This bias is calculated using the market's relationship to the Murrey Math Levels.
- Buy on Dip: When the price is below the midpoint (BEP), suggesting the market is in a buying zone.
- Sell on Rise: When the price is above the midpoint, suggesting the market is in a selling zone.
- Stop-Loss and Target Hints:
The stop-loss (SL) and target levels are dynamically set based on the position relative to HR and LR:
For Buy on Dip: SL is set at LR Low, Target is set at HR High.
For sell on Rise: SL is set at HR Low, Target is set at LR High.
2. Historical and Current Levels:
The script compares the most recent Murrey Math levels with historical levels. This helps identify any shifts or changes in the market structure, enhancing the trader's ability to adapt to new trends.
- Current Levels:
The current levels are drawn from the most recent HR and LR values, with corresponding extensions showing possible breakout or breakdown zones.
- Historical Levels:
Historical levels are drawn in a "ghost" style, helping traders visualize past market conditions and potential support/resistance zones that could still influence price movement.
- Trade Examples:
Example 1: Buy on Dip
a. Scenario:
Price is below the midpoint (BEP), and the bias suggests a buy on dip.
The trader looks for a rebound from the LR Low level, with a target at the HR High.
b. Entry:
Buy when the price reaches the LR Low level.
c. Exit:
Take profit when the price hits the HR High.
d. Stop-Loss:
Place stop-loss at the LR Low.
Example 2: Sell on Rise
a. Scenario:
Price is above the midpoint (BEP), and the bias suggests a sell on rise.
The trader looks for a pullback to the HR Low, with a target at the LR High.
b. Entry:
Sell when the price reaches the HR High level.
c. Exit:
Take profit when the price hits the LR Low.
d. Stop-Loss:
Place stop-loss at the HR Low.
Key Features:
Bias Panel: A table in the top-right corner showing the current market bias (Buy on Dip, Sell on Rise, or Neutral).
Displays real-time trade direction and risk information, such as stop-loss and target hints.
Dynamic Level Adjustment: As the price moves, the script dynamically updates the key levels (HR, LR, and Murrey Math lines), keeping traders aware of the most recent market structure.
Visualization Tools:
The chart is populated with a series of lines and labels that indicate the critical price levels for trading.
Support/Resistance Lines: Each key level is marked with different colors for quick recognition.
Extensions: Additional lines are plotted based on price projections, indicating where the market could potentially move.
Note:
Please note that this is an educational purpose idea, any action/trade taken will be user's own responsibility.
Enjoy!
Regards.

Currency Basket vs USD - Trend & RSI Breakdown📊 Indicator Methodology
Currency Basket vs USD – Trend & Valuation Breakdown
💱 Strategy of Rotating Between USD and the Currency Basket
💰 100% cash strategy – always ready for market crashes.
🟢 Hold USD if the trend indicator shows USD is trending.
🔵 Hold the currency basket (EUR, PLN, CZK, CHF, GBP) if the basket is trending.
✅ This way, you're always on the winning side of the trade, never risking a loss of purchasing power.
📈 Since it's a LONG ONLY, NO LEVERAGE strategy, there are no trading or holding fees, except for a small 0.15% FX fee every few months when the trending currency changes.
📈 Trend Indicator
Uses 5 different indicators working together to determine which asset is in a trend.
👀 On the chart it's visualized as:
➕ Plus symbols indicating trend strength (usually ranges from -4 to +4).
🔺 If USD has a higher trend signal than the basket → Hold USD.
🔻 If the basket has a higher signal → Hold the basket.
🕒 Signals typically last several months and operate on the 3D (3-day) timeframe, giving a high probability of catching macro moves.
💡 Valuation Indicator (Z-scored RSI)
Uses RSI with a length of 30.
Z-scored between -1 to 1.
📉 Interpretation:
-1 for USD = too strong → likely stagnation or reversal.
-1 for Basket = undervalued → likely growth or stabilization.
📊 Displayed as a separate line below the main chart.
📍 A horizontal line at 90 is added on the main chart – helping you quickly see what’s above or below this key reference level.
⚙️ How the Strategy Works in Practice
✅ You update the indicator daily (takes only seconds).
✅ The trend indicator tells you which currency to hold.
✅ The valuation indicator prepares you for possible reversals.
🔄 When the trend shifts, you rotate your full position.
⏳ Trades typically last several months.
📈 Usually generates consistent profits of 2–8%.
💪 It grows your capital while keeping you ready to buy assets during major selloffs.
🔍 Best Usage
Use it as a quick scanner to observe trend or valuation changes.
If a signal appears, validate it using additional trend and valuation indicators.
📌 If most agree, take the position.

CyberCandle SwiftEdgeCyberCandle SwiftEdge
Overview
CyberCandle SwiftEdge is a cutting-edge, AI-inspired trading indicator designed for traders seeking precision and clarity in trend-following and swing trading. Powered by SwiftEdge, it combines Heikin Ashi candles, a gradient-colored Exponential Moving Average (EMA), and a Relative Strength Index (RSI) to deliver clear buy and sell signals. Featuring glowing visuals, dynamic signal icons, and a customizable RSI dashboard in the top-right corner, this script offers a futuristic interface for identifying high-probability trade setups on various timeframes (e.g., 1H, 4H).
What It Does
CyberCandle SwiftEdge integrates three powerful components to generate actionable trading signals:
Heikin Ashi Candles: Smooths price action to highlight trends, reducing market noise and making reversals easier to spot.
Gradient EMA: A 100-period EMA with dynamic color transitions (blue/cyan for uptrends, red/pink for downtrends) to confirm market direction.
RSI Dashboard: A neon-lit display showing RSI levels, indicating overbought (>70), oversold (<30), or neutral (30-70) conditions.
Buy and sell signals are marked with prominent, glowing icons (triangles and arrows) based on trend direction, momentum, and specific Heikin Ashi patterns. The script’s customizable parameters allow traders to tailor the strategy to their preferences, balancing signal frequency and precision.
How It Works
The strategy leverages the synergy of Heikin Ashi, EMA, and RSI to filter trades and highlight opportunities:
Trend Direction: The price must be above the EMA for buy signals (bullish trend) or below for sell signals (bearish trend). The EMA’s gradient color shifts based on its slope, visually reinforcing trend strength.
Momentum Confirmation: RSI must exceed a user-defined threshold (default: 50) for buy signals or fall below it for sell signals, ensuring momentum supports the trade.
Candle Patterns: Buy signals require a green Heikin Ashi candle (close > open), with the two prior candles having minimal upper wicks (≤5% of candle body) and being red (indicating a retracement). Sell signals require a red candle, minimal lower wicks, and two prior green candles.
RSI Dashboard: Positioned in the top-right corner, it features a glowing circle (red for overbought, green for oversold, blue for neutral), the current RSI value, and a status indicator (triangle for extremes, square for neutral). This provides instant momentum insights without cluttering the chart.
By combining Heikin Ashi’s trend clarity, EMA’s directional filter, and RSI’s momentum validation, CyberCandle SwiftEdge minimizes false signals and highlights trades with strong potential. Its vibrant, AI-like visuals make it easy to interpret at a glance.
How to Use It
Add to Chart: In TradingView, search for "CyberCandle SwiftEdge" and add it to your chart. Set the chart to Heikin Ashi candles for optimal compatibility.
Interpret Signals:
Buy Signal: Large green triangles and arrows appear below candles when the price is above the EMA, RSI is above the buy threshold (default: 50), and conditions for a bullish retracement are met. Consider entering a long position with a 1:2 risk/reward ratio.
Sell Signal: Large red triangles and arrows appear above candles when the price is below the EMA, RSI is below the sell threshold (default: 50), and conditions for a bearish retracement are met. Consider entering a short position.
RSI Dashboard: Monitor the top-right dashboard. A red circle (RSI > 70) suggests caution for buys, a green circle (RSI < 30) indicates potential buying opportunities, and a blue circle (RSI 30-70) signals neutrality.
Customize Parameters: Open the indicator’s settings to adjust:
EMA Length (default: 100): Increase (e.g., 200) for longer-term trends or decrease (e.g., 50) for shorter-term sensitivity.
RSI Length (default: 14): Adjust for more (e.g., 7) or less (e.g., 21) responsive momentum signals.
RSI Buy/Sell Thresholds (default: 50): Set higher (e.g., 55) for buys or lower (e.g., 45) for sells to require stronger momentum.
Wick Tolerance (default: 0.05): Increase (e.g., 0.1) to allow larger wicks, generating more signals, or decrease (e.g., 0.02) for stricter conditions.
Require Retracement (default: true): Disable to remove the two-candle retracement requirement, increasing signal frequency.
Trading: Use signals in conjunction with the RSI dashboard and market context. For example, avoid buy signals if the RSI dashboard is red (overbought). Always apply proper risk management, such as setting stop-losses based on recent lows/highs.
What Makes It Original
CyberCandle SwiftEdge stands out due to its futuristic, AI-inspired visual design and user-friendly customization:
Neon Aesthetics: Glowing Heikin Ashi candles, gradient EMA, and dynamic signal icons (triangles and arrows) with RSI-driven transparency create a high-tech, immersive experience.
RSI Dashboard: A compact, top-right display with a neon circle, RSI value, and adaptive status indicator (triangle/square) provides instant momentum insights without cluttering the chart.
Customizability: Users can fine-tune EMA length, RSI parameters, wick tolerance, and retracement requirements via TradingView’s settings, balancing signal frequency and precision.
Integrated Approach: The synergy of Heikin Ashi’s trend clarity, EMA’s directional strength, and RSI’s momentum validation offers a cohesive strategy that reduces false signals.
Why This Combination?
The script combines Heikin Ashi, EMA, and RSI for a complementary effect:
Heikin Ashi smooths price fluctuations, making it ideal for identifying sustained trends and retracements, which are critical for the strategy’s signal logic.
EMA provides a reliable trend filter, ensuring signals align with the broader market direction. Its gradient color enhances visual trend recognition.
RSI adds momentum context, confirming that signals occur during favorable conditions (e.g., RSI > 50 for buys). The dashboard makes RSI intuitive, even for non-technical users.
Together, these components create a balanced system that captures trend reversals after retracements, validated by momentum, with a visually engaging interface that simplifies decision-making.
Tips
Best used on volatile assets (e.g., BTC/USD, EUR/USD) and higher timeframes (1H, 4H) for clearer trends.
Experiment with parameters in the settings to match your trading style (e.g., increase wick tolerance for more signals).
Combine with other analysis (e.g., support/resistance) for higher-confidence trades.
Note
This indicator is for informational purposes and does not guarantee profits. Always backtest and use proper risk management before trading.

Bullish and Bearish Breakout Alert for Gold Futures PullbackBelow is a Pine Script (version 6) for TradingView that includes both bullish and bearish breakout conditions for my intraday trading strategy on micro gold futures (MGC). The strategy focuses on scalping two-legged pullbacks to the 20 EMA or key levels with breakout confirmation, tailored for the Apex Trader Funding $300K challenge. The script accounts for the Daily Sentiment Index (DSI) at 87 (overbought, favoring pullbacks). It generates alerts for placing stop-limit orders for 175 MGC contracts, ensuring compliance with Apex’s rules ($7,500 trailing threshold, $20,000 profit target, 4:59 PM ET close).
Script Requirements
Version: Pine Script v6 (latest for TradingView, April 2025).
Purpose:
Bullish: Alert when price breaks above a rejection candle’s high after a two-legged pullback to the 20 EMA in a bullish trend (price above 20 EMA, VWAP, higher highs/lows).
Bearish: Alert when price breaks below a rejection candle’s low after a two-legged pullback to the 20 EMA in a bearish trend (price below 20 EMA, VWAP, lower highs/lows).
Context: 5-minute MGC chart, U.S. session (8:30 AM–12:00 PM ET), avoiding overbought breakouts above $3,450 (DSI 87).
Output: Alerts for stop-limit orders (e.g., “Buy: Stop=$3,377, Limit=$3,377.10” or “Sell: Stop=$3,447, Limit=$3,446.90”), quantity 175 MGC.
Apex Compliance: 175-contract limit, stop-losses, one-directional news trading, close by 4:59 PM ET.
How to Use the Script in TradingView
1. Add Script:
Open TradingView (tradingview.com).
Go to “Pine Editor” (bottom panel).
Copy the script from the content.
Click “Add to Chart” to apply to your MGC 5-minute chart .
2. Configure Chart:
Symbol: MGC (Micro Gold Futures, CME, via Tradovate/Apex data feed).
Timeframe: 5-minute (entries), 15-minute (trend confirmation, manually check).
Indicators: Script plots 20 EMA and VWAP; add RSI (14) and volume manually if needed .
3. Set Alerts:
Click the “Alert” icon (bell).
Add two alerts:
Bullish Breakout: Condition = “Bullish Breakout Alert for Gold Futures Pullback,” trigger = “Once Per Bar Close.”
Bearish Breakout: Condition = “Bearish Breakout Alert for Gold Futures Pullback,” trigger = “Once Per Bar Close.”
Customize messages (default provided) and set notifications (e.g., TradingView app, SMS).
Example: Bullish alert at $3,377 prompts “Stop=$3,377, Limit=$3,377.10, Quantity=175 MGC” .
4. Execute Orders:
Bullish:
Alert triggers (e.g., stop $3,377, limit $3,377.10).
In TradingView’s “Order Panel,” select “Stop-Limit,” set:
Stop Price: $3,377.
Limit Price: $3,377.10.
Quantity: 175 MGC.
Direction: Buy.
Confirm via Tradovate.
Add bracket order (OCO):
Stop-loss: Sell 175 at $3,376.20 (8 ticks, $1,400 risk).
Take-profit: Sell 87 at $3,378 (1:1), 88 at $3,379 (2:1) .
Bearish:
Alert triggers (e.g., stop $3,447, limit $3,446.90).
Select “Stop-Limit,” set:
Stop Price: $3,447.
Limit Price: $3,446.90.
Quantity: 175 MGC.
Direction: Sell.
Confirm via Tradovate.
Add bracket order:
Stop-loss: Buy 175 at $3,447.80 (8 ticks, $1,400 risk).
Take-profit: Buy 87 at $3,446 (1:1), 88 at $3,445 (2:1) .
5. Monitor:
Green triangles (bullish) or red triangles (bearish) confirm signals.
Avoid bullish entries above $3,450 (DSI 87, overbought) or bearish entries below $3,296 (support) .
Close trades by 4:59 PM ET (set 4:50 PM alert) .

Mingo Smart Entry Master 1H-15M - HTF BOS Zones + TP/SL📛 Script Title:
Smart Entry Master 1H–15M – HTF BOS Zones + TP/SL + Dashboard
🧠 What This Script Does:
This script is a higher-timeframe smart entry strategy designed to:
Detect Break of Structure (BOS) on the 1-hour timeframe
Draw Buy/Sell zones automatically on the chart
Provide clear SL & TP lines for trades
Use optional Smart Sell Detection to improve signal quality
Show a dashboard with live signal status
Keep the chart clean by removing old zones and labels
Ideal for intraday swing traders and confirmation-based scalpers looking to trade based on HTF structure + clean zone visualization.
📊 How the Strategy Works:
1. 🧱 Break of Structure (BOS) Detection (1H)
Script uses 1-hour swing highs/lows (swingLen) to define structure
If the 1H candle closes above a swing high → Buy Setup
If the 1H candle closes below a swing low → Sell Setup
🧠 Optional: Smart Sell Detection
Adds a buffer: compares close to lowest low in a lookback window (to reduce fake sells)
🔥 How to Use This Script in Real Trading:
Use on 15M chart to trade, but zones are based on 1H structure
When a Buy or Sell zone appears, check:
Is price tapping into the zone?
Did a clean BOS occur?
SL/TP lines give a ready-made trade plan
Wait for confirmation (price reaction, candle pattern, volume spike)
Set your alert for auto-trading or manual entry

ICT Liquidity Sweep MAX RETRI (ALERT)Strategy Description: SMC + ICT Reversal Sniper | 5-Min | R2 TP
This strategy applies Smart Money Concepts (SMC) and ICT methodology to identify high-probability reversal trades using a clean, rule-based system designed for the 5-minute timeframe.
⸻
Core Logic:
• Liquidity Sweep: Identifies stop hunts beyond recent swing highs/lows using a configurable lookback window.
• Break of Structure (BOS): Validates a directional shift after the sweep.
• Fixed R2 Risk-Reward: Entry is followed by a 2:1 take-profit target. Stop loss is set at the sweep candle’s high/low.
• No Entry Between 8 PM–12 AM NY Time: Avoids the manipulation-prone and illiquid zone.
• Discreet SL Handling: SL hits close trades silently — no labels or visuals.
⸻
Entry Precision & Timing Notes:
• The strategy may occasionally fire before a confirmed liquidity sweep — this is expected. If a sweep occurs later, you may still re-enter toward equilibrium, with take profit also targeted at equilibrium.
• Alerts or trades that trigger near 9:30 AM NY often align with real direction, but this time can be volatile.
• For more reliable and lower-risk entries, focus on the 1:30 PM to 2:00 PM silver bullet window, which tends to produce cleaner setups with more favorable flow. 🖤

Heiken Ashi Supertrend ADXHeiken Ashi Supertrend ADX Indicator
Overview
This indicator combines the power of Heiken Ashi candles, Supertrend indicator, and ADX filter to identify strong trend movements across multiple timeframes. Designed primarily for the cryptocurrency market but adaptable to any tradable asset, this system focuses on capturing momentum in established trends while employing a sophisticated triple-layer stop loss mechanism to protect capital and secure profits.
Strategy Mechanics
Entry Signals
The strategy uses a unique blend of technical signals to identify high-probability trade entries:
Heiken Ashi Candles: Looks specifically for Heiken Ashi candles with minimal or no wicks, which signal strong momentum and trend continuation. These "full-bodied" candles represent periods where price moved decisively in one direction with minimal retracement. These are overlayed onto normal candes for more accuarte signalling and plotting
Supertrend Filter: Confirms the underlying trend direction using the Supertrend indicator (default factor: 3.0, ATR period: 10). Entries are aligned with the prevailing Supertrend direction.
ADX Filter (Optional) : Can be enabled to focus only on stronger trending conditions, filtering out choppy or ranging markets. When enabled, trades only trigger when ADX is above the specified threshold (default: 25).
Exit Signals
Positions are closed when either:
An opposing signal appears (Heiken Ashi candle with no wick in the opposite direction)
Any of the three stop loss mechanisms are triggered
Triple-Layer Stop Loss System
The strategy employs a sophisticated three-tier stop loss approach:
ATR Trailing Stop: Adapts to market volatility and locks in profits as the trend extends. This stop moves in the direction of the trade, capturing profit without exiting too early during normal price fluctuations.
Swing Point Stop: Uses natural market structure (recent highs/lows over a lookback period) to place stops at logical support/resistance levels, honoring the market's own rhythm.
Insurance Stop: A percentage-based safety net that protects against sudden adverse moves immediately after entry. This is particularly valuable when the swing point stop might be positioned too far from entry, providing immediate capital protection.
Optimization Features
Customizable Filters : All components (Supertrend, ADX) can be enabled/disabled to adapt to different market conditions
Adjustable Parameters : Fine-tune ATR periods, Supertrend factors, and ADX thresholds
Flexible Stop Loss Settings : Each of the three stop loss mechanisms can be individually enabled/disabled with customizable parameters
Best Practices for Implementation
[Recommended Timeframes : Works best on 4-hour charts and above, where trends develop more reliably
Market Conditions: Performs well across various market conditions due to the ADX filter's ability to identify meaningful trends
Performance Characteristics
When properly optimized, this has demonstrated profit factors exceeding 3 in backtesting. The approach typically produces generous winners while limiting losses through its multi-layered stop loss system. The ATR trailing stop is particularly effective at capturing extended trends, while the insurance stop provides immediate protection against adverse moves.
The visual components on the chart make it easy to follow the strategy's logic, with position status, entry prices, and current stop levels clearly displayed.
This indicator represents a complete trading system with clearly defined entry and exit rules, adaptive stop loss mechanisms, and built-in risk management through position sizing.

Fibonacci Levels with SMA SignalsThis strategy leverages Fibonacci retracement levels along with the 100-period and 200-period Simple Moving Averages (SMAs) to generate robust entry and exit signals for long-term swing trades, particularly on the daily timeframe. The combination of Fibonacci levels and SMAs provides a powerful way to capitalize on major trend reversals and market retracements, especially in stocks and major crypto assets.
The core of this strategy involves calculating key Fibonacci retracement levels (23.6%, 38.2%, 61.8%, and 78.6%) based on the highest high and lowest low over a 365-day lookback period. These Fibonacci levels act as potential support and resistance zones, indicating areas where price may retrace before continuing its trend. The 100-period SMA and 200-period SMA are used to define the broader market trend, with the strategy favoring uptrend conditions for buying and downtrend conditions for selling.
This indicator highlights high-probability zones for long or short swing setups based on Fibonacci retracements and the broader trend, using the 100 and 200 SMAs.
In addition, this strategy integrates alert conditions to notify the trader when these key conditions are met, providing real-time notifications for optimal entry and exit points. These alerts ensure that the trader does not miss significant trade opportunities.
Key Features:
Fibonacci Retracement Levels: The Fibonacci levels provide natural price zones that traders often watch for potential reversals, making them highly relevant in the context of swing trading.
100 and 200 SMAs: These moving averages help define the overall market trend, ensuring that the strategy operates in line with broader price action.
Buy and Sell Signals: The strategy generates buy signals when the price is above the 200 SMA and retraces to the 61.8% Fibonacci level. Sell signals are triggered when the price is below the 200 SMA and retraces to the 38.2% Fibonacci level.
Alert Conditions: The alert conditions notify traders when the price is at the key Fibonacci levels in the context of an uptrend or downtrend, allowing for efficient monitoring of trade opportunities.
Application:
This strategy is ideal for long-term swing trades in both stocks and major cryptocurrencies (such as BTC and ETH), particularly on the daily timeframe. The daily timeframe allows for capturing broader, more sustained trends, making it suitable for identifying high-quality entries and exits. By using the 100 and 200 SMAs, the strategy filters out noise and focuses on larger, more meaningful trends, which is especially useful for longer-term positions.
This script is optimized for swing traders looking to capitalize on retracements and trends in markets like stocks and crypto. By combining Fibonacci levels with SMAs, the strategy ensures that traders are not only entering at optimal levels but also trading in the direction of the prevailing trend.

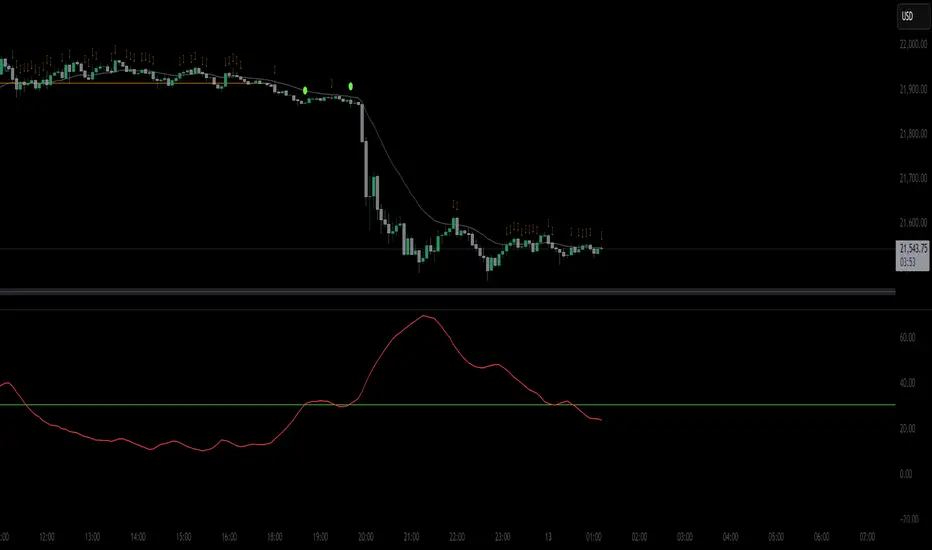
Signal Indicator + SAR + 30min Trend Background🔹 BTC/USD 3-Minute Trend Signal Indicator + SAR + 30-Minute Background Trend
📌 Overview
This indicator is designed for high-precision BTC/USD trading on the 3-minute timeframe. It integrates multiple trend confirmation tools to improve signal accuracy, reduce false entries, and help traders align with higher timeframe trends.
⚡ Key Features & Enhancements
✅ Multi-Timeframe Trend Confirmation:
Uses 3-minute EMA trend filter + 30-minute EMA confirmation.
Background color changes dynamically based on 30-minute trend.
✅ Smart Parabolic SAR Filter (Optional):
Reduces false signals with an adjustable confirmation delay.
Helps avoid premature exits in strong trends.
✅ Momentum & Trend Strength Analysis:
Uses MACD for directional confirmation.
RSI filtering to avoid overbought/oversold conditions.
ADX filter ensures trades are taken in strong trends.
✅ Breakout Confirmation & Heikin-Ashi Filtering:
Detects breakouts from key resistance & support levels.
Uses Heikin-Ashi candle trend confirmation for smoother signals.
✅ Bollinger Bands Trend Validation:
Filters trades based on price position relative to Bollinger Bands.
Avoids choppy market conditions.
✅ Session Time Filtering:
Limits trades to high-liquidity trading hours (9 AM - 8 PM UTC).
✅ BUY/SELL Alerts & Labels:
Displays BUY/SELL labels on the chart when conditions are met.
TradingView Alerts for automated bot integration.
🛠️ How It Works
1️⃣ Trend Confirmation
Short-term (3-min) trend: Calculated using EMA(20).
Higher timeframe (30-min) trend: Acts as a filter (optional background color).
Valid BUY/SELL signals must align with the higher timeframe trend.
2️⃣ Entry Signals (BUY & SELL Conditions)
🚀 BUY Signal
Price breaks above resistance (last 20 candles).
MACD bullish crossover.
EMA Trend + Higher TF EMA confirms uptrend.
Bollinger Bands validation (trading above mid-band).
SAR confirms uptrend (optional).
Heikin-Ashi trend aligns bullish.
ADX > 20 (ensures strong trend).
Time filter active (9 AM - 8 PM UTC).
🔻 SELL Signal
Price breaks below support (last 20 candles).
MACD bearish crossover.
EMA Trend + Higher TF EMA confirms downtrend.
Bollinger Bands validation (trading below mid-band).
SAR confirms downtrend (optional).
Heikin-Ashi trend aligns bearish.
ADX > 20 (ensures strong trend).
Time filter active (9 AM - 8 PM UTC).
3️⃣ Alerts & Labels
BUY alert triggers 🚀 when all conditions align.
SELL alert triggers 🔻 when all conditions align.
Labels appear on the chart to indicate signals.
⚙️ Customization & Settings
🔧 User-Configurable Options:
Parabolic SAR filter (optional).
SAR confirmation delay (prevents false exits).
Background trend color from 30-min timeframe.
Adjustable background opacity for better visibility.
Trading session filter (to avoid low-volume periods).
📊 Best Use Cases
✅ Scalping BTC/USD on a 3-minute chart.
✅ Trend-following strategy with multiple confirmations.
✅ Reducing false signals with multi-indicator validation.
✅ Automated trading (TradingView alerts integration).
⚠️ Disclaimer
📌 This indicator is for educational purposes only and should not be considered financial advice.
📌 Always backtest and validate the strategy before using it for live trading.
📌 Past performance does not guarantee future results.
💬 How to Use?
1️⃣ Add the indicator to your 3-minute BTC/USD chart.
2️⃣ Enable/disable filters based on your trading style.
3️⃣ Set alerts for automated notifications.
4️⃣ Follow trend confirmations before entering trades.

Pro Scalper AI [BullByte]The Pro Scalper AI is a powerful, multi-faceted scalping indicator designed to assist active traders in identifying short-term trading opportunities with precision. By combining trend analysis, momentum indicators, dynamic weighting, and optional AI forecasting, this tool provides both immediate and latched trading signals based on confirmed (closed bar) data—helping to avoid repainting issues. Its flexible design includes customizable filters such as a higher timeframe trend filter, and adjustable settings for ADX, ATR, and Hull Moving Average (HMA), giving traders the ability to fine-tune the strategy to different markets and timeframes.
Key Features :
- Confirmed Data Processing :
Utilizes a helper function to lock in price and volume data only from confirmed (closed) bars, ensuring the reliability of signals without the risk of intrabar repainting.
- Trend Analysis :
Employs ADX and Directional Movement (DI) calculations along with a locally computed HMA to detect short-term trends. An optional higher timeframe trend filter can further refine the analysis.
- Flexible Momentum Modes :
Choose between three momentum calculation methods—Stochastic RSI, Fisher RSI, or Williams %R—to match your preferred style of analysis. This versatility allows you to optimize the indicator for different market conditions.
- Dynamic Weighting & Volatility Adjustments :
Adjusts the contribution of trend, momentum, volatility, and volume through dynamic weighting. This ensures that the indicator responds appropriately to varying market conditions by scaling its sensitivity with user-defined maximum factors.
- Optional AI Forecast :
For those who want an extra edge, the built-in AI forecasting module uses linear regression to predict future price moves and adjusts oscillator thresholds accordingly. This feature can be toggled on or off, with smoothing options available for more stable output.
- Latching Mode for Signal Persistenc e:
The script features a latching mechanism that holds signals until a clear reversal is detected, preventing whipsaws and providing more reliable trade entries and exits.
- Comprehensive Visualizations & Dashboard :
- Composite Oscillator & Dynamic Thresholds : The oscillator is plotted with dynamic upper and lower thresholds, and the area between them is filled with a color that reflects the active trading signal (e.g., Strong Buy, Early Sell).
- Signal Markers : Both immediate (non-latching) and stored (latched) signals are marked on the chart with distinct shapes (circles, crosses, triangles, and diamonds) to differentiate between signal types.
- Real-Time Dashboard : A customizable dashboard table displays key metrics including ADX, oscillator value, chosen momentum mode, HMA trend, higher timeframe trend, volume factor, AI bias (if enabled), and more, allowing traders to quickly assess market conditions at a glance.
How to Use :
1. S ignal Interpretation :
- Immediate Signals : For traders who prefer quick entries, the indicator displays immediate signals such as “Strong Buy” or “Early Sell” based on the current market snapshot.
- Latched Signals : When latching is enabled, the indicator holds a signal state until a clear reversal is confirmed, offering sustained trade setups.
2. Trend Confirmation :
- Use the HMA trend indicator and the optional higher timeframe trend filter to confirm the prevailing market direction before acting on signals.
3. Dynamic Thresholds & AI Forecasting :
- Monitor the dynamically adjusted oscillator thresholds and, if enabled, the AI bias to gauge potential shifts in market momentum.
4. Risk Management :
- Combine these signals with additional analysis and sound risk management practices to determine optimal entry and exit points for scalping trades.
Disclaimer :
This script is provided for educational and informational purposes only and does not constitute financial advice. Trading involves risk, and past performance is not indicative of future results. Always perform your own analysis and use proper risk management strategies before trading.

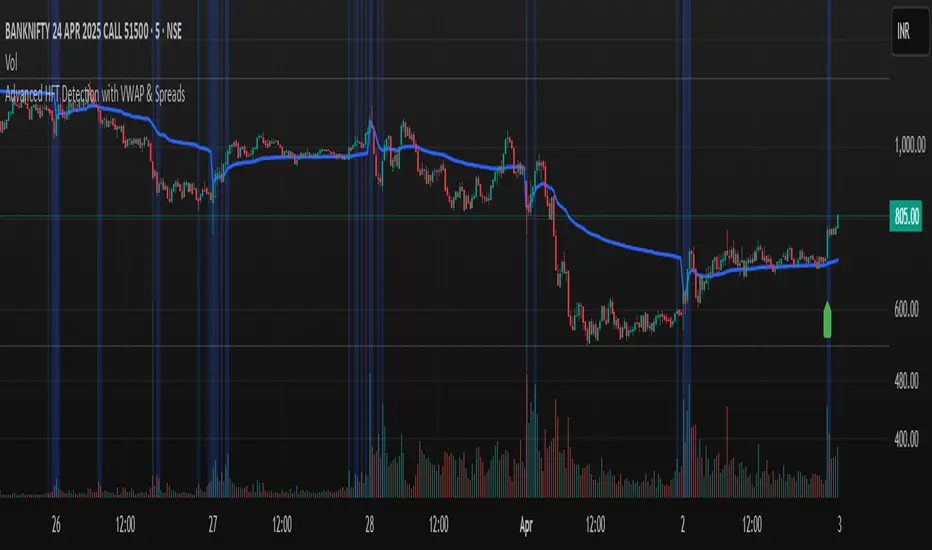
Advanced HFT Detection with VWAP & SpreadsExplanation of the HFT Detection Strategy
🔹 1. Key Indicators Used in the Strategy
It's works by combining VWAP, moving averages (SMA), volume spikes, and price jumps to detect potential HFT activity.
✅ (A) VWAP (Volume Weighted Average Price)
VWAP acts as a benchmark price that professional traders and institutions use to execute large orders.
If price is above VWAP, buyers are in control → Bullish trend
If price is below VWAP, sellers are in control → Bearish trend
HFT algorithms often place buy orders above VWAP and sell orders below VWAP to follow momentum.
➡️ Why VWAP? It ensures that signals follow the institutional trading trend.
✅ (B) Moving Averages (SMA)
Moving averages smooth out price data and help in detecting short-term momentum changes.
Fast Moving Average (5-period SMA): Reacts quickly to price changes
Slow Moving Average (20-period SMA): Identifies trend direction
➡️ Why SMA? It filters noise and confirms short-term trend shifts.
✅ (C) Volume Spike Detection
High-frequency trading is often accompanied by large volume surges. We define a volume spike as:
📌 Current Volume > 2× Average Volume of last 20 bars
➡️ Why Volume? HFTs execute rapid buy/sell orders when they detect liquidity, leading to sudden volume bursts.
✅ (D) Price Jump Detection (Sudden Volatility)
HFT algorithms often exploit quick price movements. We check if the price has moved more than twice the ATR (Average True Range) in the last 5 bars.
➡️ Why ATR? It helps to detect abnormal price movements compared to normal volatility.
🔹 2. Trading Signal Logic
Now that we have VWAP, moving averages, volume, and price movement filters, we generate buy and sell signals based on conditions.
✅ (A) Buy Signal Condition
A BUY signal is triggered when:
✔ Fast SMA crosses above Slow SMA → Short-term trend is turning bullish
✔ Volume spike occurs → HFTs are active
✔ Sudden price jump detected → High volatility
✔ Price is above VWAP → Confirms bullish trend
➡️ Why this works? It confirms that institutional traders & HFTs are buying aggressively.
✅ (B) Sell Signal Condition
A SELL signal is triggered when:
✔ Fast SMA crosses below Slow SMA → Short-term trend is turning bearish
✔ Volume spike occurs → HFTs are selling aggressively
✔ Sudden price drop detected → High volatility
✔ Price is below VWAP → Confirms bearish trend
➡️ Why this works? It confirms that institutional traders & HFTs are selling aggressively.
🔹 3. Visual Representation (Plotting Signals & VWAP)
Once we detect buy and sell signals, we mark them on the chart.
✅ (A) Buy/Sell Markers
🟢 Buy → Green upward arrow below the candle
🔴 Sell → Red downward arrow above the candle
✅ (B) VWAP Line on Chart
We also plot VWAP as a blue line to visualize trend direction.
✅ (C) Highlighting Volume Spikes
To easily spot HFT activity, we highlight volume spike bars with a blue background.
🔹 4. How to Use This Strategy?
1️⃣ Apply this script on a 1-minute or 5-minute intraday chart.
2️⃣ Look for BUY signals above VWAP and SELL signals below VWAP.
3️⃣ Verify that the volume spikes before taking action.
4️⃣ Use stop-loss & risk management (e.g., stop-loss at recent low/high).
🚀 Summary: Why This Strategy Works?
✅ VWAP ensures we follow institutional traders
✅ Volume spikes confirm sudden liquidity inflows
✅ Price jumps detect fast market moves caused by HFT bots
✅ Moving averages smooth out short-term trend shifts
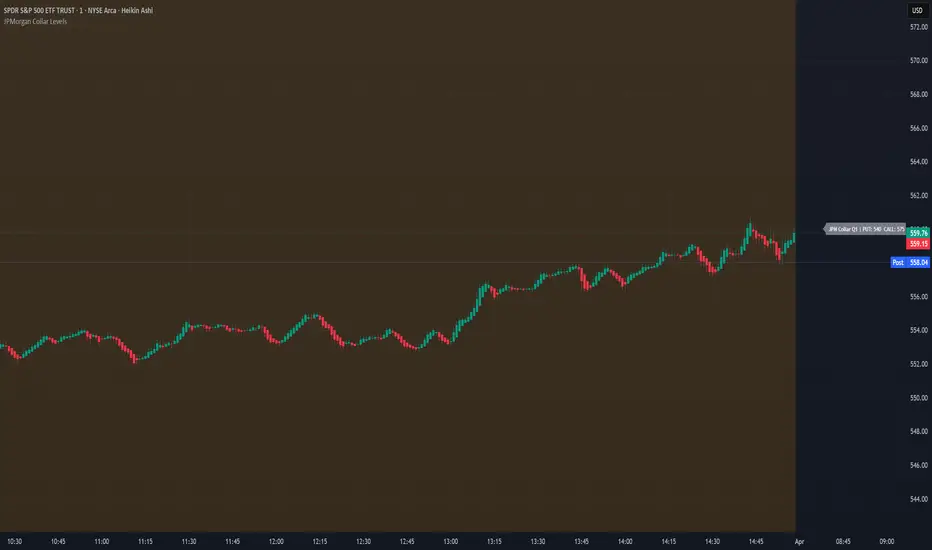
JPMorgan Collar LevelsJPMorgan Collar Levels – SPX/SPY Auto-Responsive (Quarterly Logic)
This script tracks the JPMorgan Hedged Equity Fund collar strategy, one of the most watched institutional positioning tools on SPX/SPY. The strategy rolls quarterly and often acts as a magnet or resistance/support zone for price.
TheStrat: Failed 2'sThis indicator identifies and highlights Failed 2-Up (2U) and Failed 2-Down (2D) patterns in The Strat trading framework. These patterns signal a potential reversal when a 2-Up (higher high) or 2-Down (lower low) candle fails to follow through and reverses, offering high-probability trade setups.

Optimized WPR Strategy with Filters (Debug)Identifying Market Trends:
The 200-period EMA is used to determine the short-term trend of the market.
When the price is above the 200-period EMA, it suggests a potential bullish market and an uptrend, and the strategy will only look for buying opportunities.
When the price is below the 200-period EMA, it suggests a potential bearish market and a downtrend, and the strategy will only look for selling opportunities.
When the 200-period EMA intersects with the price, it indicates that the market may be in a directionless consolidation phase.
Identifying Potential Reversal Points:
The strategy employs two Williams %R (WPR) indicators: one with a 9-period (fast WPR) and another with a 28-period (slow WPR).
WPR is a momentum indicator used to identify overbought and oversold conditions in the market. Its value oscillates between -100 and 0, with values near -100 indicating oversold conditions and values near 0 indicating overbought conditions.
In an uptrend (when the price is above the 200 EMA), the strategy seeks buying opportunities when both WPR indicators cross above -80 (the oversold zone) from below. This is considered a bullish signal, suggesting the market may be about to rebound. Sell signals are ignored at this time.
In a downtrend (when the price is below the 200 EMA), the strategy seeks selling opportunities when both WPR indicators cross below -20 (the overbought zone) from above. This is considered a bearish signal, suggesting the market may be about to reverse downward. Buy signals are ignored at this time.
Summary:
In summary, this strategy first uses the 200-period EMA to determine the overall trend direction of the market. Then, within the confirmed trend direction, it utilizes the simultaneous crossing of the overbought or oversold zones by the dual WPR indicators to identify potential reversal points as entry signals for trading. The strategy emphasizes that trading signals are only valid when both WPR indicators meet the conditions.
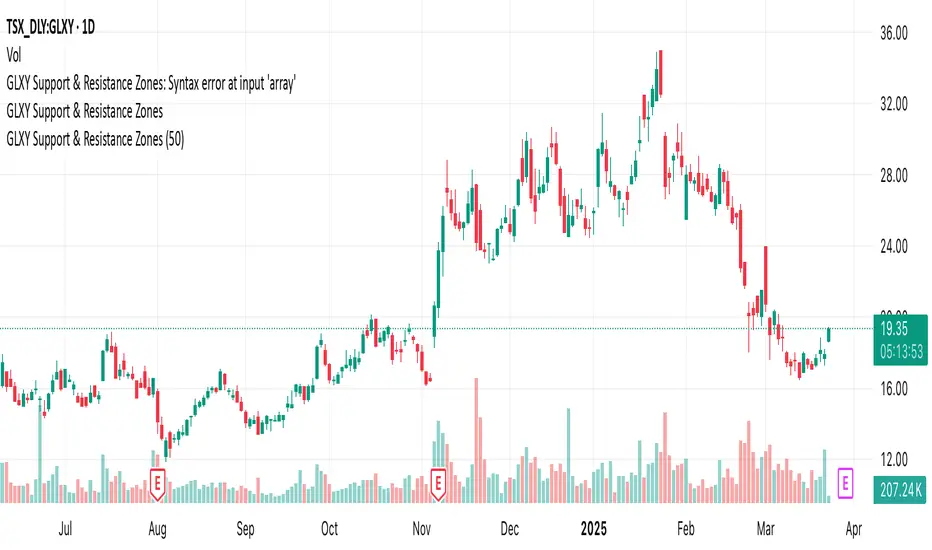
GLXY Support & Resistance ZonesHere’s a structured trading strategy for Galaxy Digital Holdings Ltd. (GLXY) based on a combination of technical analysis, market sentiment, and macro crypto market movement:
⸻
1. Timeframe
• Swing trading timeframe: 1-week to 1-month trades.
• Monitor daily and 4H charts for entries and exits.
⸻
2. Key Factors Driving GLXY
• Strongly correlated to Bitcoin and Ethereum price movement.
• Sensitive to regulatory news in Canada/US and institutional crypto adoption.
• Watch Galaxy’s quarterly earnings and treasury BTC/ETH position updates.
⸻
3. Entry Strategy
A) Technical Setup:
• Buy at major support zones:
• Key support levels: $7.00 CAD, $9.00 CAD (verify current chart levels).
• Enter long positions on bullish reversal candles at these supports.
• Breakout trades:
• Enter long positions on confirmed breakouts above significant resistance (watch volume and 1D close).
• Moving Average Confirmation:
• Only trade long if price is above the 50-day moving average and 50 MA is upward sloping.
B) Macro Confirmation:
• Only take aggressive long positions if BTC price is in an uptrend (above its own 50-day MA).
• Monitor ETH/BTC pair as additional confidence for alt sentiment.
⸻
4. Exit Strategy
• First partial profit target: Previous swing highs or Fibonacci extension levels (commonly 1.272 or 1.618).
• Trailing stop: Move stop-loss to entry when trade is +10%.
• Hard stop-loss: Below the last daily support (2-5% risk).
⸻
5. Diversification
• Do not exceed 5-7% of total portfolio per trade.
• Hedge exposure by monitoring crypto futures or crypto sentiment indexes (eg. Fear & Greed Index).
⸻
6. Optional Short Setup
• Only short if price breaks major support with strong volume, and BTC/ETH are in confirmed downtrends.
• Short target: next daily support zone.
⸻
7. News / Event-based Catalyst
• Enter small positions before major earnings or after big regulatory decisions if crypto sentiment is bullish.
⸻
8. Review
• Reassess the strategy every month based on BTC market structure.
• Track your trade results for GLXY separately to refine position sizing and entry criteria.
⸻