High Risk S&P 500 Buy The Dip Strategy, Albireo (by ChartArt)This strategy which has no stop loss and therefore is a high risk strategy, goes long as soon as the "S&P 500" on "OANDA" or "FXCM" starts a downtrend. A Bollinger Band filters the more extreme downtrends. The Bollinger Band setting can be changed to filter selectively for even more severe price declines or to allow more trades by setting the standard deviation to a lower value.
This "S&P 500" strategy only correctly works as intended on "OANDA" or "FXCM" (with default setting "OANDA"), because "OANDA" or "FXCM" are the only two price sources allowed in the strategy.
If you don't want to lose all your money due to some random strategy you found on the Internet, here is a warning:
All trading involves high risk; past performance is not necessarily indicative of future results.
P.S. Here are more trade examples, which help to explain why I named this a high risk strategy:
ابحث في النصوص البرمجية عن "the strat"

Lazy MomentumLazy Momentum Strategy is a trend trading strategy. There are 3 steps in the strategy:
1. Identify trend
2. Momentum Signal
3. Money management

Strategy Code Example - Risk Management*** THIS IS JUST AN EXAMPLE OF STRATEGY RISK MANAGEMENT CODE IMPLEMENTATION ***
For my own future reference, and for anyone else who needs it.
Pine script strategy code can be confusing and awkward, so I finally sat down and had a little think about it and put something together that actually works (i think...)
Code is commented where I felt might be necessary (pretty much everything..) and covers:
Take Profit
Stop Loss
Trailing Stop
Trailing Stop Offset
...and details how to handle the input values for these in a way that allows them to be disabled if set to 0, without breaking the strategy.exit functionality or requiring a silly amount of statement nesting.
Also shows how to use functions (or variables/series) to execute trade entries and exits.
Cheers!

Everyday 0003 _ MAC Pullback I recently posted a Moving Averge Crossover strategy for my Everyday project - a project I've given myself where I try to create one strategy everyday in between 15 minutes and 2 hours.
In the comments of my last published idea, user SignalTradersUK was very kind and suggested I try the following in my next study:
"i think your next study should be, to workout what to do after the Moving Average cross! If you look just on the chart you have posted, Price would appear to always come back to the levels where the 2 MA's cross and then go back in the direction of the crossing of the MA's. It's a great pull back strategy."
I'm really just beginning to learn about coding strategies so I'm not 100% sure I correctly understood his suggestion.
I admit I had difficulties wrapping my head around how to do this.
Anyway, the result is a strategy which runs alongside the main Moving Average Crossover.
'The Algorithm'
When the fast and slow MA cross the strategy traces back 40 days to find a swing low.
This swing low and the price at the MA cross is used to calculate a fib 1.272 extension.
The price at this 1.272 extension is used to place a Pullback short order.
Since we're shorting a bull trend, a tight stop is used.
If the pullback reaches down to the fib 0.618 we take profit (close the short).
Like I said, I don't know if I correctly understood SignalTradersUK feedback, but I really appreciate the
feedback and advice!
As always I'm hoping to learn from the community, so all feedback, corrections and advice is very welcome!
Thanks!
/pbergden

Outsidebar vs Insidebar, Illusion Strategy (by ChartArt)WARNING: This strategy does not work! Please don't trade with this strategy
I'm sharing this strategy for the following three educational reasons:
1. You can easily find 100% strategies, but if they only seem to work 100% on one asset, they actually don't work at all. Therefore never backtest your strategy only on one asset, especially forward testing is useless, because it tends to repeat the old patterns. Your strategy has to work on as many different assets as possible.
2. The pyramiding of orders can have an impact on the strategy. In this case if you manually change the strategy settings by increasing it from 1 to 100 pyramiding orders changes the percent profitable on "UKOIL" monthly from 100% to 90% profitable. On other assets you can see very different results. Allowing much more pyramiding orders in this case results in opening orders where the background color highlights appear.
3. The Tradingview backtest beta version currently does not close the last open trade during the backtest. In this case going long on "UKOIL" near the top in 2011 as this strategy did would result in a big loss in 2015. But since the trade is still open and not canceled out by a new short order it still appears as if this strategy works 100% profitable. Which it doesn't.

[AutoView] MovingAvg Cross - Video AttachedThere is nothing special or spectacular about this script. It's your standard Moving Average Cross Strategy. It is actually a built in script everyone has access to already. I only changed some of the settings and flipped the orders.
The reason I actually published this, is because people have been asking me what the best way to find the best settings for a strategy. So I made a YouTube video showing people how I personally do it. I took this built in strategy and within 5 minutes took it from a net profit loss and profit factor of 0.5 to a net profit win with a profit factor of 3-5.
Of course this is only on the 1 minute candles, so forward testing the strategy is a must as I do not recommend straight up taking this and trading it.
You can watch the video here:
www.youtube.com
Hope this helps everyone speed up their back testing and fine tuning their strategies.

CryptoFlux Dynamo [JOAT]CryptoFlux Dynamo: Velocity Scalping Strategy
This Pine Script v6 strategy is designed for cryptocurrency markets operating on 5-minute and faster timeframes. It combines volatility regime detection, multi-path signal confirmation, and adaptive risk management to identify momentum-based trading opportunities in perpetual futures markets.
Core Design Principles
The strategy addresses three challenges specific to cryptocurrency trading:
24/7 market operation without session boundaries requires continuous monitoring and execution logic
Volatility regimes shift rapidly, demanding adaptive stop and target calculations
Tick-level responsiveness is critical for capturing momentum moves before they complete
Strategy Architecture
1. Signal Generation Stack
The strategy uses multiple technical indicators calibrated for cryptocurrency momentum:
MACD with parameters 8/21/5 (fast/slow/signal) optimized for crypto acceleration phases
EMA ribbon using 8/21/34 periods with slope analysis to assess trend structure
Volume impulse detection combining SMA baseline, standard deviation, and z-score filtering
RSI (21 period) and MFI (21 period) for momentum confirmation
Bollinger Bands and Keltner Channels for squeeze detection
2. Volatility Regime Classification
The strategy normalizes ATR as a percentage of price and classifies market conditions into three regimes:
Compression (< 0.8% ATR): Reduced position sizing, tighter stops (1.05x ATR), lower profit targets (1.6x ATR)
Expansion (0.8% - 1.6% ATR): Standard risk parameters, balanced risk-reward (1.55x stop, 2.05x target)
Velocity (> 1.6% ATR): Wider stops (2.1x ATR), amplified targets (2.8x ATR), tighter trailing offsets
ATR is calculated over 21 periods and smoothed with a 13-period EMA to reduce noise from wicks.
3. Multi-Path Entry System
Four independent signal pathways contribute to a composite strength score (0-100):
Trend Break (30 points): Requires EMA ribbon alignment, positive slope, and structure breakout above/below recent highs/lows
Momentum Surge (30 points): MACD histogram exceeds adaptive baseline, MACD line crosses signal, RSI/MFI above/below thresholds, with volume impulse confirmation
Squeeze Release (25 points): Bollinger Bands compress inside Keltner Channels, then release with momentum bias
Micro Pullback (15 points): Shallow retracements within trend structure that reset without breaking support/resistance
Additional scoring modifiers:
Volume impulse: +5 points when present, -5 when absent
Regime bonus: +5 in velocity, -2 in compression
Cycle bias: +5 when aligned, -5 when counter-trend
Trades only execute when the composite score reaches the minimum threshold (default: 55) and all filters agree.
4. Risk Management Framework
Position sizing is calculated from:
RiskCapital = Equity × (riskPerTradePct / 100)
StopDistance = ATR × StopMultiplier(regime)
Quantity = min(RiskCapital / StopDistance, MaxExposure / Price)
The strategy includes:
Risk per trade: 0.65% of equity (configurable)
Maximum exposure: 12% of equity (configurable)
Regime-adaptive stop and target multipliers
Adaptive trailing stops based on ATR and regime
Kill switch that disables new entries after 6.5% drawdown
Momentum fail-safe exits when MACD polarity flips or ribbon structure breaks
5. Additional Filters
Cycle Oscillator : Measures price deviation from 55-period EMA. Requires cycle bias alignment (default: ±0.15%) before entry
BTC Dominance Filter : Optional filter using CRYPTOCAP:BTC.D to reduce long entries during risk-off periods (rising dominance) and short entries during risk-on periods
Session Filter : Optional time-based restriction (disabled by default for 24/7 operation)
Strategy Parameters
All default values used in backtesting:
Core Controls
Enable Short Structure: true
Restrict to Session Window: false
Execution Session: 0000-2359:1234567 (24/7)
Allow Same-Bar Re-Entry: true
Optimization Constants
MACD Fast Length: 8
MACD Slow Length: 21
MACD Signal Length: 5
EMA Fast: 8
EMA Mid: 21
EMA Slow: 34
EMA Slope Lookback: 8
Structure Break Window: 9
Regime Intelligence
ATR Length: 21
Volatility Soothing: 13
Low Vol Regime Threshold: 0.8% ATR
High Vol Regime Threshold: 1.6% ATR
Cycle Bias Length: 55
Cycle Bias Threshold: 0.15%
BTC Dominance Feed: CRYPTOCAP:BTC.D
BTC Dominance Confirmation: true
Signal Pathways
Volume Baseline Length: 34
Volume Impulse Multiplier: 1.15
Volume Z-Score Threshold: 0.5
MACD Histogram Smoothing: 5
MACD Histogram Sensitivity: 1.15
RSI Length: 21
RSI Momentum Trigger: 55
MFI Length: 21
MFI Momentum Trigger: 55
Squeeze Length: 20
Bollinger Multiplier: 1.5
Keltner Multiplier: 1.8
Squeeze Release Momentum Gate: 1.0
Micro Pullback Depth: 7
Minimum Composite Signal Strength: 55
Risk Architecture
Risk Allocation per Trade: 0.65%
Max Exposure: 12% of Equity
Base Risk/Reward Anchor: 1.8
Stop Multiplier • Low Regime: 1.05
Stop Multiplier • Medium Regime: 1.55
Stop Multiplier • High Regime: 2.1
Take Profit Multiplier • Low Regime: 1.6
Take Profit Multiplier • Medium Regime: 2.05
Take Profit Multiplier • High Regime: 2.8
Adaptive Trailing Engine: true
Trailing Offset Multiplier: 0.9
Quantity Granularity: 0.001
Kill Switch Drawdown: 6.5%
Strategy Settings
Initial Capital: $100,000
Commission: 0.04% (0.04 commission_value)
Slippage: 1 tick
Pyramiding: 1 (no position stacking)
calc_on_every_tick: true
calc_on_order_fills: true
Visualization Features
The strategy includes:
EMA ribbon overlay (8/21/34) with customizable colors
Regime-tinted background (compression: indigo, expansion: purple, velocity: magenta)
Dynamic bar coloring based on signal strength divergence
Signal labels for entry points
On-chart dashboard displaying regime, ATR%, signal strength, position status, stops, targets, and risk metrics
Recommended Usage
Timeframes
The strategy is optimized for 5-minute charts. It can operate on 3-minute and 1-minute timeframes for faster scalping, or 15-minute for swing confirmation. When using higher timeframes, consider:
Increasing structure lookback windows
Raising RSI trigger thresholds above 58 to filter noise
Extending volume baseline length
Markets
Designed for high-liquidity cryptocurrency perpetual futures:
BTC/USDT, BTC/USD perpetuals
ETH perpetuals
Major L1 tokens with sufficient volume
For thinner order books, increase volume impulse multiplier and adjust quantity granularity to match exchange minimums.
Limitations and Compromises
Backtesting Considerations
TradingView strategy backtesting does not replicate broker execution. Actual fills, slippage, and commissions may differ
The strategy uses calc_on_every_tick=true and calc_on_order_fills=true to reduce bar-close distortions, but real execution still depends on broker infrastructure
At least 200 historical bars are required to stabilize regime classification, volume baselines, and cycle context
Market Structure Dependencies
BTC dominance feed ( CRYPTOCAP:BTC.D ) may lag during low-liquidity periods or weekends. Consider disabling the filter if data quality degrades
Volume impulse detection assumes consistent order book depth. During extreme volatility or exchange issues, volume signatures may be unreliable
Regime classification based on ATR percentage assumes normal volatility distributions. During black swan events, regime thresholds may not adapt quickly enough
Parameter Sensitivity
Default parameters are tuned for BTC/ETH perpetuals on 5-minute charts. Different assets or timeframes require recalibration
The composite signal strength threshold (55) balances selectivity vs. opportunity. Higher values reduce false signals but may miss valid setups
Risk per trade (0.65%) and max exposure (12%) are conservative defaults. Aggressive scaling increases drawdown risk
Execution Constraints
Same-bar re-entry requires broker support for rapid order placement
Quantity granularity must match exchange contract minimums
Kill switch drawdown (6.5%) may trigger during normal volatility cycles, requiring manual reset
Performance Expectations
This strategy is a framework for momentum-based cryptocurrency trading. Performance depends on:
Market conditions (trending vs. ranging)
Exchange execution quality
Parameter calibration for specific assets
Risk management discipline
Backtest results shown in publications reflect specific market conditions and parameter sets. Past performance does not indicate future results. Always forward test with paper trading or broker simulation before deploying live capital.
Code Structure
The strategy is organized into functional sections:
Configuration groups for parameter organization
Helper functions for position sizing and normalization
Core indicator calculations (MACD, EMA, ATR, RSI, MFI, volume analytics)
Regime classification logic
Multi-path signal generation and composite scoring
Entry/exit orchestration with risk management
Visualization layer with dashboard and chart elements
The source code is open and can be modified to suit your trading requirements. Everyone is encouraged to understand the logic before deploying and to test thoroughly in their target markets.
Modification Guidelines
When adapting this strategy:
Document any parameter changes in your publication
Test modifications across different market regimes
Validate position sizing logic for your exchange's contract specifications
Consider exchange-specific limitations (funding rates, liquidation mechanics, order types)
Conclusion
This strategy provides a structured approach to cryptocurrency momentum trading with regime awareness and adaptive risk controls. It is not a guaranteed profit system, but rather a framework that requires understanding, testing, and ongoing calibration to market conditions.
You should thoroughly understand the logic, test extensively in their target markets, and manage risk appropriately. The strategy's effectiveness depends on proper parameter tuning, reliable execution infrastructure, and disciplined risk management.
Disclaimer
This script and its documentation are for educational and informational purposes only. They do not constitute financial advice, investment recommendations, or trading advice of any kind. Trading cryptocurrencies and derivatives involves substantial risk of loss and is not suitable for all investors. Past performance, whether real or indicated by backtesting, does not guarantee future results.
This strategy is provided "as is" without any warranties or guarantees of profitability
You should not rely solely on this strategy for making trading decisions
Always conduct your own research and analysis before making any financial decisions
Consider consulting with a qualified financial advisor before engaging in trading activities
The authors and contributors are not responsible for any losses incurred from using this strategy
Cryptocurrency trading can result in the loss of your entire investment
Only trade with capital you can afford to lose
Use this strategy at your own risk. The responsibility for any trading decisions and their consequences lies entirely with you.

RSI Strategy with Auto Tuner (PF)# RSI Auto‑Tuner Strategy — How To Use
This document explains **how to use** the RSI Auto‑Tuner strategy. It intentionally avoids math and implementation details. Follow this as an operating guide.
---
## 1. What This Tool Is For
This strategy helps you:
* Discover **which RSI length works best** on a given ticker and timeframe
* Measure performance using **Profit Factor (PF)**
* Improve RSI performance on noisy markets by **transforming price first**
The auto‑tuner is a **research tool**, not a live trading signal generator.
---
## 2. Two Modes You Must Treat Differently
### Research Mode
Used to explore and discover parameters.
* Auto‑Tune: **ON**
* Parameters are allowed to change
* Results may look very good
* Overfitting risk is real
### Trading Mode
Used for forward testing or live trading.
* Auto‑Tune: **OFF**
* Parameters are fixed
* Behavior is stable and repeatable
* This is the only acceptable mode for live use
**Never trade live with Auto‑Tune enabled.**
---
## 3. Manual Mode (Trading Mode)
Use this after parameters are finalized.
Steps:
1. Set **Auto‑Tune = OFF**
2. Choose:
* Source (raw price or transformed price)
* RSI Length (manual, default 14)
* Oversold / Overbought levels
3. The strategy will:
* Enter long when RSI crosses up through Oversold
* Enter short when RSI crosses down through Overbought
* Flip positions on opposite signals
This mode is predictable and safe for forward testing.
---
## 4. Auto‑Tune Mode (Research Mode)
Use this to find optimal RSI lengths.
Steps:
1. Set **Auto‑Tune = ON**
2. Configure the search range:
* Minimum Length (default 5)
* Maximum Length (default 14)
* Step Size (default 1)
3. The strategy will:
* Internally simulate trades for each RSI length
* Track gross profit, gross loss, and trades
* Select the length with the highest Profit Factor
4. The best length is applied automatically
Auto‑Tune evaluates historical data only.
---
## 5. Using a Transform on Price (Critical)
RSI does **not** have to run on raw price.
You can significantly improve results by:
* Applying a **price transform** first
* Feeding the transformed series into the RSI Source input
Examples of transforms:
* Moving averages
* Low‑pass filters
* Butterworth filters
* Any smoother or denoiser
Why this works:
* Busy, wicky markets cause RSI to whipsaw
* Transforms remove micro‑noise
* RSI responds to structure instead of chaos
* Profit Factor often increases dramatically
Best practice:
* Auto‑tune on raw price
* Auto‑tune on transformed price
* Compare PF, trade count, and stability
---
## 6. Reading the Status Label
At the last bar, the on‑chart label shows:
* Whether Auto‑Tune is ON or OFF
* Whether candidates were built successfully
* Number of RSI lengths tested
* Best RSI length found
* Profit Factor and trade count
If Auto‑Tune is OFF, the label shows the manual length.
---
## 7. Recommended Workflow
1. Choose ticker and timeframe
2. Enable Auto‑Tune on **raw price**
3. Record best RSI length and PF
4. Enable Auto‑Tune on **transformed price**
5. Compare results
6. Lock parameters
7. Disable Auto‑Tune
8. Forward test
---
## 8. Warnings and Discipline
* High PF with few trades is unreliable
* Transforms can hide execution costs
* Always validate on a different period
* Auto‑Tune is a **lens**, not an edge
Treat this tool as a research microscope, not an autopilot.

Vdubus Evolution v IVVdubus Evolution v IV
instasize.com
Strategy Idea: The TRIX Kinetic Grid (Institutional Grade)
The Philosophy
Most grid strategies fail for one simple reason: they are "dumb." They blindly buy as the market crashes or sell as it rallies, eventually hitting a wall.
The TRIX Kinetic Grid is different. It is a "smart" directional system that refuses to fight the trend. Instead of guessing tops and bottoms, it utilizes a highly sensitive, fast-tuned TRIX Momentum Filter to identify the immediate flow of institutional money. We only grid with the river, never against it.
Core Mechanics
1. Momentum-Locked Entries The strategy remains dormant until a specific Zero-Line Crossover event occurs on our proprietary TRIX oscillator. This ensures that the initial entry is always aligned with the breakdown or breakout of price action. We do not catch falling knives; we ride the falling knife down.
2. The "Rebel" Compounding Engine This is where the magic happens. The strategy utilizes a Step-Compounding Algorithm that dynamically adjusts trade size based on account equity milestones.
Geometric Growth Phase: In the early stages, the system reinvests profits aggressively, using a proprietary geometric multiplier to scale position sizes.
The "Stacker" Technology: To bypass standard broker lot limits, the system utilizes a custom "Order Stacking" engine. It automatically splits massive institutional-sized positions into smaller, execution-friendly tickets, allowing for unlimited theoretical scalability.
3. Kinetic Grid Recovery If the trend pauses or pulls back, the system deploys a directional grid sequence. Unlike standard Martingale systems that hope for a reversal, our grid assumes the trend is still valid and uses the pullbacks to accumulate a larger position at a better average price. The exit is triggered not just by price, but by a shift in the momentum vector itself.
Risk Management: The "S-Curve" Protocol
Infinite compounding is dangerous. To solve this, we engineered an Institutional Ceiling:
The Growth Phase: The account is allowed to compound exponentially to build capital rapidly.
The Income Phase: Once the trade size hits a pre-defined "Whale Cap" (e.g., 100 Lots), the system stops compounding and switches to a linear income generation model. This prevents liquidity slippage and protects the account from "Flash Crash" exposure at extreme leverages.
The Result
The result is a strategy that produces an Equity S-Curve: slow initial growth, followed by a vertical acceleration phase, and finally stabilizing into a high-yield income generator. It is designed not just to trade the market, but to dominate the mathematical probability of a trend.
Summary of Features
Trend Filter: Modified TRIX (Zero-Cross Validation).
Entry Logic: Directional Momentum Breakout.
Recovery: Adaptive Directional Averaging.
Money Management: Geometric Step-Compounding with "Whale" Capping.
Broker Compliance: Automated Ticket Splitting (Stacking).
=====================================================
This is very sensitive to Pairs traded & will require Tweaks.
it's a careful balance between the 'Trix' variables & ATR.... The results are insane. Enjoy !
I will not be held responsible for any losses of any kind when using this script.

OCC Strategy Optimized (MA 5 + Delayed TSL)# OCC Strategy Optimized (MA 5 + Delayed TSL) - User Guide
## Introduction
The **OCC Strategy Optimized** is an enhanced version of the classic **Open Close Cross (OCC)** strategy. This strategy is designed for high-precision trend following, utilizing the crossover logic of Open and Close moving averages to identify market shifts. This optimized version incorporates advanced risk management, multi-timeframe analysis, and a variety of moving average types to provide a robust trading solution for modern markets.
>
> **Special Thanks:** This strategy is based on the original work of **JustUncleL**, a renowned Pine Script developer. You can find their work and profile on TradingView here: (in.tradingview.com).
---
## Key Features
### 1. Optimized Core Logic
- **MA Period (Default: 5):** The strategy is tuned with a shorter MA length to reduce lag and capture trends earlier.
- **Crossing Logic:** Signals are generated when the Moving Average of the **Close** crosses the Moving Average of the **Open**.
### 2. Multi-Timeframe (MTF) Analysis
- **Alternate Resolution:** Use a higher timeframe (Resolution Multiplier) to filter out noise. By default, it uses $3 \times$ your current chart timeframe to confirm the trend.
- **Non-Repainting:** Includes an optional delay offset to ensure signals are confirmed and do not disappear (repaint) after the bar closes.
### 3. Advanced Risk Management
This script features a hierarchical exit system to protect your capital and lock in profits:
- **Fixed Stop Loss (Initial):** Protects against sudden market reversals immediately after entry.
- **Delayed Trailing Stop Loss (TSL):**
- **Activation Delay:** The TSL only activates after the trade reaches a specific profit threshold (e.g., 1%). This prevents being stopped out too early in the trade's development.
- **Ratchet Trail:** Once activated, the stop loss "ratchets" up/down, never moving backward, ensuring you lock in profits as the trend continues.
- **Take Profit (TP):** A fixed percentage target to exit the trade at a pre-defined profit level.
### 4. Versatility
- **12 MA Types:** Choose from SMA, EMA, DEMA, TEMA, WMA, VWMA, SMMA, HullMA, LSMA, ALMA, SSMA, and TMA.
- **Trade Direction:** Toggle between Long-only, Short-only, or Both.
- **Visuals:** Optional bar coloring to visualize the trend directly on the candlesticks.
---
## User Input Guide
### Core Settings
- **Use Alternate Resolution?:** Enable this to use the MTF logic.
- **Multiplier for Alternate Resolution:** How many charts higher the "filter" timeframe should be.
- **MA Type:** Select your preferred moving average smoothing method.
- **MA Period:** The length of the Open/Close averages.
- **Delay Open/Close MA:** Use `1` or higher to force non-repainting behavior.
### Risk Management Settings
- **Use Trailing Stop Loss?:** Enables the TSL system.
- **Trailing Stop %:** The distance the stop follows behind the price (Optimized Default: 1.5%).
- **TSL Activation % (Delay):** The profit % required before the TSL starts moving. (Optimized Default: 2.0% to ensure 0.5% profit is locked immediately).
- **Initial Fixed Stop Loss %:** Your hard stop if the trade immediately goes against you.
- **Take Profit %:** Your ultimate profit target for the trade.
---
## How to Trade with This Strategy
1. **Identify the Trend:** Look for the Moving Average lines (Close vs Open) to cross.
2. **Wait for Confirmation:** If using MTF, ensure the higher timeframe also shows a trend change.
3. **Manage the Trade:** Let the TSL work. With the default **2.0% Activation** and **1.5% Trail**, the strategy will automatically lock in **0.5% profit** the moment the threshold is hit, then follow the price higher.
4. **Position Sizing:** Adjust the `Properties` tab in the script settings to match your desired capital allocation (Default is 10% of equity).
---
## Recommended Settings
1. Trialing < Activation
2. Check ranging
## Credits
Original Strategy by: **JustUncleL**
Optimized and Enhanced by: **Antigravity AI**

NIFTY_2MIN_CVD_Absorption_long_StrategySummary
This strategy is an intraday system designed for the Nifty index on a 2-minute timeframe, focusing on high-probability reversal entries. It utilizes price action patterns and Cumulative Volume Delta (CVD) to identify market turning points.
Long Strategy: Concept & Core Logic
The long strategy is engineered to identify "V-shaped" recoveries where selling pressure is exhausted and absorbed by aggressive buyers.
Price Action Trigger: The strategy looks for a specific two-part sequence:
Sudden Bearish Movement: A rapid downward move representing a final flush of sellers.
Sudden Reversal: Immediately followed by a strong, high-momentum bullish (green) candle, indicating a swift change in market sentiment.
CVD Absorption Filter: To confirm the validity of the reversal, the strategy analyzes the Cumulative Volume Delta (CVD). It specifically looks for instances where the relative movement of CVD is significantly higher than the corresponding price movement. This divergence suggests "selling absorption"—where large buy orders are soaking up sell-side liquidity, creating a floor for the reversal.
Risk Management (Long)
The strategy utilizes fixed exit parameters based on the underlying Nifty price points:
Take Profit: 25 points.
Stop Loss: 30 points.
Intended Use
This tool is intended for traders who study mechanical, rule-based systems. It demonstrates how price action, volume delta divergence (CVD), and trend filters can be combined to time entries in both trending and reversal market conditions.
Disclaimer: This script is for educational and informational purposes only. It is not financial advice. All trading involves risk, and past performance is not indicative of future results. Please conduct your own research and backtesting before making any trading decisions.

ML Adaptive SuperTrend Strategy [trade_crush]# ML Adaptive SuperTrend Strategy - User Guide
## Introduction
The **ML Adaptive SuperTrend Strategy** is a sophisticated trading tool that combines traditional trend-following logic with **Machine Learning (K-Means Clustering)** to dynamically adapt to market volatility. Unlike standard SuperTrend indicators that use a fixed ATR, this strategy analyzes historical volatility to categorize the current market into distinct clusters, providing more precise entries and exits.
>
> **Special Thanks:** This strategy is based on the innovative work of **AlgoAlpha**. You can explore their extensive library of high-quality indicators and strategies on TradingView: (www.tradingview.com).
---
## Machine Learning Engine (K-Means)
The core of this strategy is its ability to "learn" from recent market behavior.
- **K-Means Clustering**: The script takes the last $N$ bars of ATR data and runs an iterative clustering algorithm to find three "centroids" representing **High**, **Medium**, and **Low** volatility.
- **Adaptive ATR**: Based on the current volatility, the strategy selects the nearest centroid to use as the ATR value for the SuperTrend calculation. This ensures the trailing stop tightens during low volatility and widens during high volatility to avoid "noise".
---
## Key Features
### 1. Non-Repainting Signals
- **Confirm Signals**: When enabled, signals are only triggered after a bar closes. This ensures that the arrows and entries you see on the chart are permanent and reliable for backtesting.
### 2. Intelligent Risk Management
- **Multiple SL/TP Types**: Choose between **Percentage** based stops or **ATR** based stops for both Stop Loss and Take Profit.
- **Trailing Stop Loss (TSL)**:
- Supports both Percentage and ATR modes.
- **Activation Offset**: Only activates the trailing mechanism after the price has moved a certain percentage in your favor, protecting early-stage trades.
### 3. Risk-Based Position Sizing
- **Dynamic Quantity**: If enabled, the strategy automatically calculates the trade size based on your **Risk % Per Trade** and the distance to your **Stop Loss**. This ensures you never lose more than your defined risk on a single trade.
---
## User Input Guide
### SuperTrend & ML Settings
- **ATR Length**: The window used to calculate market volatility.
- **SuperTrend Factor**: The multiplier that determines the distance of the trailing stop from the price.
- **Use ML Adaptive ATR**: Toggle between the ML-enhanced logic and standard ATR.
- **Training Data Length**: How many historical bars the ML engine analyzes to find clusters.
### Risk Management
- **Stop Loss Type**: Set to Percentage, ATR, or None.
- **TS Activation Offset**: The profit buffer required before the trailing stop starts following the price.
- **Use Risk-Based Sizing**: Toggle this to let the script manage your position size automatically.
---
## How to Trade with This Strategy
1. **Monitor the Dashboard**: Check the top-right table to see which volatility cluster the market is currently in.
2. **Observe the Fills**: The adaptive fills (green/red) visualize the "breathing room" the strategy is giving the price.
3. **Execution**: The strategy enters on "ML Bullish" (Triangle Up) and "ML Bearish" (Triangle Down) signals.
4. **Exits**: The script will automatically exit based on your SL, TP, or Trailing Stop settings.
---
## Credits
Original Concept: **AlgoAlpha**
Strategy Conversion & Enhancements: **Antigravity AI**

mucip sat stratejisiThis strategy performs scaled short entries across multiple timeframes.
Position additions are executed using small capital allocations (1–2% per entry) to manage risk efficiently.
It is primarily optimized for major cryptocurrencies.
The strategy is designed for futures markets and operates with leverage in the 10–15x range.

FluxMA ProFluxMA Pro
FluxMA Pro is an intraday trend-following strategy based on moving-average cross signals , with built-in execution filters (time window + weekdays), direction control, and an optional strict one-trade-per-day rule.
The system enters when price crosses the selected moving average, and manages risk using fixed SL/TP in ticks . For clarity and auditing, it plots the MA and draws risk (SL) / reward (TP) zones on the chart.
This script is published for educational and research purposes , with documented mechanics and replication settings to support transparency and reproducibility.
How the strategy works
Signal engine (MA cross)
A base Moving Average (MA) is computed from a selectable price source.
A Long signal triggers when price crosses above the MA.
A Short signal triggers when price crosses below the MA.
Execution filters
Time filter : trades only inside the configured window (supports overnight windows correctly).
Weekday filter : enable/disable trading by day (Mon–Sun).
Direction filter : run Long only , Short only , or Both .
One trade per day (optional) : if enabled, once a trade is placed, no new trades are allowed until the next daily reset.
Risk management (ticks)
Stop-loss and take-profit are set using fixed distances in ticks from entry.
Orders are placed with a stop and a limit exit to keep execution auditable.
Visual audit layer
Plots the Moving Average on the chart.
Draws SL/TP zones as boxes that extend while the position is open.
Adds entry labels (“buy” / “sell”) for quick review in replays and optimizations.
Visual features
MA plot with selectable MA type (SMA/EMA/WMA/RMA) and length.
Risk/Reward boxes projected from entry (SL zone + TP zone).
Entry labels with configurable styling (label/flag) and colors.
Settings used for the published backtest (replication)
The performance screenshots included with this publication were generated using the following configuration:
Market & chart
Symbol : XAUUSD (FXCM feed)
Timeframe : 15 minutes
Date range : 02 Jan 2025 → 07 Nov 2025
Inputs (Strategy settings)
Source : Close
MA type : SMA
MA length : 10
Stop Loss : 1400 ticks
Take Profit : 2000 ticks
Time filter : enabled — 06:00 to 22:15 (exchange time)
Weekday filter : enabled — Monday to Sunday enabled
Direction : Long only
One trade per day : enabled
TradingView Strategy Properties used
Initial capital : 1,000 USD
Commission : 0.2 (as set in Strategy Properties)
Slippage : 1 tick
Backtest snapshot (as shown)
Net Profit : +727.41 USD (+72.74%)
Max Drawdown : 200.25 USD (12.71%)
Total Trades : 218
Win Rate : 52.29% (114 / 218)
Profit Factor : 1.485
Backtest context and limitations
Stop/limit fills may occur intrabar depending on TradingView’s execution model and bar magnifier assumptions.
Results vary by symbol, timeframe, broker feed, spreads, commissions, slippage, and session selection.
Past performance does not guarantee future results.
This script is not financial advice.
Originality and usefulness
While MA-cross strategies are a known concept, FluxMA Pro focuses on an execution-grade implementation designed for testing and disciplined deployment:
Execution guardrails : optional one-trade-per-day lock + direction filter to prevent over-trading and strategy drift.
Session handling done properly : time windows support overnight logic (no “broken window” edge cases).
MA modularity : SMA/EMA/WMA/RMA selection enables controlled experiments without rewriting logic.
Auditable visuals : SL/TP zones and labels allow fast review of behavior during replays, optimization, and multi-asset scans.

Antigravity OCC Strategy (MA 5 + Delayed TSL)# OCC Strategy Optimized (MA 5 + Delayed TSL) - User Guide
## Introduction
The **OCC Strategy Optimized** is an enhanced version of the classic **Open Close Cross (OCC)** strategy. This strategy is designed for high-precision trend following, utilizing the crossover logic of Open and Close moving averages to identify market shifts. This optimized version incorporates advanced risk management, multi-timeframe analysis, and a variety of moving average types to provide a robust trading solution for modern markets.
>
> **Special Thanks:** This strategy is based on the original work of **JustUncleL**, a renowned Pine Script developer. You can find their work and profile on TradingView here: (in.tradingview.com).
---
## Key Features
### 1. Optimized Core Logic
- **MA Period (Default: 5):** The strategy is tuned with a shorter MA length to reduce lag and capture trends earlier.
- **Crossing Logic:** Signals are generated when the Moving Average of the **Close** crosses the Moving Average of the **Open**.
### 2. Multi-Timeframe (MTF) Analysis
- **Alternate Resolution:** Use a higher timeframe (Resolution Multiplier) to filter out noise. By default, it uses $3 \times$ your current chart timeframe to confirm the trend.
- **Non-Repainting:** Includes an optional delay offset to ensure signals are confirmed and do not disappear (repaint) after the bar closes.
### 3. Advanced Risk Management
This script features a hierarchical exit system to protect your capital and lock in profits:
- **Fixed Stop Loss (Initial):** Protects against sudden market reversals immediately after entry.
- **Delayed Trailing Stop Loss (TSL):**
- **Activation Delay:** The TSL only activates after the trade reaches a specific profit threshold (e.g., 1%). This prevents being stopped out too early in the trade's development.
- **Ratchet Trail:** Once activated, the stop loss "ratchets" up/down, never moving backward, ensuring you lock in profits as the trend continues.
- **Take Profit (TP):** A fixed percentage target to exit the trade at a pre-defined profit level.
### 4. Versatility
- **12 MA Types:** Choose from SMA, EMA, DEMA, TEMA, WMA, VWMA, SMMA, HullMA, LSMA, ALMA, SSMA, and TMA.
- **Trade Direction:** Toggle between Long-only, Short-only, or Both.
- **Visuals:** Optional bar coloring to visualize the trend directly on the candlesticks.
---
## User Input Guide
### Core Settings
- **Use Alternate Resolution?:** Enable this to use the MTF logic.
- **Multiplier for Alternate Resolution:** How many charts higher the "filter" timeframe should be.
- **MA Type:** Select your preferred moving average smoothing method.
- **MA Period:** The length of the Open/Close averages.
- **Delay Open/Close MA:** Use `1` or higher to force non-repainting behavior.
### Risk Management Settings
- **Use Trailing Stop Loss?:** Enables the TSL system.
- **Trailing Stop %:** The distance the stop follows behind the price.
- **TSL Activation % (Delay):** The profit % required before the TSL starts moving.
- **Initial Fixed Stop Loss %:** Your hard stop if the trade immediately goes against you.
- **Take Profit %:** Your ultimate profit target for the trade.
---
## How to Trade with This Strategy
1. **Identify the Trend:** Look for the Moving Average lines (Close vs Open) to cross.
2. **Wait for Confirmation:** If using MTF, ensure the higher timeframe also shows a trend change.
3. **Manage the Trade:** Let the TSL work. Once the trade hits the activation threshold, the TSL will take over, protecting your runner.
4. **Position Sizing:** Adjust the `Properties` tab in the script settings to match your desired capital allocation (Default is 10% of equity).
---
## Credits
Original Strategy by: **JustUncleL**
Optimized and Enhanced by: **Antigravity AI**

Intraday Options/Futures Naked By TradeEarnIntraday Momentum Strategy (Futures & Options)
Description: This is a specialized Intraday Momentum system designed for Indian Indices Nifty, BankNifty, FinNifty, Sensex and Crude Oil. It is engineered to simplify the automation process by standardizing quantity management for single-leg execution via third-party bridges.
Originality & Utility: Unlike standard momentum strategies, this script solves the complexity of position sizing across different asset classes. It features a custom "Smart Quantity" engine that automatically differentiates between Futures (Raw Quantity) and Index Options (Lot Multipliers), allowing traders to switch instruments without manually calculating order sizes.
Key Features:
Dual Mode: Supports both Futures (Long/Short) and Options Buying (Long CE / Long PE).
Smart Quantity Logic:
Futures/Crude: Inputs are treated as raw quantity (e.g., 1 Lot = 1 Qty).
Index Options: Inputs are automatically multiplied by the standard market lot size (e.g., 1 Lot Nifty = 25 Qty).
Rupee-Based Risk: Target, Stop Loss, and Trailing SL are defined in absolute Rupees (INR) rather than percentages, offering precise P&L control.
Choppiness Filter: Combines RSI and ADX to filter out low-volatility ranges.
Entry Logic:
Buy Signal: Green Impulse Candle + RSI > 55 + ADX > 20
Sell Signal: Red Impulse Candle + RSI < 45 + ADX > 20
Strategy Settings & Backtesting:
Commission: The strategy is backtested with a commission of ₹20 per order to reflect realistic net P&L.
Slippage: Users should account for realistic slippage in live trading, which is not factored into the script's hard values.
⚠️ Disclaimer & Statutory Warning
Strictly for Educational & Backtesting Purposes
1. SEBI Registration Status: The author of this script/strategy is NOT a SEBI registered Research Analyst (RA) or Investment Advisor (IA). This tool is provided solely to assist in backtesting logic and educational analysis. It does not constitute a recommendation to buy, sell, or hold any securities.
2. Market Risk: Investment in the securities market, particularly in Derivatives (Futures & Options), is subject to market risks. You may lose your entire capital. Please read all related scheme documents carefully before investing.
3. No Guarantees: Past performance of this algorithm (as shown in backtest results) is not indicative of future performance. Market conditions change, and slippage or execution errors can occur during live trading.
4. User Responsibility: By using this script, you acknowledge that you are solely responsible for your own trading decisions and financial losses. You are advised to consult a SEBI-registered financial advisor before deploying real capital. This script is intended for manual or semi-automated analysis and may not be compliant with high-frequency trading (HFT) regulations.

Ace Algo [Anson5129]🏆 Exclusive Indicator: Ace Algo
📈 Works for stocks, forex, crypto, indices
📈 Easy to use, real-time alerts, no repaint
📈 No grid, no martingale, no hedging
📈 One position at a time
----------------------------------------------------------------------------------------
Ace Algo
A trend-following TradingView strategy using a confluence of technical indicators and time-based rules for structured long/short entries and exits:
----------------------------------------------------------------------------------------
Parameters Explanation
Moving Average Length
Indicates the number of historical data points used for the average price calculation.
Shorter = volatile (short-term trends); longer = smoother (long-term trends, less noise).
Default: 20
Entry delay in bars
After a trade is closed, delay the next entry in bars. The lower the number, the more trades you will get.
Default: 4
Take Profit delay in bars
After a trade is opened, delay the take profit in bars. The lower the number, the more trades you will get.
Default: 3
Enable ADX Filter
No order will be placed when ADX < 20
Default: Uncheck
Block Period
Set a block period during which no trading will take place.
----------------------------------------------------------------------------------------
Entry Condition:
Only Long when the price is above the moving average (Orange line).
Only Short when the price is below the moving average (Orange line).
* Also, with some hidden parameter that I set in the backend.
Exit Condition:
When getting profit:
Trailing Stop Activates after a position has been open for a set number of bars (to avoid premature exits).
When losing money:
In a long position, when the price falls below the moving average, and the conditions for a short position are met, the long position will be closed, and the short position will be opened.
In a short position, when the price rises above the moving average, and the conditions for a long position are met, the short position will be closed, and the long position will be opened.
----------------------------------------------------------------------------------------
How to get access to the strategy
Read the author's instructions on the right to learn how to get access to the strategy.

Tailwind.(BTC)Imagine the price of Bitcoin is like a person climbing a staircase.
The Steps (Grid): Instead of watching every single price movement, the strategy divides the market into fixed steps. In your configuration, each step measures **3,000 points**. (Examples: 60,000, 63,000, 66,000...).
The Signal: We buy only when the price climbs a full step decisively.
The "Expensive Price" Filter: If the price jumps the step but lands too far away (the candle closes too high), we do not buy. It is like trying to board a train that has already started moving too fast; the risk is too high.
Rigid Exits: The Take Profit (TP) and Stop Loss (SL) are calculated from the edge of the step, not from the specific price where you managed to buy. This preserves the geometric structure of the market.
The Code Logic (Step-by-Step)
A. The Math of the Grid (`math.floor`)
pinescript
level_base = math.floor(close / step_size) * step_size
This is the most important line.
What does it do? It rounds the price down to the nearest multiple of 3,000.
Example: If BTC is at 64,500 and the step size is 3,000:
1. Divide: $64,500 / 3,000 = 21.5$
2. `math.floor` (Floor): Removes the decimals $\rightarrow$ remains $21$.
3. Multiply: $21 * 3,000 = 63,000$.
Result: The code knows that the current "floor" is **63,000**, regardless of whether the price is at 63,001 or 65,999.
B. The Strict Breakout (`strict_cross`)
pinescript
strict_cross = (open < level_base) and (close > level_base)
Most strategies only check if `close > level`. We do things slightly differently:
`open < level_base`: Requires the candle to have "born" *below* the line (e.g., opened at 62,900).
`close > level_base`: Requires the candle to have *finished* above the line (e.g., closed at 63,200).
Why? This avoids entering on gaps (price jumps where the market opens already very high) and confirms that there was real buying power crossing the line.
C. The "Expensive Price" Filter (`max_dist_pct`)
pinescript
limit_price_entry = level_base + (step_size * (max_dist_pct / 100.0))
price_is_valid = close <= limit_price_entry
Here you apply the percentage rule:
-If the level is 63,000 and the next is 66,000 (a difference of 3,000).
-If `max_dist_pct` is **60%**, the limit is $63,000 + (60\% \text{ of } 3,000) = 64,800$.
-If the breakout candle closes at **65,000**, the variable `price_is_valid` will be **false** and it will not enter the trade. This avoids buying at the ceiling.
D. TP and SL Calculation (Anchored to the Level)
pinescript
take_profit = level_base + (step_size * tp_mult)
stop_loss = level_base - (step_size * sl_mult)
Note that we use `level_base` and not `close`.
-If you entered because the price broke 63,000, your SL is calculated starting from 63,000.
-If your SL is 1.0x, your stop will be exactly at 60,000.
This is crucial: If you bought "expensive" (e.g., at 63,500), your real stop is wider (3,500 points) than if you bought cheap (63,100). Because you filter out expensive entries, you protect your Risk/Reward ratio.
E. Visual Management (`var line`)
The code uses `var` variables to remember the TP and SL lines and the `line.set_x2` function to stretch them to the right while the operation remains open, providing that visual reference on the chart until the trade ends.
Workflow Summary
Strategy Parameters:
Total Capital: $20,000
We will use 10% of total capital per trade.
Commissions: 0.1% per trade.
TP: 1.4
SL: 1
Step Size (Grid): 3,000
We use the 200 EMA as a trend filter.
Feel free to experiment with the parameters to your liking. Cheers.

Daily Dynamic Grid StrategyHi everyone,
This strategy is built around a dynamic daily grid concept, using an upper and lower daily range that is automatically divided into multiple grid levels.
The idea is to take advantage of daily volatility by executing DCA entries on specific grid levels, based on predefined conditions.
Key points of the strategy & feature:
I recommend using 1H or 2H timeframe for this strategy
Take profit by grid
When DCA is active (>1 entry), the exit condition switches to close above the average price
A hard stop loss is applied
Includes an optional Trailing TP / SL to help maximize profit during strong moves
Like most DCA-based strategies, it tends to have a high win rate, but during strong market dumps, losses can become relatively large
Can also be used for backtest on Forex markets such as Gold, where using the trailing option is generally more effective
And still trial for the webhook, may continue to improve and update this strategy in future versions.

Monarch Strategies Altcoin Optimized Cycle & Trend Strategy (1W)The Altcoin Optimized Cycle & Trend Strategy (1W) is a professional, long-term cycle and trend trading strategy designed specifically for altcoins such as Stellar (XLM). It is built for traders and investors who want to systematically capture explosive altcoin cycles while avoiding emotional decision-making and excessive trading.
The strategy operates on the weekly timeframe (1W) and focuses on identifying major accumulation zones, breakout phases, and distribution tops that typically define altcoin market behavior.

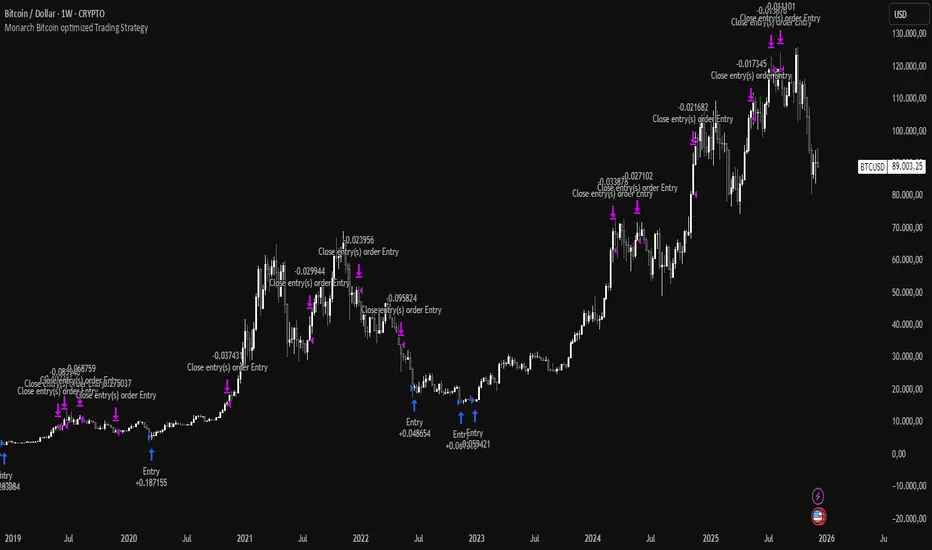
Monarch Strategies BTC Optimized Cycle & Trend Strategy (1W)The "BTC Optimized Cycle & Trend Strategy (1W)" is a high-quality, long-term optimized trading strategy for BTC/USD, designed for traders and investors who want to systematically trade major market cycles — without overtrading, without emotions, and without unnecessary complexity.
The strategy is specifically built for the weekly timeframe (1W) and focuses on what Bitcoin has historically done best: strong, multi-year trend movements.
PMax - Asymmetric MultipliersDescription: This script is an enhanced version of the popular PMax (Profit Maximizer) indicator, originally developed by KivancOzbilgic. It has been converted into a full strategy with advanced customization options for backtesting and trend following.
Key Features & Modifications:
Asymmetric ATR Multipliers: Unlike the standard version, this script allows you to set different ATR multipliers for Upper (Short/Resistance) and Lower (Long/Support) bands.
Default Upper: 1.5 (Tighter trailing for Short positions)
Default Lower: 3.0 (Wider trailing for Long positions to avoid whipsaws)
Expanded MA Types: Added HULL (HMA) and VAR (Variable Index Dynamic Average) options.
VAR is highly recommended for filtering out noise in ranging markets.
HULL is ideal for scalping and faster reactions.
Built-in Risk Management: A fixed 5% Stop Loss mechanism is integrated into the strategy. It protects your capital by closing positions if the price moves 5% against you, even if the trend hasn't reversed yet.
Visibility Fix: Solved the issue where the PMax line would disappear or start at zero in the initial bars.
How to Use:
Use the VAR MA type for trend following in volatile markets.
Adjust the "Stop Loss Percent" input to fit your risk appetite.
The strategy employs an "Always In" logic (Long/Short) but respects the hard Stop Loss.
Credits: Original PMax logic by KivancOzbilgic.

Time Syndicate: Prop Firm SpecialTime Syndicate – Prop-Firm Special (Exit-Focused Edition)
Overview
Time Syndicate – Master Strategy is a non-repainting, cycle-aware execution framework designed to trade structured market phases rather than random price movement.
This version has been specifically updated to focus on exit efficiency , trade management, and controlled trade churn.
The strategy is built to align trades with time-based market behavior and liquidity expansion, without relying on indicator stacking or repainting logic.
What This Version Is Optimized For
This update emphasizes:
• More structured exits
• Increased trade churning
• Improved realized profitability
• Mechanical trailing stop execution
The goal is not to increase entries, but to extract more value from correct ones .
Recommended Markets
• EUR/USD
• NASDAQ (NQ / US100 Cash CFD)
This strategy is primarily designed and tested for these instruments.
Recommended Cycles & Timeframes
90-Minute Cycle → Use 1-Minute chart
Session Cycle → Use 5-Minute chart
Do not mismatch cycle selection and chart timeframe.
Important Settings (Do Not Over-Optimize)
• Exit Mode: Trailing Stop (Default & Recommended)
• Max Trades Per Cycle: 1
• Target: 1 : 1.5
• Most other settings should remain unchanged
This is not a parameter-tuning strategy.
Trade Behavior
• Trade Status remains FLAT until a valid trade is triggered
• After entry, the dashboard displays:
– Entry Price
– Initial Stop Loss
– Trailing Trigger Level
– Live Trailing Stop (once activated)
In most cases, the entry candle’s low/high will act as the initial stop loss.
Exit Logic
Trailing Stop Mode
• Trailing activates only after price reaches the required expansion level
• Trailing is mechanical and non-emotional
• Live trailing stop updates are shown clearly on the chart
Fixed Target Mode
• Available for testing purposes
• Not recommended for live execution
Non-Repainting Logic
• All zones, cycles, and trade logic are non-repainting
• No historical shifting
• What appears live is final
Known Limitations (Current Version)
• Quantity calculation can be aggressive, especially on 1-minute charts
• Manual quantity is recommended for now
• Not every valid signal should be traded
These will be refined in future updates.
Recommended Trading Window
For US100 Cash CFD:
4:00 PM – 8:00 PM IST
Outside this window, liquidity behavior becomes inconsistent.
Advanced Usage Tip
Download strategy trade data and analyze:
• Time of day
• Cycle performance
• Trade outcomes
Use this data to determine the most effective trading hours for your instrument.
Purpose of This Strategy
This is not a signal-spamming indicator.
It is a professional execution framework built to:
• Enforce discipline
• Improve exit quality
• Reduce emotional decision-making
• Align trades with structured market phases
Final Note
This strategy does not predict the market.
It waits, reacts, and extracts.
Use it with patience, proper risk control, and respect for time-based structure.
