Rogue Profit Alert IndicatorThis is a complex script developed to measure specific volatility parameters and enter trades based on predetermined rules which are proprietary and will not be released, so don't ask for specific indicator settings.
This indicator accompanies the "Rogue Profit Strategy" and can be used for creating alerts based on the strategy's performance. Please read the more in depth description on the "Rogue Profit Strategy" page. Make sure the input parameters are the same for both the Strategy and Indicator to insure accurate signals.
This is a very powerful and profitable script that will simplify your trading and has been in development and tested for three years. Message for details on how to obtain access. Please allow up to 24 hours for a response.
ابحث في النصوص البرمجية عن "the strat"

Candle State (The Strat)This script identifies the 2 different Candle States for use in #TheStrat.
Candle Up - The close of the current candle is greater than the close of the previous candle.
Candle Down - The close of the current candle is less than the close of the previous candle.
Though this script is extremely simple it is a teaching aid for #TheStrat.
The script also assists in the identification of up and down candles with gaps where the color of candle will not always match the Candle State.
Analysis of the candle types can help you define actionable signals and draw broadening formations.
Disclaimer: All scripts from this account are for informational purposes only and do not produce buy or sell recommendations.
© 2020 Crinklebine

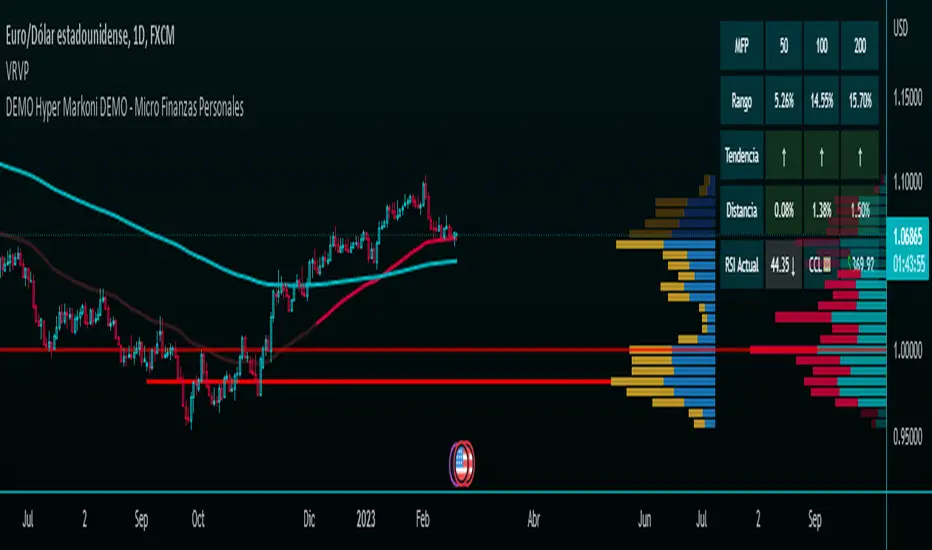
MarkoniWhat is the Markoni?
Markoni is an oscillator indicator that has 4 user configurable moving averages, these can be simple, exponential or weighted. Each moving average has a default value of 8, 21, 50, 200, but the user can modify it as they wish.
It should be clarified that both the average of 8 and 21 as well as that of 50 and 200 mark the crossings between them!
That is to say, the one of 8 crosses the one of 21 and the one of 50 the one of 200. This crossing is indicated with an X for greater ease and it is also configurable to see it or not.
A PSAR with cloud and Buy and Sell points is added to help us see the short-term trends along with the emas of 8 and 21
The strategy would be to see the base trend first! long term, that is to say to see the emas of 50 and 200. and if we want to see something in the short term we can review the emas of 8 and 21.
If the emas of 50 and 200 give us an upward cross (indicated by the green cross) that would give a golden cross, and combined with other indicators it would give a good buy signal.
If the ema of 50 does not touch that of 200, we can see the other emas (8 and 21) and the PSAR to be able to put together short strategies based on what the emas tell us.
Finally a label was added with the price of the last candle, merely aesthetic which can be hidden
Both the moving averages and the PSAR are configurable to suit the user.
------------------------------------------------------------------------------------------------------------------------------------------------------------------------------
Que es el Markoni?
Markoni es un indicador oscilador que cuenta con 4 medias móviles configurables para el usuario, estas pueden ser simples, exponenciales o ponderadas. Cada media móvil tiene por defecto un valor de 8 , 21 , 50 , 200 , pero el usuario puede modificarla a su gusto.
Cabe aclara que tanto la media de 8 y 21 como la de 50 y 200 marcan los cruces entre si!
Es decir la de 8 cruza la de 21 y la de 50 la de 200. Este cruce se indica con una X para mayor facilidad y también es configurable el verlo o no.
Se le agrega un PSAR con nube y puntos de Compra y Venta, para ayudarnos a ver las tendencias de corto plazo junto a las emas de 8 y 21
La estrategia seria ver primero la tendencia base! de largo plazo, es decir ver las emas de 50 y 200. y si queremos ver algo a mas corto plazo poder revisar las emas de 8 y 21.
Si las emas de 50 y 200 nos dan cruce hacia arriba (indicado por la cruz verde) eso daría un cruce dorado, y combinado a otros indicadores daría una buena señal de compra
Si la ema de 50 no toca la de 200, podemos ver las otras emas (8y 21) y el PSAR para poder armar estrategias de corto basándonos en lo que nos dicen las emas.
Por ultimo se agrego una etiqueta con el precio de la ultima vela, meramente estético el cual se puede ocultar
Tanto las medias móviles como el PSAR son configurables a gusto del usuario.
STEMWAPThis update includes the stop loss long and stop loss short adjustments as well as VWAP tuning into the STEM script.
I tend to not use the VWAP tuning but sometimes the strategy script will benefit slightly from using it.
The adjustment values make a huge difference, especially when using this on shorter time frames.
The idea is to tweak the strategy settings until you have something profitable, then set your stemwap to those settings and use it as a helpful guideline for your day trades.

EMA Mean Reversionthis is a mean reversion strategy using ema std deviations
use flat scaling 5 orders buy and sell - just close it back when it hits the VWMA
strategy operates to make dozens of small profitable trades in exchange for a larger loss on rare trending moves.
It works by projecting five 0.5% std deviations from the ema as volatility bands to help you scale into shorts and longs. generally flat scaling will work better than ascending. there is no SL logic for the strategy - positions should be closed when prices crosses back through the VWMA . To be used on lower timeframes only as the bands to do not expand or contract according to ATR
Stochastic FibonacciThis is your run-of-the-mill stochastic indicator, with one slight difference. I added Fibonacci ratios and colored them across the rainbow for aesthetics.
I noticed that the stochastic moving averages, K & D, would reverse in between 0 & 100. Just like price, they were likely Fibonacci ratios.
My original plan was to create a strategy script, and trade whenever K & D crosses the Fib levels. However, they do not cross them perfectly, rather they merely float near them and reverse. Therefore, the strategy would have never made the trades.
As you will notice in the script, there is Bitcoin Hash Rate data imported. I did so because I would like to create a stochastic hash rate indicator at some point. For those of you with this same passion, there is the hash data to mess around with; consider it an Easter Egg...

Sqeeze Momentum, DMI and Parabolic SAR study with alertsThe study combines Sqeeze Momentum, Directional Movement Index (DMI) and Parabolic SAR indicators indicators providing you with a powerful indicator with long and short scalping strategies in it
When conditions of long or short position from all mentioned indicators are met script opens position. Once trend changes it closes position and fixes profit
Advantages:
1. Deal start alert condition includes the folowing filters and requirements:
- Momentum value is adjusted using a relative proportion of volume at each timeframe scale to exclude a chance of opening position at a low impulse stage
- Squeeze momentum trigger condition is automatically checked before a position is opened
- +DI , -DI and ADX values are taken into account to confirm the trend direction
- Position size is taken into account to ensure there will not be opened any excess deals or alerts
2. Exit deal alert condition was modified using Parabolic SAR indicator. Hence, it is ensured positions will not be closed in a middle of a trend
3. Study allows you to apply custom alerts to any position you would like thus you can connect your own trading panels with TradingView Webhooks
If you want to obtain access to the strategy please send us a personal message

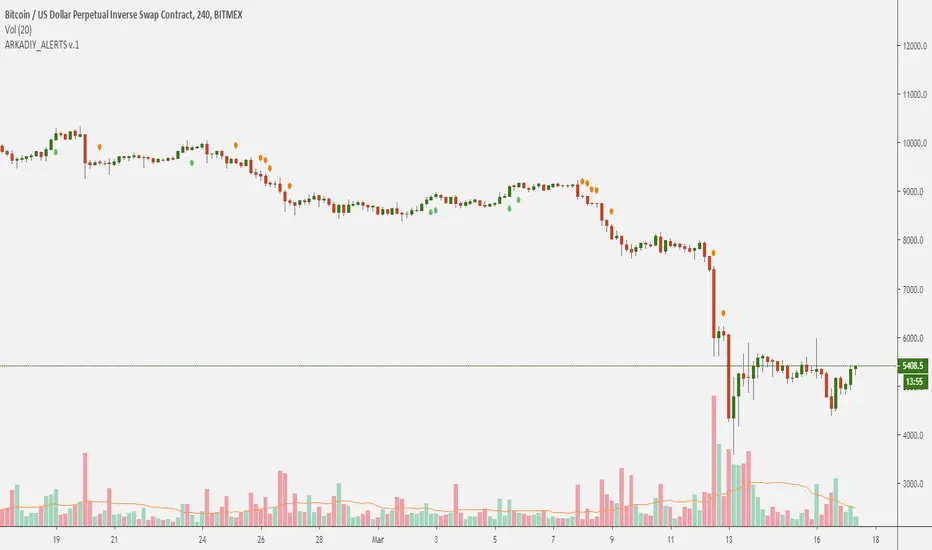
ARKADIY_ALERTS v1.0
This is an alert indicator for ARKADIY v 1.0 strategy .
Use it along with the strategy to receive alerts when the strategy generates buy/sell signals.
The strategy and the alert indicator are invite only.
To get access please write in coomments or pm me.
------------------------------------------------------------------
Данный индикатор является алертом для стратегии ARKADIY v 1.0 .
Используйте его вместе со стратегией для получение уведомлений когда будут генерироваться сигналы на покупку/продажу.
Индикатор и стратегия ограничены по доступу.
Для получения доступа пишите в комментарии и в сообщениях.
3XCROSS ALERTSThis is an alert indicator for 3XCROSS STRATEGY_V-CRYPTO .
HOW TO USE
Use it with the strategy and receive alerts in your tradingview platform.
1. Click alerts button on the right top.
2. Click create alert and choose long, short or cross in Condition menu.
3. Choose how often you want to receive the alerts.
If you have paid subscription you can use multiple alerts. For example for long and short signals separately.
But if you are using free subsctiption, you can create only one alert.
In this case you should use cross alert. And you will receive an alert all the time when EMAs cross up or down,
signalling for long or short.
Use it carefully and leave your feedback.

Candle Type w/2Up + 2DnCandle Type is based on @robintheblack's "THE STRAT" philosophy and @crinklebine's "candle type" pine script.
This version distinguishes 4 potential candle types:
I = Inside previous bar's range
O = Outside previous bar's range
U = Up (high is greater than previous bar's range & NOT outside)
D = Down (low is lower than previous bar's range & NOT ouside)

ft.sg.fast_slow_EMA_trendThe dragon has awoken from his long winter sleep, ready to share his luck.
The following script emits signals when the (fast_ema - slow_ema) crosses zero 0 & longterm momentum is trending upward. The strat works well with the current BTC market (5 min chart, feb 2020).
Use ft.bt.signal_overlay to visualize buys and sells & ft.bt.analyser to asses overall performance. Custom alerts can be generated from the hidden signal line, (eg. 1=long, -1=short).

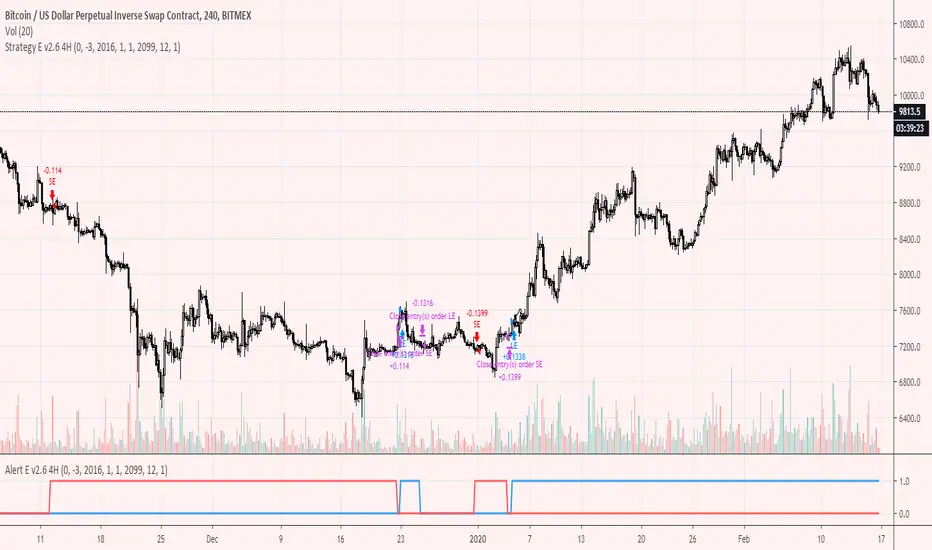
Trend-following Alert E v2.6 4HHi All,
Welcome to my second published Trend-following strategy for bitcoin , designed specifically for BITMEX:XBTUSD on 4H
This is an extension of my first script but then for the 4H timeframe.
This script is the Alert script to use for settings up Alerts on Tradingview.
The accompanying strategy script and explanations/caveats you can find here:
In this script you will find the "active_long" and "active_long" variables (red and blue lines) that show which positions are being taken by the strategy script.
You can set 'Once per bar close' alerts for this to get your alerts on TV.
For instance, I use 'crossing up @ 0.1' on "active_long" to set an 'Open Long" alert and a 'crossing down @ 0.9' to set a 'Close Long' alert.
The same holds for the 'Open Short' and the 'Close Short' alerts but then for the 'active_short' variable.
I've also added start and end dates to test specific time periods.
Please let me know if you have any questions.
Hull Suite alerts hamster-botThis is a trading strategy on the Hull Suite indicator. 3 Hull variations: HMA , THMA (3HMA), EHMA. The strategy is always in position according to the trend of the indicator. Alerts now work.

GTS_Simple_EMA_Strategy_TEST_ONLY_1.3I am not a trader or coder and learning in progress/
This just a simple moving average strategy/
Simply define your first and second MA then backtest the strategy/
Release Notes: - **Using on DAY chart for this iteration/
WARNING! YOU MUST BACK TEST ON DIFFERENT TIME FRAME./

Trend-following Alert E v2.6Hi All,
Welcome to my first published Trend-following strategy for bitcoin , designed specifically for BITMEX:XBTUSD.
This script is the Alert script to use for settings up Alerts on Tradingview.
The accompanying strategy script and explanations/caveats you can find here:
In this script you will find the "active_long" and "active_long" variables (red and blue lines) that show which positions are being taken by the strategy script.
You can set 'Once per bar close' alerts for this to get your alerts on TV.
For instance, I use 'crossing up @ 0.1' on "active_long" to set an 'Open Long" alert and a 'crossing down @ 0.9' to set a 'Close Long' alert.
The same holds for the 'Open Short' and the 'Close Short' alerts but then for the 'active_short' variable.
Please let me know if you have any questions.

Simple EMA Strategy TEST_ONLY
I am not an experienced coder and learning in progress
This just a simple moving average strategy
Simply define your first and second MA then backtest the strategy
Release Notes: - **Using on DAY chart for this iteration
Long and Short, immediately alternating

ORTI Bollinger Bands V3 (Static Timeframe Multi-Period)The "ORTI Bollinger Bands V3 (Static Timeframe Multi-Period MA)" is public scrypt, based in a previous study, but with some better functions (“ORTI Bollinger Bands V2 (Static Timeframe Multi-Period MA”).
This is a redesigned and recalculated set of the common plotted lines with the typical two "Standard Deviations" (positively and negatively) away from the original calculation of a "Simple Moving Average" of the security's price.
But now, with the option to convert the "Simple Moving Average" to adapt into 9 different kinds of "Moving Averages", to have a much more robust indicator which in turn would serve both as "Bollinger Bands" and by any of the most used "Moving Averages", a hybrid basically.
The following options to convert the "Simple Moving Average" ( SMA ) to:
• Exponential Moving Average ( EMA )
• Weighted Moving Average ( WMA )
• Arnaud Legoux Moving Average ( ALMA )
• Hull Moving Average ( HMA )
• Volume-weighted Moving Average ( VWMA )
• Least Square Moving Average ( LSMA )
• Smoothed Moving Average ( SMMA )
• Double Exponential Moving Average ( DEMA )
The cherry on the top , for this private version: is when you want to get a predetermined count in "natural temporalities" as minutes, hours or days, in any graph you could get a static average, and this count will be automatically respected. For example, a "Moving Average" could be configurated to know a trend per day, week or month... or whatever comes to mind, and at every single chart that you move through (5m, 15m, 1h, 4h, etc), you will see the same average to make your own "trend analysis" into a micro/macro market view.
As in traditional "Bollinger Bands", the "Standard Deviations" are still a measure of volatility , when markets become more volatile, bands widen, during the less volatile periods, the bands contract.
A common fact in trading is that, prices vary most of the time and there is a lot of truth in this assertion, since the markets consolidate mainly as bullish andbearish . Market trends are sometimes very rare, so trading them may not be as easy as you might think. If we look at prices in this way, we can define the trend as a deviation from the norm (rank).
Usually, most Traders use “Moving Averages” to identify commercial areas and analyze markets. A “Moving Average” helps the Trader isolate the trend a lot and can also indicate when a trend may be receding.
The importance of using any of the “Moving Averages” in the “Bollinger Bands”, becomes a reality and reveals the average price of a marketable instrument in a given period of time. However, there are different ways to calculate the averages, and that is why there are different types of “Moving Averages”. They are called "in motion" because, as the price moves, new data is added to the calculation, thus changing the average.
The base of the “Bollinger Bands” measures and represents the deviation or volatility of the price and this is the reason why they can be very useful to identify a trend. Even the use of two sets of “Bollinger Bands”, one generated with the parameter "one Standard Deviation" and the other with the typical configuration of "two Standard Deviations", can help us to see the price in a different way.
Another great advantage of “Bollinger Bands” is that, they adjust dynamically as volatility increases and decreases. As a result, the “Bollinger Bands” automatically expand and contract in synchronization with the price action, creating an envelope of precise trends.
Note: The previous calculation example is not the default, the parameters can be adjusted according to the criteria of the merchant.
As everyone knows, and as you can find on the internet, the "Moving Averages" are one of the most commonly used technical indicators in Stock, Futures , Forex and Crypto trading. Market analysts and traders, use "Moving Averages" to help identify trends in price fluctuations, smoothing out the noise and short-lived spikes (from news and earnings announcements, for example) for individual securities or indexes.
They are calculated by adding recent closing prices and then dividing that by the number of time periods in the calculation average. A simple, or arithmetic, a "Moving Average" that is calculated by adding the closing price of the security for several time periods and then dividing this total by that same number of periods. Short-term averages respond quickly to changes in the price of the underlying, while long-term averages are slow to react.
There are different types of "Moving Averages", calculated in different ways and over different time periods, which reveal different information for traders. The type of "Moving Average" and measurement period used determine the strategies a trader implements. So, many traders watch for short-term averages to cross above longer-term averages to signal the beginning of an uptrend. Short-term averages can act as levels of support when the price experiences a pullback.
As is usual, traders and market analysts commonly use several periods in creating "Moving Averages" to plot on their charts. For identifying significant, long-term support and resistance levels and overall trends, but they only consider the 50-day, 100-day and 200-day moving averages as the most common. Based on historical statistics, these longer-term moving averages are considered more reliable trend indicators and less susceptible to temporary fluctuations in price.
There is such popular trading patterns that use "Simple Moving Averages" include the “death cross” and a “golden cross”. A “death cross” occurs when the short period "Moving Average" crosses below the long period "Moving Average" and this is considered abearish signal that further losses are in store; the “golden cross” occurs when a short-term "Moving Average" breaks above a long-term moving average, this can signal further gains are in store, that is interpreted as bearish .
The 5-, 10-, 20-, and 50-day moving averages are often used to spot near-term trend changes. Changes in direction by any of these shorter-term "Moving Averages" are watched as possible early clues to longer-term trend changes. Crossovers of the 50-day moving average by either the 10-day or 20-day "Moving Averages" are regarded as significant. The 10-day "Moving Average", plotted on an hourly chart, is frequently used to guide traders in intraday trading.
For more technical information: Investopedia
But why we have to use in our TECHNICAL ANALYSISthe same Moving Averages (10, 20, 30, 50, 100 and 200) for all time frame OHLC charts (1m, 5m, 15m, 1h, 4h, 1d, 1w and 1m)? That does not make any sense.
This is when you must go back to (statistic) basics: reliability and validity are a very important aspects of selecting a survey instrument. Reliability refers to the extent that the instrument yields the same results over multiple trials. Validity refers to the extent that the instrument measures what it was designed to measure.
Content validity measures the extent to which the items that comprise the scale accurately represent or measure the information that is being assessed. Are the real traders answering this question, that are asked representative of the possible data that they are trying to read? Well, I think maybe not.
Such as correlations, to verify the relevance of the “timeframe” questions, we could start at… Operation hours, the first data that has you should find may be is correlated with questions from: Does your trend indicator has a straight relationship of time under your time-analisys examination to determine if validity is present? If the scores are highly correlated, it is called convergent validity, then if convergent validity exists and validity is supported.
Criterion-related validity has to do with how well works the counting from the instrument, as a known outcome they are expected in a real, natural and measurable lapse time. Such as correlations are used to determine if criterion-related validity your counting data, would must be at: minutes, days, weeks, months, etc.
That is when we start with the rhythm, as in music. If your trading day in operation at Forex is made up of 24-hours, during 5-days of the week, there you have your first clue. Now, what did you want and have to measure? Well, first of all you need a daily, weekly and monthly count to begin with all your indicators.
For some reason, there are a lot of questions about time and calendars which all are answered by reference to astrology, because the original purpose of astrology was to create a reliable method of measuring the passage of time, the clock by which we live our lives: 12 Hours. It is very interesting!
Even though there are really 24 hours in a day, but therefore you would think we should have 12-time units in our day, not 24, each of which is twice as long as our current hour. But the only reason we would think like this is because we have forgotten about the way ancient astrology divides the time lapses into smaller units.
And now, the next step is when you should refresh your elementary school classes, those mathematics that I'm pretty sure you so hated: relation of prime numbers, compound numbers, divisible numbers and multiples.
You may think about the relationship that exists between the time period and the operative session, as well as the chart that you are consulting; so then, you must find the ideal configuration of those numbers that are only divisible between themselves and 1, or the numbers that besides being divisible by themselves and the unit and are also divisible by other numbers.
For example: for an hourly chart, if a day is divided into 24-hours in base of the number 12, is because it has a larger number of integer factors: 12/6=2, 12/4=3, 12/3=4, 12/2=6. Son then, all of your other indicators should find this relation.
This is when you must start questioning yourself, if you are really working with an adequate configuration of Moving Averages and Oscillators?
Another example:
• Relative Strength Index (14)
• Stochastic %K (14, 3, 3)
• Commodity Channel Index (20)
• Average Directional Index (14)
• Momentum (10)
• MACD Level (12, 26, 9)
• Stochastic RSI Fast (3, 3, 14, 14)
• Williams Percent Range (14)
• Ultimate Oscillator (7, 14, 28)
Hancock - Filtered Volume OBV OSC [Alerts]This is an alert version of the strategy found here
This doesn't have the trailing stop or stop loss risk management included, i'll work on a release that has risk management included as best i can with alerts. Make sure to set a stop loss with your alert command.
Happy trading
Hancock

THE HITMAN - Advanced Market Momentum FinderThe Hitman indicator is a tool to detect momentum swings in the market. Its intention is to identify good entry and exit points and alert you to have a closer look at the charts. It can be used on any chart, timeframe or market.
This script is meant to build your alerts on. For backtesting different settings we recommend you to use the "THE HITMAN Strategy Tester".
In detail we measure the strength of a trend by different values like volatility , price averages and trend momentum and calculates for every candle, if a change in trend appears or not. The calculation can be influenced by changing three Inputs values.
We do this for getting the best possible results from the Hitman The purpose of this strategy script is to help you identify proper settings for the asset and timeframe you want to trade. There is no general setting that fits it all. You have to find the settings that fits best to your life, your trading style, the assets you trade and the timeframe you trade on. For the strategy on BTCUSD chart shown below, we used the following inputs (25, 2, 20).
Be aware, that all results will be based on data from the past. There is no guarantee that the results you get by back testing, will also be achieved in the future.
An overview of how to use the 3 different options in the settings:
- Signal Strength: The higher this number, the stronger each signal gets. Naturally this means, you will get less signals with a high number. A strong signal is not a guarantee for a big move in the market neither it there any guarantee that the market moves in the projected direction. As the volatility is considered in calculating the strength of the signal, the numerical value may be the same buts its meaning for the calculation could be totally different. This means, on an asset with high volatility the signal strength has to be higher than on an asset with lower volatility .
- Sensitivity: Is calculated into the signal strength. It has the highest impact on the numbers of signal shown but also when a change in the trend is signaled on the chart. The lower the number to more and earlier you get the signals. Enter a decimal to finetune it even further. But be aware that a too low number will create a lot of signals which could make it hard to identify true changes in trend.
- Considered Volatility Range: Here you can set up the considered volatility range. It's impact highly depends on the asset you use it. The number does represent the amount of candles that have to be considered to calculate the strength of the signal.
How to use it?
We recommend to use the signal only in direction of the trend. It can be used to scalp against the trend but for Risk Management reasons we advise not to do so. In sideways movement we recommend to look out for channels or levels of resistance and support and use the signal of the script as confirmation.

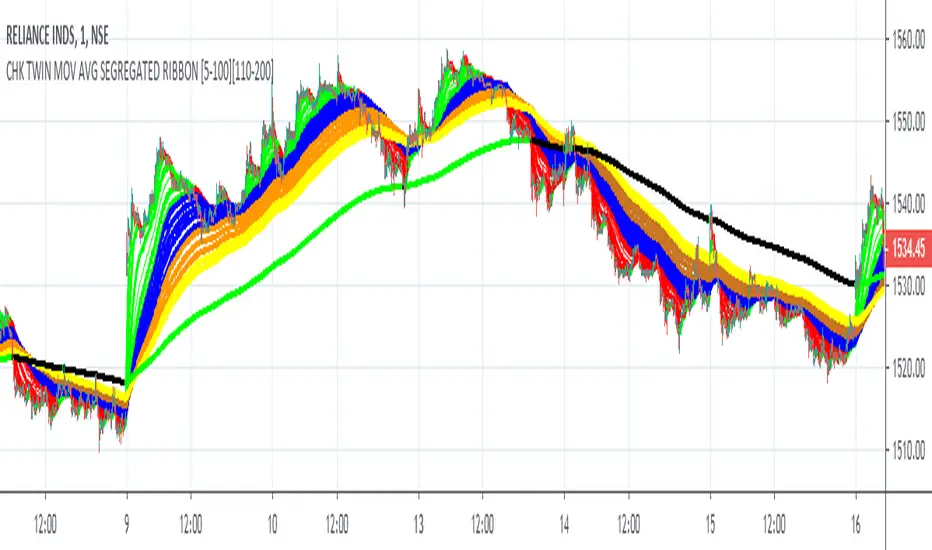
FALSE BREAKOUT NO PROBLEM !! CHK TWIN MOV AVG SEGREGATED RIBBON PROBLEM DEFINITION 1 : To Avoid False Breakouts
PROBLEM DEFINITION 2 : To Ascertain if the trend has changed when a Stock opens with a Gap up or Gap Down
## PROBABLE SOLUTION : Use a Moving Average with lot of latency
## PROBLEM WITH ABOVE SOLUTION : Misses on lot of trades, Late exits leads to drain on winning trades
S O L U T I O N
An Indicator which plots two different types of Moving Averages at the same time
For the MA length 5-100 a fast plot of choice
For the MA Length 110-200 a plot with a lag to ascertain the trend
And then ONE LAST MAN STANDING with even bigger MA length for a lagging indicator to save the day
This indicator gives one 9X9 = 81 Permutation Combinations to look at the markets
One can devise strategies basis if one particular MA Type has crossed another MA Type
Feel free to post the strategies you have come out with!
//// CREDITS AND ACKNOWLEDGEMENTS //////////////////////////////////////////////////////////////////
Following contributors helped the author ::
Credits to Neobutane for his Multiple Type Mov. Avg. Guppy at ......
hxxps://www.tradingview.c0m/script/UQAv1U0c-MA-Study-Different-Types-and-More-NeoButane/
Credits to Jose5770 for sharing Jurik MA code at .....
hxxps://www.tradingview.c0m/script/uqYvkHna-Trend-Direction-Force-Index/
Appreciate and Thank You for sharing your work.
//////////////////////////////////////////////////////////////////////////////////////////////////////
P.S You might notice in the code that the few plots are skipped. It is done to fasten the indicator without compromising
on the functionality
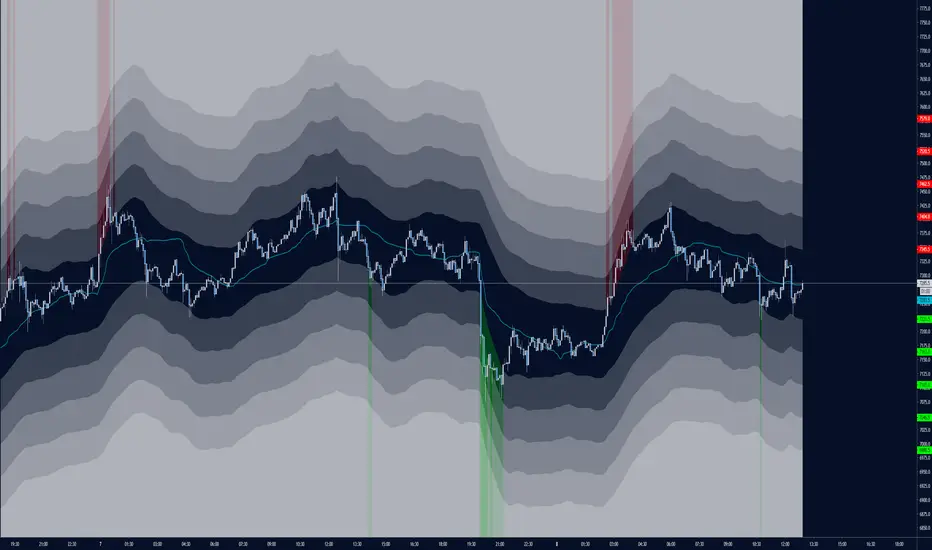
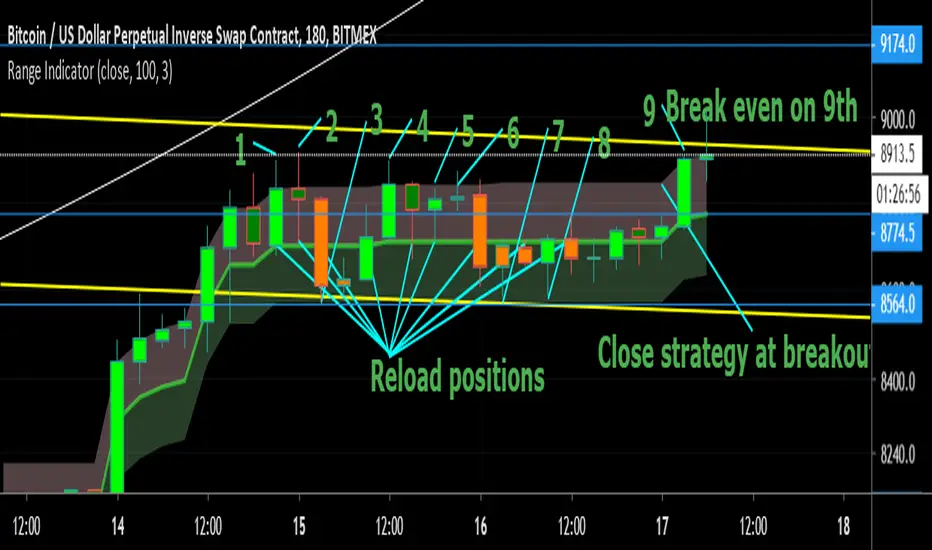
Range Indicator - Bitcoin BeatsHello, Hello, Hello,
And welcome back to Bitcoin Beats.
Today I'm going to show you my Ranges Indicator. Designed initially for breakouts but an analysts mind quickly spots the other uses for this indicator.
If we are consolidating (which is most of the time) a good strategy to trade would be to trade ranges. However, as soon as you spot the range it can feel like the range has changed so you lose out on making the monies.
This indicator plots out the average range in a consolidation allowing you to take action and make those monies.
I've highlighted a profitable strategy in the picture that means you can make money on bitcoin when it goes sideways.
Usually if it is appearing volatile, you can go to a higher time frame and find the exact range it's catering to, adjusting your strategy accordingly.
The strategy I've highlighted in accordance with this indicator is longing AND shorting from the center point of a range and cashing out either side until the range breaks.
If you'd like a trial, please leave a comment and I'll add you to the list :)
See you soon,
Goodbye, from Bitcoin Beats.
SMAX Study v2.0 KGS Edition Pine v4The base code for this script has been derived from Yellow Flower's 'SMAX Strategy'. The strategy is intended to be used on the 1HR Chart for best results, however it can be used on any timeframe you desire.
The following updates have been implemented:
Updated to Pine v4. There is no repainting in this script as it does not utilize the security ticker function.
Position size is no longer fixed to 1 contract. Pyramiding has been removed from the code.
Various miscellaneous syntax changes to optimise code.
Other Notes:
// Optimised Chart Settings:
// 15m superLength = 48, fastLength = 1536
// 1h superLength = 12, fastLength = 384, TS: 9%, SL: 5%, TP: 68%
// 4h superLength = 3, fastLength = 96
// 1D superLength = 0.5, fastLength = 16

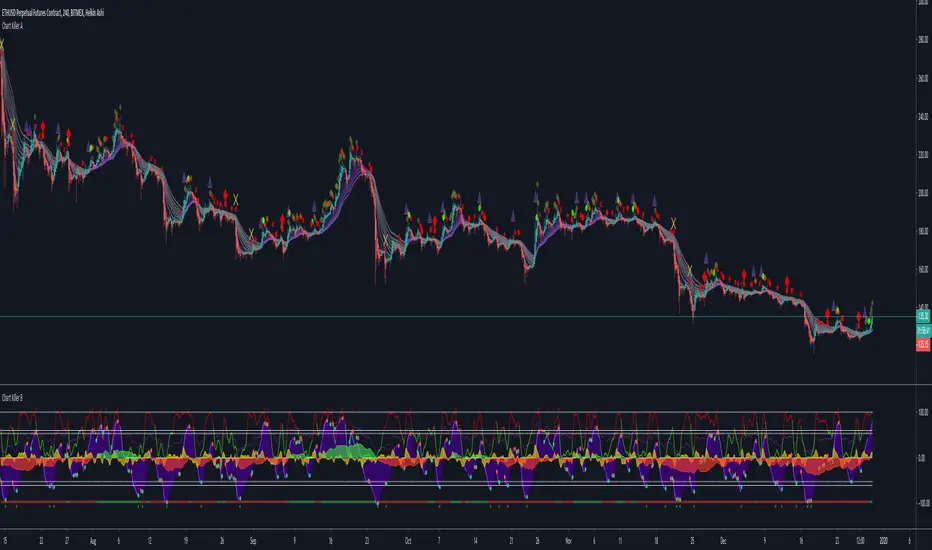
Chart Killer BChart Killer B combines five well known algorithms (VWAP, MFI, RSI, Stoch, Wave Trend)
Primary Triggers:
Green Dots – Leading buy signals that excel in sideways and upward trends.
Red Dots – Leading sell signals that excel in sideways and downward trends.
Purple Waves – You are looking for overbought and oversold readings for the most part here, but to get the most out of these waves, learn how to spot divergent price action which often foreshadows a future price move.
Yellow VWAP – We have incorporated the VWAP into an oscillator. It is the easiest algorithm on B to read. When it crosses up, you are long until the next cross down. When it crosses down, you are short until the next cross up.
Secondary Triggers:
MFI – The custom Money Flow oscillator gives a great visual of market conditions. When it is green, we say the grass is growing, the Bulls are grazing, and the strategy is to buy dips. When the MFI is red, buyers are dead, and the prevailing strategy is to short the peaks. You can filter many bad trades by paying attention to the MFI.
RSI – The RSI misses many opportunities on its own, but when used in tandem the other oscillators in B, can provide an extra layer of confidence via overbought and oversold readings.