888 BOT #backtest█ 888 BOT #backtest (open source)
This is an Expert Advisor 'EA' or Automated trading script for ‘longs’ and ‘shorts’, which uses only a Take Profit or, in the worst case, a Stop Loss to close the trade.
It's a much improved version of the previous ‘Repanocha’. It doesn`t use 'Trailing Stop' or 'security()' functions (although using a security function doesn`t mean that the script repaints) and all signals are confirmed, therefore the script doesn`t repaint in alert mode and is accurate in backtest mode.
Apart from the previous indicators, some more and other functions have been added for Stop-Loss, re-entry and leverage.
It uses 8 indicators, (many of you already know what they are, but in case there is someone new), these are the following:
1. Jurik Moving Average
It's a moving average created by Mark Jurik for professionals which eliminates the 'lag' or delay of the signal. It's better than other moving averages like EMA , DEMA , AMA or T3.
There are two ways to decrease noise using JMA . Increasing the 'LENGTH' parameter will cause JMA to move more slowly and therefore reduce noise at the expense of adding 'lag'
The 'JMA LENGTH', 'PHASE' and 'POWER' parameters offer a way to select the optimal balance between 'lag' and over boost.
Green: Bullish , Red: Bearish .
2. Range filter
Created by Donovan Wall, its function is to filter or eliminate noise and to better determine the price trend in the short term.
First, a uniform average price range 'SAMPLING PERIOD' is calculated for the filter base and multiplied by a specific quantity 'RANGE MULTIPLIER'.
The filter is then calculated by adjusting price movements that do not exceed the specified range.
Finally, the target ranges are plotted to show the prices that will trigger the filter movement.
Green: Bullish , Red: Bearish .
3. Average Directional Index ( ADX Classic) and ( ADX Masanakamura)
It's an indicator designed by Welles Wilder to measure the strength and direction of the market trend. The price movement is strong when the ADX has a positive slope and is above a certain minimum level 'ADX THRESHOLD' and for a given period 'ADX LENGTH'.
The green color of the bars indicates that the trend is bullish and that the ADX is above the level established by the threshold.
The red color of the bars indicates that the trend is down and that the ADX is above the threshold level.
The orange color of the bars indicates that the price is not strong and will surely lateralize.
You can choose between the classic option and the one created by a certain 'Masanakamura'. The main difference between the two is that in the first it uses RMA () and in the second SMA () in its calculation.
4. Parabolic SAR
This indicator, also created by Welles Wilder, places points that help define a trend. The Parabolic SAR can follow the price above or below, the peculiarity that it offers is that when the price touches the indicator, it jumps to the other side of the price (if the Parabolic SAR was below the price it jumps up and vice versa) to a distance predetermined by the indicator. At this time the indicator continues to follow the price, reducing the distance with each candle until it is finally touched again by the price and the process starts again. This procedure explains the name of the indicator: the Parabolic SAR follows the price generating a characteristic parabolic shape, when the price touches it, stops and turns ( SAR is the acronym for 'stop and reverse'), giving rise to a new cycle. When the points are below the price, the trend is up, while the points above the price indicate a downward trend.
5. RSI with Volume
This indicator was created by LazyBear from the popular RSI .
The RSI is an oscillator-type indicator used in technical analysis and also created by Welles Wilder that shows the strength of the price by comparing individual movements up or down in successive closing prices.
LazyBear added a volume parameter that makes it more accurate to the market movement.
A good way to use RSI is by considering the 50 'RSI CENTER LINE' centerline. When the oscillator is above, the trend is bullish and when it is below, the trend is bearish .
6. Moving Average Convergence Divergence ( MACD ) and ( MAC-Z )
It was created by Gerald Appel. Subsequently, the histogram was added to anticipate the crossing of MA. Broadly speaking, we can say that the MACD is an oscillator consisting of two moving averages that rotate around the zero line. The MACD line is the difference between a short moving average 'MACD FAST MA LENGTH' and a long moving average 'MACD SLOW MA LENGTH'. It's an indicator that allows us to have a reference on the trend of the asset on which it is operating, thus generating market entry and exit signals.
We can talk about a bull market when the MACD histogram is above the zero line, along with the signal line, while we are talking about a bear market when the MACD histogram is below the zero line.
There is the option of using the MAC-Z indicator created by LazyBear, which according to its author is more effective, by using the parameter VWAP ( volume weighted average price ) 'Z-VWAP LENGTH' together with a standard deviation 'STDEV LENGTH' in its calculation.
7. Volume Condition
Volume indicates the number of participants in this war between bulls and bears, the more volume the more likely the price will move in favor of the trend. A low trading volume indicates a lower number of participants and interest in the instrument in question. Low volumes may reveal weakness behind a price movement.
With this condition, those signals whose volume is less than the volume SMA for a period 'SMA VOLUME LENGTH' multiplied by a factor 'VOLUME FACTOR' are filtered. In addition, it determines the leverage used, the more volume , the more participants, the more probability that the price will move in our favor, that is, we can use more leverage. The leverage in this script is determined by how many times the volume is above the SMA line.
The maximum leverage is 8.
8. Bollinger Bands
This indicator was created by John Bollinger and consists of three bands that are drawn superimposed on the price evolution graph.
The central band is a moving average, normally a simple moving average calculated with 20 periods is used. ('BB LENGTH' Number of periods of the moving average)
The upper band is calculated by adding the value of the simple moving average X times the standard deviation of the moving average. ('BB MULTIPLIER' Number of times the standard deviation of the moving average)
The lower band is calculated by subtracting the simple moving average X times the standard deviation of the moving average.
the band between the upper and lower bands contains, statistically, almost 90% of the possible price variations, which means that any movement of the price outside the bands has special relevance.
In practical terms, Bollinger bands behave as if they were an elastic band so that, if the price touches them, it has a high probability of bouncing.
Sometimes, after the entry order is filled, the price is returned to the opposite side. If price touch the Bollinger band in the same previous conditions, another order is filled in the same direction of the position to improve the average entry price, (% MINIMUM BETTER PRICE ': Minimum price for the re-entry to be executed and that is better than the price of the previous position in a given %) in this way we give the trade a chance that the Take Profit is executed before. The downside is that the position is doubled in size. 'ACTIVATE DIVIDE TP': Divide the size of the TP in half. More probability of the trade closing but less profit.
█ STOP LOSS and RISK MANAGEMENT.
A good risk management is what can make your equity go up or be liquidated.
The % risk is the percentage of our capital that we are willing to lose by operation. This is recommended to be between 1-5%.
% Risk: (% Stop Loss x % Equity per trade x Leverage) / 100
First the strategy is calculated with Stop Loss, then the risk per operation is determined and from there, the amount per operation is calculated and not vice versa.
In this script you can use a normal Stop Loss or one according to the ATR. Also activate the option to trigger it earlier if the risk percentage is reached. '% RISK ALLOWED'
'STOP LOSS CONFIRMED': The Stop Loss is only activated if the closing of the previous bar is in the loss limit condition. It's useful to prevent the SL from triggering when they do a ‘pump’ to sweep Stops and then return the price to the previous state.
█ BACKTEST
The objective of the Backtest is to evaluate the effectiveness of our strategy. A good Backtest is determined by some parameters such as:
- RECOVERY FACTOR: It consists of dividing the 'net profit' by the 'drawdown’. An excellent trading system has a recovery factor of 10 or more; that is, it generates 10 times more net profit than drawdown.
- PROFIT FACTOR: The ‘Profit Factor’ is another popular measure of system performance. It's as simple as dividing what win trades earn by what loser trades lose. If the strategy is profitable then by definition the 'Profit Factor' is going to be greater than 1. Strategies that are not profitable produce profit factors less than one. A good system has a profit factor of 2 or more. The good thing about the ‘Profit Factor’ is that it tells us what we are going to earn for each dollar we lose. A profit factor of 2.5 tells us that for every dollar we lose operating we will earn 2.5.
- SHARPE: (Return system - Return without risk) / Deviation of returns.
When the variations of gains and losses are very high, the deviation is very high and that leads to a very poor ‘Sharpe’ ratio. If the operations are very close to the average (little deviation) the result is a fairly high 'Sharpe' ratio. If a strategy has a 'Sharpe' ratio greater than 1 it is a good strategy. If it has a 'Sharpe' ratio greater than 2, it is excellent. If it has a ‘Sharpe’ ratio less than 1 then we don't know if it is good or bad, we have to look at other parameters.
- MATHEMATICAL EXPECTATION: (% winning trades X average profit) + (% losing trades X average loss).
To earn money with a Trading system, it is not necessary to win all the operations, what is really important is the final result of the operation. A Trading system has to have positive mathematical expectation as is the case with this script: ME = (0.87 x 30.74$) - (0.13 x 56.16$) = (26.74 - 7.30) = 19.44$ > 0
The game of roulette, for example, has negative mathematical expectation for the player, it can have positive winning streaks, but in the long term, if you continue playing you will end up losing, and casinos know this very well.
PARAMETERS
'BACKTEST DAYS': Number of days back of historical data for the calculation of the Backtest.
'ENTRY TYPE': For '% EQUITY' if you have $ 10,000 of capital and select 7.5%, for example, your entry would be $ 750 without leverage. If you select CONTRACTS for the 'BTCUSDT' pair, for example, it would be the amount in 'Bitcoins' and if you select 'CASH' it would be the amount in $ dollars.
'QUANTITY (LEVERAGE 1X)': The amount for an entry with X1 leverage according to the previous section.
'MAXIMUM LEVERAGE': It's the maximum allowed multiplier of the quantity entered in the previous section according to the volume condition.
The settings are for Bitcoin at Binance Futures (BTC: USDTPERP) in 15 minutes.
For other pairs and other timeframes, the settings have to be adjusted again. And within a month, the settings will be different because we all know the market and the trend are changing.
ابحث في النصوص البرمجية عن "tp"

Money maker EURUSD 15min daytraderVERY IMPORTANT : THIS STRATEGY WAS MADE WITH LEVERAGE IN MIND
You need atleast 20X LEVERAGE ACCOUNT IN ORDER TO WORK PROPERLY.
With high rewards come high risk .
If you dont want to use leverage, use a risk % of less than 0.25 %.
The below example is without use of leverage on a capital 100.000 risking only 0.25% on each trade
This is a breakout strategy, initially made for EURUSD 15 min for London session.
Its made of 4 SMMA and 1 EMA
Rules for entry are simple :
For buy if our current closed candle is above all moving averages, and they are in ascending order ( 3 > 6 > 9 .... ) and we are in the London session we enter.
For sell the same, but in reverse. If closed candle is below all moving averages and they are in descending order ( 3< 6 < 9 .....) and we are in the London session.
We have a risk manangement with TP/SL.
For exit its either if we reach a tp/sl level, or we reach London finish time.
It also has a risk management, calculating the size based on the pips for SL and our current balance.
For any questions , let me know.

VWAP + Fibo Dev Extensions StrategyBased on my VWAP + Fibo deviations indicator, I tested some strategies to see if the indicator can be profitable; and I got it !
This strategy uses:
H1 timeframe
Weekly VWAP
+1.618 / +2.618 / -1.618 / -2.618 Deviations Extensions to create 2 bands
The value of the deviation
First, the 2 bands are plotted : +1.618/+2.618 painted in red and -1.618/-2.618 painted in lime.
Then, we wait for the deviation value to reach at least 150 (see thumbnail) to avoid littles moves when the gaps between bands are too short.
Entry long position :
first candle must crossunder the -1.618 level and low have to stay over the -2.618
low of the second one must stay in the lime band
enter the third one if the deviation value is over limit (150)
Exit long position :
TP : when a high crossover VWAP
SL : when a low crossunder -2.618
Entry short position :
first candle must crossover the +1.618 level and high have to stay under the +2.618
high of the second one must stay in the red band
enter the third one if the deviation value is over limit (150)
Exit short position :
TP : when a low crossunder VWAP
SL : when a high crossover +2.618
Notes :
this strategy uses pyramiding (5), be careful and calculate your risk management
the comission value is set to 0.08% to include slippages when entering a trade because of market orders
This strategy is not an advice to invest, make your own decisions.

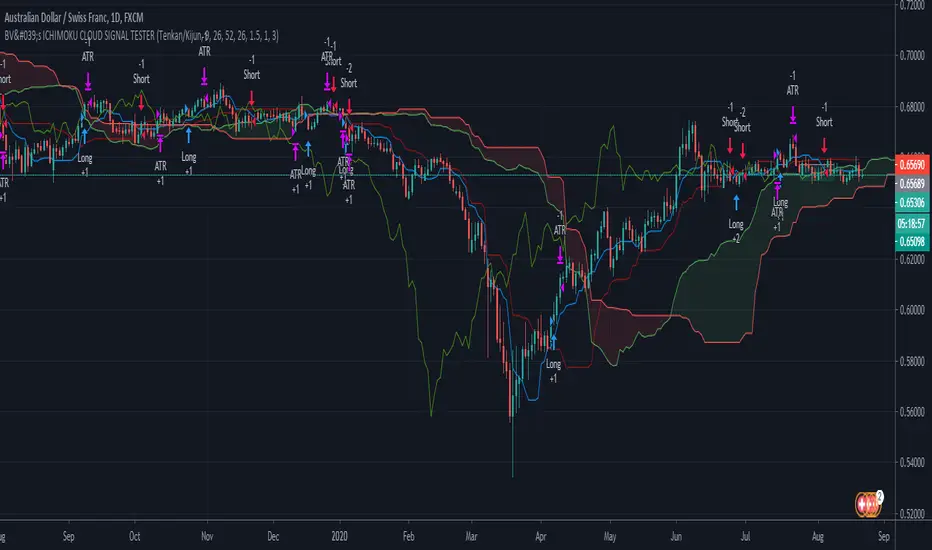
BV's ICHIMOKU CLOUD - All Signalshello traders,
With this script you will be able to test the different signals offered by the ichimoku cloud system.
Crossover Tenkan Kijun
Crossover Tenkan Kijun above Kumo
Crossover Price Kijun
Crossover Price Kijun above Kumo
Crossover Price Tenkan
Crossover Prince Tenkan aboce Kumo
Crossover price Kumo
Kumo Color Change
Remember to check the JPYPAIR checkbox if you test a JPY/xxx pair, this will adjust the stop loss and take profit calculation.
You can also adjust the TP and SL values in the parameters to change their ratio. I had good results in 1.5:1 with the :
SL = 2.25 x ATR(14)
TP = 1.5 x ATR(14)
At your tests, don't hesitate to share your results.
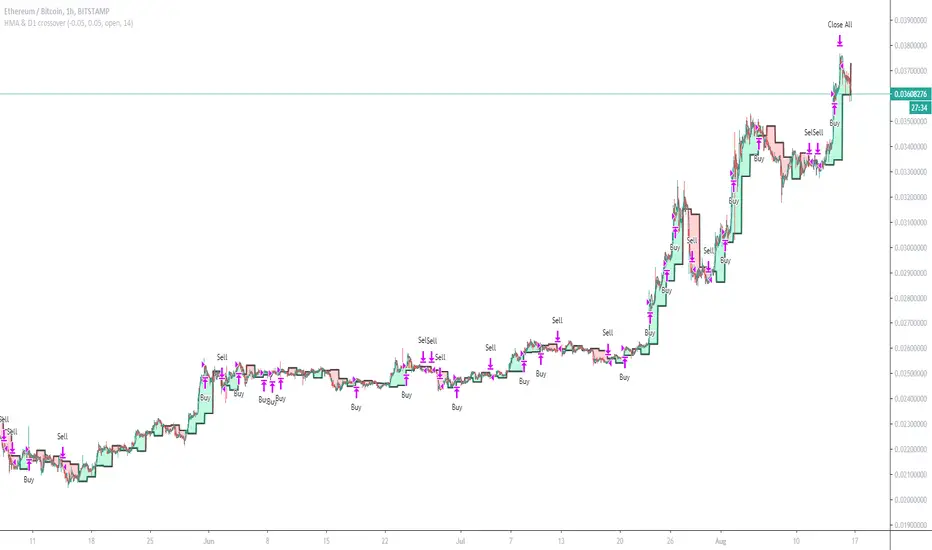
HMA & D1 crossoverCan work on Forex if change equity currency and SL and TP etc
This example tuned for ETH/BTC
Enters on HMA (Hull Moving Average) and D1 (Daily Candle) crossovers, Exits basket when profit = TP (Target Profit)
Has Commission and slippage added, test equity at 1 BTC lotsize set too 1% of equity for each order
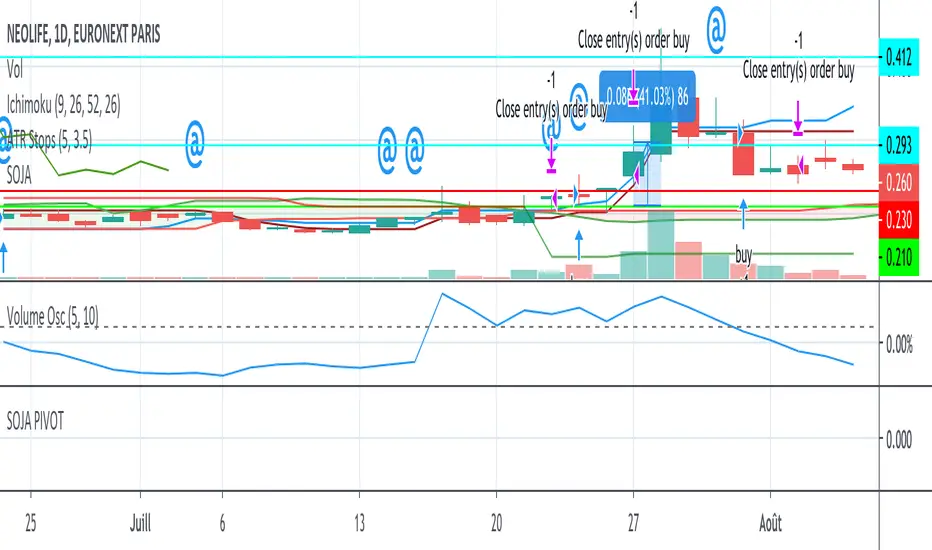
SOJA PIVOTStrategy using SOJA HUNTER indicator for buy and Pivot points for sell :
-1st TP at R1 with 25% shares
-2nd TP at R2 with 25% shares
SL using trailing stop.
MACD VWAP IndicatorThis indicator uses a combination of the VWAP, EMA 9 and parts of the MACD in order to detect a bullish or bearish trend.
How to trade it:
Set SL either below or above the VWAP line (orange) and TP to 1:1.5 ratio (depending on last few candles, of course).
If EMA200 is close by then place SL either below or above EMA200 (blue) and TP to 1:1.5 ratio
Important:
Best traded in 15M, 30M => Intraday.
Have fun! :)

Strategy Tester EMA-SMA-RSI-MACDOn Tradingview I never saw a custom adjustable strategy script yet, so this is it,
you can change different things and see if you'll get a good strategy or not
Settings:
First choose the source, you can choose out of:
close, open, high, low, ohlc4, hlc3, hl2
Then choose you strategy: Long & Short, Long only or Short only
Next, choose your entry "Buy/Long" (which is the "close Short position" when "Short"):
- (E)MA 1 > (E)MA 2 (Each can be made ema or sma)
- close above (E)MA 1
- RSI strategy
- macd > signal
- macd > 0
- signal > 0
Then choose your RSI values if needed (for example you want a trigger when EMA 1 > SMA 2
but only if RSI > 60, then change "IF RSI >" from 0 to 60
Next you can choose an extra argument
and even a second argument with Higher Time Frame settings
Under this you can change your (E)MA values as desired (HTF values, MACD and RSI length can be found lower)
All the same with the exit/close (or if "Short", this is your entry)
Again, change everything as you wish
Then comes the RSI length setting, MACD settings and HTF settings, followed by SL/TP settings
(you also can enable/disable SL/TP), and TIME settings (for example you want to know the profit only from this year)
Alerts are provided in next script
Have fun!
Fixed Percent Stop Loss & Take Profit % - For Study Scripts===========
Fixed Percent Stop Loss & Take Profit % - { FOR STUDY SCRIPTS! }
===========
A neat example of how to set up Fixed Stops and Take Profit as a percent of the entry price - This is for setting Alerts within your own Study Script for when either your SL or TP get hit.
Yup, that's about it!
You can ignore the actual entry/exit orders - they're based on a simple MA cross and are therefore NOT relevant, NOT profitable and NOT recommended!
You should be using this code as a way of adding Stops and Takes to your own scripts - hope it helps!
Set your "Open Long/Short" Alerts to be triggered "Once per Bar Close" - Set your "SL/TP" Alerts to trigger "Once per Bar".
--
We wrote this with a bit of a rush on! ~ If you spot any mistakes/bugs just let us know and we'll get round to them asap!
-----------
Good Luck and Happy Trading!

[mya] ATR FilteredATR Filtered for NNFX trading.
A classic Average True Range (ATR) indicator with a simple feature to filter out the spikes.
The ATR value is the tool to determine your TP and SL on daily time-frame, specifically in the NNFX way of trading.
VP mentions in his podcast that when the ATR spikes up you have 2 options: 1. wait 14 candles for the ATR to normalize, 2. use the ATR value prior to the spike.
ATR spikes are easy to spot (thus easy to exclude) for an itraday flash crash.
On the other hand when volatility increases over several candles (as in the Covid-19 shock) it can be difficult to determine which ATR value to base your TP/SL on.
In definition of standard deviation, 95.4% of the value will fall within the 2 sigma bands. Therefore the rest 4.6% can be filtered out as an extreme value (a spike).
The ATR in this indicator will plot the standard ATR value in normal condition, then when the ATR spike happens it will stay at the highest value at the point, when the ATR exceeded its 2 sigma band.
The filtering will reset when the ATR comes back down below the extended highest value.
*Disclaimer: Use at your own risk. I am not a programmer, just another guy trying to beat this game. Let's go get it.

SimplicityA simple all in one indicator. Combines a simple moving average with an ATR-based money management system. Simply buy when a candle closes above the MA, and sell when it closes below. Set first TP at 1ATR and initial SL at 1.5-1ATR. When price hits 1st TP, exit half of your position. Use the MA to trail your stop on the other half of the position.

inwCoin Specific Buy/Sell Price Alert for AutoviewJust simple script to act as conditional stop loss
Problem : Traditional Market Stop or Limit Stop, you have to set it with specific price and wait for the price to drop/pump to your stop then it will trigger. But sometime ( so many times ) the price will leave a very long wick up or down to hunt the stoploss that already set in the exchanges.. then it turn back to the opposite side after stop our position from existent!!
Thank to Autoview, with this simple script, you can setup your "stop level" without put "stop market" in the order.
Just stop when price close below or above specific level in the script, then you can just setup alert to fire the TP/Stop order to exchange via autoview after alert fire.
Example;
You need to stop loss / TP your position when price "close below 9500" in daily BTC chart
- Just set "sell price" to 9500
- and set "Cross down" option
When daily chart close below 9500, the script will trigger alert for you to catch and send to any exchange via Autoview.
Note;
1) When setting alert in tradingview, make sure to use..
- Crossing Down + 0.8 in alert trigger condition
- Set to "Once per bar" ( If you set "once per bar close", it will fire alert in next 2nd candle! )
2) You need to subscribe to autoview to use the bot. And it's not for everyone. Just do your own research before using! ( try to test with small amount of money first! )
Cheers!

Trade Manager (Open Source Version)Hello my young padawans looking for the FORCE to get richer on your next trade
I got pinged at least three times today asking where the hell is the indicator of the day. You asked, I delivered :)
Here's your free open-source Trade Manager Version. My associates might kill me for sharing that one... anyway this is a real GIFT.
I won't share such quality indicators too often for FREE so hope you'll appreciate its value. It can really help with your day to day trading (on top of making your charts looking more awesome)
This is an even better version compared to my previous Trade Manager Trade-Manager . It's basically a standalone version, meaning you'll have to update with 2 lines your own indicator and follow my educational post from yesterday (pasted it below also) to learn how to do it
Please read this educational post I published for you before proceeding further : How-to-connect-your-indicator-with-the-Trade-Manager
From here you normally connected the data source of your own indicator to the Trade Manager. If not, here's a reminder of the article mentionned above
Step 1 - Update your indicator
For the screenshot you see above, I used this indicator : Two-MM-Cross-MACD/ . "But sir are you really advertising your other indicators here ??" ... hmmm.... YES but I gave them for free so ... stop complaining my friend :)
Somewhere in the code you'll have a LONG and a SHORT condition. If not, please go back to study trading for noobs (I'm kidding !!!)
So it should look to something similar
nUP = ma_crossover and macd_crossover
nDN = ma_crossunder and macd_crossunder
What you will need to add at the very end of your script is a Signal plot that will be captured by the Trade Manager. This will give us :
// Signal plot to be used as external
// if crossover, sends 1, otherwise sends -1
Signal = (nUP) ? 1 : (nDN) ? -1 : na
plot(Signal, title="Signal")
The Trade Manager engines expects to receive 1 for a bullishg signal and -1 for bearish .
Step 2 - Add the Trade Manager to your chart and select the right Data Source
I feel the questions coming so I prefer to anticipate :) When you add the Trade Manager to your chart, nothing will be displayed. THIS IS NORMAL because you'll have to select the Data Source to be "Signal"
Remember our Signal variable from the Two MM Cross from before, now we'll capture it and.....drumb rolll...... that's from that moment that your life became even more AWESOME
The Engine will capture the last signal from the MM cross or any indicator actually and will update the Stop Loss, Take Profit levels based on the parameters you set on the Trade Manager
It should work with any indicator as long as you're providing a plot Signal with values 1 and -1 . In any case, you can change the Trade Manager you'll find a better logic for your trading
Now let's cover the different parameters of the tool
It should be straightforward but better to explain everything here
+Label lines : if unchecked, no SL/TPs/... will be displayed
+Show Stop Loss Signal : Will display the stop loss label. You have the choice between three options :
By default, the Stop Loss is set to NONE. You'll have to select a different option to enable the Stop Loss for real
++Percentage : Will set the SL at a percent distance from the price
++Fixed : SL fixed at a static price
++Trailing % : Trailing stop loss based on percentage level
The following is a KEY feature and I got asked for it many times those past two days. I got annoyed of getting the same request so I just did it
++Trailing TP: Will move the Stop Loss if the take profit levels are hit
Example: if TP1 is hit, SL will be moved to breakeven. If TP2 is hit, SL will be moved from TP1 to TP2
+Take Profit 1,2,3 : Visually define the three Take Profit levels. Those are percentage levels .
Meaning if you set TP1 = 2, it will set the TP1 level 2% away from the entry signal
Please note that once a Take profit level is reached, it will magically disappear. This is to be expected
I'll share in the future a way more complete version with invalidation, stop loss/take profits based on indicator, take profit based on supports/resistances, ...
I believe is such a great tool because can be connected to any indicator. I confess that I tried it only with a few... if you find any that's not working with the Trade manager, please let me know and I'll have a look
PS
I want to give a HUUUUUUUGE shoutout to the PineCoders community who helped me finishing it
Wishing you all the best and a pleasant experience with my work
David

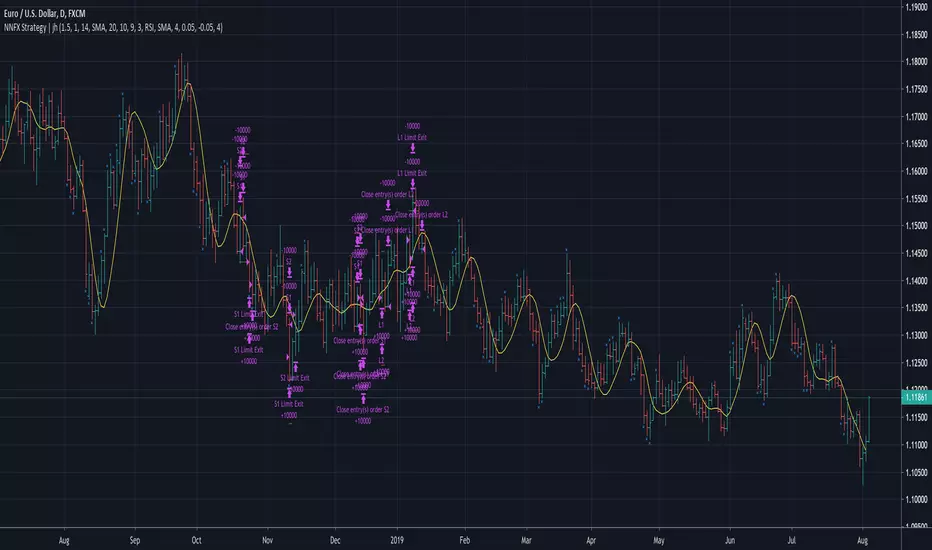
No Nonsense NNFX VP Strategy for Back Testing Indicators| jhAfter putting the whole system together, sat down to benchmark the various confirmation indicators, shrink it down to backtest individual confirmation indicators.
Results for 24 periods way better than 10, then again it's only one pair. :)
More details below.
//////////////////////////////////////////////////////////////////////////////////////////////////////////////////////////////////
//Designed per No Nonsense Forex VP rules
//For testing your individual indicators before the full system
//Originated from causecelebre
//Tried to put in as much VP rules as possible
///////////////////////////////////////////////////
//Rules Implemented:
///////////////////////////////////////////////////
// - SL 1.5 x ATR
// - TP 1 x ATR
//
// - Entry conditions
//// - Entry from 1 x confirmation
// - Exit conditions
//// - Exit on confirmation flip
///////////////////////////////////////////////////
//Trades entries
///////////////////////////////////////////////////
// - First entry L1 or S1 with standard SL and TP
///////////////////////////////////////////////////
//Included Indicators and settings
///////////////////////////////////////////////////
// - Confirmtion = SSL 10
///////////////////////////////////////////////////
//Credits
// Strategy causecelebre www.tradingview.com
// SSL Channel ErwinBeckers www.tradingview.com
//////////////////////////////////////////////////////////////////////////////////////////////////////////////////////////////////
//Change log
//First release. Testing of indicators
//////////////////////////////////////////////////////////////////////////////////////////////////////////////////////////////////

No Nonsense NNFX VP Strategy for Back Testing | jhMy first script, be kind :)
Most of the rules are implemented:
- Money management
- ATR, Baseline, Confirmation, Volume, Exit
More details below.
//////////////////////////////////////////////////////////////////////////////////////////////////////////////////////////////////
//////////////////////////////////////////////////////////////////////////////////////////////////////////////////////////////////
//Designed per No Nonsense Forex VP rules
//Made to be as modular as possible, so we can swap the indicators in and out.
//Originated from causecelebre
//Tried to put in as much VP rules as possible
///////////////////////////////////////////////////
//Rules Implemented:
///////////////////////////////////////////////////
// - SL 1.5 x ATR
// - TP 1 x ATR
//
// - Entry conditions
//// - Entry within 1 candles of baseline + 1 x confirmation + volume
//// - Entry only if baseline is < 1 x ATR
// - Exit conditions
//// - Exit on exit indicator or when baseline or confirmation flip
///////////////////////////////////////////////////
//Trades entries
///////////////////////////////////////////////////
// - First entry L1 or S1 with standard SL and TP
// - Second entry L2 or S2 with standard SL and exit upon the exit conditions
///////////////////////////////////////////////////
//Included Indicators and settings
///////////////////////////////////////////////////
// - Baseline = HMA 20
// - Confirmtion = SSL 10
// - Volume = TDFI 4
// - Exit = RVI 4
///////////////////////////////////////////////////
//Credits
// Strategy causecelebre
// TDFI causecelebre
// SSL Channel ErwinBeckers
//////////////////////////////////////////////////////////////////////////////////////////////////////////////////////////////////
//////////////////////////////////////////////////////////////////////////////////////////////////////////////////////////////////
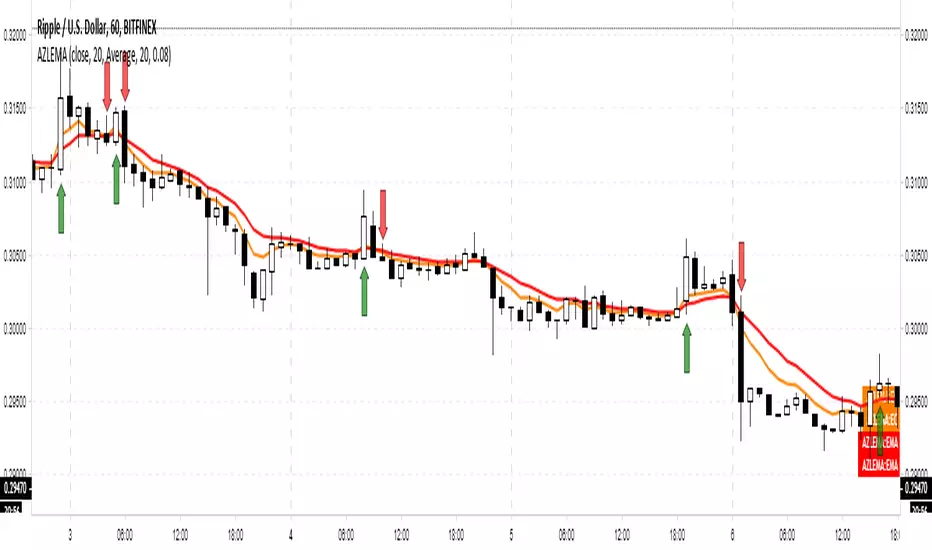
Adaptive Zero Lag EMA [STUDY]A user has asked for the Study/Indicator version of this Strategy .
If you encounter the error "loop....>100ms" simply toggle the eye icon to hide and unhide the indicator
The following is simply quoted from my previous post for your convenience: (obviously there won't be risk, Stop Loss, or Take profit parameters!)
OPERATING PRINCIPLE
The strategy is based on Ehlers idea that any indicator can be turned into a signal-producing trade system through smoothing and other filtering processes.
In fact, I'm using his Zero Lag EMA ( ZLEMA ) as a baseline indicator as well as some code snippets he has made public (1). God bless open source!
Next, I've provided the option to use an Instantaneous Frequency Measurement (IFM) method, which will adaptively choose the best period for the ZLEMA (2)
I've written other studies that use the differential calculus approximations for IFM, so it was only natural to include them in this strategy.
The primary two are Cosine IFM (3) and In-phase Quadrature IFM (4). You can also find an indicator with both plotted and the ability to average them together, as one IFM prefers long periods and the other short. (5)
BEFORE WE BEGIN
1. This strategy only runs on "normal" FX pairs ( EURUSD , GBPJPY , AUDUSD ...) and will fail on Metals or Commodities.
Cryptos are largely untested.
2. Please run it on these time frames: M15 to D.
Anything outside this range will likely fail.
HOW TO USE AND SUCCEED
1. If the Default settings don't produce good results right off the bat, then lower gain limit to 1 or 2 and threshold to 0.01.
2. Test each setting under adaptive method. If you want to leave it Off, then I'd recommend using some kind of IFM (see my links below) to
discover the most efficient period to use.
3. Once you have the best adaptive method chosen, begin incrementing gain limit until you find a nice balance between profit factor ( PF ) and drawdown.
4. Now, begin incrementing threshold. The goal is to have PF above 2 and a drawdown as low as possible.
5. Finally, change the source! Typically, close is the best option, but I have run into cases where high
yielded the highest returns and win rate.
6. Sit back, relax, and tweak the risk until you're happy with the return and drawdown amounts.
ADVANCED
You may need to adjust take profit (TP) points and stop loss (SL) points to create the best entry possible. Don't be greedy! You'll likely have poor
results if the TP is set to 300 and SL is 50.
If you are trading a pair that has a long Dominant Cycle Period, then you may increase Max Period to allow the IFM
to accept longer periods. Any period above the Max Period will be rejected. This may increase lag time!
Cheers and good luck trading!
-DasanC
(1)www.mesasoftware.com
(2)www.jamesgoulding.com
(3) Cosine IFM
(4) I-Q IFM
(5) Averaging IFM
IFM stands for Instantaneous frequency measurement
Adaptive Zero Lag EMA v2This is my most successful strategy to date! Please enjoy and join the Open Source movement by sharing your code and ideas online!
OPERATING PRINCIPLE
The strategy is based on Ehlers idea that any indicator can be turned into a signal-producing trade system through smoothing and other filtering processes.
In fact, I'm using his Zero Lag EMA (ZLEMA) as a baseline indicator as well as some code snippets he has made public (1). God bless open source!
Next, I've provided the option to use an Instantaneous Frequency Measurement (IFM) method, which will adaptively choose the best period for the ZLEMA (2)
I've written other studies that use the differential calculus approximations for IFM, so it was only natural to include them in this strategy.
The primary two are Cosine IFM (3) and In-phase Quadrature IFM (4). You can also find an indicator with both plotted and the ability to average them together, as one IFM prefers long periods and the other short. (5)
BEFORE WE BEGIN
1. This strategy only runs on "normal" FX pairs (EURUSD, GBPJPY, AUDUSD ...) and will fail on Metals or Commodities.
Cryptos are largely untested.
2. Please run it on these time frames: M15 to D.
Anything outside this range will likely fail.
HOW TO USE AND SUCCEED
1. If the Default settings don't produce good results right off the bat, then lower gain limit to 1 or 2 and threshold to 0.01.
2. Test each setting under adaptive method . If you want to leave it Off , then I'd recommend using some kind of IFM (see my links below) to
discover the most efficient period to use.
3. Once you have the best adaptive method chosen, begin incrementing gain limit until you find a nice balance between profit factor (PF) and drawdown.
4. Now, begin incrementing threshold . The goal is to have PF above 2 and a drawdown as low as possible.
5. Finally, change the source ! Typically, close is the best option, but I have run into cases where high
yielded the highest returns and win rate.
6. Sit back, relax, and tweak the risk until you're happy with the return and drawdown amounts.
ADVANCED
You may need to adjust take profit (TP) points and stop loss (SL) points to create the best entry possible. Don't be greedy! You'll likely have poor
results if the TP is set to 300 and SL is 50.
If you are trading a pair that has a long Dominant Cycle Period , then you may increase Max Period to allow the IFM
to accept longer periods. Any period above the Max Period will be rejected. This may increase lag time!
Cheers and good luck trading!
-DasanC
PS - This code doesn't repaint or have future-leak, which was present in Pinescript v2.
PPS - Believe me! These returns are typical! Sometimes you must push aside the "if it's too good to be true..." mindset that society has ingrained in you.
Do you really believe the most successful pass up opportunities before investigating them? ;)
(1) Ehlers & Ric Zero Lag EMA
(2) Measuring Cycles by Ehlers
(3) Cosine IFM
(4) Inphase Quadrature IFM
(5) Averaging IFM

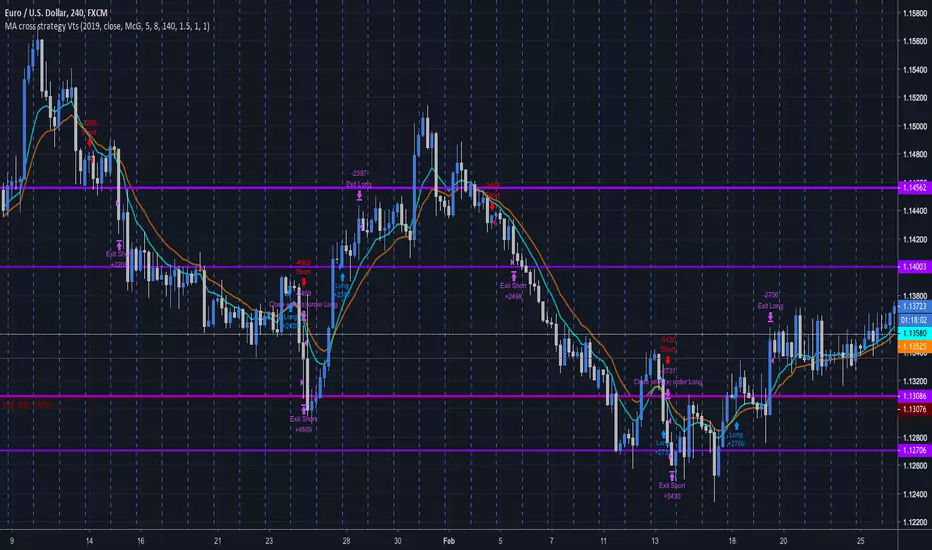
MA cross strategy VtsThe simple Moving average cross strategy is here implemented.
I guess there are multitudes of similar scripts around.
I post this one since I was asked by some friends, and I'll let it free to use for anybody.
Here you can choose the year where to start backtesting, the source, the type of MA, the SL and TP multiplicators of ATR, for which you can also choose the averaging period.
Feel free to modify this script. I would be grateful if you could preserve the first lines of comments including my user names.
The MA cross strategies can be very effective, especially when used on the daily TF.
Try for example the combo EMA15-EMA30 SL=1.5ATR TP=1ATR on EURCHF daily to get an impressive 83% win ratio.
Or EMA20-EMA81 on the GBPCHF to get an 87%.
In those cases where EMA does not perform well, try to set a less lagging MA, like the Hull MA.
I hope you like this script so that you could push the like button multiple (odd) times and you start following me.
I've got a bunch of other interesting scripts to share.
Comments and suggestions are welcome.
Forex Master v4.0 (EUR/USD Mean-Reversion Algorithm)DESCRIPTION
Forex Master v4.0 is a mean-reversion algorithm currently optimized for trading the EUR/USD pair on the 5M chart interval. All indicator inputs use the period's closing price and all trades are executed at the open of the period following the period where the trade signal was generated.
There are 3 main components that make up Forex Master v4.0:
I. Trend Filter
The algorithm uses a version of the ADX indicator as a trend filter to trade only in certain time periods where price is more likely to be range-bound (i.e., mean-reverting). This indicator is composed of a Fast ADX and a Slow ADX, both using the same look-back period of 50. However, the Fast ADX is smoothed with a 6-period EMA and the Slow ADX is smoothed with a 12-period EMA. When the Fast ADX is above the Slow ADX, the algorithm does not trade because this indicates that price is likelier to trend, which is bad for a mean-reversion system. Conversely, when the Fast ADX is below the Slow ADX, price is likelier to be ranging so this is the only time when the algorithm is allowed to trade.
II. Bollinger Bands
When allowed to trade by the Trend Filter, the algorithm uses the Bollinger Bands indicator to enter long and short positions. The Bolliger Bands indicator has a look-back period of 20 and a standard deviation of 1.5 for both upper and lower bands. When price crosses over the lower band, a Long Signal is generated and a long position is entered. When price crosses under the upper band, a Short Signal is generated and a short position is entered.
III. Money Management
Rule 1 - Each trade will use a limit order for a fixed quantity of 50,000 contracts (0.50 lot). The only exception is Rule
Rule 2 - Order pyramiding is enabled and up to 10 consecutive orders of the same signal can be executed (for example: 14 consecutive Long Signals are generated over 8 hours and the algorithm sends in 10 different buy orders at various prices for a total of 350,000 contracts).
Rule 3 - Every order will include a bracket with both TP and SL set at 50 pips (note: the algorithm only closes the current open position and does not enter the opposite trade once a TP or SL has been hit).
Rule 4 - When a new opposite trade signal is generated, the algorithm sends in a larger order to close the current open position as well as open a new one (for example: 14 consecutive Long Signals are generated over 8 hours and the algorithm sends in 10 different buy orders at various prices for a total of 350,000 contracts. A Short Signal is generated shortly after the 14th Long Signal. The algorithm then sends in a sell order for 400,000 contracts to close the 350,000 contracts long position and open a new short position of 50,000 contracts).

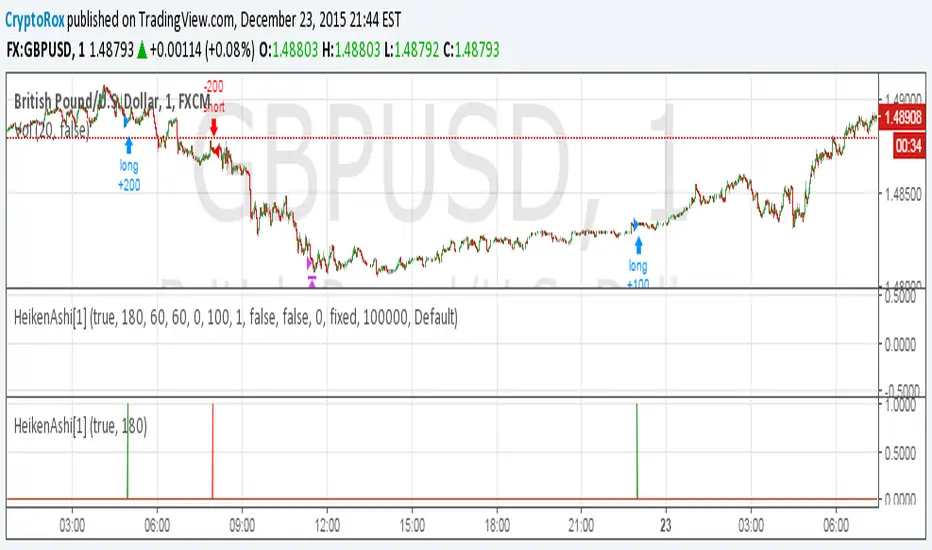
HeikenAshi[1]This is the alert script so you can automate this strategy using AutoView:
Make sure to use
crossing down value 0.9 once per bar (on condition) for this.
For the alert Message if you're using AutoView:
Long GBPUSD
c=order b=short
c=position b=short l=200 t=market
b=long q=0.01 l=200 t=market tp=60 sl=60
Short GBPUSD
c=order b=long
c=position b=long l=200 t=market
b=short q=0.01 l=200 t=market tp=60 sl=60
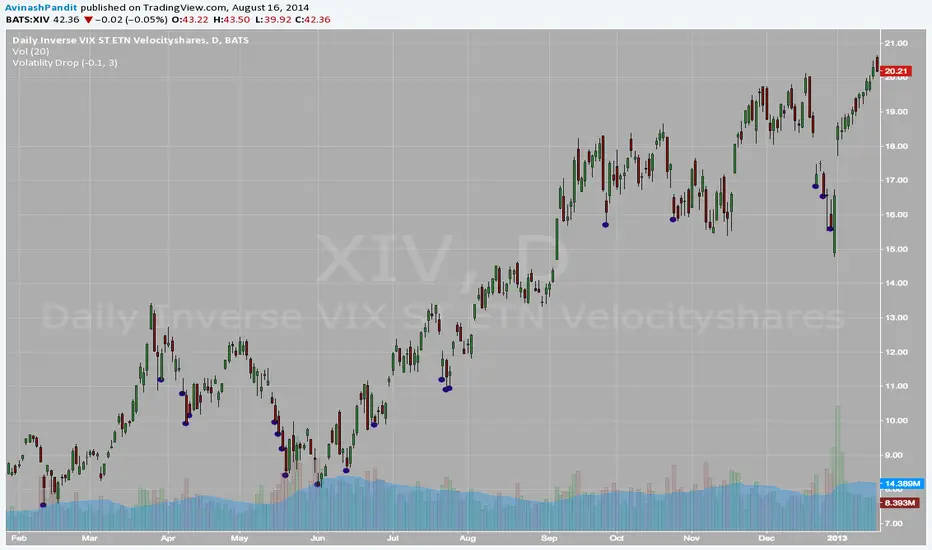
Percent Drop - For XIVUseful for Rangebound stocks.
I am using it with XIV , start accumulating day after circle appears.
Have TP of 20% upside
Average it if TP not hit on next flash
Profitable Pair Correlation Divergence Scanner v6This strategy identifies divergence opportunities between two correlated assets using a combination of Z-Score spread analysis, trend confirmation, RSI & MACD momentum checks, correlation filters, and ATR-based stop-loss/take-profit management. It’s optimized for positive P&L and realistic trade execution.
Key Features:
Pair Divergence Detection:
Measures deviation between returns of two assets and identifies overbought/oversold spread conditions using Z-Score.
Trend Alignment:
Trades only in the direction of the primary asset’s trend using a fast EMA vs slow EMA filter.
Momentum Confirmation:
Confirms trades with RSI and MACD to reduce false signals.
Correlation Filter:
Ensures the pair is strongly correlated before taking trades, avoiding noisy signals.
Risk Management:
Dynamic ATR-based stop-loss and take-profit ensures proper reward-to-risk ratio.
Exit Conditions:
Automatically closes positions when Z-Score normalizes, or ATR-based exits are hit.
How It Works:
Calculate Returns:
Computes returns for both assets over the selected timeframe.
Z-Score Spread:
Calculates the spread between returns and normalizes it using moving average and standard deviation.
Trend Filter:
Only takes long trades if the fast EMA is above the slow EMA, and short trades if the fast EMA is below the slow EMA.
Momentum Confirmation:
Confirms trade direction with RSI (>50 for longs, <50 for shorts) and MACD alignment.
Correlation Check:
Ensures the pair’s recent correlation is strong enough to validate divergence signals.
Trade Execution:
Opens positions when Z-Score crosses thresholds and all conditions align. Positions close when Z-Score normalizes or ATR-based SL/TP is hit.
Plot Explanation:
Z-Score: Blue line shows divergence magnitude.
Entry Levels: Red/Green lines mark long/short thresholds.
Exit Zone: Gray lines show normalization zone.
EMA Trend Lines: Purple (fast), Orange (slow) for trend alignment.
Correlation: Teal overlay shows current correlation strength.
Usage Tips:
Use highly correlated pairs for best results (e.g., EURUSD/GBPUSD).
Run on higher timeframe charts (1h or 4h) to reduce noise.
Adjust ATR multiplier based on volatility to avoid premature stops.
Combine with alerts for automated notifications or webhook execution.
Conclusion:
The Profitable Pair Correlation Divergence Scanner v6 is designed for traders who want systematic, low-risk, positive P&L trading opportunities with minimal manual monitoring. By combining trend alignment, momentum confirmation, correlation filters, and dynamic exits, it reduces false signals and improves execution reliability.
Run it on TradingView and watch how it captures divergence opportunities while maintaining positive P&L across trades.

TomTrades Candle Behavior & Timing + TP + Alertsgreen mean sell red mean buy if prices breaks above green its a buy same for red if price stay below red its a sell white line is hourly trend line
