Tchwella Stocks Custom WatermarkThis Pine Script v5 indicator adds a customizable watermark to TradingView charts, displaying key stock information while allowing for flexible positioning and formatting.
📌 Features & Functionality:
✅ Custom Positioning:
• Fixed to the top-left corner.
• Adjustable spacing ensures the text is properly aligned.
✅ Displayed Information (Configurable):
• Company Name & Market Cap (Optional: Shows dynamically calculated market cap)
• Stock Ticker & Timeframe
• Industry & Sector
✅ Customization Options:
• Font Size: Huge, Large, Normal, Small
• Text Color & Transparency: Adjustable
• Proper Left Alignment for a clean, structured display
• Vertical Offset Tweaks to move text down for better visibility
✅ Optimized Table Layout:
• Uses table.new() for persistent placement.
• Added an empty row to fine-tune positioning, ensuring the watermark doesn’t overlap key chart areas.
🔧 Use Case:
Designed for traders who want a clear, customizable stock watermark to enhance their charting experience without obstructing price action.
Feb 1
Release Notes
Updated version: now you can decide your location for the watermark
Micha Stocks Custom Watermark (MSWM) – TradingView Script
This Pine Script v5 indicator adds a customizable watermark to TradingView charts, displaying key stock information while allowing for flexible positioning and formatting.
📌 Features & Functionality:
✅ Custom Positioning:
• Fixed to the top-left corner.
• Adjustable spacing ensures the text is properly aligned.
✅ Displayed Information (Configurable):
• Company Name & Market Cap (Optional: Shows dynamically calculated market cap)
• Stock Ticker & Timeframe
• Industry & Sector
✅ Customization Options:
• Font Size: Huge, Large, Normal, Small
• Text Color & Transparency: Adjustable
• Proper Left Alignment for a clean, structured display
• Vertical Offset Tweaks to move text down for better visibility
✅ Optimized Table Layout:
• Uses table.new() for persistent placement.
• Added an empty row to fine-tune positioning, ensuring the watermark doesn’t overlap key chart areas.
🔧 Use Case:
Designed for traders who want a clear, customizable stock watermark to enhance their charting experience without obstructing price action.
Feb 7
Release Notes
Micha Stocks Custom Watermark – Updated Version 🚀
This updated Micha Stocks Custom Watermark script enhances your TradingView experience by adding an ATR-based volatility signal alongside the existing customizable stock watermark.
🆕 New Features & Improvements:
✅ ATR (14-Day) with Dynamic Volatility Indicator
• Displays the ATR value and its percentage relative to price.
• Includes a color-coded volatility signal:
• 🔴 High Volatility (Above user-defined Red Threshold)
• 🟡 Moderate Volatility (Between Red & Yellow Thresholds)
• 🟢 Low Volatility (Below user-defined Yellow Threshold)
✅ Fully Customizable ATR Thresholds
• Users can set their own ATR % levels for Red, Yellow, and Green signals.
✅ Improved Watermark Customization
• Users can still adjust the position, size, and color of the watermark.
• Includes Company Name, Ticker, Market Cap, Industry, and Sector.
• ATR can be turned on/off in settings for flexibility.
🔧 How to Use:
1️⃣ Go to Indicator Settings → Enable or Disable ATR Display
2️⃣ Adjust ATR % Thresholds to fit your volatility preference
3️⃣ Customize Text Position, Color, and Size to match your chart setup
This update makes it easier to quickly assess market volatility while keeping a clean and professional chart layout.
💡 Why Use This Indicator?
• Effortlessly track key stock info without cluttering your chart.
• Quickly identify volatile conditions using ATR percentage signals.
• Adjust settings on the fly to match your trading strategy.
📢 Update Now & Enjoy a Smarter Charting Experience!
ابحث في النصوص البرمجية عن "tradingview+筹码结构"

AI Trading Alerts v6 — SL/TP + Confidence + Panel (Fixed)Overview
This Pine Script is designed to identify high-probability trading opportunities in Forex, commodities, and crypto markets. It combines EMA trend filters, RSI, and Stochastic RSI, with automatic stop-loss (SL) & take-profit (TP) suggestions, and provides a confidence panel to quickly assess the trade setup strength.
It also includes TradingView alert conditions so you can set up notifications for Long/Short setups and EMA crosses.
⚙️ Features
EMA Trend Filter
Uses EMA 50, 100, 200 for trend confirmation.
Bull trend = EMA50 > EMA100 > EMA200
Bear trend = EMA50 < EMA100 < EMA200
RSI Filter
Bullish trades require RSI > 50
Bearish trades require RSI < 50
Stochastic RSI Filter
Prevents entries during overbought/oversold extremes.
Bullish entry only if %K and %D < 80
Bearish entry only if %K and %D > 20
EMA Proximity Check
Price must be near EMA50 (within ATR × adjustable multiplier).
Signals
Continuation Signals:
Long if all bullish conditions align.
Short if all bearish conditions align.
Cross Events:
Long Cross when price crosses above EMA50 in bull trend.
Short Cross when price crosses below EMA50 in bear trend.
Automatic SL/TP Suggestions
SL size adjusts depending on asset:
Gold/Silver (XAU/XAG): 5 pts
Bitcoin/Ethereum: 100 pts
FX pairs (default): 20 pts
TP = SL × Risk:Reward ratio (default 1:2).
Confidence Score (0–4)
Based on conditions met (trend, RSI, Stoch, EMA proximity).
Labels:
Strongest (4/4)
Strong (3/4)
Medium (2/4)
Low (1/4)
Visual Panel on Chart
Shows ✅/❌ for each condition (trend, RSI, Stoch, EMA proximity, signal now).
Confidence row with color-coded strength.
Alerts
Long Setup
Short Setup
Long Cross
Short Cross
🖥️ How to Use
1. Add the Script
Open TradingView → Pine Editor.
Paste the full script.
Click Add to chart.
Save as "AI Trading Alerts v6 — SL/TP + Confidence + Panel".
2. Configure Inputs
EMA Lengths: Default 50/100/200 (works well for swing trading).
RSI Length: 14 (standard).
Stochastic Length/K/D: Default 14/3/3.
Risk:Reward Ratio: Default 2.0 (can change to 1.5, 3.0, etc.).
EMA Proximity Threshold: Default 0.20 × ATR (adjust to be stricter/looser).
3. Read the Panel
Top-right of chart, you’ll see ✅ or ❌ for:
Trend → Are EMAs aligned?
RSI → Above 50 (bull) or below 50 (bear)?
Stoch OK → Not extreme?
Near EMA50 → Close enough to EMA50?
Above/Below OK → Price position vs. EMA50 matches trend?
Signal Now → Entry triggered?
Confidence row:
🟢 Green = Strongest
🟩 Light green = Strong
🟧 Orange = Medium
🟨 Yellow = Low
⬜ Gray = None
4. Alerts Setup
Go to TradingView Alerts (⏰ icon).
Choose the script under “Condition”.
Select alert type:
Long Setup
Short Setup
Long Cross
Short Cross
Set notification method (popup, sound, email, mobile).
Click Create.
Now TradingView will notify you automatically when signals appear.
5. Example Workflow
Wait for Confidence = Strong/Strongest.
Check if market session supports volatility (e.g., XAU in London/NY).
Review SL/TP suggestions:
Long → Entry: current price, SL: close - risk_pts, TP: close + risk_pts × RR.
Short → Entry: current price, SL: close + risk_pts, TP: close - risk_pts × RR.
Adjust based on your own price action analysis.
📊 Best Practices
Use on H1 + D1 combo → align higher timeframe bias with intraday entries.
Risk only 1–2% of account per trade (position sizing required).
Filter with market sessions (Asia, Europe, US).
Strongest signals work best with trending pairs (e.g., XAUUSD, USDJPY, BTCUSD).

The Best Strategy Template[LuciTech]Hello Traders,
This is a powerful and flexible strategy template designed to help you create, backtest, and deploy your own custom trading strategies. This template is not a ready-to-use strategy but a framework that simplifies the development process by providing a wide range of pre-built features and functionalities.
What It Does
The LuciTech Strategy Template provides a robust foundation for building your own automated trading strategies. It includes a comprehensive set of features that are essential for any serious trading strategy, allowing you to focus on your unique trading logic without having to code everything from scratch.
Key Features
The LuciTech Strategy Template integrates several powerful features to enhance your strategy development:
•
Advanced Risk Management: This includes robust controls for defining your Risk Percentage per Trade, setting a precise Risk-to-Reward Ratio, and implementing an intelligent Breakeven Stop-Loss mechanism that automatically adjusts your stop to the entry price once a specified profit threshold is reached. These elements are crucial for capital preservation and consistent profitability.
•
Flexible Stop-Loss Options: The template offers adaptable stop-loss calculation methods, allowing you to choose between ATR-Based Stop-Loss, which dynamically adjusts to market volatility, and Candle-Based Stop-Loss, which uses structural price points from previous candles. This flexibility ensures the stop-loss strategy aligns with diverse trading styles.
•
Time-Based Filtering: Optimize your strategy's performance by restricting trading activity to specific hours of the day. This feature allows you to avoid unfavorable market conditions or focus on periods of higher liquidity and volatility relevant to your strategy.
•
Customizable Webhook Alerts: Stay informed with advanced notification capabilities. The template supports sending detailed webhook alerts in various JSON formats (Standard, Telegram, Concise Telegram) to external platforms, facilitating real-time monitoring and potential integration with automated trading systems.
•
Comprehensive Visual Customization: Enhance your analytical clarity with extensive visual options. You can customize the colors of entry, stop-loss, and take-profit lines, and effectively visualize market inefficiencies by displaying and customizing Fair Value Gap (FVG) boxes directly on your chart.
How It Does It
The LuciTech Strategy Template is meticulously crafted using Pine Script, TradingView's powerful and expressive programming language. The underlying architecture is designed for clarity and modularity, allowing for straightforward integration of your unique trading signals. At its core, the template operates by taking user-defined entry and exit conditions and then applying a sophisticated layer of risk management, position sizing, and trade execution logic.
For instance, when a longCondition or shortCondition is met, the template dynamically calculates the appropriate position size. This calculation is based on your specified risk_percent of equity and the stop_distance (the distance between your entry price and the calculated stop-loss level). This ensures that each trade adheres to your predefined risk parameters, a critical component of disciplined trading.
The flexibility in stop-loss calculation is achieved through a switch statement that evaluates the sl_type input. Whether you choose an ATR-based stop, which adapts to market volatility, or a candle-based stop, which uses structural price points, the template seamlessly integrates these methods. The ATR calculation itself is further refined by allowing various smoothing methods (RMA, SMA, EMA, WMA), providing granular control over how volatility is measured.
Time-based filtering is implemented by comparing the current bar's time with user-defined start_hour, start_minute, end_hour, and end_minute inputs. This allows the strategy to activate or deactivate trading during specific market sessions or periods of the day, a valuable tool for optimizing performance and avoiding unfavorable conditions.
Furthermore, the template incorporates advanced webhook alert functionality. When a trade is executed, a customizable JSON message is formatted based on your webhook_format selection (Standard, Telegram, or Concise Telegram) and sent via alert function. This enables seamless integration with external services for real-time notifications or even automated trade execution through third-party platforms.
Visual feedback is paramount for understanding strategy behavior. The template utilizes plot and fill functions to clearly display entry prices, stop-loss levels, and take-profit targets directly on the chart. Customizable colors for these elements, along with dedicated options for Fair Value Gap (FVG) boxes, enhance the visual analysis during backtesting and live trading, making it easier to interpret the strategy's actions.
How It's Original
The LuciTech Strategy Template distinguishes itself in the crowded landscape of TradingView scripts through its unique combination of integrated, advanced risk management features, highly flexible stop-loss methodologies, and sophisticated alerting capabilities, all within a user-friendly and modular framework. While many templates offer basic entry/exit signal integration, LuciTech goes several steps further by providing a robust, ready-to-use infrastructure for managing the entire trade lifecycle once a signal is generated.
Unlike templates that might require users to piece together various risk management components or code complex stop-loss logic from scratch, LuciTech offers these critical functionalities out-of-the-box. The inclusion of dynamic position sizing based on a user-defined risk percentage, a configurable risk-to-reward ratio, and an intelligent breakeven mechanism significantly elevates its utility. This comprehensive approach to capital preservation and profit targeting is a cornerstone of professional trading and is often overlooked or simplified in generic templates.
Furthermore, the template's provision for multiple stop-loss calculation types—ATR-based for volatility adaptation, and candle-based for structural support/resistance—demonstrates a deep understanding of diverse trading strategies. The underlying code for these calculations is already implemented, saving developers considerable time and effort. The subtle yet powerful inclusion of FVG (Fair Value Gap) related inputs also hints at advanced price action concepts, offering a sophisticated layer of analysis and execution that is not commonly found in general-purpose templates.
The advanced webhook alerting system, with its support for various JSON formats tailored for platforms like Telegram, showcases an originality in catering to the needs of modern, automated trading setups. This moves beyond simple TradingView pop-up alerts, enabling seamless integration with external systems for real-time trade monitoring and execution. This level of external connectivity and customizable data output is a significant differentiator.
In essence, the LuciTech Strategy Template is original not just in its individual features, but in how these features are cohesively integrated to form a powerful, opinionated, yet highly adaptable system. It empowers traders to focus their creative energy on developing their core entry/exit signals, confident that the underlying framework will handle the complexities of risk management, trade execution, and external communication with precision and flexibility. It's a comprehensive solution designed to accelerate the development of robust and professional trading strategies.
How to Modify the Logic to Apply Your Strategy
The LuciTech Strategy Template is designed with modularity in mind, making it exceptionally straightforward to integrate your unique trading strategy logic. The template provides a clear separation between the core strategy management (risk, position sizing, exits) and the entry signal generation. This allows you to easily plug in your own buy and sell conditions without altering the robust underlying framework.
Here’s a step-by-step guide on how to adapt the template to your specific trading strategy:
1.
Locate the Strategy Logic Section:
Open the Pine Script editor in TradingView and navigate to the section clearly marked with the comment //Strategy Logic Example:. This is where the template’s placeholder entry conditions (a simple moving average crossover) are defined.
2.
Define Your Custom Entry Conditions:
Within this section, you will find variables such as longCondition and shortCondition. These are boolean variables that determine when a long or short trade should be initiated. Replace the existing example logic with your own custom buy and sell conditions. Your conditions can be based on any combination of indicators, price action patterns, candlestick formations, or other market analysis techniques. For example, if your strategy involves a combination of RSI and MACD, you would define longCondition as (rsi > 50 and macd_line > signal_line) and shortCondition as (rsi < 50 and macd_line < signal_line).
3.
Leverage the Template’s Built-in Features:
Once your longCondition and shortCondition are defined, the rest of the template automatically takes over. The integrated risk management module will calculate the appropriate position size based on your Risk % input and the chosen Stop Loss Type. The Risk:Reward ratio will determine your take-profit levels, and the Breakeven at R feature will manage your stop-loss dynamically. The time filter (Use Time Filter) will ensure your trades only occur within your specified hours, and the webhook alerts will notify you of trade executions.

Unusual Moves Detector# Unusual Moves Detector
A TradingView indicator that detects and alerts users to unusual price movements based on ATR (Average True Range) and volume analysis. This indicator is designed to identify price action that deviates significantly from normal market behavior.
## Features
### Core Detection Mechanisms
- **ATR-Based Volatility Detection**: Identifies price movements that exceed normal volatility levels
- **Volume Analysis**: Optional volume spike detection to confirm unusual moves
- **Signal Persistence Tracking**: Monitors how many signals occur within a lookback period
### Visual Indicators
- **Up/Down Arrows**: Green triangles for unusual upward moves, red triangles for downward moves
- **Signal Strength Labels**: Numbers showing how many signals occurred in the lookback period
- **Real-time Metrics Table**: Displays current ATR and volume ratios
### Customizable Parameters
1. **ATR Period** (default: 14)
- Length for Average True Range calculation
- Affects volatility measurement sensitivity
2. **Volume MA Period** (default: 20)
- Period for volume moving average
- Used in volume spike detection
3. **ATR Multiplier** (default: 2.0)
- How many times the ATR to trigger a signal
- Higher values = less sensitive to price moves
4. **Volume Multiplier** (default: 2.0)
- How many times the average volume to consider "high volume"
- Higher values = less sensitive to volume spikes
5. **Include Volume Analysis** (default: true)
- Toggle volume confirmation requirement
- When disabled, only price volatility matters
6. **Signal Lookback Period** (default: 5)
- How many bars to look back for signal counting
- Affects signal strength calculation
### Alert System
- **Upward Movement Alerts**: Triggers when unusual upward price action is detected
- **Downward Movement Alerts**: Triggers when unusual downward price action is detected
- **Customizable Alert Messages**: Can be configured in TradingView's alert system
### Information Display
Real-time metrics table shows:
- Current ATR value
- Volume ratio (current volume / average volume)
- Net signal count (up signals - down signals)
## Installation
1. Open TradingView's Pine Script Editor
2. Create a new indicator
3. Copy and paste the indicator code
4. Click "Add to Chart" to apply the indicator
## Usage Guide
### Basic Setup
1. Add the indicator to your chart
2. Adjust parameters based on your trading timeframe and style
3. Configure alerts if desired
### Parameter Tuning Tips
- **For More Signals**: Lower the ATR and Volume multipliers
- **For Fewer Signals**: Increase the multipliers
- **For Trend Following**: Increase the lookback period
- **For Quick Signals**: Decrease the lookback period
### Alert Setup
1. Click the indicator settings
2. Go to "Create Alert"
3. Choose either up or down move condition
4. Configure alert settings (sound, notification, etc.)
## Backtesting Compatibility
- Fully compatible with TradingView's backtesting engine
- All calculations use historical data only
- No forward-looking data or repainting
## Technical Details
- Written in Pine Script v6
- Optimized for real-time calculation
- Uses native TradingView functions for performance
- Compatible with all timeframes
## Performance Considerations
- Lightweight computation using built-in functions
- Efficient memory usage with variable optimization
- Real-time calculation with minimal lag
## Support and Contribution
Feel free to modify and improve the indicator according to your needs. The code is well-commented for easy understanding and modification.
## License
Free to use and modify for personal and commercial purposes.
## Disclaimer
This indicator is for informational purposes only. Always conduct your own analysis and consider multiple factors when making trading decisions.

Heikin Ashi Overlay SuiteHeikin Ashi Overlay Suite is designed to give traders more control and clarity when working with Heikin Ashi candles — whether you're analyzing trend strength, reducing chart noise, or simply improving your visual read of market momentum. It works by layering multiple types of HA overlays and color systems on top of your standard candlestick chart — without switching chart types. With dynamic gradient coloring, smoothing options, and a predictive line tool, this script helps you see not just what the current trend is, but how strong it is, and what it would take to reverse it.
Heikin Ashi candles help reduce noise but this script goes further by:
➡️adding color intelligence that shows trend strength using a streak counter
➡️uses smoothing logic to clean up chop and whipsaws
➡️introduces a predictive close line — a subtle but powerful guide for anticipating trend flips before they happen
Everything is configurable: colors, candle sources, overlays, predictive tools, and line styles. It’s built for traders who want visual speed, but don’t want to sacrifice signal quality.
At its core, the script offers two powerful dropdown controls:
💥HA Color Scheme (Colors Regular Candles) — Applies Heikin Ashi-derived coloring to your regular candles based on trend direction or streak strength. This gives you instant visual context without switching to a separate chart type.
💥HA Candle Overlay Mode — Overlays actual Heikin Ashi-style candles directly on top of your chart, using your preferred source:
➡️Custom HA candles using internal formula logic
➡️TradingView’s built-in Heikin Ashi source with your own colors
➖➖➖➖➖➖➖➖➖➖➖➖➖➖➖➖➖➖➖➖➖➖➖➖➖➖➖➖➖➖➖
🎨 Custom + Gradient HA Coloring🎨
See trend strength at a glance:
➡️1–4 bar streaks → lighter tone
➡️5–8 bars → medium tone
➡️9+ bars → bold tone, ideal for momentum-based entries, exits, or scaling strategies
→ Choose from:
➡️Your own custom color set
➡️A simple 2-color base mode
➡️Or a 3-level gradient for progressive trend analysis (using the streak counter)
🏛️ TradingView Official Heikin Ashi Overlay
Prefer native HA candles but want your own colors?
This mode plots TradingView's Heikin Ashi source, with your personal bullish/bearish color scheme.
➡️Ensures consistency with built-in charts while still leveraging your visual style.
🌊 Smoothed Heikin Ashi Candles — Clarity in Chaos🌊
These aren’t your standard HA candles. Smoothed Heikin Ashi uses a two-step EMA process to transform chaotic price action into a cleaner, slower-moving trend structure:
🔹 First, it smooths the raw OHLC data using EMA — filtering out minor price fluctuations.
🔹 Then, it applies the Heikin Ashi transformation on top of the smoothed data.
🔹 Finally, it applies a second EMA smoothing pass to the HA values — creating ultra-smooth candles.
📈 What You See:
Trends appear more fluid and consistent.
Choppy ranges and fakeouts are visually suppressed.
Minor pullbacks within a trend are de-emphasized, helping you avoid premature exits.
🎯 Best For:
Swing traders looking to stay in positions longer.
Intraday traders dealing with volatile or noisy instruments.
Anyone who wants a "trend map" overlay without the distractions of raw price action.
✅ Reduces whipsaws
✅ Delivers high-contrast trend zones
✅ Makes reversals more visually apparent (but with a slight lag)
📍 Predictive Close Line📍
Shows where the real close must land to flip the current HA candle's color.
✅ Use it like predictive support/resistance
✅ Know if the trend is actually at risk
✅Visualize potential fakeouts or confirmation
Color-coded based on current HA direction (bullish, bearish, or neutral).
📈 Tick by tick & bar-to-bar Plots📈
Provides 2 plot types:
1)1 plot that tracks a bar tick by tick
2)another plot that tracks the close from bar to bar
For the bar to bar plot, you can choose between 2 options:
✅Full Plot — continuous line colored by HA trend
✅Recent Segments — color just the last few bars (configurable) to reduce chart clutter
✅ Customize width, number of bars, and visibility
➖➖➖➖➖➖➖➖➖➖➖➖➖➖➖➖➖➖➖➖➖➖➖➖➖➖➖➖➖➖➖
📘 How to Use this script📘
Imagine you're watching a choppy 15-minute chart on a volatile crypto pair — price action is messy, and it’s hard to tell if a trend is forming or just noise.
Here’s how to cut through the chaos using Heikin Ashi Overlay Suite:
🔹 Step 1: Enable "Smoothed HA Candles"
Start by turning on the smoothed candles. You’ll immediately notice the noise fades, and broader directional moves become easier to follow. It's like switching from static to clean trend zones.
🧠 Why: Smoothed HA uses a double EMA process that filters out small reversals and lets larger moves stand out. Perfect for sideways or jittery charts.
🔹 Step 2: Watch the Color Gradient Build
As the smoothed candles begin to align in one direction, the gradient coloring (1–4, 5–8, 9+ streaks) gives you an at-a-glance visual of how strong the trend is.
✅ If you see 9+ same-colored candles? You’re likely in a mature trend.
✅ If it resets often? You’re in chop — consider staying out.
🔹 Step 3: Use the Predictive Close Line for Anticipation
Now here’s the edge — this line tells you where the candle would have to close to flip colors.
📉 If price is hovering just above it during a bullish run — momentum may be weakening.
📈 If price bounces off it — the trend may be strengthening.
This is excellent for confirming entries, exits, or spotting early warning signs.
🔹 Step 4: Switch Between Candle Modes as Needed
You can flip between:
✅ Custom HA: Gradient candles with your colors
✅ TradingView HA: The official source with your styling
✅ None: Just color regular candles using the HA logic
Use what fits your style — everything is modular.
🔹 Step 5: Tune It to Your Chart
Lastly, tweak streak thresholds (currently only can do this within the source code), smoothing lengths, and line styles to match your timeframe and strategy.
🎯 Tailor The Settings to Fit Your Trading Style🎯
🔹 🧪 Scalper (1–5 min charts)
If you’re trading fast intraday moves, you want quicker responsiveness and less lag.
Try these settings:
🔸Smoothing Lengths: Use lower values (e.g. len = 3, len2 = 5)
🔸Candle Mode: Use Custom HA or TV’s HA for real-time color flips
🔸Predictive Close Line: Great for ultra-fast anticipation of color reversals
🔸Line Mode: Use Recent Segments mode to track short bursts of trend
🔸Colors: Use high-contrast, opaque colors for clarity
✅ These settings help you catch micro-trends and flip signals faster, while still filtering out the worst of the noise.
🔹 🧪 Swing Trader (30m–4h charts and beyond)
If you’re looking for multi-hour or multi-day trend confirmation, prioritize clarity and staying in moves longer.
Recommended setup:
🔸Smoothing Lengths: Medium to high values (e.g. len = 8, len2 = 21)
🔸Candle Mode: Use Smoothed HA Candles to block out intrabar chop
🔸Gradient Colors: Enable to visualize trend maturity and strength
🔸Predictive Close Line: Helps confirm trend continuation or spot early reversals
🔸Line Mode: Use Full Plot Line for clean HA-based trend tracking
✅ These settings give you a calm, clean view of the bigger picture — ideal for holding positions longer and avoiding early exits.
🔧 This script isn’t just a chart overlay — it’s a visual trend engine.🔧
Ideal For:
🔶 Trend-followers who want clean, color-coded confirmation
🔶 Reversal traders spotting exhaustion via predictive flips
🔶 Scalpers filtering noise with lighter smoothing
🔶 Swing traders using smoothed visuals to hold longer
📌 Final Note
Heikin Ashi Overlay Pro is designed to help you see momentum, trend shifts, and market structure with greater clarity — not to predict price on its own. For best results:
✔️ Combine with support/resistance, moving averages, or price action patterns
✔️ Use Predictive Close as a confirmation tool, not a signal generator
✔️ Pair gradient colors with structure to gauge trend maturity
✔️ Always zoom out and check higher timeframes for context
🧠 Use this as part of a layered approach — not a standalone system.
🙏 Credits🙏
⚡HA logic based on SimpleCryptoLife
⚡Smoothed HA concept adapted from a script by Jackvmk
💡💡💡Turn logic into clarity. Structure into trades. And uncertainty into confidence.💡💡💡

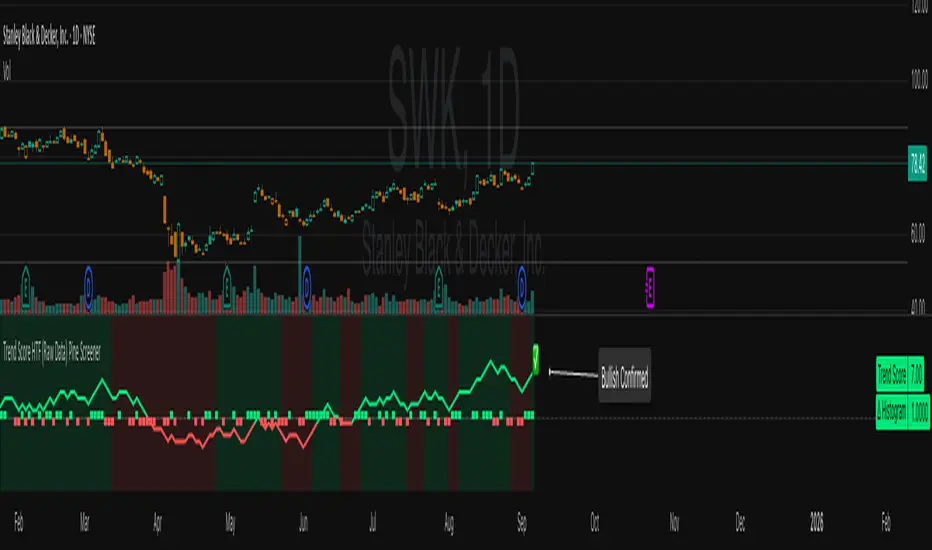
Trend Score HTF (Raw Data) Pine Screener📘 Trend Score HTF (Raw Data) Pine Screener — Indicator Guide
This indicator tracks price action using a custom cumulative Trend Score (TS) system. It helps you visualize trend momentum, detect early reversals, confirm direction changes, and screen for entries across large watchlists like SPX500 using TradingView’s Pine Script Screener (beta).
⸻
🔧 What This Indicator Does
• Assigns a +1 or -1 score when price breaks the previous high or low
• Accumulates these scores into a real-time tsScore
• Detects early warnings (primed flips) and trend changes (confirmed flips)
• Supports alerts and labels for visual and automated trading
• Designed to work inside the Pine Screener so you can filter hundreds of tickers live
⸻
⚙️ Recommended Settings (for Beginners)
When adding the indicator to your chart:
Go to the “Inputs” tab at the top of the settings panel.
Then:
• Uncheck “Confirm flips on bar close”
• Check “Accumulate TS Across Flips? (ON = non-reset, OFF = reset)”
This setup allows you to see trend changes immediately without waiting for bar closes and lets the trend score build continuously over time, making it easier to follow long trends.
⸻
🧠 Core Logic
Start Date
Select a meaningful historical start date — for example: 2020-01-01. This provides long-term context for trend score calculation.
Per-Bar Delta (Δ) Calculation
The indicator scores each bar based on breakout behavior:
If the bar breaks only the previous high, Δ = +1
If it breaks only the previous low, Δ = -1
If it breaks both the high and low, Δ = 0
If it breaks neither, Δ = 0
This filters out wide-range or indecisive candles during volatility.
Cumulative Trend Score
Each bar’s delta is added to the running tsScore.
When it rises, bullish pressure is building.
When it falls, bearish pressure is increasing.
Trend Flip Logic
A bullish flip happens when tsScore rises by +3 from the lowest recent point.
A bearish flip happens when tsScore falls by -3 from the highest recent point.
These flips update the active trend direction between bullish and bearish.
⸻
⚠️ What Is a “Primed” Flip?
A primed flip is a signal that the current trend is about to flip — just one point away.
A primed bullish flip means the trend is currently bearish, but the tsScore only needs +1 more to flip. If the next bar breaks the previous high (without breaking the low), it will trigger a bullish flip.
A primed bearish flip means the trend is currently bullish, but the tsScore only needs -1 more to flip. If the next bar breaks the previous low (without breaking the high), it will trigger a bearish flip.
Primed flips are plotted one bar ahead of the current bar. They act like forecasts and give you a head start.
⸻
✅ What Is a “Confirmed” Flip?
A confirmed flip is the first bar of a new trend direction.
A confirmed bullish flip appears when a bearish trend officially flips into a new bullish trend.
A confirmed bearish flip appears when a bullish trend officially flips into a new bearish trend.
These signals are reliable and great for entries, trend filters, or reversals.
⸻
🖼 Visual Cues
The trend score (tsScore) line shows the accumulated trend strength.
A Δ histogram shows the daily price contribution: +1 for breaking highs, -1 for breaking lows, 0 otherwise.
A green background means the chart is in a bullish trend.
A red background means the chart is in a bearish trend.
A ⬆ label signals a primed bullish flip is possible on the next bar.
A ⬇ label signals a primed bearish flip is possible on the next bar.
A ✅ means a bullish flip just confirmed.
A ❌ means a bearish flip just confirmed.
⸻
🔔 Alerts You Can Use
The indicator includes these built-in alerts:
• Primed Bullish Flip — watch for possible bullish reversal tomorrow
• Primed Bearish Flip — watch for possible bearish reversal tomorrow
• Bullish Confirmed — official entry into new uptrend
• Bearish Confirmed — official entry into new downtrend
You can set these alerts in TradingView to monitor across your chart or watchlist.
⸻
📈 How to Use in TradingView Pine Screener
Step 1: Create your own watchlist — for example, SPX500
Step 2: Favorite this indicator so it shows up in the screener
Step 3: Go to TradingView → Products → Screeners → Pine (Beta)
Step 4: Select this indicator and choose a condition, like “Bullish Confirmed”
Step 5: Click Scan
You’ll instantly see stocks that just flipped trends or are close to doing so.
⸻
⏰ When to Use the Screener
Use this screener after market close or before the next open to avoid intraday noise.
During the day, if a candle breaks both the high and low, the delta becomes 0, which may cancel a flip or primed signal.
Results during regular trading hours can change frequently. For best results, scan during stable periods like pre-market or after-hours.
⸻
🧪 Real-World Examples
SWK
NVR
WMT
UNH
Each of these examples shows clean, structured trend transitions detected in advance or confirmed with precision.
PLTR: complicated case primed for bullish (but we don't when it will flip)
⚠️ Risk Disclaimer & Trend Context
A confirmed bullish signal does not guarantee an immediate price increase. Price may continue to consolidate or even pull back after a bullish flip.
Likewise, a primed bullish signal does not always lead to confirmation. It simply means the conditions are close — but if the next bar breaks both the high and low, or breaks only the low, the flip will be canceled.
On the other side, a confirmed bearish signal does not mean the market will crash. If the overall trend is bullish (for example, tsScore has been rising for weeks), then a bearish flip may just represent a short-term pullback — not a trend reversal.
You always need to consider the overall market structure. If the long-term trend is bullish, it’s usually smarter to wait for bullish confirmation signals. Bearish flips in that context are often just dips — not opportunities to short.
This indicator gives you context, not predictions. It’s a tool for alignment — not absolute outcomes. Use it to follow structure, not fight it.
Support and Resistance levels from Options DataINTRODUCTION
This script is designed to visualize key support and resistance levels derived from options data on TradingView charts. It overlays lines, labels, and boxes to highlight levels such as Put Walls (gamma support), Call Walls (gamma resistance), Gamma Flip points, Vanna levels, and more.
These levels are intended to help traders identify potential areas of price magnetism, reversal, or breakout based on options market dynamics. All calculations and visualizations are based on user-provided data pasted into the input field, as Pine Script cannot directly fetch external options data due to platform limitations (explained below).
For convenience, my website allows users to interact with a bot that will generate the string for up to 30 tickers at once getting nearly real-time data on demand (data is cached for 15min). With the output string pasted into this indicator, it's a bliss to shuffle through your portfolio and see those levels for each ticker.
The script is open-source under TradingView's terms, allowing users to study, modify, and improve it. It draws inspiration from common options-derived metrics like gamma exposure and vanna, which are widely discussed in financial literature. No external code is copied without rights; all logic is original or based on standard mathematical formulas.
How the Options Levels Are Calculated
The levels displayed by this script are not computed within Pine Script itself—instead, they rely on pre-calculated values provided by the user (via a pasted data string). These values are derived from options chain data fetched from financial APIs (e.g., using libraries like yfinance in Python). Here's a step-by-step overview of how these levels are generally calculated externally before being input into the script:
Fetching Options Data:
Historical and current options chain data for a ticker (e.g., strikes, open interest, volume, implied volatility, expirations) is retrieved for near-term expirations (e.g., up to 90 days).
Current stock price is obtained from recent history.
Gamma Support (Put Wall) and Resistance (Call Wall):
Gamma Calculation: For each option, gamma (the rate of change of delta) is computed using the Black-Scholes formula:
gamma = N'(d1) / (S * sigma * sqrt(T))
where S is the stock price, K is the strike, T is time to expiration (in years), sigma is implied volatility, r is the risk-free rate (e.g., 0.0445), and N'(d1) is the normal probability density function.
Weighted gamma is multiplied by open interest and aggregated by strike.
The Put Wall is the strike below the current price with the highest weighted gamma from puts (acting as support).
The Call Wall is the strike above the current price with the highest weighted gamma from calls (acting as resistance).
Short-term versions focus on strikes closer to the money (e.g., within 10-15% of the price).
Gamma Flip Level:
Net dealer gamma exposure (GEX) is calculated across all strikes:
GEX = sum (gamma * OI * 100 * S^2 * sign * decay)
where sign is +1 for calls/-1 for puts, and decay is 1 / sqrt(T).
The flip point is the price where net GEX changes sign (from positive to negative or vice versa), interpolated between strikes.
Vanna Levels:
Vanna (sensitivity of delta to volatility) is calculated:
vanna = -N'(d1) * d2 / sigma
where d2 = d1 - sigma * sqrt(T).
Weighted by open interest, the highest positive and negative vanna strikes are identified.
Other Levels:
S1/R1: Significant strikes with high combined open interest and volume (80% OI + 20% volume), below/above price for support/resistance.
Implied Move: ATM implied volatility scaled by S * sigma * sqrt(d/365) (e.g., for 7 days).
Call/Put Ratio: Total call contracts divided by put contracts (OI + volume).
IV Percentage: Average ATM implied volatility.
Options Activity Level: Average contracts per unique strike, binned into levels (0-4).
Stop Loss: Dynamically set below the lowest support (e.g., Put Wall, Gamma Flip), adjusted by IV (tighter in low IV).
Fib Target: 1.618 extension from Put Wall to Call Wall range.
Previous day levels are stored for comparison (e.g., to detect Call Wall movement >2.5% for alerts).
Effect as Support and Resistance in Technical Trading
Options levels like gamma walls influence price action due to market maker hedging:
Put Wall (Gamma Support): High put gamma below price creates a "magnet" effect—market makers buy stock as price falls, providing support. Traders might look for bounces here as entry points for longs.
Call Wall (Gamma Resistance): High call gamma above price leads to selling pressure from hedging, acting as resistance. Rejections here could signal trims, sells or even shorts.
Gamma Flip: Where gamma exposure flips sign, often a volatility pivot—crossing it can accelerate moves (bullish above, bearish below).
Vanna Levels: Positive/negative vanna indicate volatility sensitivity; crosses may signal regime shifts.
Implied Move: Shows expected range; prices outside suggest overextension.
S1/R1 and Fib Target: Volume/OI clusters act as classic S/R; Fib extensions project upside targets post-breakout.
In trading, these are not guarantees—combine with TA (e.g., volume, trends). High activity levels imply stronger effects; low CP ratio suggests bearish sentiment. Alerts trigger on proximities/crosses for awareness, not advice.
Limitations of the TradingView Platform for Data Pulling
TradingView's Pine Script is sandboxed for security and performance:
No direct internet access or API calls (e.g., can't fetch yfinance data in-script).
Limited to chart data/symbol info; no real-time options chains.
Inputs are static per load; updates require manual pasting.
Caching isn't persistent across sessions.
This prevents dynamic data pulling, ensuring scripts remain lightweight but requiring external tools for fresh data.
Creative Solution for On-Demand Data Pulling
To overcome these limitations, users can use external tools or scripts (e.g., Python-based) to fetch and compute levels on demand. The tool processes tickers, generates a formatted string (e.g., "TICKER:level1,level2,...;TIMESTAMP:unix;"), and users paste it into the script's input. This keeps data fresh without violating platform rules, as computation happens off-platform. For example, run a local script to query APIs and output the string—adaptable for any ticker.
Script Functionality Breakdown
Inputs: Custom data string (parsed for levels/timestamp); toggles for short-term/previous/Vanna/stop loss; style options (colors, transparency).
Parsing: Extracts levels for the chart symbol; gets timestamp for "updated ago" display.
Drawing: Lines/labels for levels; boxes for gamma zones/implied move; clears old elements on updates.
Info Panel: Top-right summary with metrics (CP ratio, IV, distances, activity); emojis for quick status.
Alerts: Conditions for proximities, crosses, bounces (e.g., 0.5% bounce from Put Wall).
Performance: Uses vars for persistence; efficient for real-time.
This script is educational—test thoroughly. Not financial advice; past performance isn't indicative of future results. Feedback welcome via TradingView comments.

Markov Chain [3D] | FractalystWhat exactly is a Markov Chain?
This indicator uses a Markov Chain model to analyze, quantify, and visualize the transitions between market regimes (Bull, Bear, Neutral) on your chart. It dynamically detects these regimes in real-time, calculates transition probabilities, and displays them as animated 3D spheres and arrows, giving traders intuitive insight into current and future market conditions.
How does a Markov Chain work, and how should I read this spheres-and-arrows diagram?
Think of three weather modes: Sunny, Rainy, Cloudy.
Each sphere is one mode. The loop on a sphere means “stay the same next step” (e.g., Sunny again tomorrow).
The arrows leaving a sphere show where things usually go next if they change (e.g., Sunny moving to Cloudy).
Some paths matter more than others. A more prominent loop means the current mode tends to persist. A more prominent outgoing arrow means a change to that destination is the usual next step.
Direction isn’t symmetric: moving Sunny→Cloudy can behave differently than Cloudy→Sunny.
Now relabel the spheres to markets: Bull, Bear, Neutral.
Spheres: market regimes (uptrend, downtrend, range).
Self‑loop: tendency for the current regime to continue on the next bar.
Arrows: the most common next regime if a switch happens.
How to read: Start at the sphere that matches current bar state. If the loop stands out, expect continuation. If one outgoing path stands out, that switch is the typical next step. Opposite directions can differ (Bear→Neutral doesn’t have to match Neutral→Bear).
What states and transitions are shown?
The three market states visualized are:
Bullish (Bull): Upward or strong-market regime.
Bearish (Bear): Downward or weak-market regime.
Neutral: Sideways or range-bound regime.
Bidirectional animated arrows and probability labels show how likely the market is to move from one regime to another (e.g., Bull → Bear or Neutral → Bull).
How does the regime detection system work?
You can use either built-in price returns (based on adaptive Z-score normalization) or supply three custom indicators (such as volume, oscillators, etc.).
Values are statistically normalized (Z-scored) over a configurable lookback period.
The normalized outputs are classified into Bull, Bear, or Neutral zones.
If using three indicators, their regime signals are averaged and smoothed for robustness.
How are transition probabilities calculated?
On every confirmed bar, the algorithm tracks the sequence of detected market states, then builds a rolling window of transitions.
The code maintains a transition count matrix for all regime pairs (e.g., Bull → Bear).
Transition probabilities are extracted for each possible state change using Laplace smoothing for numerical stability, and frequently updated in real-time.
What is unique about the visualization?
3D animated spheres represent each regime and change visually when active.
Animated, bidirectional arrows reveal transition probabilities and allow you to see both dominant and less likely regime flows.
Particles (moving dots) animate along the arrows, enhancing the perception of regime flow direction and speed.
All elements dynamically update with each new price bar, providing a live market map in an intuitive, engaging format.
Can I use custom indicators for regime classification?
Yes! Enable the "Custom Indicators" switch and select any three chart series as inputs. These will be normalized and combined (each with equal weight), broadening the regime classification beyond just price-based movement.
What does the “Lookback Period” control?
Lookback Period (default: 100) sets how much historical data builds the probability matrix. Shorter periods adapt faster to regime changes but may be noisier. Longer periods are more stable but slower to adapt.
How is this different from a Hidden Markov Model (HMM)?
It sets the window for both regime detection and probability calculations. Lower values make the system more reactive, but potentially noisier. Higher values smooth estimates and make the system more robust.
How is this Markov Chain different from a Hidden Markov Model (HMM)?
Markov Chain (as here): All market regimes (Bull, Bear, Neutral) are directly observable on the chart. The transition matrix is built from actual detected regimes, keeping the model simple and interpretable.
Hidden Markov Model: The actual regimes are unobservable ("hidden") and must be inferred from market output or indicator "emissions" using statistical learning algorithms. HMMs are more complex, can capture more subtle structure, but are harder to visualize and require additional machine learning steps for training.
A standard Markov Chain models transitions between observable states using a simple transition matrix, while a Hidden Markov Model assumes the true states are hidden (latent) and must be inferred from observable “emissions” like price or volume data. In practical terms, a Markov Chain is transparent and easier to implement and interpret; an HMM is more expressive but requires statistical inference to estimate hidden states from data.
Markov Chain: states are observable; you directly count or estimate transition probabilities between visible states. This makes it simpler, faster, and easier to validate and tune.
HMM: states are hidden; you only observe emissions generated by those latent states. Learning involves machine learning/statistical algorithms (commonly Baum–Welch/EM for training and Viterbi for decoding) to infer both the transition dynamics and the most likely hidden state sequence from data.
How does the indicator avoid “repainting” or look-ahead bias?
All regime changes and matrix updates happen only on confirmed (closed) bars, so no future data is leaked, ensuring reliable real-time operation.
Are there practical tuning tips?
Tune the Lookback Period for your asset/timeframe: shorter for fast markets, longer for stability.
Use custom indicators if your asset has unique regime drivers.
Watch for rapid changes in transition probabilities as early warning of a possible regime shift.
Who is this indicator for?
Quants and quantitative researchers exploring probabilistic market modeling, especially those interested in regime-switching dynamics and Markov models.
Programmers and system developers who need a probabilistic regime filter for systematic and algorithmic backtesting:
The Markov Chain indicator is ideally suited for programmatic integration via its bias output (1 = Bull, 0 = Neutral, -1 = Bear).
Although the visualization is engaging, the core output is designed for automated, rules-based workflows—not for discretionary/manual trading decisions.
Developers can connect the indicator’s output directly to their Pine Script logic (using input.source()), allowing rapid and robust backtesting of regime-based strategies.
It acts as a plug-and-play regime filter: simply plug the bias output into your entry/exit logic, and you have a scientifically robust, probabilistically-derived signal for filtering, timing, position sizing, or risk regimes.
The MC's output is intentionally "trinary" (1/0/-1), focusing on clear regime states for unambiguous decision-making in code. If you require nuanced, multi-probability or soft-label state vectors, consider expanding the indicator or stacking it with a probability-weighted logic layer in your scripting.
Because it avoids subjectivity, this approach is optimal for systematic quants, algo developers building backtested, repeatable strategies based on probabilistic regime analysis.
What's the mathematical foundation behind this?
The mathematical foundation behind this Markov Chain indicator—and probabilistic regime detection in finance—draws from two principal models: the (standard) Markov Chain and the Hidden Markov Model (HMM).
How to use this indicator programmatically?
The Markov Chain indicator automatically exports a bias value (+1 for Bullish, -1 for Bearish, 0 for Neutral) as a plot visible in the Data Window. This allows you to integrate its regime signal into your own scripts and strategies for backtesting, automation, or live trading.
Step-by-Step Integration with Pine Script (input.source)
Add the Markov Chain indicator to your chart.
This must be done first, since your custom script will "pull" the bias signal from the indicator's plot.
In your strategy, create an input using input.source()
Example:
//@version=5
strategy("MC Bias Strategy Example")
mcBias = input.source(close, "MC Bias Source")
After saving, go to your script’s settings. For the “MC Bias Source” input, select the plot/output of the Markov Chain indicator (typically its bias plot).
Use the bias in your trading logic
Example (long only on Bull, flat otherwise):
if mcBias == 1
strategy.entry("Long", strategy.long)
else
strategy.close("Long")
For more advanced workflows, combine mcBias with additional filters or trailing stops.
How does this work behind-the-scenes?
TradingView’s input.source() lets you use any plot from another indicator as a real-time, “live” data feed in your own script (source).
The selected bias signal is available to your Pine code as a variable, enabling logical decisions based on regime (trend-following, mean-reversion, etc.).
This enables powerful strategy modularity : decouple regime detection from entry/exit logic, allowing fast experimentation without rewriting core signal code.
Integrating 45+ Indicators with Your Markov Chain — How & Why
The Enhanced Custom Indicators Export script exports a massive suite of over 45 technical indicators—ranging from classic momentum (RSI, MACD, Stochastic, etc.) to trend, volume, volatility, and oscillator tools—all pre-calculated, centered/scaled, and available as plots.
// Enhanced Custom Indicators Export - 45 Technical Indicators
// Comprehensive technical analysis suite for advanced market regime detection
//@version=6
indicator('Enhanced Custom Indicators Export | Fractalyst', shorttitle='Enhanced CI Export', overlay=false, scale=scale.right, max_labels_count=500, max_lines_count=500)
// |----- Input Parameters -----| //
momentum_group = "Momentum Indicators"
trend_group = "Trend Indicators"
volume_group = "Volume Indicators"
volatility_group = "Volatility Indicators"
oscillator_group = "Oscillator Indicators"
display_group = "Display Settings"
// Common lengths
length_14 = input.int(14, "Standard Length (14)", minval=1, maxval=100, group=momentum_group)
length_20 = input.int(20, "Medium Length (20)", minval=1, maxval=200, group=trend_group)
length_50 = input.int(50, "Long Length (50)", minval=1, maxval=200, group=trend_group)
// Display options
show_table = input.bool(true, "Show Values Table", group=display_group)
table_size = input.string("Small", "Table Size", options= , group=display_group)
// |----- MOMENTUM INDICATORS (15 indicators) -----| //
// 1. RSI (Relative Strength Index)
rsi_14 = ta.rsi(close, length_14)
rsi_centered = rsi_14 - 50
// 2. Stochastic Oscillator
stoch_k = ta.stoch(close, high, low, length_14)
stoch_d = ta.sma(stoch_k, 3)
stoch_centered = stoch_k - 50
// 3. Williams %R
williams_r = ta.stoch(close, high, low, length_14) - 100
// 4. MACD (Moving Average Convergence Divergence)
= ta.macd(close, 12, 26, 9)
// 5. Momentum (Rate of Change)
momentum = ta.mom(close, length_14)
momentum_pct = (momentum / close ) * 100
// 6. Rate of Change (ROC)
roc = ta.roc(close, length_14)
// 7. Commodity Channel Index (CCI)
cci = ta.cci(close, length_20)
// 8. Money Flow Index (MFI)
mfi = ta.mfi(close, length_14)
mfi_centered = mfi - 50
// 9. Awesome Oscillator (AO)
ao = ta.sma(hl2, 5) - ta.sma(hl2, 34)
// 10. Accelerator Oscillator (AC)
ac = ao - ta.sma(ao, 5)
// 11. Chande Momentum Oscillator (CMO)
cmo = ta.cmo(close, length_14)
// 12. Detrended Price Oscillator (DPO)
dpo = close - ta.sma(close, length_20)
// 13. Price Oscillator (PPO)
ppo = ta.sma(close, 12) - ta.sma(close, 26)
ppo_pct = (ppo / ta.sma(close, 26)) * 100
// 14. TRIX
trix_ema1 = ta.ema(close, length_14)
trix_ema2 = ta.ema(trix_ema1, length_14)
trix_ema3 = ta.ema(trix_ema2, length_14)
trix = ta.roc(trix_ema3, 1) * 10000
// 15. Klinger Oscillator
klinger = ta.ema(volume * (high + low + close) / 3, 34) - ta.ema(volume * (high + low + close) / 3, 55)
// 16. Fisher Transform
fisher_hl2 = 0.5 * (hl2 - ta.lowest(hl2, 10)) / (ta.highest(hl2, 10) - ta.lowest(hl2, 10)) - 0.25
fisher = 0.5 * math.log((1 + fisher_hl2) / (1 - fisher_hl2))
// 17. Stochastic RSI
stoch_rsi = ta.stoch(rsi_14, rsi_14, rsi_14, length_14)
stoch_rsi_centered = stoch_rsi - 50
// 18. Relative Vigor Index (RVI)
rvi_num = ta.swma(close - open)
rvi_den = ta.swma(high - low)
rvi = rvi_den != 0 ? rvi_num / rvi_den : 0
// 19. Balance of Power (BOP)
bop = (close - open) / (high - low)
// |----- TREND INDICATORS (10 indicators) -----| //
// 20. Simple Moving Average Momentum
sma_20 = ta.sma(close, length_20)
sma_momentum = ((close - sma_20) / sma_20) * 100
// 21. Exponential Moving Average Momentum
ema_20 = ta.ema(close, length_20)
ema_momentum = ((close - ema_20) / ema_20) * 100
// 22. Parabolic SAR
sar = ta.sar(0.02, 0.02, 0.2)
sar_trend = close > sar ? 1 : -1
// 23. Linear Regression Slope
lr_slope = ta.linreg(close, length_20, 0) - ta.linreg(close, length_20, 1)
// 24. Moving Average Convergence (MAC)
mac = ta.sma(close, 10) - ta.sma(close, 30)
// 25. Trend Intensity Index (TII)
tii_sum = 0.0
for i = 1 to length_20
tii_sum += close > close ? 1 : 0
tii = (tii_sum / length_20) * 100
// 26. Ichimoku Cloud Components
ichimoku_tenkan = (ta.highest(high, 9) + ta.lowest(low, 9)) / 2
ichimoku_kijun = (ta.highest(high, 26) + ta.lowest(low, 26)) / 2
ichimoku_signal = ichimoku_tenkan > ichimoku_kijun ? 1 : -1
// 27. MESA Adaptive Moving Average (MAMA)
mama_alpha = 2.0 / (length_20 + 1)
mama = ta.ema(close, length_20)
mama_momentum = ((close - mama) / mama) * 100
// 28. Zero Lag Exponential Moving Average (ZLEMA)
zlema_lag = math.round((length_20 - 1) / 2)
zlema_data = close + (close - close )
zlema = ta.ema(zlema_data, length_20)
zlema_momentum = ((close - zlema) / zlema) * 100
// |----- VOLUME INDICATORS (6 indicators) -----| //
// 29. On-Balance Volume (OBV)
obv = ta.obv
// 30. Volume Rate of Change (VROC)
vroc = ta.roc(volume, length_14)
// 31. Price Volume Trend (PVT)
pvt = ta.pvt
// 32. Negative Volume Index (NVI)
nvi = 0.0
nvi := volume < volume ? nvi + ((close - close ) / close ) * nvi : nvi
// 33. Positive Volume Index (PVI)
pvi = 0.0
pvi := volume > volume ? pvi + ((close - close ) / close ) * pvi : pvi
// 34. Volume Oscillator
vol_osc = ta.sma(volume, 5) - ta.sma(volume, 10)
// 35. Ease of Movement (EOM)
eom_distance = high - low
eom_box_height = volume / 1000000
eom = eom_box_height != 0 ? eom_distance / eom_box_height : 0
eom_sma = ta.sma(eom, length_14)
// 36. Force Index
force_index = volume * (close - close )
force_index_sma = ta.sma(force_index, length_14)
// |----- VOLATILITY INDICATORS (10 indicators) -----| //
// 37. Average True Range (ATR)
atr = ta.atr(length_14)
atr_pct = (atr / close) * 100
// 38. Bollinger Bands Position
bb_basis = ta.sma(close, length_20)
bb_dev = 2.0 * ta.stdev(close, length_20)
bb_upper = bb_basis + bb_dev
bb_lower = bb_basis - bb_dev
bb_position = bb_dev != 0 ? (close - bb_basis) / bb_dev : 0
bb_width = bb_dev != 0 ? (bb_upper - bb_lower) / bb_basis * 100 : 0
// 39. Keltner Channels Position
kc_basis = ta.ema(close, length_20)
kc_range = ta.ema(ta.tr, length_20)
kc_upper = kc_basis + (2.0 * kc_range)
kc_lower = kc_basis - (2.0 * kc_range)
kc_position = kc_range != 0 ? (close - kc_basis) / kc_range : 0
// 40. Donchian Channels Position
dc_upper = ta.highest(high, length_20)
dc_lower = ta.lowest(low, length_20)
dc_basis = (dc_upper + dc_lower) / 2
dc_position = (dc_upper - dc_lower) != 0 ? (close - dc_basis) / (dc_upper - dc_lower) : 0
// 41. Standard Deviation
std_dev = ta.stdev(close, length_20)
std_dev_pct = (std_dev / close) * 100
// 42. Relative Volatility Index (RVI)
rvi_up = ta.stdev(close > close ? close : 0, length_14)
rvi_down = ta.stdev(close < close ? close : 0, length_14)
rvi_total = rvi_up + rvi_down
rvi_volatility = rvi_total != 0 ? (rvi_up / rvi_total) * 100 : 50
// 43. Historical Volatility
hv_returns = math.log(close / close )
hv = ta.stdev(hv_returns, length_20) * math.sqrt(252) * 100
// 44. Garman-Klass Volatility
gk_vol = math.log(high/low) * math.log(high/low) - (2*math.log(2)-1) * math.log(close/open) * math.log(close/open)
gk_volatility = math.sqrt(ta.sma(gk_vol, length_20)) * 100
// 45. Parkinson Volatility
park_vol = math.log(high/low) * math.log(high/low)
parkinson = math.sqrt(ta.sma(park_vol, length_20) / (4 * math.log(2))) * 100
// 46. Rogers-Satchell Volatility
rs_vol = math.log(high/close) * math.log(high/open) + math.log(low/close) * math.log(low/open)
rogers_satchell = math.sqrt(ta.sma(rs_vol, length_20)) * 100
// |----- OSCILLATOR INDICATORS (5 indicators) -----| //
// 47. Elder Ray Index
elder_bull = high - ta.ema(close, 13)
elder_bear = low - ta.ema(close, 13)
elder_power = elder_bull + elder_bear
// 48. Schaff Trend Cycle (STC)
stc_macd = ta.ema(close, 23) - ta.ema(close, 50)
stc_k = ta.stoch(stc_macd, stc_macd, stc_macd, 10)
stc_d = ta.ema(stc_k, 3)
stc = ta.stoch(stc_d, stc_d, stc_d, 10)
// 49. Coppock Curve
coppock_roc1 = ta.roc(close, 14)
coppock_roc2 = ta.roc(close, 11)
coppock = ta.wma(coppock_roc1 + coppock_roc2, 10)
// 50. Know Sure Thing (KST)
kst_roc1 = ta.roc(close, 10)
kst_roc2 = ta.roc(close, 15)
kst_roc3 = ta.roc(close, 20)
kst_roc4 = ta.roc(close, 30)
kst = ta.sma(kst_roc1, 10) + 2*ta.sma(kst_roc2, 10) + 3*ta.sma(kst_roc3, 10) + 4*ta.sma(kst_roc4, 15)
// 51. Percentage Price Oscillator (PPO)
ppo_line = ((ta.ema(close, 12) - ta.ema(close, 26)) / ta.ema(close, 26)) * 100
ppo_signal = ta.ema(ppo_line, 9)
ppo_histogram = ppo_line - ppo_signal
// |----- PLOT MAIN INDICATORS -----| //
// Plot key momentum indicators
plot(rsi_centered, title="01_RSI_Centered", color=color.purple, linewidth=1)
plot(stoch_centered, title="02_Stoch_Centered", color=color.blue, linewidth=1)
plot(williams_r, title="03_Williams_R", color=color.red, linewidth=1)
plot(macd_histogram, title="04_MACD_Histogram", color=color.orange, linewidth=1)
plot(cci, title="05_CCI", color=color.green, linewidth=1)
// Plot trend indicators
plot(sma_momentum, title="06_SMA_Momentum", color=color.navy, linewidth=1)
plot(ema_momentum, title="07_EMA_Momentum", color=color.maroon, linewidth=1)
plot(sar_trend, title="08_SAR_Trend", color=color.teal, linewidth=1)
plot(lr_slope, title="09_LR_Slope", color=color.lime, linewidth=1)
plot(mac, title="10_MAC", color=color.fuchsia, linewidth=1)
// Plot volatility indicators
plot(atr_pct, title="11_ATR_Pct", color=color.yellow, linewidth=1)
plot(bb_position, title="12_BB_Position", color=color.aqua, linewidth=1)
plot(kc_position, title="13_KC_Position", color=color.olive, linewidth=1)
plot(std_dev_pct, title="14_StdDev_Pct", color=color.silver, linewidth=1)
plot(bb_width, title="15_BB_Width", color=color.gray, linewidth=1)
// Plot volume indicators
plot(vroc, title="16_VROC", color=color.blue, linewidth=1)
plot(eom_sma, title="17_EOM", color=color.red, linewidth=1)
plot(vol_osc, title="18_Vol_Osc", color=color.green, linewidth=1)
plot(force_index_sma, title="19_Force_Index", color=color.orange, linewidth=1)
plot(obv, title="20_OBV", color=color.purple, linewidth=1)
// Plot additional oscillators
plot(ao, title="21_Awesome_Osc", color=color.navy, linewidth=1)
plot(cmo, title="22_CMO", color=color.maroon, linewidth=1)
plot(dpo, title="23_DPO", color=color.teal, linewidth=1)
plot(trix, title="24_TRIX", color=color.lime, linewidth=1)
plot(fisher, title="25_Fisher", color=color.fuchsia, linewidth=1)
// Plot more momentum indicators
plot(mfi_centered, title="26_MFI_Centered", color=color.yellow, linewidth=1)
plot(ac, title="27_AC", color=color.aqua, linewidth=1)
plot(ppo_pct, title="28_PPO_Pct", color=color.olive, linewidth=1)
plot(stoch_rsi_centered, title="29_StochRSI_Centered", color=color.silver, linewidth=1)
plot(klinger, title="30_Klinger", color=color.gray, linewidth=1)
// Plot trend continuation
plot(tii, title="31_TII", color=color.blue, linewidth=1)
plot(ichimoku_signal, title="32_Ichimoku_Signal", color=color.red, linewidth=1)
plot(mama_momentum, title="33_MAMA_Momentum", color=color.green, linewidth=1)
plot(zlema_momentum, title="34_ZLEMA_Momentum", color=color.orange, linewidth=1)
plot(bop, title="35_BOP", color=color.purple, linewidth=1)
// Plot volume continuation
plot(nvi, title="36_NVI", color=color.navy, linewidth=1)
plot(pvi, title="37_PVI", color=color.maroon, linewidth=1)
plot(momentum_pct, title="38_Momentum_Pct", color=color.teal, linewidth=1)
plot(roc, title="39_ROC", color=color.lime, linewidth=1)
plot(rvi, title="40_RVI", color=color.fuchsia, linewidth=1)
// Plot volatility continuation
plot(dc_position, title="41_DC_Position", color=color.yellow, linewidth=1)
plot(rvi_volatility, title="42_RVI_Volatility", color=color.aqua, linewidth=1)
plot(hv, title="43_Historical_Vol", color=color.olive, linewidth=1)
plot(gk_volatility, title="44_GK_Volatility", color=color.silver, linewidth=1)
plot(parkinson, title="45_Parkinson_Vol", color=color.gray, linewidth=1)
// Plot final oscillators
plot(rogers_satchell, title="46_RS_Volatility", color=color.blue, linewidth=1)
plot(elder_power, title="47_Elder_Power", color=color.red, linewidth=1)
plot(stc, title="48_STC", color=color.green, linewidth=1)
plot(coppock, title="49_Coppock", color=color.orange, linewidth=1)
plot(kst, title="50_KST", color=color.purple, linewidth=1)
// Plot final indicators
plot(ppo_histogram, title="51_PPO_Histogram", color=color.navy, linewidth=1)
plot(pvt, title="52_PVT", color=color.maroon, linewidth=1)
// |----- Reference Lines -----| //
hline(0, "Zero Line", color=color.gray, linestyle=hline.style_dashed, linewidth=1)
hline(50, "Midline", color=color.gray, linestyle=hline.style_dotted, linewidth=1)
hline(-50, "Lower Midline", color=color.gray, linestyle=hline.style_dotted, linewidth=1)
hline(25, "Upper Threshold", color=color.gray, linestyle=hline.style_dotted, linewidth=1)
hline(-25, "Lower Threshold", color=color.gray, linestyle=hline.style_dotted, linewidth=1)
// |----- Enhanced Information Table -----| //
if show_table and barstate.islast
table_position = position.top_right
table_text_size = table_size == "Tiny" ? size.tiny : table_size == "Small" ? size.small : size.normal
var table info_table = table.new(table_position, 3, 18, bgcolor=color.new(color.white, 85), border_width=1, border_color=color.gray)
// Headers
table.cell(info_table, 0, 0, 'Category', text_color=color.black, text_size=table_text_size, bgcolor=color.new(color.blue, 70))
table.cell(info_table, 1, 0, 'Indicator', text_color=color.black, text_size=table_text_size, bgcolor=color.new(color.blue, 70))
table.cell(info_table, 2, 0, 'Value', text_color=color.black, text_size=table_text_size, bgcolor=color.new(color.blue, 70))
// Key Momentum Indicators
table.cell(info_table, 0, 1, 'MOMENTUM', text_color=color.purple, text_size=table_text_size, bgcolor=color.new(color.purple, 90))
table.cell(info_table, 1, 1, 'RSI Centered', text_color=color.purple, text_size=table_text_size)
table.cell(info_table, 2, 1, str.tostring(rsi_centered, '0.00'), text_color=color.purple, text_size=table_text_size)
table.cell(info_table, 0, 2, '', text_color=color.blue, text_size=table_text_size)
table.cell(info_table, 1, 2, 'Stoch Centered', text_color=color.blue, text_size=table_text_size)
table.cell(info_table, 2, 2, str.tostring(stoch_centered, '0.00'), text_color=color.blue, text_size=table_text_size)
table.cell(info_table, 0, 3, '', text_color=color.red, text_size=table_text_size)
table.cell(info_table, 1, 3, 'Williams %R', text_color=color.red, text_size=table_text_size)
table.cell(info_table, 2, 3, str.tostring(williams_r, '0.00'), text_color=color.red, text_size=table_text_size)
table.cell(info_table, 0, 4, '', text_color=color.orange, text_size=table_text_size)
table.cell(info_table, 1, 4, 'MACD Histogram', text_color=color.orange, text_size=table_text_size)
table.cell(info_table, 2, 4, str.tostring(macd_histogram, '0.000'), text_color=color.orange, text_size=table_text_size)
table.cell(info_table, 0, 5, '', text_color=color.green, text_size=table_text_size)
table.cell(info_table, 1, 5, 'CCI', text_color=color.green, text_size=table_text_size)
table.cell(info_table, 2, 5, str.tostring(cci, '0.00'), text_color=color.green, text_size=table_text_size)
// Key Trend Indicators
table.cell(info_table, 0, 6, 'TREND', text_color=color.navy, text_size=table_text_size, bgcolor=color.new(color.navy, 90))
table.cell(info_table, 1, 6, 'SMA Momentum %', text_color=color.navy, text_size=table_text_size)
table.cell(info_table, 2, 6, str.tostring(sma_momentum, '0.00'), text_color=color.navy, text_size=table_text_size)
table.cell(info_table, 0, 7, '', text_color=color.maroon, text_size=table_text_size)
table.cell(info_table, 1, 7, 'EMA Momentum %', text_color=color.maroon, text_size=table_text_size)
table.cell(info_table, 2, 7, str.tostring(ema_momentum, '0.00'), text_color=color.maroon, text_size=table_text_size)
table.cell(info_table, 0, 8, '', text_color=color.teal, text_size=table_text_size)
table.cell(info_table, 1, 8, 'SAR Trend', text_color=color.teal, text_size=table_text_size)
table.cell(info_table, 2, 8, str.tostring(sar_trend, '0'), text_color=color.teal, text_size=table_text_size)
table.cell(info_table, 0, 9, '', text_color=color.lime, text_size=table_text_size)
table.cell(info_table, 1, 9, 'Linear Regression', text_color=color.lime, text_size=table_text_size)
table.cell(info_table, 2, 9, str.tostring(lr_slope, '0.000'), text_color=color.lime, text_size=table_text_size)
// Key Volatility Indicators
table.cell(info_table, 0, 10, 'VOLATILITY', text_color=color.yellow, text_size=table_text_size, bgcolor=color.new(color.yellow, 90))
table.cell(info_table, 1, 10, 'ATR %', text_color=color.yellow, text_size=table_text_size)
table.cell(info_table, 2, 10, str.tostring(atr_pct, '0.00'), text_color=color.yellow, text_size=table_text_size)
table.cell(info_table, 0, 11, '', text_color=color.aqua, text_size=table_text_size)
table.cell(info_table, 1, 11, 'BB Position', text_color=color.aqua, text_size=table_text_size)
table.cell(info_table, 2, 11, str.tostring(bb_position, '0.00'), text_color=color.aqua, text_size=table_text_size)
table.cell(info_table, 0, 12, '', text_color=color.olive, text_size=table_text_size)
table.cell(info_table, 1, 12, 'KC Position', text_color=color.olive, text_size=table_text_size)
table.cell(info_table, 2, 12, str.tostring(kc_position, '0.00'), text_color=color.olive, text_size=table_text_size)
// Key Volume Indicators
table.cell(info_table, 0, 13, 'VOLUME', text_color=color.blue, text_size=table_text_size, bgcolor=color.new(color.blue, 90))
table.cell(info_table, 1, 13, 'Volume ROC', text_color=color.blue, text_size=table_text_size)
table.cell(info_table, 2, 13, str.tostring(vroc, '0.00'), text_color=color.blue, text_size=table_text_size)
table.cell(info_table, 0, 14, '', text_color=color.red, text_size=table_text_size)
table.cell(info_table, 1, 14, 'EOM', text_color=color.red, text_size=table_text_size)
table.cell(info_table, 2, 14, str.tostring(eom_sma, '0.000'), text_color=color.red, text_size=table_text_size)
// Key Oscillators
table.cell(info_table, 0, 15, 'OSCILLATORS', text_color=color.purple, text_size=table_text_size, bgcolor=color.new(color.purple, 90))
table.cell(info_table, 1, 15, 'Awesome Osc', text_color=color.blue, text_size=table_text_size)
table.cell(info_table, 2, 15, str.tostring(ao, '0.000'), text_color=color.blue, text_size=table_text_size)
table.cell(info_table, 0, 16, '', text_color=color.red, text_size=table_text_size)
table.cell(info_table, 1, 16, 'Fisher Transform', text_color=color.red, text_size=table_text_size)
table.cell(info_table, 2, 16, str.tostring(fisher, '0.000'), text_color=color.red, text_size=table_text_size)
// Summary Statistics
table.cell(info_table, 0, 17, 'SUMMARY', text_color=color.black, text_size=table_text_size, bgcolor=color.new(color.gray, 70))
table.cell(info_table, 1, 17, 'Total Indicators: 52', text_color=color.black, text_size=table_text_size)
regime_color = rsi_centered > 10 ? color.green : rsi_centered < -10 ? color.red : color.gray
regime_text = rsi_centered > 10 ? "BULLISH" : rsi_centered < -10 ? "BEARISH" : "NEUTRAL"
table.cell(info_table, 2, 17, regime_text, text_color=regime_color, text_size=table_text_size)
This makes it the perfect “indicator backbone” for quantitative and systematic traders who want to prototype, combine, and test new regime detection models—especially in combination with the Markov Chain indicator.
How to use this script with the Markov Chain for research and backtesting:
Add the Enhanced Indicator Export to your chart.
Every calculated indicator is available as an individual data stream.
Connect the indicator(s) you want as custom input(s) to the Markov Chain’s “Custom Indicators” option.
In the Markov Chain indicator’s settings, turn ON the custom indicator mode.
For each of the three custom indicator inputs, select the exported plot from the Enhanced Export script—the menu lists all 45+ signals by name.
This creates a powerful, modular regime-detection engine where you can mix-and-match momentum, trend, volume, or custom combinations for advanced filtering.
Backtest regime logic directly.
Once you’ve connected your chosen indicators, the Markov Chain script performs regime detection (Bull/Neutral/Bear) based on your selected features—not just price returns.
The regime detection is robust, automatically normalized (using Z-score), and outputs bias (1, -1, 0) for plug-and-play integration.
Export the regime bias for programmatic use.
As described above, use input.source() in your Pine Script strategy or system and link the bias output.
You can now filter signals, control trade direction/size, or design pairs-trading that respect true, indicator-driven market regimes.
With this framework, you’re not limited to static or simplistic regime filters. You can rigorously define, test, and refine what “market regime” means for your strategies—using the technical features that matter most to you.
Optimize your signal generation by backtesting across a universe of meaningful indicator blends.
Enhance risk management with objective, real-time regime boundaries.
Accelerate your research: iterate quickly, swap indicator components, and see results with minimal code changes.
Automate multi-asset or pairs-trading by integrating regime context directly into strategy logic.
Add both scripts to your chart, connect your preferred features, and start investigating your best regime-based trades—entirely within the TradingView ecosystem.
References & Further Reading
Ang, A., & Bekaert, G. (2002). “Regime Switches in Interest Rates.” Journal of Business & Economic Statistics, 20(2), 163–182.
Hamilton, J. D. (1989). “A New Approach to the Economic Analysis of Nonstationary Time Series and the Business Cycle.” Econometrica, 57(2), 357–384.
Markov, A. A. (1906). "Extension of the Limit Theorems of Probability Theory to a Sum of Variables Connected in a Chain." The Notes of the Imperial Academy of Sciences of St. Petersburg.
Guidolin, M., & Timmermann, A. (2007). “Asset Allocation under Multivariate Regime Switching.” Journal of Economic Dynamics and Control, 31(11), 3503–3544.
Murphy, J. J. (1999). Technical Analysis of the Financial Markets. New York Institute of Finance.
Brock, W., Lakonishok, J., & LeBaron, B. (1992). “Simple Technical Trading Rules and the Stochastic Properties of Stock Returns.” Journal of Finance, 47(5), 1731–1764.
Zucchini, W., MacDonald, I. L., & Langrock, R. (2017). Hidden Markov Models for Time Series: An Introduction Using R (2nd ed.). Chapman and Hall/CRC.
On Quantitative Finance and Markov Models:
Lo, A. W., & Hasanhodzic, J. (2009). The Heretics of Finance: Conversations with Leading Practitioners of Technical Analysis. Bloomberg Press.
Patterson, S. (2016). The Man Who Solved the Market: How Jim Simons Launched the Quant Revolution. Penguin Press.
TradingView Pine Script Documentation: www.tradingview.com
TradingView Blog: “Use an Input From Another Indicator With Your Strategy” www.tradingview.com
GeeksforGeeks: “What is the Difference Between Markov Chains and Hidden Markov Models?” www.geeksforgeeks.org
What makes this indicator original and unique?
- On‑chart, real‑time Markov. The chain is drawn directly on your chart. You see the current regime, its tendency to stay (self‑loop), and the usual next step (arrows) as bars confirm.
- Source‑agnostic by design. The engine runs on any series you select via input.source() — price, your own oscillator, a composite score, anything you compute in the script.
- Automatic normalization + regime mapping. Different inputs live on different scales. The script standardizes your chosen source and maps it into clear regimes (e.g., Bull / Bear / Neutral) without you micromanaging thresholds each time.
- Rolling, bar‑by‑bar learning. Transition tendencies are computed from a rolling window of confirmed bars. What you see is exactly what the market did in that window.
- Fast experimentation. Switch the source, adjust the window, and the Markov view updates instantly. It’s a rapid way to test ideas and feel regime persistence/switch behavior.
Integrate your own signals (using input.source())
- In settings, choose the Source . This is powered by input.source() .
- Feed it price, an indicator you compute inside the script, or a custom composite series.
- The script will automatically normalize that series and process it through the Markov engine, mapping it to regimes and updating the on‑chart spheres/arrows in real time.
Credits:
Deep gratitude to @RicardoSantos for both the foundational Markov chain processing engine and inspiring open-source contributions, which made advanced probabilistic market modeling accessible to the TradingView community.
Special thanks to @Alien_Algorithms for the innovative and visually stunning 3D sphere logic that powers the indicator’s animated, regime-based visualization.
Disclaimer
This tool summarizes recent behavior. It is not financial advice and not a guarantee of future results.

Ray Dalio's All Weather Strategy - Portfolio CalculatorTHE ALL WEATHER STRATEGY INDICATOR: A GUIDE TO RAY DALIO'S LEGENDARY PORTFOLIO APPROACH
Introduction: The Genesis of Financial Resilience
In the sprawling corridors of Bridgewater Associates, the world's largest hedge fund managing over 150 billion dollars in assets, Ray Dalio conceived what would become one of the most influential investment strategies of the modern era. The All Weather Strategy, born from decades of market observation and rigorous backtesting, represents a paradigm shift from traditional portfolio construction methods that have dominated Wall Street since Harry Markowitz's seminal work on Modern Portfolio Theory in 1952.
Unlike conventional approaches that chase returns through market timing or stock picking, the All Weather Strategy embraces a fundamental truth that has humbled countless investors throughout history: nobody can consistently predict the future direction of markets. Instead of fighting this uncertainty, Dalio's approach harnesses it, creating a portfolio designed to perform reasonably well across all economic environments, hence the evocative name "All Weather."
The strategy emerged from Bridgewater's extensive research into economic cycles and asset class behavior, culminating in what Dalio describes as "the Holy Grail of investing" in his bestselling book "Principles" (Dalio, 2017). This Holy Grail isn't about achieving spectacular returns, but rather about achieving consistent, risk-adjusted returns that compound steadily over time, much like the tortoise defeating the hare in Aesop's timeless fable.
HISTORICAL DEVELOPMENT AND EVOLUTION
The All Weather Strategy's origins trace back to the tumultuous economic periods of the 1970s and 1980s, when traditional portfolio construction methods proved inadequate for navigating simultaneous inflation and recession. Raymond Thomas Dalio, born in 1949 in Queens, New York, founded Bridgewater Associates from his Manhattan apartment in 1975, initially focusing on currency and fixed-income consulting for corporate clients.
Dalio's early experiences during the 1970s stagflation period profoundly shaped his investment philosophy. Unlike many of his contemporaries who viewed inflation and deflation as opposing forces, Dalio recognized that both conditions could coexist with either economic growth or contraction, creating four distinct economic environments rather than the traditional two-factor models that dominated academic finance.
The conceptual breakthrough came in the late 1980s when Dalio began systematically analyzing asset class performance across different economic regimes. Working with a small team of researchers, Bridgewater developed sophisticated models that decomposed economic conditions into growth and inflation components, then mapped historical asset class returns against these regimes. This research revealed that traditional portfolio construction, heavily weighted toward stocks and bonds, left investors vulnerable to specific economic scenarios.
The formal All Weather Strategy emerged in 1996 when Bridgewater was approached by a wealthy family seeking a portfolio that could protect their wealth across various economic conditions without requiring active management or market timing. Unlike Bridgewater's flagship Pure Alpha fund, which relied on active trading and leverage, the All Weather approach needed to be completely passive and unleveraged while still providing adequate diversification.
Dalio and his team spent months developing and testing various allocation schemes, ultimately settling on the 30/40/15/7.5/7.5 framework that balances risk contributions rather than dollar amounts. This approach was revolutionary because it focused on risk budgeting—ensuring that no single asset class dominated the portfolio's risk profile—rather than the traditional approach of equal dollar allocations or market-cap weighting.
The strategy's first institutional implementation began in 1996 with a family office client, followed by gradual expansion to other wealthy families and eventually institutional investors. By 2005, Bridgewater was managing over $15 billion in All Weather assets, making it one of the largest systematic strategy implementations in institutional investing.
The 2008 financial crisis provided the ultimate test of the All Weather methodology. While the S&P 500 declined by 37% and many hedge funds suffered double-digit losses, the All Weather strategy generated positive returns, validating Dalio's risk-balancing approach. This performance during extreme market stress attracted significant institutional attention, leading to rapid asset growth in subsequent years.
The strategy's theoretical foundations evolved throughout the 2000s as Bridgewater's research team, led by co-chief investment officers Greg Jensen and Bob Prince, refined the economic framework and incorporated insights from behavioral economics and complexity theory. Their research, published in numerous institutional white papers, demonstrated that traditional portfolio optimization methods consistently underperformed simpler risk-balanced approaches across various time periods and market conditions.
Academic validation came through partnerships with leading business schools and collaboration with prominent economists. The strategy's risk parity principles influenced an entire generation of institutional investors, leading to the creation of numerous risk parity funds managing hundreds of billions in aggregate assets.
In recent years, the democratization of sophisticated financial tools has made All Weather-style investing accessible to individual investors through ETFs and systematic platforms. The availability of high-quality, low-cost ETFs covering each required asset class has eliminated many of the barriers that previously limited sophisticated portfolio construction to institutional investors.
The development of advanced portfolio management software and platforms like TradingView has further democratized access to institutional-quality analytics and implementation tools. The All Weather Strategy Indicator represents the culmination of this trend, providing individual investors with capabilities that previously required teams of portfolio managers and risk analysts.
Understanding the Four Economic Seasons
The All Weather Strategy's theoretical foundation rests on Dalio's observation that all economic environments can be characterized by two primary variables: economic growth and inflation. These variables create four distinct "economic seasons," each favoring different asset classes. Rising growth benefits stocks and commodities, while falling growth favors bonds. Rising inflation helps commodities and inflation-protected securities, while falling inflation benefits nominal bonds and stocks.
This framework, detailed extensively in Bridgewater's research papers from the 1990s, suggests that by holding assets that perform well in each economic season, an investor can create a portfolio that remains resilient regardless of which season unfolds. The elegance lies not in predicting which season will occur, but in being prepared for all of them simultaneously.
Academic research supports this multi-environment approach. Ang and Bekaert (2002) demonstrated that regime changes in economic conditions significantly impact asset returns, while Fama and French (2004) showed that different asset classes exhibit varying sensitivities to economic factors. The All Weather Strategy essentially operationalizes these academic insights into a practical investment framework.
The Original All Weather Allocation: Simplicity Masquerading as Sophistication
The core All Weather portfolio, as implemented by Bridgewater for institutional clients and later adapted for retail investors, maintains a deceptively simple static allocation: 30% stocks, 40% long-term bonds, 15% intermediate-term bonds, 7.5% commodities, and 7.5% Treasury Inflation-Protected Securities (TIPS). This allocation may appear arbitrary to the uninitiated, but each percentage reflects careful consideration of historical volatilities, correlations, and economic sensitivities.
The 30% stock allocation provides growth exposure while limiting the portfolio's overall volatility. Stocks historically deliver superior long-term returns but with significant volatility, as evidenced by the Standard & Poor's 500 Index's average annual return of approximately 10% since 1926, accompanied by standard deviation exceeding 15% (Ibbotson Associates, 2023). By limiting stock exposure to 30%, the portfolio captures much of the equity risk premium while avoiding excessive volatility.
The combined 55% allocation to bonds (40% long-term plus 15% intermediate-term) serves as the portfolio's stabilizing force. Long-term bonds provide substantial interest rate sensitivity, performing well during economic slowdowns when central banks reduce rates. Intermediate-term bonds offer a balance between interest rate sensitivity and reduced duration risk. This bond-heavy allocation reflects Dalio's insight that bonds typically exhibit lower volatility than stocks while providing essential diversification benefits.
The 7.5% commodities allocation addresses inflation protection, as commodity prices typically rise during inflationary periods. Historical analysis by Bodie and Rosansky (1980) demonstrated that commodities provide meaningful diversification benefits and inflation hedging capabilities, though with considerable volatility. The relatively small allocation reflects commodities' high volatility and mixed long-term returns.
Finally, the 7.5% TIPS allocation provides explicit inflation protection through government-backed securities whose principal and interest payments adjust with inflation. Introduced by the U.S. Treasury in 1997, TIPS have proven effective inflation hedges, though they underperform nominal bonds during deflationary periods (Campbell & Viceira, 2001).
Historical Performance: The Evidence Speaks
Analyzing the All Weather Strategy's historical performance reveals both its strengths and limitations. Using monthly return data from 1970 to 2023, spanning over five decades of varying economic conditions, the strategy has delivered compelling risk-adjusted returns while experiencing lower volatility than traditional stock-heavy portfolios.
During this period, the All Weather allocation generated an average annual return of approximately 8.2%, compared to 10.5% for the S&P 500 Index. However, the strategy's annual volatility measured just 9.1%, substantially lower than the S&P 500's 15.8% volatility. This translated to a Sharpe ratio of 0.67 for the All Weather Strategy versus 0.54 for the S&P 500, indicating superior risk-adjusted performance.
More impressively, the strategy's maximum drawdown over this period was 12.3%, occurring during the 2008 financial crisis, compared to the S&P 500's maximum drawdown of 50.9% during the same period. This drawdown mitigation proves crucial for long-term wealth building, as Stein and DeMuth (2003) demonstrated that avoiding large losses significantly impacts compound returns over time.
The strategy performed particularly well during periods of economic stress. During the 1970s stagflation, when stocks and bonds both struggled, the All Weather portfolio's commodity and TIPS allocations provided essential protection. Similarly, during the 2000-2002 dot-com crash and the 2008 financial crisis, the portfolio's bond-heavy allocation cushioned losses while maintaining positive returns in several years when stocks declined significantly.
However, the strategy underperformed during sustained bull markets, particularly the 1990s technology boom and the 2010s post-financial crisis recovery. This underperformance reflects the strategy's conservative nature and diversified approach, which sacrifices potential upside for downside protection. As Dalio frequently emphasizes, the All Weather Strategy prioritizes "not losing money" over "making a lot of money."
Implementing the All Weather Strategy: A Practical Guide
The All Weather Strategy Indicator transforms Dalio's institutional-grade approach into an accessible tool for individual investors. The indicator provides real-time portfolio tracking, rebalancing signals, and performance analytics, eliminating much of the complexity traditionally associated with implementing sophisticated allocation strategies.
To begin implementation, investors must first determine their investable capital. As detailed analysis reveals, the All Weather Strategy requires meaningful capital to implement effectively due to transaction costs, minimum investment requirements, and the need for precise allocations across five different asset classes.
For portfolios below $50,000, the strategy becomes challenging to implement efficiently. Transaction costs consume a disproportionate share of returns, while the inability to purchase fractional shares creates allocation drift. Consider an investor with $25,000 attempting to allocate 7.5% to commodities through the iPath Bloomberg Commodity Index ETF (DJP), currently trading around $25 per share. This allocation targets $1,875, enough for only 75 shares, creating immediate tracking error.
At $50,000, implementation becomes feasible but not optimal. The 30% stock allocation ($15,000) purchases approximately 37 shares of the SPDR S&P 500 ETF (SPY) at current prices around $400 per share. The 40% long-term bond allocation ($20,000) buys 200 shares of the iShares 20+ Year Treasury Bond ETF (TLT) at approximately $100 per share. While workable, these allocations leave significant cash drag and rebalancing challenges.
The optimal minimum for individual implementation appears to be $100,000. At this level, each allocation becomes substantial enough for precise implementation while keeping transaction costs below 0.4% annually. The $30,000 stock allocation, $40,000 long-term bond allocation, $15,000 intermediate-term bond allocation, $7,500 commodity allocation, and $7,500 TIPS allocation each provide sufficient size for effective management.
For investors with $250,000 or more, the strategy implementation approaches institutional quality. Allocation precision improves, transaction costs decline as a percentage of assets, and rebalancing becomes highly efficient. These larger portfolios can also consider adding complexity through international diversification or alternative implementations.
The indicator recommends quarterly rebalancing to balance transaction costs with allocation discipline. Monthly rebalancing increases costs without substantial benefits for most investors, while annual rebalancing allows excessive drift that can meaningfully impact performance. Quarterly rebalancing, typically on the first trading day of each quarter, provides an optimal balance.
Understanding the Indicator's Functionality
The All Weather Strategy Indicator operates as a comprehensive portfolio management system, providing multiple analytical layers that professional money managers typically reserve for institutional clients. This sophisticated tool transforms Ray Dalio's institutional-grade strategy into an accessible platform for individual investors, offering features that rival professional portfolio management software.
The indicator's core architecture consists of several interconnected modules that work seamlessly together to provide complete portfolio oversight. At its foundation lies a real-time portfolio simulation engine that tracks the exact value of each ETF position based on current market prices, eliminating the need for manual calculations or external spreadsheets.
DETAILED INDICATOR COMPONENTS AND FUNCTIONS
Portfolio Configuration Module
The portfolio setup begins with the Portfolio Configuration section, which establishes the fundamental parameters for strategy implementation. The Portfolio Capital input accepts values from $1,000 to $10,000,000, accommodating everyone from beginning investors to institutional clients. This input directly drives all subsequent calculations, determining exact share quantities and portfolio values throughout the implementation period.
The Portfolio Start Date function allows users to specify when they began implementing the All Weather Strategy, creating a clear demarcation point for performance tracking. This feature proves essential for investors who want to track their actual implementation against theoretical performance, providing realistic assessment of strategy effectiveness including timing differences and implementation costs.
Rebalancing Frequency settings offer two options: Monthly and Quarterly. While monthly rebalancing provides more precise allocation control, quarterly rebalancing typically proves more cost-effective for most investors due to reduced transaction costs. The indicator automatically detects the first trading day of each period, ensuring rebalancing occurs at optimal times regardless of weekends, holidays, or market closures.
The Rebalancing Threshold parameter, adjustable from 0.5% to 10%, determines when allocation drift triggers rebalancing recommendations. Conservative settings like 1-2% maintain tight allocation control but increase trading frequency, while wider thresholds like 3-5% reduce trading costs but allow greater allocation drift. This flexibility accommodates different risk tolerances and cost structures.
Visual Display System
The Show All Weather Calculator toggle controls the main dashboard visibility, allowing users to focus on chart visualization when detailed metrics aren't needed. When enabled, this comprehensive dashboard displays current portfolio value, individual ETF allocations, target versus actual weights, rebalancing status, and performance metrics in a professionally formatted table.
Economic Environment Display provides context about current market conditions based on growth and inflation indicators. While simplified compared to Bridgewater's sophisticated regime detection, this feature helps users understand which economic "season" currently prevails and which asset classes should theoretically benefit.
Rebalancing Signals illuminate when portfolio drift exceeds user-defined thresholds, highlighting specific ETFs that require adjustment. These signals use color coding to indicate urgency: green for balanced allocations, yellow for moderate drift, and red for significant deviations requiring immediate attention.
Advanced Label System
The rebalancing label system represents one of the indicator's most innovative features, providing three distinct detail levels to accommodate different user needs and experience levels. The "None" setting displays simple symbols marking portfolio start and rebalancing events without cluttering the chart with text. This minimal approach suits experienced investors who understand the implications of each symbol.
"Basic" label mode shows essential information including portfolio values at each rebalancing point, enabling quick assessment of strategy performance over time. These labels display "START $X" for portfolio initiation and "RBL $Y" for rebalancing events, providing clear performance tracking without overwhelming detail.
"Detailed" labels provide comprehensive trading instructions including exact buy and sell quantities for each ETF. These labels might display "RBL $125,000 BUY 15 SPY SELL 25 TLT BUY 8 IEF NO TRADES DJP SELL 12 SCHP" providing complete implementation guidance. This feature essentially transforms the indicator into a personal portfolio manager, eliminating guesswork about exact trades required.
Professional Color Themes
Eight professionally designed color themes adapt the indicator's appearance to different aesthetic preferences and market analysis styles. The "Gold" theme reflects traditional wealth management aesthetics, while "EdgeTools" provides modern professional appearance. "Behavioral" uses psychologically informed colors that reinforce disciplined decision-making, while "Quant" employs high-contrast combinations favored by quantitative analysts.
"Ocean," "Fire," "Matrix," and "Arctic" themes provide distinctive visual identities for traders who prefer unique chart aesthetics. Each theme automatically adjusts for dark or light mode optimization, ensuring optimal readability across different TradingView configurations.
Real-Time Portfolio Tracking
The portfolio simulation engine continuously tracks five separate ETF positions: SPY for stocks, TLT for long-term bonds, IEF for intermediate-term bonds, DJP for commodities, and SCHP for TIPS. Each position's value updates in real-time based on current market prices, providing instant feedback about portfolio performance and allocation drift.
Current share calculations determine exact holdings based on the most recent rebalancing, while target shares reflect optimal allocation based on current portfolio value. Trade calculations show precisely how many shares to buy or sell during rebalancing, eliminating manual calculations and potential errors.
Performance Analytics Suite
The indicator's performance measurement capabilities rival professional portfolio analysis software. Sharpe ratio calculations incorporate current risk-free rates obtained from Treasury yield data, providing accurate risk-adjusted performance assessment. Volatility measurements use rolling periods to capture changing market conditions while maintaining statistical significance.
Portfolio return calculations track both absolute and relative performance, comparing the All Weather implementation against individual asset classes and benchmark indices. These metrics update continuously, providing real-time assessment of strategy effectiveness and implementation quality.
Data Quality Monitoring
Sophisticated data quality checks ensure reliable indicator operation across different market conditions and potential data interruptions. The system monitors all five ETF price feeds plus economic data sources, providing quality scores that alert users to potential data issues that might affect calculations.
When data quality degrades, the indicator automatically switches to fallback values or alternative data sources, maintaining functionality during temporary market data interruptions. This robust design ensures consistent operation even during volatile market conditions when data feeds occasionally experience disruptions.
Risk Management and Behavioral Considerations
Despite its sophisticated design, the All Weather Strategy faces behavioral challenges that have derailed countless well-intentioned investment plans. The strategy's conservative nature means it will underperform growth stocks during bull markets, potentially by substantial margins. Maintaining discipline during these periods requires understanding that the strategy optimizes for risk-adjusted returns over absolute returns.
Behavioral finance research by Kahneman and Tversky (1979) demonstrates that investors feel losses approximately twice as intensely as equivalent gains. This loss aversion creates powerful psychological pressure to abandon defensive strategies during bull markets when aggressive portfolios appear more attractive. The All Weather Strategy's bond-heavy allocation will seem overly conservative when technology stocks double in value, as occurred repeatedly during the 2010s.
Conversely, the strategy's defensive characteristics provide psychological comfort during market stress. When stocks crash 30-50%, as they periodically do, the All Weather portfolio's modest losses feel manageable rather than catastrophic. This emotional stability enables investors to maintain their investment discipline when others capitulate, often at the worst possible times.
Rebalancing discipline presents another behavioral challenge. Selling winners to buy losers contradicts natural human tendencies but remains essential for the strategy's success. When stocks have outperformed bonds for several quarters, rebalancing requires selling high-performing stock positions to purchase seemingly stagnant bond positions. This action feels counterintuitive but captures the strategy's systematic approach to risk management.
Tax considerations add complexity for taxable accounts. Frequent rebalancing generates taxable events that can erode after-tax returns, particularly for high-income investors facing elevated capital gains rates. Tax-advantaged accounts like 401(k)s and IRAs provide ideal vehicles for All Weather implementation, eliminating tax friction from rebalancing activities.
Capital Requirements and Cost Analysis
Comprehensive cost analysis reveals the capital requirements for effective All Weather implementation. Annual expenses include management fees for each ETF, transaction costs from rebalancing, and bid-ask spreads from trading less liquid securities.
ETF expense ratios vary significantly across asset classes. The SPDR S&P 500 ETF charges 0.09% annually, while the iShares 20+ Year Treasury Bond ETF charges 0.20%. The iShares 7-10 Year Treasury Bond ETF charges 0.15%, the Schwab US TIPS ETF charges 0.05%, and the iPath Bloomberg Commodity Index ETF charges 0.75%. Weighted by the All Weather allocations, total expense ratios average approximately 0.19% annually.
Transaction costs depend heavily on broker selection and account size. Premium brokers like Interactive Brokers charge $1-2 per trade, resulting in $20-40 annually for quarterly rebalancing. Discount brokers may charge higher per-trade fees but offer commission-free ETF trading for selected funds. Zero-commission brokers eliminate explicit trading costs but often impose wider bid-ask spreads that function as hidden fees.
Bid-ask spreads represent the difference between buying and selling prices for each security. Highly liquid ETFs like SPY maintain spreads of 1-2 basis points, while less liquid commodity ETFs may exhibit spreads of 5-10 basis points. These costs accumulate through rebalancing activities, typically totaling 10-15 basis points annually.
For a $100,000 portfolio, total annual costs including expense ratios, transaction fees, and spreads typically range from 0.35% to 0.45%, or $350-450 annually. These costs decline as a percentage of assets as portfolio size increases, reaching approximately 0.25% for portfolios exceeding $250,000.
Comparing costs to potential benefits reveals the strategy's value proposition. Historical analysis suggests the All Weather approach reduces portfolio volatility by 35-40% compared to stock-heavy allocations while maintaining competitive returns. This volatility reduction provides substantial value during market stress, potentially preventing behavioral mistakes that destroy long-term wealth.
Alternative Implementations and Customizations
While the original All Weather allocation provides an excellent starting point, investors may consider modifications based on personal circumstances, market conditions, or geographic considerations. International diversification represents one potential enhancement, adding exposure to developed and emerging market bonds and equities.
Geographic customization becomes important for non-US investors. European investors might replace US Treasury bonds with German Bunds or broader European government bond indices. Currency hedging decisions add complexity but may reduce volatility for investors whose spending occurs in non-dollar currencies.
Tax-location strategies optimize after-tax returns by placing tax-inefficient assets in tax-advantaged accounts while holding tax-efficient assets in taxable accounts. TIPS and commodity ETFs generate ordinary income taxed at higher rates, making them candidates for retirement account placement. Stock ETFs generate qualified dividends and long-term capital gains taxed at lower rates, making them suitable for taxable accounts.
Some investors prefer implementing the bond allocation through individual Treasury securities rather than ETFs, eliminating management fees while gaining precise maturity control. Treasury auctions provide access to new securities without bid-ask spreads, though this approach requires more sophisticated portfolio management.
Factor-based implementations replace broad market ETFs with factor-tilted alternatives. Value-tilted stock ETFs, quality-focused bond ETFs, or momentum-based commodity indices may enhance returns while maintaining the All Weather framework's diversification benefits. However, these modifications introduce additional complexity and potential tracking error.
Conclusion: Embracing the Long Game
The All Weather Strategy represents more than an investment approach; it embodies a philosophy of financial resilience that prioritizes sustainable wealth building over speculative gains. In an investment landscape increasingly dominated by algorithmic trading, meme stocks, and cryptocurrency volatility, Dalio's methodical approach offers a refreshing alternative grounded in economic theory and historical evidence.
The strategy's greatest strength lies not in its potential for extraordinary returns, but in its capacity to deliver reasonable returns across diverse economic environments while protecting capital during market stress. This characteristic becomes increasingly valuable as investors approach or enter retirement, when portfolio preservation assumes greater importance than aggressive growth.
Implementation requires discipline, adequate capital, and realistic expectations. The strategy will underperform growth-oriented approaches during bull markets while providing superior downside protection during bear markets. Investors must embrace this trade-off consciously, understanding that the strategy optimizes for long-term wealth building rather than short-term performance.
The All Weather Strategy Indicator democratizes access to institutional-quality portfolio management, providing individual investors with tools previously available only to wealthy families and institutions. By automating allocation tracking, rebalancing signals, and performance analysis, the indicator removes much of the complexity that has historically limited sophisticated strategy implementation.
For investors seeking a systematic, evidence-based approach to long-term wealth building, the All Weather Strategy provides a compelling framework. Its emphasis on diversification, risk management, and behavioral discipline aligns with the fundamental principles that have created lasting wealth throughout financial history. While the strategy may not generate headlines or inspire cocktail party conversations, it offers something more valuable: a reliable path toward financial security across all economic seasons.
As Dalio himself notes, "The biggest mistake investors make is to believe that what happened in the recent past is likely to persist, and they design their portfolios accordingly." The All Weather Strategy's enduring appeal lies in its rejection of this recency bias, instead embracing the uncertainty of markets while positioning for success regardless of which economic season unfolds.
STEP-BY-STEP INDICATOR SETUP GUIDE
Setting up the All Weather Strategy Indicator requires careful attention to each configuration parameter to ensure optimal implementation. This comprehensive setup guide walks through every setting and explains its impact on strategy performance.
Initial Setup Process
Begin by adding the indicator to your TradingView chart. Search for "Ray Dalio's All Weather Strategy" in the indicator library and apply it to any chart. The indicator operates independently of the underlying chart symbol, drawing data directly from the five required ETFs regardless of which security appears on the chart.
Portfolio Configuration Settings
Start with the Portfolio Capital input, which drives all subsequent calculations. Enter your exact investable capital, ranging from $1,000 to $10,000,000. This input determines share quantities, trade recommendations, and performance calculations. Conservative recommendations suggest minimum capitals of $50,000 for basic implementation or $100,000 for optimal precision.
Select your Portfolio Start Date carefully, as this establishes the baseline for all performance calculations. Choose the date when you actually began implementing the All Weather Strategy, not when you first learned about it. This date should reflect when you first purchased ETFs according to the target allocation, creating realistic performance tracking.
Choose your Rebalancing Frequency based on your cost structure and precision preferences. Monthly rebalancing provides tighter allocation control but increases transaction costs. Quarterly rebalancing offers the optimal balance for most investors between allocation precision and cost control. The indicator automatically detects appropriate trading days regardless of your selection.
Set the Rebalancing Threshold based on your tolerance for allocation drift and transaction costs. Conservative investors preferring tight control should use 1-2% thresholds, while cost-conscious investors may prefer 3-5% thresholds. Lower thresholds maintain more precise allocations but trigger more frequent trading.
Display Configuration Options
Enable Show All Weather Calculator to display the comprehensive dashboard containing portfolio values, allocations, and performance metrics. This dashboard provides essential information for portfolio management and should remain enabled for most users.
Show Economic Environment displays current economic regime classification based on growth and inflation indicators. While simplified compared to Bridgewater's sophisticated models, this feature provides useful context for understanding current market conditions.
Show Rebalancing Signals highlights when portfolio allocations drift beyond your threshold settings. These signals use color coding to indicate urgency levels, helping prioritize rebalancing activities.
Advanced Label Customization
Configure Show Rebalancing Labels based on your need for chart annotations. These labels mark important portfolio events and can provide valuable historical context, though they may clutter charts during extended time periods.
Select appropriate Label Detail Levels based on your experience and information needs. "None" provides minimal symbols suitable for experienced users. "Basic" shows portfolio values at key events. "Detailed" provides complete trading instructions including exact share quantities for each ETF.
Appearance Customization
Choose Color Themes based on your aesthetic preferences and trading style. "Gold" reflects traditional wealth management appearance, while "EdgeTools" provides modern professional styling. "Behavioral" uses psychologically informed colors that reinforce disciplined decision-making.
Enable Dark Mode Optimization if using TradingView's dark theme for optimal readability and contrast. This setting automatically adjusts all colors and transparency levels for the selected theme.
Set Main Line Width based on your chart resolution and visual preferences. Higher width values provide clearer allocation lines but may overwhelm smaller charts. Most users prefer width settings of 2-3 for optimal visibility.
Troubleshooting Common Setup Issues
If the indicator displays "Data not available" messages, verify that all five ETFs (SPY, TLT, IEF, DJP, SCHP) have valid price data on your selected timeframe. The indicator requires daily data availability for all components.
When rebalancing signals seem inconsistent, check your threshold settings and ensure sufficient time has passed since the last rebalancing event. The indicator only triggers signals on designated rebalancing days (first trading day of each period) when drift exceeds threshold levels.
If labels appear at unexpected chart locations, verify that your chart displays percentage values rather than price values. The indicator forces percentage formatting and 0-40% scaling for optimal allocation visualization.
COMPREHENSIVE BIBLIOGRAPHY AND FURTHER READING
PRIMARY SOURCES AND RAY DALIO WORKS
Dalio, R. (2017). Principles: Life and work. New York: Simon & Schuster.
Dalio, R. (2018). A template for understanding big debt crises. Bridgewater Associates.
Dalio, R. (2021). Principles for dealing with the changing world order: Why nations succeed and fail. New York: Simon & Schuster.
BRIDGEWATER ASSOCIATES RESEARCH PAPERS
Jensen, G., Kertesz, A. & Prince, B. (2010). All Weather strategy: Bridgewater's approach to portfolio construction. Bridgewater Associates Research.
Prince, B. (2011). An in-depth look at the investment logic behind the All Weather strategy. Bridgewater Associates Daily Observations.
Bridgewater Associates. (2015). Risk parity in the context of larger portfolio construction. Institutional Research.
ACADEMIC RESEARCH ON RISK PARITY AND PORTFOLIO CONSTRUCTION
Ang, A. & Bekaert, G. (2002). International asset allocation with regime shifts. The Review of Financial Studies, 15(4), 1137-1187.
Bodie, Z. & Rosansky, V. I. (1980). Risk and return in commodity futures. Financial Analysts Journal, 36(3), 27-39.
Campbell, J. Y. & Viceira, L. M. (2001). Who should buy long-term bonds? American Economic Review, 91(1), 99-127.
Clarke, R., De Silva, H. & Thorley, S. (2013). Risk parity, maximum diversification, and minimum variance: An analytic perspective. Journal of Portfolio Management, 39(3), 39-53.
Fama, E. F. & French, K. R. (2004). The capital asset pricing model: Theory and evidence. Journal of Economic Perspectives, 18(3), 25-46.
BEHAVIORAL FINANCE AND IMPLEMENTATION CHALLENGES
Kahneman, D. & Tversky, A. (1979). Prospect theory: An analysis of decision under risk. Econometrica, 47(2), 263-292.
Thaler, R. H. & Sunstein, C. R. (2008). Nudge: Improving decisions about health, wealth, and happiness. New Haven: Yale University Press.
Montier, J. (2007). Behavioural investing: A practitioner's guide to applying behavioural finance. Chichester: John Wiley & Sons.
MODERN PORTFOLIO THEORY AND QUANTITATIVE METHODS
Markowitz, H. (1952). Portfolio selection. The Journal of Finance, 7(1), 77-91.
Sharpe, W. F. (1964). Capital asset prices: A theory of market equilibrium under conditions of risk. The Journal of Finance, 19(3), 425-442.
Black, F. & Litterman, R. (1992). Global portfolio optimization. Financial Analysts Journal, 48(5), 28-43.
PRACTICAL IMPLEMENTATION AND ETF ANALYSIS
Gastineau, G. L. (2010). The exchange-traded funds manual. 2nd ed. Hoboken: John Wiley & Sons.
Poterba, J. M. & Shoven, J. B. (2002). Exchange-traded funds: A new investment option for taxable investors. American Economic Review, 92(2), 422-427.
Israelsen, C. L. (2005). A refinement to the Sharpe ratio and information ratio. Journal of Asset Management, 5(6), 423-427.
ECONOMIC CYCLE ANALYSIS AND ASSET CLASS RESEARCH
Ilmanen, A. (2011). Expected returns: An investor's guide to harvesting market rewards. Chichester: John Wiley & Sons.
Swensen, D. F. (2009). Pioneering portfolio management: An unconventional approach to institutional investment. Rev. ed. New York: Free Press.
Siegel, J. J. (2014). Stocks for the long run: The definitive guide to financial market returns & long-term investment strategies. 5th ed. New York: McGraw-Hill Education.
RISK MANAGEMENT AND ALTERNATIVE STRATEGIES
Taleb, N. N. (2007). The black swan: The impact of the highly improbable. New York: Random House.
Lowenstein, R. (2000). When genius failed: The rise and fall of Long-Term Capital Management. New York: Random House.
Stein, D. M. & DeMuth, P. (2003). Systematic withdrawal from retirement portfolios: The impact of asset allocation decisions on portfolio longevity. AAII Journal, 25(7), 8-12.
CONTEMPORARY DEVELOPMENTS AND FUTURE DIRECTIONS
Asness, C. S., Frazzini, A. & Pedersen, L. H. (2012). Leverage aversion and risk parity. Financial Analysts Journal, 68(1), 47-59.
Roncalli, T. (2013). Introduction to risk parity and budgeting. Boca Raton: CRC Press.
Ibbotson Associates. (2023). Stocks, bonds, bills, and inflation 2023 yearbook. Chicago: Morningstar.
PERIODICALS AND ONGOING RESEARCH
Journal of Portfolio Management - Quarterly publication featuring cutting-edge research on portfolio construction and risk management
Financial Analysts Journal - Bi-monthly publication of the CFA Institute with practical investment research
Bridgewater Associates Daily Observations - Regular market commentary and research from the creators of the All Weather Strategy
RECOMMENDED READING SEQUENCE
For investors new to the All Weather Strategy, begin with Dalio's "Principles" for philosophical foundation, then proceed to the Bridgewater research papers for technical details. Supplement with Markowitz's original portfolio theory work and behavioral finance literature from Kahneman and Tversky.
Intermediate students should focus on academic papers by Ang & Bekaert on regime shifts, Clarke et al. on risk parity methods, and Ilmanen's comprehensive analysis of expected returns across asset classes.
Advanced practitioners will benefit from Roncalli's technical treatment of risk parity mathematics, Asness et al.'s academic critique of leverage aversion, and ongoing research in the Journal of Portfolio Management.

Andean • Dot Watcher (Exact Math + Optional Alerts)Title: Andean • Dot Watcher (1m + 1000T Alerts)
Description:
The Andean • Dot Watcher is a precision trend-detection tool that plots Bull and Bear “dot” signals for both the 1-minute chart and the 1000-tick chart — all in one indicator. It’s designed for traders who want early confirmation from tick data while also monitoring a traditional time-based chart for added confluence.
Key Features:
Dual-Timeframe Signals – Plots and alerts for both 1m and 1000T chart conditions.
Bull Dots – Green markers indicating bullish dominance or trigger events.
Bear Dots – Red markers indicating bearish dominance or trigger events.
Customizable Dot Mode – Choose between continuous dominance, flip-only signals, or crossover conditions.
Real-Time Alerts – Built-in TradingView alerts for:
1m Bull / 1m Bear signals
1000T Bull / 1000T Bear signals
Alert Flexibility – Users can set alerts for either timeframe independently or combine them for confirmation setups.
Usage Tips:
For fastest reaction, combine 1000T dots with 1-minute dots as a confirmation filter.
If your TradingView plan does not include tick charts, you can still use the 1-minute signals without issue.
Works best when combined with your existing trade plan for entries, exits, and risk management.
Requirements:
1-minute chart signals work on any TradingView plan (including Basic).
1000T tick chart signals require a TradingView plan that supports tick charts.
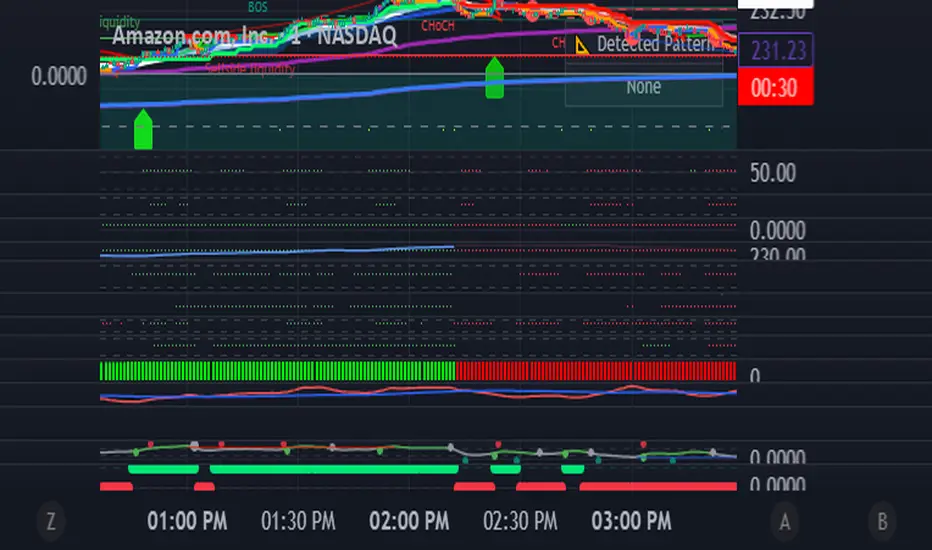
Ichimoku Cloud Signals [sgbpulse] Ichimoku Cloud Signals – Your Advanced Trading Tool
Meet Ichimoku Cloud Signals, the enhanced and interactive version of the classic Ichimoku Cloud indicator, designed specifically for TradingView traders seeking precision and flexibility in their trading decisions. This indicator allows you to maximize the Ichimoku's potential by customizing trend criteria, receiving clear visual signals for entering and exiting positions, and getting alerts to keep you informed.
Introduction to the Ichimoku Cloud
The Ichimoku Cloud, also known as Ichimoku Kinko Hyo, is a comprehensive technical analysis tool developed in Japan. It provides a broad view of the market: trend direction, momentum, and support and resistance levels. "Ichimoku Cloud Signals" takes this power and amplifies it with advanced features.
Key Components of the Ichimoku Cloud
The indicator displays all five familiar Ichimoku lines, along with the "Cloud" (Kumo):
Tenkan-sen (Conversion Line): Calculated as the average of the highest high and lowest low over the past 9 periods. A fast, short-term indicator used as a measure of immediate momentum.
Kijun-sen (Base Line): Calculated as the average of the highest high and lowest low over the past 26 periods. A medium-term reference line serving as a significant support/resistance level.
Senkou Span A (Leading Span A): The average of the Tenkan-sen and Kijun-sen, shifted 26 periods forward into the future.
Senkou Span B (Leading Span B): The average of the highest high and lowest low over the past 52 periods, also shifted 26 periods forward into the future.
Kumo (Cloud): The area between Senkou Span A and Senkou Span B. Its color changes: green for an uptrend (when Senkou Span A is above Senkou Span B) and red for a downtrend (when Senkou Span B is above Senkou Span A). The Cloud serves as a dynamic area of support/resistance and a tool for forecasting future trends.
Chikou Span (Lagging Span): The current closing price, shifted 26 periods backward into the past. It serves as a powerful trend confirmation tool.
How the Ichimoku Cloud Works and How to Interpret It
Trend Identification :
- Uptrend (Bullish): The price is above the Cloud. The higher the price is above the Cloud, the stronger the trend.
- Downtrend (Bearish): The price is below the Cloud. The lower the price is below the Cloud, the stronger the trend.
- Range/Consolidation: The price is within the Cloud. This indicates a market without a clear direction or one that is consolidating.
Support and Resistance:
- The Cloud itself acts as a dynamic area of support and resistance. In an uptrend, the Cloud serves as support. In a downtrend, it serves as resistance.
- A thick Cloud indicates stronger support/resistance levels, while a thin Cloud indicates weaker levels.
The Cloud as a Predictive Indicator:
The uniqueness of the Kumo (Cloud) lies in its ability to be shifted 26 periods forward. This part of the Cloud provides forecasts for future support and resistance levels and even suggests expected trend changes (like a "Kumo Twist" – a change in Cloud color), giving you a planning advantage.
Unique Advantages of Ichimoku Cloud Signals:
Ichimoku Cloud Signals takes the classic Ichimoku principles and gives you unprecedented control:
Focused Trend Selection:
Choose whether you want to analyze a bullish (uptrend) or bearish (downtrend) trend. The indicator will focus on the relevant criteria for your selection.
Customizable Trend Confirmation Criteria (8 Criteria):
The indicator relies on 8 key criteria for clear trend confirmation. You can enable or disable each criterion individually based on your trading strategy and desired risk level. Each criterion plays a vital role in confirming the strength of the trend:
- Price position relative to the Cloud (Kumo) (Default: true): Determines the main trend direction and whether it's bullish or bearish.
- Price position relative to Kijun-sen (Base Line) (Default: true): Indicates the medium-term trend and acts as a critical equilibrium level.
- Price position relative to Tenkan-sen (Conversion Line) (Default: false): Provides quick confirmation of current momentum and short-term market changes.
- Tenkan-sen (Conversion Line) / Kijun-sen (Base Line) Crossover (Default: true): A classic signal for momentum change, crucial for identifying entry points.
- Current Cloud trend (Kumo) (Default: false): Cloud color confirms the main trend direction in real-time.
- Projected Future Cloud trend (Kumo) (Default: true): Indicates an expected future change in the Cloud's trend, providing strong visual insight.
- Chikou Span (Lagging Span) position relative to the Cloud (Kumo) (Default: true): Confirms the current trend strength by comparing the price to the Ichimoku 26 periods ago.
- Chikou Span (Lagging Span) position relative to the Price (Default: false): Additional confirmation of trend strength, indicating buyer/seller dominance.
Full Customization of Ichimoku Parameters:
You can change the period lengths for each Ichimoku component, depending on your strategy:
- Conversion Line Length (Default: 9)
- Base Line Length (Default: 26)
- Leading Span Length (Default: 52)
- Cloud Lagging Length (Default: 26)
- Lagging Span Length (Default: 26)
Visual Criteria Table on the Chart:
Get immediate and clear feedback! A visual table is placed on the chart, showing in real-time which of the 8 criteria you have defined are met for your chosen trend. Criteria you have enabled will be highlighted with a blue color and a "➤" symbol, while disabled criteria will appear in a subtle gray shade. For each criterion, the table shows its real-time status with a "✔" symbol if the condition is met and an "✘" symbol if it is not met. This powerful visual tool provides a quick assessment, helps with learning, and allows for strategy optimization at the click of a button.
Precise Criteria Details in the Data Window:
Beyond the visual table, the indicator provides an additional critical layer of detail: for any point on the chart, you can hover over a candle and see in TradingView's Data Window the precise status and values of all eight criteria. For each criterion, you'll see a clear numerical value (1 or 0) indicating whether it's fully met (1) or not met (0). Additionally, you can inspect the exact numerical values of the Ichimoku lines (Tenkan-sen, Kijun-sen, etc.) at that specific moment. This comprehensive data supports in-depth analysis, strategy debugging, and long-term optimization, providing complete transparency regarding every component of the signal.
Smart and Customizable Alerts:
Ichimoku Cloud Signals provides a powerful alert system to keep you informed of key market movements, so you never miss an opportunity. There are eight unique alerts you can enable in TradingView's alert panel:
Uptrend Entry Alert: Triggers when all of your selected criteria for an uptrend are met on a new candle.
Uptrend Exit Alert: Triggers when one of your selected uptrend criteria is no longer met, signaling a potential exit point.
Downtrend Entry Alert: Triggers when all of your selected criteria for a downtrend are met on a new candle.
Downtrend Exit Alert: Triggers when one of your selected downtrend criteria is no longer met, signaling a potential exit point.
Bullish Crossover Alert: Triggers when the Conversion Line (Tenkan-sen) crosses above the Base Line (Kijun-sen), a classic signal for an upward momentum shift.
Bearish Crossover Alert: Triggers when the Conversion Line (Tenkan-sen) crosses below the Base Line (Kijun-sen), signaling a potential shift to downward momentum.
Bullish Cloud Breakout Alert: Triggers when the price closes above the Ichimoku Cloud (Kumo), indicating a strong bullish trend.
Bearish Cloud Breakout Alert: Triggers when the price closes below the Ichimoku Cloud (Kumo), indicating a strong bearish trend.
Each alert can be independently configured in TradingView's alert panel, allowing you to tailor your notifications to fit your exact trading strategy and risk management preferences.
Summary:
Ichimoku Cloud Signals is an essential tool for TradingView traders seeking control, clarity, and precision. It combines the power of the classic Ichimoku Cloud indicator with advanced customization capabilities, a convenient visual table, and clear signals, empowering you to make informed trading decisions and stay focused on managing your positions.
Important Note: Trading Risk
This indicator is intended for educational and informational purposes only and does not constitute investment advice or a recommendation for trading in any form whatsoever.
Trading in financial markets involves significant risk of capital loss. It is important to remember that past performance is not indicative of future results. All trading decisions are your sole responsibility. Never trade with money you cannot afford to lose.

SMC Structures and FVGสวัสดีครับ! ผมจะอธิบายอินดิเคเตอร์ "SMC Structures and FVG + MACD" ที่คุณให้มาอย่างละเอียดในแต่ละส่วน เพื่อให้คุณเข้าใจการทำงานของมันอย่างถ่องแท้ครับ
อินดิเคเตอร์นี้เป็นการผสมผสานแนวคิดของ Smart Money Concept (SMC) ซึ่งเน้นการวิเคราะห์โครงสร้างตลาด (Market Structure) และ Fair Value Gap (FVG) เข้ากับอินดิเคเตอร์ MACD เพื่อใช้เป็นตัวกรองหรือตัวยืนยันสัญญาณ Choch/BoS (Change of Character / Break of Structure)
1. ภาพรวมอินดิเคเตอร์ (Overall Purpose)
อินดิเคเตอร์นี้มีจุดประสงค์หลักคือ:
ระบุโครงสร้างตลาด: ตีเส้นและป้ายกำกับ Choch (Change of Character) และ BoS (Break of Structure) บนกราฟโดยอัตโนมัติ
ผสานการยืนยันด้วย MACD: สัญญาณ Choch/BoS จะถูกพิจารณาก็ต่อเมื่อ MACD Histogram เกิดการตัดขึ้นหรือลง (Zero Cross) ในทิศทางที่สอดคล้องกัน
แสดง Fair Value Gap (FVG): หากเปิดใช้งาน จะมีการตีกล่อง FVG บนกราฟ
แสดงระดับ Fibonacci: คำนวณและแสดงระดับ Fibonacci ที่สำคัญตามโครงสร้างตลาดปัจจุบัน
ปรับตาม Timeframe: การคำนวณและการแสดงผลทั้งหมดจะปรับตาม Timeframe ที่คุณกำลังใช้งานอยู่โดยอัตโนมัติ
2. ส่วนประกอบหลักของโค้ด (Code Breakdown)
โค้ดนี้สามารถแบ่งออกเป็นส่วนหลัก ๆ ได้ดังนี้:
2.1 Inputs (การตั้งค่า)
ส่วนนี้คือตัวแปรที่คุณสามารถปรับแต่งได้ในหน้าต่างการตั้งค่าของอินดิเคเตอร์ (คลิกที่รูปฟันเฟืองข้างชื่ออินดิเคเตอร์บนกราฟ)
MACD Settings (ตั้งค่า MACD):
fast_len: ความยาวของ Fast EMA สำหรับ MACD (ค่าเริ่มต้น 12)
slow_len: ความยาวของ Slow EMA สำหรับ MACD (ค่าเริ่มต้น 26)
signal_len: ความยาวของ Signal Line สำหรับ MACD (ค่าเริ่มต้น 9)
= ta.macd(close, fast_len, slow_len, signal_len): คำนวณค่า MACD Line, Signal Line และ Histogram โดยใช้ราคาปิด (close) และค่าความยาวที่กำหนด
is_bullish_macd_cross: ตรวจสอบว่า MACD Histogram ตัดขึ้นเหนือเส้น 0 (จากค่าลบเป็นบวก)
is_bearish_macd_cross: ตรวจสอบว่า MACD Histogram ตัดลงใต้เส้น 0 (จากค่าบวกเป็นลบ)
Fear Value Gap (FVG) Settings:
isFvgToShow: (Boolean) เปิด/ปิดการแสดง FVG บนกราฟ
bullishFvgColor: สีสำหรับ Bullish FVG
bearishFvgColor: สีสำหรับ Bearish FVG
mitigatedFvgColor: สีสำหรับ FVG ที่ถูก Mitigate (ลดทอน) แล้ว
fvgHistoryNbr: จำนวน FVG ย้อนหลังที่จะแสดง
isMitigatedFvgToReduce: (Boolean) เปิด/ปิดการลดขนาด FVG เมื่อถูก Mitigate
Structures (โครงสร้างตลาด) Settings:
isStructBodyCandleBreak: (Boolean) หากเป็น true การ Break จะต้องเกิดขึ้นด้วย เนื้อเทียน ที่ปิดเหนือ/ใต้ Swing High/Low หากเป็น false แค่ไส้เทียนทะลุก็ถือว่า Break
isCurrentStructToShow: (Boolean) เปิด/ปิดการแสดงเส้นโครงสร้างตลาดปัจจุบัน (เส้นสีน้ำเงินในภาพตัวอย่าง)
pivot_len: ความยาวของแท่งเทียนที่ใช้ในการมองหาจุด Pivot (Swing High/Low) ยิ่งค่าน้อยยิ่งจับ Swing เล็กๆ ได้, ยิ่งค่ามากยิ่งจับ Swing ใหญ่ๆ ได้
bullishBosColor, bearishBosColor: สีสำหรับเส้นและป้าย BOS ขาขึ้น/ขาลง
bosLineStyleOption, bosLineWidth: สไตล์ (Solid, Dotted, Dashed) และความหนาของเส้น BOS
bullishChochColor, bearishChochColor: สีสำหรับเส้นและป้าย CHoCH ขาขึ้น/ขาลง
chochLineStyleOption, chochLineWidth: สไตล์ (Solid, Dotted, Dashed) และความหนาของเส้น CHoCH
currentStructColor, currentStructLineStyleOption, currentStructLineWidth: สี, สไตล์ และความหนาของเส้นโครงสร้างตลาดปัจจุบัน
structHistoryNbr: จำนวนการ Break (Choch/BoS) ย้อนหลังที่จะแสดง
Structure Fibonacci (จากโค้ดต้นฉบับ):
เป็นชุด Input สำหรับเปิด/ปิด, กำหนดค่า, สี, สไตล์ และความหนาของเส้น Fibonacci Levels ต่างๆ (0.786, 0.705, 0.618, 0.5, 0.382) ที่จะถูกคำนวณจากโครงสร้างตลาดปัจจุบัน
2.2 Helper Functions (ฟังก์ชันช่วยทำงาน)
getLineStyle(lineOption): ฟังก์ชันนี้ใช้แปลงค่า String ที่เลือกจาก Input (เช่น "─", "┈", "╌") ให้เป็นรูปแบบ line.style_ ที่ Pine Script เข้าใจ
get_structure_highest_bar(lookback): ฟังก์ชันนี้พยายามหา Bar Index ของแท่งเทียนที่ทำ Swing High ภายในช่วง lookback ที่กำหนด
get_structure_lowest_bar(lookback): ฟังก์ชันนี้พยายามหา Bar Index ของแท่งเทียนที่ทำ Swing Low ภายในช่วง lookback ที่กำหนด
is_structure_high_broken(...): ฟังก์ชันนี้ตรวจสอบว่าราคาปัจจุบันได้ Break เหนือ _structureHigh (Swing High) หรือไม่ โดยพิจารณาจาก _highStructBreakPrice (ราคาปิดหรือราคา High ขึ้นอยู่กับการตั้งค่า isStructBodyCandleBreak)
FVGDraw(...): ฟังก์ชันนี้รับ Arrays ของ FVG Boxes, Types, Mitigation Status และ Labels มาประมวลผล เพื่ออัปเดตสถานะของ FVG (เช่น ถูก Mitigate หรือไม่) และปรับขนาด/ตำแหน่งของ FVG Box และ Label บนกราฟ
2.3 Global Variables (ตัวแปรทั่วทั้งอินดิเคเตอร์)
เป็นตัวแปรที่ประกาศด้วย var ซึ่งหมายความว่าค่าของมันจะถูกเก็บไว้และอัปเดตในแต่ละแท่งเทียน (persists across bars)
structureLines, structureLabels: Arrays สำหรับเก็บอ็อบเจกต์ line และ label ของเส้น Choch/BoS ที่วาดบนกราฟ
fvgBoxes, fvgTypes, fvgLabels, isFvgMitigated: Arrays สำหรับเก็บข้อมูลของ FVG Boxes และสถานะต่างๆ
structureHigh, structureLow: เก็บราคาของ Swing High/Low ที่สำคัญของโครงสร้างตลาดปัจจุบัน
structureHighStartIndex, structureLowStartIndex: เก็บ Bar Index ของจุดเริ่มต้นของ Swing High/Low ที่สำคัญ
structureDirection: เก็บสถานะของทิศทางโครงสร้างตลาด (1 = Bullish, 2 = Bearish, 0 = Undefined)
fiboXPrice, fiboXStartIndex, fiboXLine, fiboXLabel: ตัวแปรสำหรับเก็บข้อมูลและอ็อบเจกต์ของเส้น Fibonacci Levels
isBOSAlert, isCHOCHAlert: (Boolean) ใช้สำหรับส่งสัญญาณ Alert (หากมีการตั้งค่า Alert ไว้)
2.4 FVG Processing (การประมวลผล FVG)
ส่วนนี้จะตรวจสอบเงื่อนไขการเกิด FVG (Bullish FVG: high < low , Bearish FVG: low > high )
หากเกิด FVG และ isFvgToShow เป็น true จะมีการสร้าง box และ label ใหม่เพื่อแสดง FVG บนกราฟ
มีการจัดการ fvgBoxes และ fvgLabels เพื่อจำกัดจำนวน FVG ที่แสดงตาม fvgHistoryNbr และลบ FVG เก่าออก
ฟังก์ชัน FVGDraw จะถูกเรียกเพื่ออัปเดตสถานะของ FVG (เช่น การถูก Mitigate) และปรับการแสดงผล
2.5 Structures Processing (การประมวลผลโครงสร้างตลาด)
Initialization: ที่ bar_index == 0 (แท่งเทียนแรกของกราฟ) จะมีการกำหนดค่าเริ่มต้นให้กับ structureHigh, structureLow, structureHighStartIndex, structureLowStartIndex
Finding Current High/Low: highest, highestBar, lowest, lowestBar ถูกใช้เพื่อหา High/Low ที่สุดและ Bar Index ของมันใน 10 แท่งล่าสุด (หรือทั้งหมดหากกราฟสั้นกว่า 10 แท่ง)
Calculating Structure Max/Min Bar: structureMaxBar และ structureMinBar ใช้ฟังก์ชัน get_structure_highest_bar และ get_structure_lowest_bar เพื่อหา Bar Index ของ Swing High/Low ที่แท้จริง (ไม่ใช่แค่ High/Low ที่สุดใน lookback แต่เป็นจุด Pivot ที่สมบูรณ์)
Break Price: lowStructBreakPrice และ highStructBreakPrice จะเป็นราคาปิด (close) หรือราคา Low/High ขึ้นอยู่กับ isStructBodyCandleBreak
isStuctureLowBroken / isStructureHighBroken: เงื่อนไขเหล่านี้ตรวจสอบว่าราคาได้ทำลาย structureLow หรือ structureHigh หรือไม่ โดยพิจารณาจากราคา Break, ราคาแท่งก่อนหน้า และ Bar Index ของจุดเริ่มต้นโครงสร้าง
Choch/BoS Logic (ส่วนสำคัญที่ถูกผสานกับ MACD):
if(isStuctureLowBroken and is_bearish_macd_cross): นี่คือจุดที่ MACD เข้ามามีบทบาท หากราคาทำลาย structureLow (สัญญาณขาลง) และ MACD Histogram เกิด Bearish Zero Cross (is_bearish_macd_cross เป็น true) อินดิเคเตอร์จะพิจารณาว่าเป็น Choch หรือ BoS
หาก structureDirection == 1 (เดิมเป็นขาขึ้น) หรือ 0 (ยังไม่กำหนด) จะตีเป็น "CHoCH" (เปลี่ยนทิศทางโครงสร้างเป็นขาลง)
หาก structureDirection == 2 (เดิมเป็นขาลง) จะตีเป็น "BOS" (ยืนยันโครงสร้างขาลง)
มีการสร้าง line.new และ label.new เพื่อวาดเส้นและป้ายกำกับ
structureDirection จะถูกอัปเดตเป็น 1 (Bullish)
structureHighStartIndex, structureLowStartIndex, structureHigh, structureLow จะถูกอัปเดตเพื่อกำหนดโครงสร้างใหม่
else if(isStructureHighBroken and is_bullish_macd_cross): เช่นกันสำหรับขาขึ้น หากราคาทำลาย structureHigh (สัญญาณขาขึ้น) และ MACD Histogram เกิด Bullish Zero Cross (is_bullish_macd_cross เป็น true) อินดิเคเตอร์จะพิจารณาว่าเป็น Choch หรือ BoS
หาก structureDirection == 2 (เดิมเป็นขาลง) หรือ 0 (ยังไม่กำหนด) จะตีเป็น "CHoCH" (เปลี่ยนทิศทางโครงสร้างเป็นขาขึ้น)
หาก structureDirection == 1 (เดิมเป็นขาขึ้น) จะตีเป็น "BOS" (ยืนยันโครงสร้างขาขึ้น)
มีการสร้าง line.new และ label.new เพื่อวาดเส้นและป้ายกำกับ
structureDirection จะถูกอัปเดตเป็น 2 (Bearish)
structureHighStartIndex, structureLowStartIndex, structureHigh, structureLow จะถูกอัปเดตเพื่อกำหนดโครงสร้างใหม่
การลบเส้นเก่า: d.delete_line (หากไลบรารีทำงาน) จะถูกเรียกเพื่อลบเส้นและป้ายกำกับเก่าออกเมื่อจำนวนเกิน structHistoryNbr
Updating Structure High/Low (else block): หากไม่มีการ Break เกิดขึ้น แต่ราคาปัจจุบันสูงกว่า structureHigh หรือต่ำกว่า structureLow ในทิศทางที่สอดคล้องกัน (เช่น ยังคงเป็นขาขึ้นและทำ High ใหม่) structureHigh หรือ structureLow จะถูกอัปเดตเพื่อติดตาม High/Low ที่สุดของโครงสร้างปัจจุบัน
Current Structure Display:
หาก isCurrentStructToShow เป็น true อินดิเคเตอร์จะวาดเส้น structureHighLine และ structureLowLine เพื่อแสดงขอบเขตของโครงสร้างตลาดปัจจุบัน
Fibonacci Display:
หาก isFiboXToShow เป็น true อินดิเคเตอร์จะคำนวณและวาดเส้น Fibonacci Levels ต่างๆ (0.786, 0.705, 0.618, 0.5, 0.382) โดยอิงจาก structureHigh และ structureLow ของโครงสร้างตลาดปัจจุบัน
Alerts:
alertcondition: ใช้สำหรับตั้งค่า Alert ใน TradingView เมื่อเกิดสัญญาณ BOS หรือ CHOCH
plot(na):
plot(na) เป็นคำสั่งที่สำคัญในอินดิเคเตอร์ที่ไม่ได้ต้องการพล็อต Series ของข้อมูลบนกราฟ (เช่น ไม่ได้พล็อตเส้น EMA หรือ RSI) แต่ใช้วาดอ็อบเจกต์ (Line, Label, Box) โดยตรง
การมี plot(na) ช่วยให้ Pine Script รู้ว่าอินดิเคเตอร์นี้มีเอาต์พุตที่แสดงผลบนกราฟ แม้ว่าจะไม่ได้เป็น Series ที่พล็อตตามปกติก็ตาม
3. วิธีใช้งาน
คัดลอกโค้ดทั้งหมด ที่อยู่ในบล็อก immersive ด้านบน
ไปที่ TradingView และเปิดกราฟที่คุณต้องการ
คลิกที่เมนู "Pine Editor" ที่อยู่ด้านล่างของหน้าจอ
ลบโค้ดเดิมที่มีอยู่ และ วางโค้ดที่คัดลอกมา ลงไปแทน
คลิกที่ปุ่ม "Add to Chart"
อินดิเคเตอร์จะถูกเพิ่มลงในกราฟของคุณโดยอัตโนมัติ คุณสามารถคลิกที่รูปฟันเฟืองข้างชื่ออินดิเคเตอร์บนกราฟเพื่อเข้าถึงหน้าต่างการตั้งค่าและปรับแต่งตามความต้องการของคุณได้
Hello! I will explain the "SMC Structures and FVG + MACD" indicator you provided in detail, section by section, so you can fully understand how it works.This indicator combines the concepts of Smart Money Concept (SMC), which focuses on analyzing Market Structure and Fair Value Gaps (FVG), with the MACD indicator to serve as a filter or confirmation for Choch (Change of Character) and BoS (Break of Structure) signals.1. Overall PurposeThe main purposes of this indicator are:Identify Market Structure: Automatically draw lines and label Choch (Change of Character) and BoS (Break of Structure) on the chart.Integrate MACD Confirmation: Choch/BoS signals will only be considered when the MACD Histogram performs a cross (Zero Cross) in the corresponding direction.Display Fair Value Gap (FVG): If enabled, FVG boxes will be drawn on the chart.Display Fibonacci Levels: Calculate and display important Fibonacci levels based on the current market structure.Adapt to Timeframe: All calculations and displays will automatically adjust to the timeframe you are currently using.2. Code BreakdownThis code can be divided into the following main sections:2.1 Inputs (Settings)This section contains variables that you can adjust in the indicator's settings window (click the gear icon next to the indicator's name on the chart).MACD Settings:fast_len: Length of the Fast EMA for MACD (default 12)slow_len: Length of the Slow EMA for MACD (default 26)signal_len: Length of the Signal Line for MACD (default 9) = ta.macd(close, fast_len, slow_len, signal_len): Calculates the MACD Line, Signal Line, and Histogram using the closing price (close) and the specified lengths.is_bullish_macd_cross: Checks if the MACD Histogram crosses above the 0 line (from negative to positive).is_bearish_macd_cross: Checks if the MACD Histogram crosses below the 0 line (from positive to negative).Fear Value Gap (FVG) Settings:isFvgToShow: (Boolean) Enables/disables the display of FVG on the chart.bullishFvgColor: Color for Bullish FVG.bearishFvgColor: Color for Bearish FVG.mitigatedFvgColor: Color for FVG that has been mitigated.fvgHistoryNbr: Number of historical FVG to display.isMitigatedFvgToReduce: (Boolean) Enables/disables reducing the size of FVG when mitigated.Structures (โครงสร้างตลาด) Settings:isStructBodyCandleBreak: (Boolean) If true, the break must occur with the candle body closing above/below the Swing High/Low. If false, a wick break is sufficient.isCurrentStructToShow: (Boolean) Enables/disables the display of the current market structure lines (blue lines in the example image).pivot_len: Lookback length for identifying Pivot points (Swing High/Low). A smaller value captures smaller, more frequent swings; a larger value captures larger, more significant swings.bullishBosColor, bearishBosColor: Colors for bullish/bearish BOS lines and labels.bosLineStyleOption, bosLineWidth: Style (Solid, Dotted, Dashed) and width of BOS lines.bullishChochColor, bearishChochColor: Colors for bullish/bearish CHoCH lines and labels.chochLineStyleOption, chochLineWidth: Style (Solid, Dotted, Dashed) and width of CHoCH lines.currentStructColor, currentStructLineStyleOption, currentStructLineWidth: Color, style, and width of the current market structure lines.structHistoryNbr: Number of historical breaks (Choch/BoS) to display.Structure Fibonacci (from original code):A set of inputs to enable/disable, define values, colors, styles, and widths for various Fibonacci Levels (0.786, 0.705, 0.618, 0.5, 0.382) that will be calculated from the current market structure.2.2 Helper FunctionsgetLineStyle(lineOption): This function converts the selected string input (e.g., "─", "┈", "╌") into a line.style_ format understood by Pine Script.get_structure_highest_bar(lookback): This function attempts to find the Bar Index of the Swing High within the specified lookback period.get_structure_lowest_bar(lookback): This function attempts to find the Bar Index of the Swing Low within the specified lookback period.is_structure_high_broken(...): This function checks if the current price has broken above _structureHigh (Swing High), considering _highStructBreakPrice (closing price or high price depending on isStructBodyCandleBreak setting).FVGDraw(...): This function takes arrays of FVG Boxes, Types, Mitigation Status, and Labels to process and update the status of FVG (e.g., whether it's mitigated) and adjust the size/position of FVG Boxes and Labels on the chart.2.3 Global VariablesThese are variables declared with var, meaning their values are stored and updated on each bar (persists across bars).structureLines, structureLabels: Arrays to store line and label objects for Choch/BoS lines drawn on the chart.fvgBoxes, fvgTypes, fvgLabels, isFvgMitigated: Arrays to store FVG box data and their respective statuses.structureHigh, structureLow: Stores the price of the significant Swing High/Low of the current market structure.structureHighStartIndex, structureLowStartIndex: Stores the Bar Index of the start point of the significant Swing High/Low.structureDirection: Stores the status of the market structure direction (1 = Bullish, 2 = Bearish, 0 = Undefined).fiboXPrice, fiboXStartIndex, fiboXLine, fiboXLabel: Variables to store data and objects for Fibonacci Levels.isBOSAlert, isCHOCHAlert: (Boolean) Used to trigger alerts in TradingView (if alerts are configured).2.4 FVG ProcessingThis section checks the conditions for FVG formation (Bullish FVG: high < low , Bearish FVG: low > high ).If FVG occurs and isFvgToShow is true, a new box and label are created to display the FVG on the chart.fvgBoxes and fvgLabels are managed to limit the number of FVG displayed according to fvgHistoryNbr and remove older FVG.The FVGDraw function is called to update the FVG status (e.g., whether it's mitigated) and adjust its display.2.5 Structures ProcessingInitialization: At bar_index == 0 (the first bar of the chart), structureHigh, structureLow, structureHighStartIndex, and structureLowStartIndex are initialized.Finding Current High/Low: highest, highestBar, lowest, lowestBar are used to find the highest/lowest price and its Bar Index of it in the last 10 bars (or all bars if the chart is shorter than 10 bars).Calculating Structure Max/Min Bar: structureMaxBar and structureMinBar use get_structure_highest_bar and get_structure_lowest_bar functions to find the Bar Index of the true Swing High/Low (not just the highest/lowest in the lookback but a complete Pivot point).Break Price: lowStructBreakPrice and highStructBreakPrice will be the closing price (close) or the Low/High price, depending on the isStructBodyCandleBreak setting.isStuctureLowBroken / isStructureHighBroken: These conditions check if the price has broken structureLow or structureHigh, considering the break price, previous bar prices, and the Bar Index of the structure's starting point.Choch/BoS Logic (Key Integration with MACD):if(isStuctureLowBroken and is_bearish_macd_cross): This is where MACD plays a role. If the price breaks structureLow (bearish signal) AND the MACD Histogram performs a Bearish Zero Cross (is_bearish_macd_cross is true), the indicator will consider it a Choch or BoS.If structureDirection == 1 (previously bullish) or 0 (undefined), it will be labeled "CHoCH" (changing structure direction to bearish).If structureDirection == 2 (already bearish), it will be labeled "BOS" (confirming bearish structure).line.new and label.new are used to draw the line and label.structureDirection will be updated to 1 (Bullish).structureHighStartIndex, structureLowStartIndex, structureHigh, structureLow will be updated to define the new structure.else if(isStructureHighBroken and is_bullish_macd_cross): Similarly for bullish breaks. If the price breaks structureHigh (bullish signal) AND the MACD Histogram performs a Bullish Zero Cross (is_bullish_macd_cross is true), the indicator will consider it a Choch or BoS.If structureDirection == 2 (previously bearish) or 0 (undefined), it will be labeled "CHoCH" (changing structure direction to bullish).If structureDirection == 1 (already bullish), it will be labeled "BOS" (confirming bullish structure).line.new and label.new are used to draw the line and label.structureDirection will be updated to 2 (Bearish).structureHighStartIndex, structureLowStartIndex, structureHigh, structureLow will be updated to define the new structure.Deleting Old Lines: d.delete_line (if the library works) will be called to delete old lines and labels when their number exceeds structHistoryNbr.Updating Structure High/Low (else block): If no break occurs, but the current price is higher than structureHigh or lower than structureLow in the corresponding direction (e.g., still bullish and making a new high), structureHigh or structureLow will be updated to track the highest/lowest point of the current structure.Current Structure Display:If isCurrentStructToShow is true, the indicator draws structureHighLine and structureLowLine to show the boundaries of the current market structure.Fibonacci Display:If isFiboXToShow is true, the indicator calculates and draws various Fibonacci Levels (0.786, 0.705, 0.618, 0.5, 0.382) based on the structureHigh and structureLow of the current market structure.Alerts:alertcondition: Used to set up alerts in TradingView when BOS or CHOCH signals occur.plot(na):plot(na) is an important statement in indicators that do not plot data series directly on the chart (e.g., not plotting EMA or RSI lines) but instead draw objects (Line, Label, Box).Having plot(na) helps Pine Script recognize that this indicator has an output displayed on the chart, even if it's not a regularly plotted series.3. How to UseCopy all the code in the immersive block above.Go to TradingView and open your desired chart.Click on the "Pine Editor" menu at the bottom of the screen.Delete any existing code and paste the copied code in its place.Click the "Add to Chart" button.The indicator will be added to your chart automatically. You can click the gear icon next to the indicator's name on the chart to access the settings window and customize it to your needs.I hope this explanation helps you understand this indicator in detail. If anything is unclear, or you need further adjustments, please let me know.

TZtraderTZtrader
This is a TrendZones version with features to set stoploss and targets in short and long positions meant for use in intraday charts. It aims to provide signals for opening and closing long and short positions. In the comments under the TrendZones publication several people expressed a need for features for a short position similar to those for a long position as implemented in TrendZones, some want to use it for scalping, some asked for alerts. When I proposed to create a version for day trading with target lines based on ATR, several people liked the idea.
Full disclosure: I don’t do day trading, because, after I lost a lot of money, I had to promise my wife to stay away from it. I restrict myself to long term investing in stocks which are in uptrend. However I understand what a day trader needs. I gather from my experience that day trading or scalping is an attempt to earn something by opening a position in the morning and close, reopen and close it again during the day with a profit. It is usually done with leveraged instruments like CFD’s, futures, options, and what have you. Opening and closing positions is done within minutes, so the trader needs a quick and efficient way to set proper stoploss and target. TZtrader supports this by showing only three or four numbers on the price bar: The price of the instrument, The logical stop level (gray or green or maroon dots), and the target level (navy). All other numbers are suppressed to prevent mistakes. Also a clear feedback for current settings at the top-center of the pane and an alert feedback at bottom that flashes alerts during the development of the current bar and gives suppression status.
The script
First I made a bare bones version of TrendZones to which I added code for long and short trading setups and a bare setup for no position. The code for the logical stops in long setup had to be reviewed, after which this became the basis for stops in short setup.
Then I added code for 10 alert messages, which was a hassle, because this is the first time I coded alerts and the first time I used an array as a stack to avoid a complicated if-then construction. During testing the array caused a runtime error which I solved by adding ‘array.clear’ to the code, also I discovered that in TradingView separate alerts have to be created for all three setups - short, long and bare. Flipping setups is done in the inputs with a dropdown menu because Pine Script has no function for a clickable button.
One visual with three setups.
The visual has the TrendZones structure: Three near parallel very smooth curves, which border the moderate uptrend (green) and downtrend (orange) zone over and under the curve in the middle, the COG (Center Of Gravity). Where the price breaks out of these curves, strong trend zones show up over and under the curves, respectively strong uptrend (blue) and strong downtrend (red).
Three setups were made clearly different to avoid confusion and to provide oversight in case of multiple trades going on simultaneously which I imagine are monitored in one screen. You have to see which one is long, which short and which have no position. The long setup should not trigger short signals, nor should the short trigger long signals nor the bare setup exclusive long or short signals.
The Long setup is default, shown on the example chart. In this setup the Stoploss suggestions (green, gray and maroon dots) are under the price bars and the target line (navy) at a set distance above the High Border. A zone with a width of 1 ATR is drawn under the Low Border. In this setup 5 specific alerts are provided
The Short setup has the Stoploss suggestions over the price bars, the target line at a set distance under the Low Border. A zone with a width of 1 ATR is drawn above the High Border. This setup also has 5 specific alerts.
The Bare setup has no Stoploss suggestions, no target line and supports 4 alerts, 2 in common with the Long setup and 2 with Short.
The table below gives a summary of scripted alerts:
Setup = Where = When = Purpose
Long, Bare = Green Zone = Bars come from lower zones = Uptrend starts
Long, Bare = Green Zone = Sideways ends in uptrend = Uptrend resumes
Long = COG = First crossing = Uptrend might end warning
Long = Orange Zone = Bars come from higher zones = Uptrend ended take care
Long = Red Zone = Bars come from higher zones = Strong downtrend->close Long
Short, Bare = Orange Zone = Bars come from higher zones = Downtrend starts
Short, Bare = Orange Zone = Sideways ends in downtrend = Downtrend resumes
Short = COG = First crossing = Downtrend might end warning
Short = Green Zone = Bars come from lower zones = Downtrend ended take care
Short = Blue Zone = Bars come from lower zones = Strong uptrend -> close short
You can use script alerts in TradingView by clicking the clock in the sidebar, then ‘create alert’ or plus, as condition you choose ‘Tztrader’ in the dialog box, then the “Any alert() function call” option (the first item in the list). The script lets the valid alert trigger by TradingView after the bar is completed, this can differ from the flashed messages during its formation.
When you create alerts in Tradingview, I advice to do that for each setup, then to make only the alert active which matches the current setup, pause the other ones.
Suppressing false and annoying signals
The script has two ways to suppress such signals, which have to do with the numbers in the alert feedback. The numbers left and right of the message with a colored background, depict the zones in which the previous (left) and current (right) bar move. 1 is the strong downtrend zone (red), 2 the moderate downtrend zone (orange), 3 the sideways zones (gray), 4 the COG (gray), 5 the moderate uptrend zone (green), 6 the strong uptrend zone (blue), 7 something went wrong with assigning a zone (black). In extensive testing the number 7 never occurs, because I catch that error in the code. The idea is that an alert is only triggered if the previous bar was in a different zone. When the bars are in the same zone, no alert is possible. This way all annoying signals are suppressed and long, short and bare get the appropriate alerts.
The third number is a counter. It counts how often the COG is crossed without touching the outer curves. The counter will reset to zero when the upper or lower curve is touched. When the count is 1 you have zone situation 4 and appropriate alerts are flashed. When the count is 2 or higher, a sideways situation (3) is called and while the recrossings are going on, no alerts can be flashed. This suppresses false signals. The ATR zone and curves are brownish-gray where sideways happens(ed). When the channel is narrowed down to just the three curves, some false signals still might occur.
Inputs
“Setup”, default is long, drop down menu provides long, short and bare.
“Target ATR”, default is 2, sets the amount of ATR for the target line. In 1 minute charts 4 seems an appropriate setting, you have to learn by experience which setting works.
“show feedback …” default is on, This creates two feedback labels, a Setup feedback on top of the pane, which shows charted instrument, Setup type, Trend and timeframe of the chart. Background color of Trend feedback is green when it matches the setup, red when mismatches and gray when no match. The alert feedback at the bottom of the pane shows a number, a message and two numbers. The numbers will be explained in the chapter about false and annoying signals below. During formation of the bar, valid alerts are flashed with a blue background, otherwise the message ‘alerts for current bar suppressed’.
Logical Stops
The curves are the logical place to put stops, because, as these are averages of the high and low border of a Donchian channel, they signify the ‘natural’ current highest, lowest and main level in the lookback period that fit the monitored trend setup. A downtrend turns into an uptrend when a breakout of the upper curve occurs. If you are short, that is where you want to close position, so the logical place for the stoploss is the upper curve. Vice versa, when you are long, the logical stop is on the lower curve. The stops show up as green or gray dots on the curves, the green dots signify a nice entry level, the gray stops are there to suggest levels where unrealized profits might be secured, the maroon dots indicate that the trend mismatches the setup.
COG versus other lines
Any line used to identify a trend, be it some MA or some other line, is interpreted the same way: When the bars move above the line there is an uptrend and when below, a downtrend. COG is not different in that sense. If you put such a line in the same chart as TZtrader, you can see situations in which the other line shows uptrend or downtrend earlier than COG, also some other lines, e.g. Hull MA, are very good at showing tops and bottoms, while COG ignores these. On the other hand the other lines are usually a little nervous and let you shake out of position too soon. Just like the other lines, COG gives false signals when it is near horizontal. The advantage of the placement COG is the tolerance for pull backs. This way TZtrader keeps you longer in the trend. Such pull backs are often ‘flags’ which are interpreted in TA as confirming the trend. Tztrader aims to get you in position reasonably soon when a trend begins and out of position as soon as the trend turns against you. The placement of COG is done with a fundamentally different algorithm than other lines as it is not an average of prices, but the middle of two averages of borders of a Donchian channel. This gives the two zones between the curves the same quality as the two zones above and below the middle line of a standard Donchian Channel.
A multi timeframe application.
In this scenario you put a 5 minutes and 1 minute chart with Tztrader side by side. If the 5 minutes shows uptrend, set the 1 minute on long trading and open positions when the trend matches uptrend en close when it mismatches. Don’t open short positions. Once the 5 minute changes to downtrend, set Tztrader in the 1 minute to short trading and open positions when the trend matches downtrend and close when it mismatches.
The idea is that in a long ‘context’, provided by the 5 minutes, the uptrends in the 1 minute will last longer and go further, vice versa for the short ‘context’. This way you do swing trading in the 5 minute in a smart way, maximizing profits.
You can do this with any timeframe pairs with a proportion of around 5:1, 4:1, 6:1, like e.g. 60 minutes and 15 minutes or weeks and days (5 trading days in a week).
Dear day-traders, may this tool be helpful and may your days be blessed.
Take care

Ratio-Adjusted McClellan Summation Index RASI NASIRatio-Adjusted McClellan Summation Index (RASI NASI)
In Book "The Complete Guide to Market Breadth Indicators" Author Gregory L. Morris states
"It is the author’s opinion that the McClellan indicators, and in particular, the McClellan Summation Index, is the single best breadth indicator available. If you had to pick just one, this would be it."
What It Does: The Ratio-Adjusted McClellan Summation Index (RASI) is a market breadth indicator that tracks the cumulative strength of advancing versus declining issues for a user-selected exchange (NASDAQ, NYSE, or AMEX). Derived from the McClellan Oscillator, it calculates ratio-adjusted net advances, applies 19-day and 39-day EMAs, and sums the oscillator values to produce the RASI. This indicator helps traders assess market health, identify bullish or bearish trends, and detect potential reversals through divergences.
Key features:
Exchange Selection : Choose NASDAQ (USI:ADVN.NQ, USI:DECL.NQ), NYSE (USI:ADVN.NY, USI:DECL.NY), or AMEX (USI:ADVN.AM, USI:DECL.AM) data.
Trend-Based Coloring : RASI line displays user-defined colors (default: black for uptrend, red for downtrend) based on its direction.
Customizable Moving Average: Add a moving average (SMA, EMA, WMA, VWMA, or RMA) with user-defined length and color (default: EMA, 21, green).
Neutral Line at Zero: Marks the neutral level for trend interpretation.
Alerts: Six custom alert conditions for trend changes, MA crosses, and zero-line crosses.
How to Use
Add to Chart: Apply the indicator to any TradingView chart. Ensure access to advancing and declining issues data for the selected exchange.
Select Exchange: Choose NASDAQ, NYSE, or AMEX in the input settings.
Customize Settings: Adjust EMA lengths, RASI colors, MA type, length, and color to match your trading style.
Interpret the Indicator :
RASI Line: Black (default) indicates an uptrend (RASI rising); red indicates a downtrend (RASI falling).
Above Zero: Suggests bullish market breadth (more advancing issues).
Below Zero : Indicates bearish breadth (more declining issues).
MA Crosses: RASI crossing above its MA signals bullish momentum; crossing below signals bearish momentum.
Divergences: Compare RASI with the market index (e.g., NASDAQ Composite) to identify potential reversals.
Large Moves : A +3,600-point move from a low (e.g., -1,550 to +1,950) may signal a significant bull run.
Set Alerts:
Add the indicator to your chart, open the TradingView alert panel, and select from six conditions (see Alerts section).
Configure notifications (e.g., email, webhook, or popup) for each condition.
Settings
Market Selection:
Exchange: Select NASDAQ, NYSE, or AMEX for advancing/declining issues data.
EMA Settings:
19-day EMA Length: Period for the shorter EMA (default: 19).
39-day EMA Length: Period for the longer EMA (default: 39).
RASI Settings:
RASI Uptrend Color: Color for rising RASI (default: black).
RASI Downtrend Color: Color for falling RASI (default: red).
RASI MA Settings:
MA Type: Choose SMA, EMA, WMA, VWMA, or RMA (default: EMA).
MA Length: Set the MA period (default: 21).
MA Color: Color for the MA line (default: green).
Alerts
The indicator uses alertcondition() to create custom alerts. Available conditions:
RASI Trend Up: RASI starts rising (based on RASI > previous RASI, shown as black line).
RASI Trend Down: RASI starts falling (based on RASI ≤ previous RASI, shown as red line).
RASI Above MA: RASI crosses above its moving average.
RASI Below MA: RASI crosses below its moving average.
RASI Bullish: RASI crosses above zero (bullish market breadth).
RASI Bearish: RASI crosses below zero (bearish market breadth).
To set alerts, add the indicator to your chart, open the TradingView alert panel, and select the desired condition.
Notes
Data Requirements: Requires access to advancing/declining issues data (e.g., USI:ADVN.NQ, USI:DECL.NQ for NASDAQ). Some symbols may require a TradingView premium subscription.
Limitations: RASI is a medium- to long-term indicator and may lag in volatile or range-bound markets. Use alongside other technical tools for confirmation.
Data Reliability : Verify the selected exchange’s data accuracy, as inconsistencies can affect results.
Debugging: If no data appears, check symbol validity (e.g., try $ADVN/Q, $DECN/Q for NASDAQ) or contact TradingView support.
Credits
Based on the Ratio-Adjusted McClellan Summation Index methodology by McClellan Financial Publications. No external code was used; the implementation is original, inspired by standard market breadth concepts.
Disclaimer
This indicator is for informational purposes only and does not constitute financial advice. Past performance is not indicative of future results. Conduct your own research and combine with other tools for informed trading decisions.

Smart Elliott Wave [The_lurker]🔷 Smart Elliott Wave – موجات إليوت الذكية
A professional indicator for automatically detecting and analyzing Elliott Wave patterns on the chart. Built on classical Elliott Wave theory, it enhances accuracy with dynamic Fibonacci validation and geometric logic—solving the most common issues traders face when applying Elliott Wave manually: complexity, subjectivity, and misinterpretation of corrections.
🎯 Key Features
Smart Elliott Wave offers a layered intelligent system that:
- Automatically detects impulsive and corrective wave structures
- Validates wave formations using Fibonacci rules
- Highlights potential reversal zones (PRZ)
- Sends instant alerts for newly detected patterns
- Supports both bullish and bearish trends
- Includes fully customizable user settings
🧠 Core Concept
The indicator analyzes price movement over time using pivot points (discovered via `ta.pivothigh` and `ta.pivotlow`) to detect wave structures that conform to Elliott Wave sequencing:
- Impulse Wave: 0-1-2-3-4-5
- Simple Correction: ABC
- Complex Correction: WXY
Each structure is validated through a strict set of logical rules combined with Fibonacci ratio checks to ensure pattern integrity and reduce false signals.
🧩 Wave Structure Components
1️⃣ Impulse Waves
- Wave 3 is not the shortest
- Wave 4 does not overlap Wave 1
- Waves 1, 3, and 5 are impulsive; Waves 2 and 4 are corrective
- Fibonacci validation can be applied to Waves 2 and 4 if enabled
2️⃣ Simple Corrections (ABC)
- Wave B partially retraces Wave A
- Wave C completes the structure without invalid overlap
- Fibonacci ratios validate the symmetry of A, B, and C (if enabled)
3️⃣ Complex Corrections (WXY)
- Only used if ABC structure is insufficient
- Requires 6 sequential pivot points: W, X, Y
- W and Y are corrective; X is a linking wave
- Follows both structural and ratio-based validations
📏 Dynamic Fibonacci Validation
When Enable Fibonacci Rules is active:
- Validates against common ratios:
`38.2%`, `50%`, `61.8%`, `78.6%`, `127.2%`, `161.8%`
- Adjustable **Fibonacci Tolerance** allows for controlled deviation
- Patterns are ignored if ratios fall outside the accepted range
🔮 Potential Reversal Zones (PRZ)
- Calculated from the most recent completed impulse wave
- Uses Fibonacci extensions to project PRZ ahead of price
- Customizable visibility and color for each ratio
- Used as dynamic take-profit or stop-loss zones
🖍️ Dual Trend Detection & Wave Coloring
- Supports both bullish and bearish patterns
- Automatic wave coloring for quick visual recognition:
- 🟦 Blue: Bullish waves
- 🟥 Red: Bearish waves
- Optional fill color for correction zones
🔔 Smart Alert System
Instant alerts are triggered when a valid wave pattern is confirmed:
- New impulse wave detected
- ABC correction appears
- Complex WXY correction formed
> Alerts are triggered only after the bar closes to prevent repainting.
⚙️ Indicator Settings
📌 Wave Detection Settings
- Pivot Left Strength: Bars to the left used for pivot detection
- Pivot Right Strength: Bars to the right for confirmation (0 = real-time)
- Enable Fibonacci Rules: Toggle Fibonacci ratio validation
- Fibonacci Tolerance: Allowed deviation in percentage
🎨 Display Settings
- Show Previous Patterns: Toggle between all patterns or only the latest
- Fill correction zones with color
- Customize wave and PRZ color schemes
📉 PRZ Settings
- Show/hide specific Fibonacci ratios
- Customize each PRZ color
- Set maximum bar extension for PRZ display
🔕 Alert Settings
- Enable or disable alerts for each type of pattern
📚 Practical Use Cases
- Daily or intraday price structure analysis
- Combine with RSI, MACD, or momentum indicators
- Filter weak signals using Fibonacci-based pattern validation
- Use PRZ zones as dynamic entry/exit targets
- Learn and reinforce Elliott Wave theory through real-time examples
📝 Important Notes
- Setting `Pivot Right = 0` allows for real-time pattern previews (may repaint)
- Disabling Fibonacci validation increases pattern count but reduces accuracy
- TradingView limits to 500 visual objects (labels, boxes, lines); older patterns may be removed
- PRZ extends up to 100 bars or 0.618 of the previous impulse duration by default
⚠️ Disclaimer:
This indicator is for educational and analytical purposes only. It does not constitute financial, investment, or trading advice. Use it in conjunction with your own strategy and risk management. Neither TradingView nor the developer is liable for any financial decisions or losses.
🔷 Smart Elliott Wave – موجات إليوت الذكية
مؤشر احترافي لرصد وتحليل أنماط موجات إليوت تلقائيًا على الرسم البياني، يعتمد على المبادئ الكلاسيكية للنظرية مع تعزيزها بالتحقق الرياضي والهندسي، ويهدف إلى تجاوز العقبات التي يواجهها معظم المتداولين عند تطبيق موجات إليوت يدويًا، مثل صعوبة التحديد، التقديرات الذاتية، وتشويش التصحيحات.
🎯 ما الذي يميز هذا المؤشر؟
يُقدّم Smart Elliott Wave نظامًا تراكبيًا ذكيًا يقوم بـ:
رصد تلقائي للموجات (الدافعة والتصحيحية)
التحقق من صحة النموذج باستخدام قواعد فيبوناتشي
عرض مناطق الانعكاس المحتملة (PRZ)
توليد تنبيهات لحظية عند تشكّل أنماط جديدة
دعم الاتجاهين (الصاعد والهابط)
واجهة إعدادات مرنة قابلة للتخصيص الكامل
🧠 الفكرة الأساسية
يعتمد المؤشر على تحليل حركة السعر عبر تسلسل زمني من النقاط المحورية (Pivots)، والتي تُكتشف باستخدام دوال مدمجة مثل ta.pivothigh وta.pivotlow. ثم يُبني فوق هذه النقاط نماذج هندسية متوافقة مع تسلسل موجات إليوت:
الموجة الدافعة (Impulse): تسلسل 0-1-2-3-4-5
التصحيح البسيط (ABC)
التصحيح المعقد (WXY)
ويتم التحقق من كل نموذج اعتمادًا على قواعد إليوت + نسب فيبوناتشي، ما يضمن موضوعية التصنيف، ودقة التحديد.
🧩 مكوّنات التحليل:
1️⃣ الموجات الدافعة (Impulse Waves):
يُشترط أن تكون الموجة الثالثة غير الأقصر.
لا تتداخل الموجة الرابعة مع نطاق الموجة الأولى.
تأكيد أن الموجات 1 و3 و5 دافعة، و2 و4 تصحيحية.
يتم التحقق من نسب تصحيح الموجتين 2 و4 حسب قواعد فيبوناتشي عند تفعيلها.
2️⃣ التصحيح البسيط (ABC):
B تصحيح جزئي للموجة A.
C تُكمل الهيكل بدون تداخل مع A.
يتم التحقق من أطوال الموجات وفق نسب فيبوناتشي لضمان التناسق.
3️⃣ التصحيح المعقد (WXY):
لا يتم تفعيله إلا عند فشل ABC في تفسير النمط.
يتطلب 6 نقاط محورية متسلسلة: W, X, Y.
W وY تصحيحيتان، وX رابط مركزي.
يخضع أيضًا لقواعد النسب والتماثل البنائي.
📏 التحقق باستخدام نسب فيبوناتشي:
عند تفعيل خاصية Enable Fibonacci Rules، يتم التحقق الصارم من نسب تصحيح الموجات:
النسب المعتمدة:
38.2%, 50%, 61.8%, 78.6%, 127.2%, 161.8%
إذا لم تكن الموجة ضمن نطاق النسبة + نسبة التسامح (Tolerance)، يتم تجاهل النموذج.
يُستخدم هذا التحقق أيضًا لرسم مناطق الانعكاس المحتملة (PRZ).
🔮 مناطق الانعكاس المحتملة (PRZ)
تُحسب PRZ باستخدام نسب فيبوناتشي انطلاقًا من نهاية آخر موجة دافعة.
تُعرض بشكل مستطيلات شفافة أو ملونة.
يمكن تخصيص كل نسبة لونًا وشكلًا خاصًا.
تُستخدم PRZ كأداة توقع للموجة التالية أو لتحديد أهداف وقف الخسارة وجني الأرباح ديناميكيًا.
🖍️ دعم الاتجاهين وتلوين الموجات:
يدعم المؤشر النماذج الصاعدة والهابطة بشكل تلقائي.
يتم استخدام تلوين بصري لتسهيل التمييز:
الأزرق: للموجات الصاعدة
الأحمر: للموجات الهابطة
لون تعبئة مخصص لمناطق التصحيح
🔔 نظام التنبيهات الذكية
يحتوي المؤشر على تنبيهات تلقائية يتم تفعيلها عند اكتمال أي نمط جديد.
يدعم التنبيهات التالية:
موجة دافعة جديدة
تصحيح بسيط ABC
تصحيح معقد WXY
التنبيهات تُطلق بعد إغلاق الشمعة التي تحقق فيها النموذج (غير فوري Repainting-safe)
⚙️ إعدادات المؤشر
📌 إعدادات تحليل الموجة:
Pivot Left Strength: عدد الأعمدة (bars) إلى اليسار لتحديد الانعكاس
Pivot Right Strength: الأعمدة إلى اليمين لتأكيد الانعكاس (0 يعني تنبؤ لحظي)
Enable Fibonacci Rules: تفعيل/تعطيل التحقق من فيبوناتشي
Fibonacci Tolerance: نسبة التفاوت المقبولة بالنسب المئوية
🎨 إعدادات العرض:
Show Previous Patterns: إظهار كل الأنماط المكتشفة أو آخر نمط فقط
PRZ Settings:
إظهار أو إخفاء نسب معينة
تخصيص الألوان
تحديد امتداد مربع PRZ زمنيًا (Max Bars)
🔕 إعدادات التنبيهات:
تفعيل/تعطيل تنبيه عند كل نمط جديد
📚 حالات الاستخدام العملية:
تحليل الحركة السعرية في بداية كل جلسة
دمج المؤشر مع أدوات مثل RSI أو MACD للحصول على إشارات مركّبة
مراقبة الموجات التوسعية والتصحيحية على فواصل 4H / Daily
استخدام PRZ كأداة لتحديد الأهداف أو وقف الخسارة
التعلم العملي لنظرية إليوت من خلال أمثلة حية
📝 ملاحظات مهمة:
تعيين Pivot Right = 0 يعني نقاط فورية (قد يعاد رسمها لاحقًا)
تعطيل فيبوناتشي يزيد عدد النماذج، لكن قد يُضعف دقتها
TradingView يحد عدد الكائنات المرسومة (Labels, Boxes, Lines) إلى 500، مما قد يؤدي إلى حذف الأنماط الأقدم تلقائيًا
PRZ يمتد افتراضيًا حتى 100 شمعة، أو 0.618 من مدة الموجة الدافعة السابقة
⚠️ إخلاء مسؤولية:
هذا المؤشر لأغراض تعليمية وتحليلية فقط. لا يُمثل نصيحة مالية أو استثمارية أو تداولية. استخدمه بالتزامن مع استراتيجيتك الخاصة وإدارة المخاطر. لا يتحمل TradingView ولا المطور مسؤولية أي قرارات مالية أو خسائر.

Info TableOverview
The Info Table V1 is a versatile TradingView indicator tailored for intraday futures traders, particularly those focusing on MESM2 (Micro E-mini S&P 500 futures) on 1-minute charts. It presents essential market insights through two customizable tables: the Main Table for predictive and macro metrics, and the New Metrics Table for momentum and volatility indicators. Designed for high-activity sessions like 9:30 AM–11:00 AM CDT, this tool helps traders assess price alignment, sentiment, and risk in real-time. Metrics update dynamically (except weekly COT data), with optional alerts for key conditions like volatility spikes or momentum shifts.
This indicator builds on foundational concepts like linear regression for predictions and adapts open-source elements for enhanced functionality. Gradient code is adapted from TradingView's Color Library. QQE logic is adapted from LuxAlgo's QQE Weighted Oscillator, licensed under CC BY-NC-SA 4.0. The script is released under the Mozilla Public License 2.0.
Key Features
Two Customizable Tables: Positioned independently (e.g., top-right for Main, bottom-right for New Metrics) with toggle options to show/hide for a clutter-free chart.
Gradient Coloring: User-defined high/low colors (default green/red) for quick visual interpretation of extremes, such as overbought/oversold or high volatility.
Arrows for Directional Bias: In the New Metrics Table, up (↑) or down (↓) arrows appear in value cells based on metric thresholds (top/bottom 25% of range), indicating bullish/high or bearish/low conditions.
Consensus Highlighting: The New Metrics Table's title cells ("Metric" and "Value") turn green if all arrows are ↑ (strong bullish consensus), red if all are ↓ (strong bearish consensus), or gray otherwise.
Predicted Price Plot: Optional line (default blue) overlaying the ML-predicted price for visual comparison with actual price action.
Alerts: Notifications for high/low Frahm Volatility (≥8 or ≤3) and QQE Bias crosses (bullish/bearish momentum shifts).
Main Table Metrics
This table focuses on predictive, positional, and macro insights:
ML-Predicted Price: A linear regression forecast using normalized price, volume, and RSI over a customizable lookback (default 500 bars). Gradient scales from low (red) to high (green) relative to the current price ± threshold (default 100 points).
Deviation %: Percentage difference between current price and predicted price. Gradient highlights extremes (±0.5% default threshold), signaling potential overextensions.
VWAP Deviation %: Percentage difference from Volume Weighted Average Price (VWAP). Gradient indicates if price is above (green) or below (red) fair value (±0.5% default).
FRED UNRATE % Change: Percentage change in U.S. unemployment rate (via FRED data). Cell turns red for increases (economic weakness), green for decreases (strength), gray if zero or disabled.
Open Interest: Total open MESM2 futures contracts. Gradient scales from low (red) to high (green) up to a hardcoded 300,000 threshold, reflecting market participation.
COT Commercial Long/Short: Weekly Commitment of Traders data for commercial positions. Long cell green if longs > shorts (bullish institutional sentiment); Short cell red if shorts > longs (bearish); gray otherwise.
New Metrics Table Metrics
This table emphasizes technical momentum and volatility, with arrows for quick bias assessment:
QQE Bias: Smoothed RSI vs. trailing stop (default length 14, factor 4.236, smooth 5). Green for bullish (RSI > stop, ↑ arrow), red for bearish (RSI < stop, ↓ arrow), gray for neutral.
RSI: Relative Strength Index (default period 14). Gradient from oversold (red, <30 + threshold offset, ↓ arrow if ≤40) to overbought (green, >70 - offset, ↑ arrow if ≥60).
ATR Volatility: Score (1–20) based on Average True Range (default period 14, lookback 50). High scores (green, ↑ if ≥15) signal swings; low (red, ↓ if ≤5) indicate calm.
ADX Trend: Average Directional Index (default period 14). Gradient from weak (red, ↓ if ≤0.25×25 threshold) to strong trends (green, ↑ if ≥0.75×25).
Volume Momentum: Score (1–20) comparing current to historical volume (lookback 50). High (green, ↑ if ≥15) suggests pressure; low (red, ↓ if ≤5) implies weakness.
Frahm Volatility: Score (1–20) from true range over a window (default 24 hours, multiplier 9). Dynamic gradient (green/red/yellow); ↑ if ≥7.5, ↓ if ≤2.5.
Frahm Avg Candle (Ticks): Average candle size in ticks over the window. Blue gradient (or dynamic green/red/yellow); ↑ if ≥0.75 percentile, ↓ if ≤0.25.
Arrows trigger on metric-specific logic (e.g., RSI ≥60 for ↑), providing directional cues without strict color ties.
Customization Options
Adapt the indicator to your strategy:
ML Inputs: Lookback (10–5000 bars) and RSI period (2+) for prediction sensitivity—shorter for volatility, longer for trends.
Timeframes: Individual per metric (e.g., 1H for QQE Bias to match higher frames; blank for chart timeframe).
Thresholds: Adjust gradients and arrows (e.g., Deviation 0.1–5%, ADX 0–100, RSI overbought/oversold).
QQE Settings: Length, factor, and smooth for fine-tuned momentum.
Data Toggles: Enable/disable FRED, Open Interest, COT for focus (e.g., disable macro for pure intraday).
Frahm Options: Window hours (1+), scale multiplier (1–10), dynamic colors for avg candle.
Plot/Table: Line color, positions, gradients, and visibility.
Ideal Use Case
Perfect for MESM2 scalpers and trend traders. Use the Main Table for entry confirmation via predicted deviations and institutional positioning. Leverage the New Metrics Table arrows for short-term signals—enter bullish on green consensus (all ↑), avoid chop on low volatility. Set alerts to catch shifts without constant monitoring.
Why It's Valuable
Info Table V1 consolidates diverse metrics into actionable visuals, answering critical questions: Is price mispriced? Is momentum aligning? Is volatility manageable? With real-time updates, consensus highlights, and extensive customization, it enhances precision in fast markets, reducing guesswork for confident trades.
Note: Optimized for futures; some metrics (OI, COT) unavailable on non-futures symbols. Test on demo accounts. No financial advice—use at your own risk.
The provided script reuses open-source elements from TradingView's Color Library and LuxAlgo's QQE Weighted Oscillator, as noted in the script comments and description. Credits are appropriately given in both the description and code comments, satisfying the requirement for attribution.
Regarding significant improvements and proportion:
The QQE logic comprises approximately 15 lines of code in a script exceeding 400 lines, representing a small proportion (<5%).
Adaptations include integration with multi-timeframe support via request.security, user-customizable inputs for length, factor, and smooth, and application within a broader table-based indicator for momentum bias display (with color gradients, arrows, and alerts). This extends the original QQE beyond standalone oscillator use, incorporating it as one of seven metrics in the New Metrics Table for confluence analysis (e.g., consensus highlighting when all metrics align). These are functional enhancements, not mere stylistic or variable changes.
The Color Library usage is via official import (import TradingView/Color/1 as Color), leveraging built-in gradient functions without copying code, and applied to enhance visual interpretation across multiple metrics.
The script complies with the rules: reused code is minimal, significantly improved through integration and expansion, and properly credited. It qualifies for open-source publication under the Mozilla Public License 2.0, as stated.

Divergence Strategy [Trendoscope®]🎲 Overview
The Divergence Strategy is a sophisticated TradingView strategy that enhances the Divergence Screener by adding automated trade signal generation, risk management, and trade visualization. It leverages the screener’s robust divergence detection to identify bullish, bearish, regular, and hidden divergences, then executes trades with precise entry, stop-loss, and take-profit levels. Designed for traders seeking automated trading solutions, this strategy offers customizable trade parameters and visual feedback to optimize performance across various markets and timeframes.
For core divergence detection features, including oscillator options, trend detection methods, zigzag pivot analysis, and visualization, refer to the Divergence Screener documentation. This description focuses on the strategy-specific enhancements for automated trading and risk management.
🎲 Strategy Features
🎯Automated Trade Signal Generation
Trade Direction Control : Restrict trades to long-only or short-only to align with market bias or strategy goals, preventing conflicting orders.
Divergence Type Selection : Choose to trade regular divergences (bullish/bearish), hidden divergences, or both, targeting reversals or trend continuations.
Entry Type Options :
Cautious : Enters conservatively at pivot points and exits quickly to minimize risk exposure.
Confident : Enters aggressively at the latest price and holds longer to capture larger moves.
Mixed : Combines conservative entries with delayed exits for a balanced approach.
Market vs. Stop Orders: Opt for market orders for instant execution or stop orders for precise price entry.
🎯 Enhanced Risk Management
Risk/Reward Ratio : Define a risk-reward ratio (default: 2.0) to set profit targets relative to stop-loss levels, ensuring consistent trade sizing.
Bracket Orders : Trades include entry, stop-loss, and take-profit levels calculated from divergence pivot points, tailored to the entry type and risk-reward settings.
Stop-Loss Placement : Stops are strategically set (e.g., at recent pivot or last price point) based on entry type, balancing risk and trade validity.
Order Cancellation : Optionally cancel pending orders when a divergence is broken (e.g., price moves past the pivot in the wrong direction), reducing invalid trades. This feature is toggleable for flexibility.
🎯 Trade Visualization
Target and Stop Boxes : Displays take-profit (lime) and stop-loss (orange) levels as boxes on the price chart, extending 10 bars forward for clear visibility.
Dynamic Trade Updates : Trade visualizations are added, updated, or removed as trades are executed, canceled, or invalidated, ensuring accurate feedback.
Overlay Integration : Trade levels overlay the price chart, complementing the screener’s oscillator-based divergence lines and labels.
🎯 Strategy Default Configuration
Capital and Sizing : Set initial capital (default: $1,000,000) and position size (default: 20% of equity) for realistic backtesting.
Pyramiding : Allows up to 4 concurrent trades, enabling multiple divergence-based entries in trending markets.
Commission and Margin : Accounts for commission (default: 0.01%) and margin (100% for long/short) to reflect trading costs.
Performance Optimization : Processes up to 5,000 bars dynamically, balancing historical analysis and real-time execution.
🎲 Inputs and Configuration
🎯Trade Settings
Direction : Select Long or Short (default: Long).
Divergence : Trade Regular, Hidden, or Both divergence types (default: Both).
Entry/Exit Type : Choose Cautious, Confident, or Mixed (default: Cautious).
Risk/Reward : Set the risk-reward ratio for profit targets (default: 2.0).
Use Market Order : Enable market orders for immediate entry (default: false, uses limit orders).
Cancel On Break : Cancel pending orders when divergence is broken (default: true).
🎯Inherited Settings
The strategy inherits all inputs from the Divergence Screener, including:
Oscillator Settings : Oscillator type (e.g., RSI, CCI), length, and external oscillator option.
Trend Settings : Trend detection method (Zigzag, MA Difference, External), MA type, and length.
Zigzag Settings : Zigzag length (fixed repaint = true).
🎲 Entry/Exit Types for Divergence Scenarios
The Divergence Strategy offers three Entry/Exit Type options—Cautious, Confident, and Mixed—which determine how trades are entered and exited based on divergence pivot points. This section explains how these settings apply to different divergence scenarios, with placeholders for screenshots to illustrate each case.
The divergence pattern forms after 3 pivots. The stop and entry levels are formed on one of these levels based on Entry/Exit types.
🎯Bullish Divergence (Reversal)
A bullish divergence occurs when price forms a lower low, but the oscillator forms a higher low, signaling a potential upward reversal.
💎 Cautious:
Entry : At the pivot high point for a conservative entry.
Exit : Stop-loss at the last pivot point (previous low that is higher than the current pivot low); take-profit at risk-reward ratio. Canceled if price breaks below the pivot (if Cancel On Break is enabled).
Behavior : Enters after confirmation and exits quickly to limit downside risk.
💎Confident:
Entry : At the last pivot low, (previous low which is higher than the current pivot low) for an aggressive entry.
Exit : Stop-loss at recent pivot low, which is the lowest point; take-profit at risk-reward ratio. Canceled if price breaks below the pivot. (lazy exit)
Behavior : Enters early to capture trend continuation, holding longer for gains.
💎Mixed:
Entry : At the pivot high point (conservative).
Exit : Stop-loss at the recent pivot point that has resulted in lower low (lazy exit). Canceled if price breaks below the pivot.
Behavior : Balances entry caution with extended holding for trend continuation.
🎯Bearish Divergence (Reversal)
A bearish divergence occurs when price forms a higher high, but the oscillator forms a lower high, indicating a potential downward reversal.
💎Cautious:
Entry : At the pivot low point (lower high) for a conservative short entry.
Exit : Stop-loss at the previous pivot high point (previous high); take-profit at risk-reward ratio. Canceled if price breaks above the pivot (if Cancel On Break is enabled).
Behavior : Enters conservatively and exits quickly to minimize risk.
💎Confident:
Entry : At the last price point (previous high) for an aggressive short entry.
Exit : Stop-loss at the pivot point; take-profit at risk-reward ratio. Canceled if price breaks above the pivot.
Behavior : Enters early to maximize trend continuation, holding longer.
💎Mixed:
Entry : At the previous piot high point (conservative).
Exit : Stop-loss at the last price point (delayed exit). Canceled if price breaks above the pivot.
Behavior : Combines conservative entry with extended holding for downtrend gains.
🎯Bullish Hidden Divergence (Continuation)
A bullish hidden divergence occurs when price forms a higher low, but the oscillator forms a lower low, suggesting uptrend continuation. In case of Hidden bullish divergence, b]Entry is always on the previous pivot high (unless it is a market order)
💎Cautious:
Exit : Stop-loss at the recent pivot low point (higher than previous pivot low); take-profit at risk-reward ratio. Canceled if price breaks below the pivot (if Cancel On Break is enabled).
Behavior : Enters after confirmation and exits quickly to limit downside risk.
💎Confident:
Exit : Stop-loss at previous pivot low, which is the lowest point; take-profit at risk-reward ratio. Canceled if price breaks below the pivot. (lazy exit)
Behavior : Enters early to capture trend continuation, holding longer for gains.
🎯Bearish Hidden Divergence (Continuation)
A bearish hidden divergence occurs when price forms a lower high, but the oscillator forms a higher high, suggesting downtrend continuation. In case of Hidden Bearish divergence, b]Entry is always on the previous pivot low (unless it is a market order)
💎Cautious:
Exit : Stop-loss at the latest pivot high point (which is a lower high); take-profit at risk-reward ratio. Canceled if price breaks above the pivot (if Cancel On Break is enabled).
Behavior : Enters conservatively and exits quickly to minimize risk.
💎Confident/Mixed:
Exit : Stop-loss at the previous pivot high point; take-profit at risk-reward ratio. Canceled if price breaks above the pivot.
Behavior : Uses the late exit point to hold longer.
🎲 Usage Instructions
🎯Add to Chart:
Add the Divergence Strategy to your TradingView chart.
The oscillator and divergence signals appear in a separate pane, with trade levels (target/stop boxes) overlaid on the price chart.
🎯Configure Settings:
Adjust trade settings (direction, divergence type, entry type, risk-reward, market orders, cancel on break).
Modify inherited Divergence Screener settings (oscillator, trend method, zigzag length) as needed.
Enable/disable alerts for divergence notifications.
🎯Interpret Signals:
Long Trades: Triggered on bullish or bullish hidden divergences (if allowed), shown with green/lime lines and labels.
Short Trades: Triggered on bearish or bearish hidden divergences (if allowed), shown with red/orange lines and labels.
Monitor lime (target) and orange (stop) boxes for trade levels.
Review strategy performance metrics (e.g., profit/loss, win rate) in the strategy tester.
🎯Backtest and Optimize:
Use TradingView’s strategy tester to evaluate performance on historical data.
Fine-tune risk-reward, entry type, position sizing, and cancellation settings to suit your market and timeframe.
For questions, suggestions, or support, contact Trendoscope via TradingView or official support channels. Stay tuned for updates and enhancements to the Divergence Strategy!

Support Resistance with Order BlocksIndicator Description
Professional Price Level Detection for Smart Trading. Master the Markets with Precision Support/Resistance and Order Block Analysis . It provides traders with clear visual cues for potential reversal and breakout areas, combining both retail and institutional trading concepts into one powerful tool.
The Support & Resistance with Order Blocks indicator is a versatile Pine Script tool designed to empower traders with clear, actionable insights into key market levels. By combining advanced pivot-based support and resistance (S/R) detection with order block (OB) filtering, this indicator delivers clean, high-probability zones for entries, exits, and reversals. With customizable display options (boxes or lines) and intuitive settings, it’s perfect for traders of all styles—whether you’re scalping, swing trading, or investing long-term. Overlay it on your TradingView chart and elevate your trading strategy today!
________________________________________
Key Features
✅ Dynamic Support/Resistance - Auto-adjusting levels based on price action
✅ Smart Order Block Detection - Identifies institutional buying/selling zones
✅ Dual Display Modes - Choose between Boxes or Clean Lines for different chart styles
✅ Customizable Sensitivity - Adjust detection parameters for different markets
✅ Broken Level Markers - Clearly shows when key levels are breached
✅ Timeframe-Adaptive - Automatically adjusts for daily/weekly charts
1. Dynamic Support & Resistance Detection
Identifies critical S/R zones using pivot high/low calculations with adjustable look back periods.
Visualizes active S/R zones with distinct colors and labels ("Support" or "Resistance" for boxes, lines for cleaner charts).
Marks broken S/R levels as "Br S" (broken support) or "Br R" (broken resistance) when historical display is enabled, aiding in breakout and reversal analysis.
2. Smart Order Block Identification
Detects bullish and bearish order blocks based on significant price movements (default: ±0.3% over 5 candles).
Highlights institutional buying/selling zones with customizable colors, displayed as boxes or lines.
Filters out overlapping OB zones to keep your chart clutter-free.
3. Dual Display Options
Boxes or Lines: Choose to display S/R and OB as boxes for detailed zones or lines for a minimalist view.
Line Width Customization: Adjust line widths for S/R and OB (1–5 pixels) for optimal visibility.
Color Customization: Tailor colors for active/broken S/R and bullish/bearish OB zones.
4. Advanced Overlap Filtering
Ensures S/R zones don’t overlap with OB zones or other S/R levels, providing only the most relevant levels.
Limits the number of active zones (default: 10) to maintain chart clarity.
5. Historical S/R Visualization
Optionally display broken S/R levels with distinct colors and labels ("Br S" or "Br R") to track historical price reactions.
Broken levels are dynamically updated and removed (or retained) based on user settings.
6. Timeframe Adaptability
Automatically adjusts pivot detection for daily/weekly timeframes (40-candle look back) versus shorter timeframes (20-candle look back).
Works seamlessly across all asset classes (stocks, forex, crypto, etc.) and timeframes.
________________________________________
How It Works
• Support & Resistance:
Uses ta.pivothigh and ta.pivotlow to detect significant price pivots, with a user-defined look back (default: 5 candles post-pivot).
Plots S/R as boxes (with labels "Support" or "Resistance") or lines, extending to the current bar for real-time relevance.
Broken S/R levels are marked with adjusted colors and labels ("S" or "R" for boxes, "Br S" or "Br R" for lines when historical display is enabled).
• Order Blocks:
Identifies OB based on strong price movements over 4 candles, plotted as boxes or lines at the candle’s midpoint.
Validates OB to prevent overlap, ensuring only significant zones are displayed.
Removes OB zones when price breaks through, keeping the chart focused on active levels.
• Customization:
Toggle S/R and OB visibility, adjust detection sensitivity, and set maximum active zones (4–50).
Fine-tune line widths and colors for a personalized chart experience.
________________________________________
Why Use This Indicator?
• Precision Trading: Pinpoint high-probability entry/exit zones with filtered S/R and OB levels.
• Clean Charts: Overlap filtering and zone limits reduce clutter, focusing on key levels.
• Versatile Display: Switch between boxes for detailed zones or lines for simplicity, with adjustable line widths.
• Institutional Edge: Leverage OB detection to align with institutional activity for smarter trades.
• User-Friendly: Intuitive settings and clear visuals make it accessible for beginners and pros alike.
________________________________________
Settings Overview________________________________________
⚙ Input Parameters
Settings Overview
Display Options:
Display Type: Choose "Boxes" or "Lines" for S/R and OB visualization.
S/R Line Width: Set line thickness for S/R lines (1–5 pixels, default: 2).
OB Line Width: Set line thickness for OB lines (1–5 pixels, default: 2).
Order Block Options:
Show Order Block: Enable/disable OB display.
Bull/Bear OB Colors: Customise border and fill colors for bullish and bearish OB zones.
Support/Resistance Options:
Show S/R: Toggle active S/R zones.
Show Historical S/R: Display broken S/R levels, marked as "Br S" or "Br R" for lines.
Detection Period: Set candle lookback for pivot detection (4–50, default: 5).
Max Active Zones: Limit active S/R and OB zones (4–50, default: 10).
Colors: Customise active and broken S/R colors for clear differentiation.
________________________________________
How to Use
1. Add to Chart: Apply the indicator to your TradingView chart.
2. Customize Settings:
o Select "Boxes" or "Lines" for your preferred display style.
o Adjust line widths, colors, and detection parameters to suit your trading style.
o Enable "Show Historical S/R" to track broken levels with "Br S" and "Br R" labels.
3. Analyze Levels:
o Use support zones (green) for buy entries and resistance zones (red) for sell entries.
o Monitor OB zones for institutional activity, signaling potential reversals or continuations.
o Watch for "Br S" or "Br R" labels to identify breakout opportunities.
4. Combine with Other Tools: Pair with trend indicators, volume analysis, or price action for a robust strategy.
5. Monitor Breakouts: Trade breakouts when price breaches S/R or OB zones, with historical labels providing context.
________________________________________
Example Use Cases
• Swing Trading: Use S/R and OB zones to identify entry/exit points, with historical broken levels for context.
• Breakout Trading: Trade price breaks through S/R or OB, using "Br S" and "Br R" labels to confirm reversals.
• Scalping: Adjust detection period for faster S/R and OB identification on lower timeframes.
________________________________________
• Performance: Optimized for all timeframes, with best results on 5M, 15M, 30M, 1H, 4H, or daily charts for swing trading.
• Compatibility: Works with any asset class and TradingView chart.
________________________________________
Get Started
Transform your trading with Support & Resistance with Order Blocks! Add it to your chart, customize it to your style, and trade with confidence. For questions or feedback, drop a comment on TradingView or message the author. Happy trading! 🚀
________________________________________
Disclaimer: This indicator is for educational and informational purposes only. Always conduct your own analysis and practice proper risk management before trading.

Intermarket Correlation Oscillator (ICO)The Intermarket Correlation Oscillator (ICO) is a TradingView indicator that helps traders analyze the relationship between two assets, such as stocks, indices, or cryptocurrencies, by measuring their price correlation. It displays this correlation as an oscillator ranging from -1 to +1, making it easy to spot whether the assets move together, oppositely, or independently. A value near +1 indicates strong positive correlation (assets move in the same direction), near -1 shows strong negative correlation (opposite movements), and near 0 suggests no correlation. This tool is ideal for confirming trends, spotting divergences, or identifying hedging opportunities across markets.
How It Works?
The ICO calculates the Pearson correlation coefficient between the chart’s primary asset (e.g., Apple stock) and a secondary asset you choose (e.g., SPY for the S&P 500) over a specified number of bars (default: 20). The oscillator is plotted in a separate pane below the chart, with key levels at +0.8 (overbought, strong positive correlation) and -0.8 (oversold, strong negative correlation). A midline at 0 helps gauge neutral correlation. When the oscillator crosses these levels or the midline, labels ("OB" for overbought, "OS" for oversold) and alerts notify you of significant shifts. Shaded zones highlight extreme correlations (red for overbought, green for oversold) if enabled.
Why Use the ICO?
Trend Confirmation: High positive correlation (e.g., SPY and QQQ both rising) confirms market trends.
Divergence Detection: Negative correlation (e.g., DXY rising while stocks fall) signals potential reversals.
Hedging: Identify negatively correlated assets to balance your portfolio.
Market Insights: Understand how assets like stocks, bonds, or crypto interact.
Easy Steps to Use the ICO in TradingView
Add the Indicator:
Open TradingView and load your chart (e.g., AAPL on a daily timeframe).
Go to the Pine Editor at the bottom of the TradingView window.
Copy and paste the ICO script provided earlier.
Click "Add to Chart" to display the oscillator below your price chart.
Configure Settings:
Click the gear icon next to the indicator’s name in the chart pane to open settings.
Secondary Symbol: Choose an asset to compare with your chart’s symbol (e.g., "SPY" for S&P 500, "DXY" for USD Index, or "BTCUSD" for Bitcoin). Default is SPY.
Correlation Lookback Period: Set the number of bars for calculation (default: 20). Use 10-14 for short-term trading or 50 for longer-term analysis.
Overbought/Oversold Levels: Adjust thresholds (default: +0.8 for overbought, -0.8 for oversold) to suit your strategy. Lower values (e.g., ±0.7) give more signals.
Show Midline/Zones: Check boxes to display the zero line and shaded overbought/oversold zones for visual clarity.
Interpret the Oscillator:
Above +0.8: Strong positive correlation (red zone). Assets move together.
Below -0.8: Strong negative correlation (green zone). Assets move oppositely.
Near 0: No clear relationship (midline reference).
Labels: "OB" or "OS" appears when crossing overbought/oversold levels, signaling potential correlation shifts.
Set Up Alerts:
Right-click the indicator, select "Add Alert."
Choose conditions like "Overbought Alert" (crossing above +0.8), "Oversold Alert" (crossing below -0.8), or zero-line crossings for bullish/bearish correlation shifts.
Configure notifications (e.g., email, SMS) to stay informed.
Apply to Trading:
Use positive correlation to confirm trades (e.g., buy AAPL if SPY is rising and correlation is high).
Spot divergences for reversals (e.g., stocks dropping while DXY rises with negative correlation).
Combine with other indicators like RSI or moving averages for stronger signals.
Tips for New Users
Start with related assets (e.g., SPY and QQQ for tech stocks) to see clear correlations.
Test on a demo account to understand signals before trading live.
Be aware that correlation is a lagging indicator; confirm signals with price action.
If the secondary symbol doesn’t load, ensure it’s valid on TradingView (e.g., use correct ticker format).
The ICO is a powerful, beginner-friendly tool to explore intermarket relationships, enhancing your trading decisions with clear visual cues and alerts.

Top Right Watermark# TopRight Watermark
**Finally, a watermark that stays out of your way!**
Tired of TradingView's default watermark blocking your price action and technical analysis? This customizable watermark indicator gives you complete control over positioning and content display.
## 🎯 Key Features
**✅ Flexible Positioning** - Place anywhere: corners, sides, or edges
**✅ Multi-Slot Display** - Up to 3 customizable information slots
**✅ Individual Font Control** - Different sizes for each slot
**✅ Platform Compatibility** - TradingView OR MetaTrader timeframe formats
**✅ Clean & Professional** - Customizable colors and transparency
## 🔧 What You Can Display
- **Timeframe** - Current chart period
- **Ticker** - Symbol name (smart formatting for crypto/forex)
- **Exchange** - Broker/platform name
- **Custom Text** - Your own message
- **Empty** - Hide unused slots
## 🎨 Customization Options
- **Position**: 9 placement options (top/middle/bottom + left/center/right)
- **Colors**: Full color picker with transparency control
- **Font Sizes**: 5 sizes available per slot (tiny to huge)
- **Timeframe Style**: Choose TradingView (1m, 4H) or MetaTrader (M1, H4) format
## 🚀 Perfect For
- Traders who need clean chart visibility
- Multi-timeframe analysis
- Professional chart screenshots
- Platform migrants (MT4/MT5 to TradingView)
- Anyone wanting organized chart information
## 💡 Pro Tips
- Place in corners to avoid price action interference
- Combine Exchange + Ticker + Timeframe for complete context
- Use transparency to make it subtle but visible
**Stop letting watermarks interfere with your trading analysis. Take control of your chart display today!**
---
*Compatible with all TradingView chart types and timeframes. Easy setup with intuitive controls.*

Enhanced Stock Ticker with 50MA vs 200MADescription
The Enhanced Stock Ticker with 50MA vs 200MA is a versatile Pine Script indicator designed to visualize the relative position of a stock's price within its short-term and long-term price ranges, providing actionable bullish and bearish signals. By calculating normalized indices based on user-defined lookback periods (defaulting to 50 and 200 bars), this indicator helps traders identify potential reversals or trend continuations. It offers the flexibility to plot signals either on the main price chart or in a separate lower pane, leveraging Pine Script v6's force_overlay functionality for seamless integration. The indicator also includes a customizable ticker table, visual fills, and alert conditions for automated trading setups.
Key Features
Dual Lookback Indices: Computes short-term (default: 50 bars) and long-term (default: 200 bars) indices, normalizing the closing price relative to the high/low range over the specified periods.
Flexible Signal Plotting: Users can toggle between plotting crossover signals (triangles) on the main price chart (location.abovebar/belowbar) or in the lower pane (location.top/bottom) using the Plot Signals on Main Chart option.
Crossover Signals: Generates bullish (Golden Cross) and bearish (Death Cross) signals when the short or long index crosses above 5 or below 95, respectively.
Visual Enhancements:
Plots short-term (blue) and long-term (white) indices in a separate pane with customizable lookback periods.
Includes horizontal reference lines at 0, 20, 50, 80, and 100, with green and red fills to highlight overbought/oversold zones.
Dynamic fill between indices (green when short > long, red when long > short) for quick trend visualization.
Displays a ticker and legend table in the top-right corner, showing the symbol and lookback periods.
Alert Conditions: Supports alerts for bullish and bearish crossovers on both short and long indices, enabling integration with TradingView's alert system.
Technical Innovation: Utilizes Pine Script v6's force_overlay parameter to plot signals on the main chart from a non-overlay indicator, combining the benefits of a separate pane and chart-based signals in a single script.
Technical Details
Calculation Logic:
Uses confirmed bars (barstate.isconfirmed) to calculate indices, ensuring reliability by avoiding real-time bar fluctuations.
Short-term index: (close - lowest(low, lookback_short)) / (highest(high, lookback_short) - lowest(low, lookback_short)) * 100
Long-term index: (close - lowest(low, lookback_long)) / (highest(high, lookback_long) - lowest(low, lookback_long)) * 100
Signals are triggered using ta.crossover() and ta.crossunder() for indices crossing 5 (bullish) and 95 (bearish).
Signal Plotting:
Main chart signals use force_overlay=true with location.abovebar/belowbar for precise alignment with price bars.
Lower pane signals use location.top/bottom for visibility within the indicator pane.
Plotting is controlled by boolean conditions (e.g., bullishLong and plot_on_chart) to ensure compliance with Pine Script's global scope requirements.
Performance Considerations: Optimized for efficiency by calculating indices only on confirmed bars and using lightweight plotting functions.
How to Use
Add to Chart:
Copy the script into TradingView's Pine Editor and add it to your chart.
Configure Settings:
Short Lookback Period: Adjust the short-term lookback (default: 50 bars) to match your trading style (e.g., 20 for shorter-term analysis).
Long Lookback Period: Adjust the long-term lookback (default: 200 bars) for broader market context.
Plot Signals on Main Chart: Check this box to display signals on the price chart; uncheck to show signals in the lower pane.
Interpret Signals:
Golden Cross (Bullish): Green (long) or blue (short) triangles indicate the index crossing above 5, suggesting a potential buying opportunity.
Death Cross (Bearish): Red (long) or white (short) triangles indicate the index crossing below 95, signaling a potential selling opportunity.
Set Alerts:
Use TradingView's alert system to create notifications for the four alert conditions: Long Index Valley, Long Index Peak, Short Index Valley, and Short Index Peak.
Customize Visuals:
The ticker table displays the symbol and lookback periods in the top-right corner.
Adjust colors and styles via TradingView's settings if desired.
Example Use Cases
Swing Trading: Use the short-term index (e.g., 50 bars) to identify short-term reversals within a broader trend defined by the long-term index.
Trend Confirmation: Monitor the fill between indices to confirm whether the short-term trend aligns with the long-term trend.
Automated Trading: Leverage alert conditions to integrate with bots or manual trading strategies.
Notes
Testing: Always backtest the indicator on your chosen market and timeframe to validate its effectiveness.
Optional Histogram: The script includes a commented-out histogram for the index difference (index_short - index_long). Uncomment the plot(index_diff, ...) line to enable it.
Compatibility: Built for Pine Script v6 and tested on TradingView as of May 27, 2025.
Acknowledgments
This indicator was inspired by the need for a flexible tool that combines lower-pane analysis with main chart signals, made possible by Pine Script's force_overlay feature. Share your feedback or suggestions in the comments below, and happy trading!

CYCLE BY RiotWolftradingDescription of the "CYCLE" Indicator
The "CYCLE" indicator is a custom Pine Script v5 script for TradingView that visualizes cyclic patterns in price action, dividing the trading day into specific sessions and 90-minute quarters (Q1-Q4). It is designed to identify and display market phases (Accumulation, Manipulation, Distribution, and Continuation/Reversal) along with key support and resistance levels within those sessions. Additionally, it allows customization of boxes, lines, labels, and colors to suit user preferences.
Main Features
Cycle Phases:
Accumulation (1900-0100): Represents the phase where large operators accumulate positions.
Manipulation (0100-0700): Identifies potential manipulative moves to mislead retail traders.
Distribution (0700-1300): The phase where large operators distribute their positions.
Continuation/Reversal (1300-1900): Indicates whether the price continues the trend or reverses.
90-Minute Quarters (Q1-Q4):
Divides each 6-hour cycle (360 minutes) into four 90-minute quarters (Q1: 00:00-01:30, Q2: 01:30-03:00, Q3: 03:00-04:30, Q4: 04:30-06:00 UTC).
Each quarter is displayed with a colored box (Q1: light purple, Q2: light blue, Q3: light gray, Q4: light pink) and labels (defaulted to black).
Support and Resistance Visualization:
Draws boxes or lines (based on settings) showing the high and low levels of each session.
Optionally displays accumulated volume at the highs and lows within the boxes.
Daily Lines and Last 3 Boxes:
How to Use the Indicator
Step 1: Add the Indicator to TradingView
Open TradingView and select the chart where you want to apply the indicator (e.g., UMG9OOR on a 5-minute timeframe, as shown in the screenshot).
Go to the Pine Editor (at the bottom of the TradingView interface).
Copy and paste the provided code.
Click Compile and then Add to Chart.
Step 2: Configure the Indicator
Click on the indicator name on the chart ("CYCLE") and select Settings (or double-click the name).
Adjust the options based on your needs:
Cycle Phases: Enable/disable phases (Accumulation, Manipulation, Distribution, Continuation/Reversal) and adjust their time slots if needed.
90-Minute Quarters: Enable/disable quarters (Q1-Q4).
Step 3: Interpret the Indicator
Identify Cycle Phases:
Observe the red boxes indicating the phases (Accumulation, Manipulation, etc.).
The high and low levels within each phase are potential support/resistance zones.
If volume is enabled, pay attention to the accumulated volume at highs and lows, as it may indicate the strength of those levels.
Use the 90-Minute Quarters (Q1-Q4):
The colored boxes (Q1-Q4) divide the day into 90-minute segments.
Each quarter shows the price range (high and low) during that period.
Use these boxes to identify price patterns within each quarter, such as breakouts or consolidations.
The labels (Q1, Q2, etc.) help you track time and anticipate potential moves in the next quarter.
Analyze Support and Resistance:
The high and low levels of each phase/quarter act as support and resistance.
Daily lines (if enabled) show key levels from the previous day, useful for planning entries/exits.
The "last 3 boxes below price" (if enabled) highlight potential support levels the price might target.
Avoid Manipulation:
During the Manipulation phase (0100-0700), be cautious of sharp moves or false breakouts.
Use the high/low levels of this phase to identify potential traps (as explained in your first question about manipulation candles).
Step 4: Trading Strategy
Entries and Exits:
Support/Resistance: Use the high/low levels of phases and quarters to set entry or exit points.
For example, if the price bounces off a Q1 support level, consider a buy.
Breakouts: If the price breaks a high/low of a quarter (e.g., Q2), wait for confirmation to enter in the direction of the breakout.
Volume: If accumulated volume is high near a key level, that level may be more significant.
Risk Management:
Place stop-loss orders below lows (for buys) or above highs (for sells) identified by the indicator.
Avoid trading during the Manipulation phase unless you have a specific strategy to handle false breakouts.
Time Context:
Use the quarters (Q1-Q4) to plan your trades based on time. For example, if Q3 is typically volatile in your market, prepare for larger moves between 03:00-04:30 UTC.
Step 5: Adjustments and Testing
Test on Different Timeframes: The indicator is set for a 5-minute timeframe (as in the screenshot), but you can test it on other timeframes (e.g., 1-minute, 15-minute) by adjusting the time slots if needed.
Adjust Colors and Styles: If the default colors are not visible on your chart, change them for better clarity.
---
📌 1. **Accumulation: Strong Institutional Activity**
- During the **accumulation phase, we see **high volume: 82.773K, which suggests strong buying interest**, likely from institutional players.
- This sets the base for the following upward move in price.
---
📌 2. **Manipulation: False Breakout with Lower Volume**
- Later, there's a manipulation phase where price breaks above previous highs, but the volume (71.814K) is **lower than during accumulation**.
- This implies that buyers are not as aggressive as before—no real demandbehind the breakout.
- It’s likely a bull trap, where smart money is selling into the breakout to exit their positions.
---
### 📌 3. Distribution: Weakness and Lack of Demand
- The market enters a distribution phase, and volume drops even further (only 7.914K).
- Price struggles to go higher, and you start seeing rejections at the top.
- This shows that demand is drying up, and smart money is offloading positions**—not accumulating anymore.
---
### 💡 Why Take the Short Here?
- Volume is not increasing with new highs—showing weak demand**.
- The manipulation volume is weaker than the accumulation volume, confirming the breakout was likely false.
- Structure starts to break down (Q levels falling), which confirms weakness.
- This creates a high-probability short setup:
- **Entry:** after confirmation of distribution and structural breakdown.
- **Stop loss:** above the manipulation high.
- **Target:** down toward previous lows or value zones.
---
### ✅ Conclusion
Since the manipulation volume failed to exceed the accumulation volume, the breakout lacked real strength. Combined with decreasing volume in the distribution phase, this indicates fading demand and supply taking control—which justifies entering a short position.

[blackcat] L1 Dynamic EdgeOVERVIEW
📈 The L1 Dynamic Edge is a sophisticated trend-following indicator designed to empower traders with a comprehensive view of market dynamics and precise buy/sell signals. By leveraging multiple Exponential Moving Averages (EMAs) and advanced signal processing, this indicator aims to capture the essence of price momentum and provide actionable insights across various financial instruments and timeframes.
🔑 Key Features:
Fully customizable EMA settings
Multi-dimensional trend analysis using high, low, and midpoint EMAs
Intuitive color-coded trend visualization
Accurate buy/sell signals with visual confirmation
Flexible alert system for real-time notifications
Seamless integration with TradingView's charting tools
FEATURES
📉 Advanced Trend Detection:
Utilizes three distinct EMAs (high, low, and midpoint) for a holistic view of market trends
Employs sophisticated logic to determine rising and falling trends
🌟 Dynamic Visualization:
Automatically adjusts the color of EMA plots based on detected trend direction
Fills the area between high and low EMAs for enhanced visual clarity
📈 Precision Signal Generation:
Identifies potential trend reversals using a combination of price action and EMA behavior
Generates clear buy/sell signals based on trend changes
📊 Comprehensive Chart Integration:
Displays buy/sell signals as easily identifiable shapes on the chart
Adds descriptive labels to signal bars for quick reference
🔔 Customizable Alert System:
Provides alert conditions for both buy and sell signals
Allows users to stay informed about potential trading opportunities even when away from the chart
🛠️ User-Friendly Interface:
Simple input parameters for easy customization
Clean and uncluttered chart appearance without overwhelming the user
🌐 Versatile Application:
Adaptable to various financial instruments, including stocks, forex, commodities, and cryptocurrencies
Effective across different timeframes, from short-term scalping to long-term investing
HOW TO USE
✨ Adding the Indicator:
Open your TradingView chart
Click on "Add Indicator" at the top of the screen
Search for " L1 Dynamic Edge" and add it to your chart
🔧 Customizing Settings:
Adjust the EMA length in the input panel to suit your trading style and preferences
Experiment with different values to find what works best for your specific strategy
🕵️♂️ Analyzing Trends:
Observe the color of the EMA bands to quickly assess the overall market sentiment
Note how the filling between the high and low EMAs responds to price movements
📈 Identifying Opportunities:
Watch for buy/sell signals indicated by triangles and labels on the chart
Consider these signals as potential entry/exit points for your trades
🎯 Implementing Strategies:
Combine the indicator's signals with your own analysis and risk management techniques
Use the provided alerts to stay informed about new trading opportunities
🚨 Setting Up Alerts:
Configure alert conditions for buy and sell signals
Choose your preferred notification method (email, SMS, push notifications, etc. )
📊 Fine-Tuning Your Approach:
Regularly review and analyze the indicator's performance
Adjust the EMA length and other parameters as needed to adapt to changing market conditions
LIMITATIONS
Like any technical indicator, the L1 Dynamic Edge should not be used as a standalone trading system
Its effectiveness may be limited during periods of extreme volatility or in highly ranging markets
The indicator's performance will vary depending on the specific instrument and timeframe being analyzed
New traders might need some time to fully understand and effectively utilize all features of the indicator
NOTES
This script utilizes Pine Script version 5 for optimal performance and compatibility with TradingView's latest features
The default EMA length is set to 3, which provides a balance between responsiveness and noise reduction
The indicator's color scheme has been carefully chosen to ensure maximum visibility while maintaining a clean chart appearance
For best results, consider combining this indicator with other forms of technical and fundamental analysis
Regular backtesting and forward testing are crucial to optimize the indicator's settings for your specific trading style and market conditions
THANKS
We extend our deepest gratitude to the vibrant TradingView community for their invaluable feedback, suggestions, and support throughout the development process of the L1 Dynamic Edge indicator. Special thanks to all the dedicated traders who took the time to test and refine this tool, helping us create a more robust and user-friendly experience for everyone.