Trend Entry_0 [TS_Indie]Trend Entry_0 — Mechanism Overview
The core structure of this strategy is based on a price action reversal pattern, as detailed below:
In the case of a Bullish Trend Reversal:
The price initially moves in a bearish direction. When candle A forms a low lower than the previous low, the high of candle A becomes a key reference point.
If the next candle closes above the high of candle A , it confirms a Bullish Trend Reversal.
* Upon a Bullish signal, a Long position is opened at the opening price of the next candle (candle B).
* When a subsequent Bearish signal occurs, the Long position is closed at the opening price of the next candle (candle C).
In the case of a Bearish Trend Reversal:
The price initially moves in a bullish direction. When candle A forms a high higher than the previous high, the low of candle A becomes a key reference point.
If the next candle closes below the low of candle A , it confirms a Bearish Trend Reversal.
* Upon a Bearish signal, a Short position is opened at the opening price of the next candle (candle B).
* When a subsequent Bullish signal occurs, the Short position is closed at the opening price of the next candle (candle C).
Options
* The start and end dates of the backtest can be customized.
* The swing lines of the trend can be displayed as an optional visual aid.
* The user can choose whether to open only Long or Short positions.
Backtest Results and Observations
Based on the backtesting results of this strategy across various assets and timeframes, it has been observed that this approach works best on trending assets such as Gold, BTC, and stocks.
It also performs well on higher timeframes, starting from the Daily timeframe and above, especially when taking Long positions only.
However, when applied to currency pairs such as EUR/USD, the results tend to be less impressive.
I encourage everyone to try backtesting and further developing this strategy — adding new conditions or filters may potentially lead to improved performance.
Disclaimer
This script is intended solely for backtesting purposes, based on a particular price action pattern.
It does not constitute financial or investment advice.
Backtest results do not guarantee future performance.
ابحث في النصوص البرمجية عن "trend"

Trend Catch STFR - whipsaw Reduced### Summary of the Setup
This trading system combines **SuperTrend** (a trend-following indicator based on ATR for dynamic support/resistance), **Range Filter** (a smoothed median of the last 100 candles to identify price position relative to a baseline), and filters using **VIX Proxy** (a volatility measure: (14-period ATR / 14-period SMA of Close) × 100) and **ADX** (Average Directional Index for trend strength). It's designed for trend trading with volatility safeguards.
- **Entries**: Triggered only in "tradeable" markets (VIX Proxy ≥ 15 OR ADX ≥ 20) when SuperTrend aligns with direction (green for long, red for short), price crosses the Range Filter median accordingly, and you're not already in that position.
- **Exits**: Purely price-based—exit when SuperTrend flips or price crosses back over the Range Filter median. No forced exits from low volatility/trend.
- **No Trade Zone**: Blocks new entries if both VIX Proxy < 15 AND ADX < 20, but doesn't affect open positions.
- **Overall Goal**: Enter trends with confirmed strength/volatility, ride them via price action, and avoid ranging/choppy markets for new trades.
This creates a filtered trend-following strategy that prioritizes quality entries while letting winners run.
### Advantages
- **Reduces Noise in Entries**: The VIX Proxy and ADX filters ensure trades only in volatile or strongly trending conditions, avoiding low-momentum periods that often lead to false signals.
- **Lets Winners Run**: Exits based solely on price reversal (SuperTrend or Range Filter) allow positions to stay open during temporary lulls in volatility/trend, potentially capturing longer moves.
- **Simple and Balanced**: Combines trend (SuperTrend/ADX), range (Filter), and volatility (VIX Proxy) without overcomplicating—easy to backtest and adapt to assets like stocks, forex, or crypto.
- **Adaptable to Markets**: The "OR" logic for VIX/ADX provides flexibility (e.g., enters volatile sideways markets if ADX is low, or steady trends if VIX is low).
- **Risk Control**: Implicitly limits exposure by blocking entries in calm markets, which can preserve capital during uncertainty.
### Disadvantages
- **Whipsaws in Choppy Markets**: As you noted, SuperTrend can flip frequently in ranging conditions, leading to quick entries/exits and small losses, especially if the Range Filter isn't smoothing enough noise.
- **Missed Opportunities**: Strict filters (e.g., requiring VIX ≥ 15 or ADX ≥ 20) might skip early-stage trends or low-volatility grinds, reducing trade frequency and potential profits in quiet bull/bear markets.
- **Lagging Exits**: Relying only on price flips means you might hold losing trades longer if volatility drops without a clear reversal, increasing drawdowns.
- **Parameter Sensitivity**: Values like VIX 15, ADX 20, or Range Filter's 100-candle lookback need tuning per asset/timeframe; poor choices could amplify whipsaws or over-filter.
- **No Built-in Risk Management**: Lacks explicit stops/targets, so it relies on user-added rules (e.g., ATR-based stops), which could lead to oversized losses if not implemented.
### How to Use It
This system can be implemented in platforms like TradingView (via Pine Script), Python (e.g., with TA-Lib or Pandas), or MT4/5. Here's a step-by-step guide, assuming TradingView for simplicity—adapt as needed. (If coding in Python, use libraries like pandas_ta for indicators.)
1. **Set Up Indicators**:
- Add SuperTrend (default: ATR period 10, multiplier 3—adjust as suggested in prior tweaks).
- Create Range Filter: Use a 100-period SMA of (high + low)/2, smoothed (e.g., via EMA if desired).
- Calculate VIX Proxy: Custom script for (ATR(14) / SMA(close, 14)) * 100.
- Add ADX (period 14, standard).
2. **Define Rules in Code/Script**:
- **Long Entry**: If SuperTrend direction < 0 (green), close > RangeFilterMedian, (VIX Proxy ≥ 15 OR ADX ≥ 20), and not already long—buy on bar close.
- **Short Entry**: If SuperTrend direction > 0 (red), close < RangeFilterMedian, (VIX Proxy ≥ 15 OR ADX ≥ 20), and not already short—sell short.
- **Exit Long**: If in long and (SuperTrend > 0 OR close < RangeFilterMedian)—sell.
- **Exit Short**: If in short and (SuperTrend < 0 OR close > RangeFilterMedian)—cover.
- Monitor No Trade Zone visually (e.g., plot yellow background when VIX < 15 AND ADX < 20).
3. **Backtest and Optimize**:
- Use historical data on your asset (e.g., SPY on 1H chart).
- Test metrics: Win rate, profit factor, max drawdown. Adjust thresholds (e.g., ADX to 25) to reduce whipsaws.
- Forward-test on demo account to validate.
4. **Live Trading**:
- Apply to a chart, set alerts for entries/exits.
- Add risk rules: Position size 1-2% of capital, stop-loss at SuperTrend line.
- Monitor manually or automate via bots—avoid overtrading; use on trending assets.
For the adjustments I suggested earlier (e.g., ADX 25, 2-bar confirmation), integrate them into entries only—test one at a time to isolate improvements. If whipsaws persist, combine 2-3 tweaks.

Multiple Symbol Trend Screener [Pineify]Multiple Symbol Trend Screener Pineify – Ultimate Multi-Indicator Scanner for TradingView
Empower your trading with deep market insights across multiple symbols using this feature-rich Pine Script screener. The Multiple Symbol Trend Screener Pineify enables traders to monitor and compare trends, reversals, and consolidations in real-time across the biggest equity symbols on TradingView, through a synergistic blend of popular technical indicators.
Key Features
Monitor up to 15 symbols and their trends simultaneously
Integrates 7 professional-grade indicators: MA Distance, Aroon, Parabolic SAR (PSAR), ADX, Supertrend, Keltner Channel, and BBTrend
Color-coded table display for instant visual assessment
Customizable lookback periods, indicator types, and calculation methods
SEO optimized for multi-symbol trend detection, screener, and advanced TradingView indicator
How It Works
This indicator leverages TradingView’s Pine Script v6 and request.security() to process multiple symbols across selected timeframes. Data populates a dynamic table, updating each cell based on the calculated value of every underlying indicator. MA Distance highlights deviation from moving averages; Aroon flags emerging trend strength; PSAR marks potential trend reversals; ADX assesses trend momentum; Supertrend detects bullish/bearish phases; Keltner Channel and BBTrend offer volatility and power insights.
Set up your preferred symbols and timeframes
Each indicator runs its calculation per symbol using its parameter group
All results are displayed in a table for a comprehensive dashboard view
Trading Ideas and Insights
Traders can use this screener for cross-market comparison, directional bias, entry/exit filtering, and comprehensive trend evaluation. The screener is excellent for swing trading, day trading, and portfolio tracking. It enables confirmation across multiple frameworks — for example, spotting momentum with ADX before confirming direction with Supertrend and PSAR.
Identify correlated movements or divergences across selected assets
Spot synchronized trend changes for basket trading ideas
Filter symbols by volatility, strength, or trend status for precise trade selection
How Multiple Indicators Work Together
The screener’s edge lies in its intelligent correlation of popular indicators. MA Distance measures the proximity to chosen moving averages, ideal for spotting overbought/oversold conditions. Aroon reveals the strength of new price trends, PSAR indicates reversal signals, and ADX quantifies the momentum of these trends. Supertrend provides a directional phase, while Keltner Channel & BBTrend analyze volatility shifts and band compressions. This amalgamation allows for a robust, multi-dimensional market snapshot, capturing details missed by single-indicator tools.
By displaying all key metrics side-by-side, the screener enables holistic decision-making, revealing confluence zones and contradiction areas across multiple tickers and timeframes.
Unique Aspects
Original implementation combining seven independent trend and momentum indicators for each symbol
Rich customization for symbols, timeframes, and all indicator parameters
Intuitive color-coding for quick reading of bullish/bearish/neutral signals
Comprehensive dashboard for instant actionable insights
How to Use
Load the indicator onto your TradingView chart
Go to the script’s settings and input your preferred symbols and relevant timeframes
Set your desired parameters for each indicator group: Moving Average type, Aroon length, PSAR values, ADX smoothing, etc.
Observe the results in the top-right table, then use it to filter candidates and validate trade setups
The screener is suitable for all timeframes and asset classes available on TradingView. Make sure your chart’s timeframe matches the one used in the scanner for optimal accuracy.
Customization
Choose up to 15 symbols to monitor in a single dashboard
Customize lookback periods, indicator types, colors, and display settings
Configure alerting options and thresholds for advanced trade automation
Conclusion
The Multiple Symbol Trend Screener Pineify sets a new standard for multi-asset screening on TradingView. By elegantly merging seven proven technical indicators, the screener delivers powerful trend detection, reversal analysis, and volatility monitoring — all in one dashboard. Take your trading to new heights with in-depth, customizable market surveillance.

Trendline Breakouts With Targets [ omerprıme ]Indicator Explanation (English)
This indicator is designed to detect trendline breakouts and provide early trading signals when the price breaks key support or resistance levels.
Trendline Detection
The indicator identifies recent swing highs and lows to construct dynamic trendlines.
These trendlines act as support in an uptrend and resistance in a downtrend.
Breakout Confirmation
When the price closes above a resistance trendline, the indicator generates a bullish breakout signal.
When the price closes below a support trendline, it generates a bearish breakout signal.
Filtering False Signals
To reduce false breakouts, additional conditions (such as candle confirmation, volume filters, or price momentum) can be applied.
Only significant and confirmed breakouts are highlighted.
Trading Logic
Buy signals are triggered when the price breaks upward through resistance with confirmation.
Sell signals are triggered when the price breaks downward through support with confirmation.

Big Candle Trend█ OVERVIEW
The "Big Candle Trend" indicator is a technical analysis tool written in Pine Script® v6 that identifies large signal candles on the chart and determines the trend direction based on the analysis of all candles within a specified period. Designed for traders seeking a simple yet effective tool to identify key market movements and trends, the indicator provides clarity and precision through flexible settings, trend line visualization, and retracement lines on signal candles.
█ CONCEPTS
The goal of the "Big Candle Trend" indicator was to create a tool based solely on the size of candle bodies and their relative positions, making it universal and effective across all markets (stocks, forex, cryptocurrencies) and timeframes. Unlike traditional indicators that often rely on complex formulas or external data (e.g., volume), this indicator uses simple yet powerful price action logic. Large signal candles are identified by comparing their body size to the average body size over a selected period, and the trend is determined by analyzing price changes over a longer period relative to the average candle body size. Additionally, the indicator draws horizontal lines on signal candles, aiding in setting Stop Loss levels or delayed entries.
█ FEATURES
Large Signal Candle Detection: Identifies candles with a body larger than the average body multiplied by a user-defined multiplier, aligned with the trend (if the trend filter is enabled). Signals are displayed as triangles (green for bullish, red for bearish).
Trend Analysis: Determines the trend (uptrend, downtrend, or neutral) by comparing the price change over a selected period (trend_length) to the average candle body size multiplied by a trend strength multiplier. The trend starts when:
Uptrend: The price change (difference between the current close and the close from an earlier period) is positive and exceeds the average candle body size multiplied by the trend strength multiplier (avg_body_trend * trend_mult).
Downtrend: The price change is negative and exceeds, in absolute value, the average candle body size multiplied by the trend strength multiplier.
Neutral Trend: The price change is below the required threshold, indicating no clear market direction.The trend ends when the price change no longer meets the conditions for an uptrend or downtrend, transitioning to a neutral state or switching to the opposite trend when the price change reverses and meets the conditions for the new trend. This approach differs from standard methods as it focuses on price dynamics in the context of candle body size, offering a more intuitive and direct way to gauge trend strength.
Smoothed Trend Line: Displays a trend line based on the average price (HL2, i.e., the average of the high and low of a candle), smoothed using a user-defined smoothing parameter. The trend line reflects the market direction but is not tied to breakouts, unlike many other trend indicators, allowing for more flexible interpretation.
Retracement Lines: Draws horizontal lines on signal candles at a user-defined level (e.g., 0.618). The lines are displayed to the right of the candle, with a width of one candle. For bullish candles, the line is measured from the top of the body (close) downward, and for bearish candles, from the bottom of the body (close) upward, aiding in setting Stop Loss or delayed entries.
Trend Option: Option to enable a trend filter that limits large candle signals to those aligned with the current trend, enhancing signal precision.
Customizable Visualization: Allows customization of colors for uptrend, downtrend, and neutral states, trend line style, and shadow fill between the trend line and price.
Alerts: Built-in alerts for large signal candles (bullish and bearish) and trend changes (start of uptrend, downtrend, or neutral trend).
█ HOW TO USE
Add to Chart: Apply the indicator to your TradingView chart via the Pine Editor or Indicators menu.
Configure Settings:
Candle Settings:
Average Period (Candles): Sets the period for calculating the average candle body size.
Large Candle Multiplier: Multiplier determining how large a candle’s body must be to be considered "large".
Trend Settings:
Trend Period: Period for analyzing price changes to determine the trend.
Trend Strength Multiplier: Multiplier setting the minimum price change required to identify a significant trend.
Trend Line Smoothing: Degree of smoothing for the trend line.
Show Trend Line: Enables/disables the display of the trend line.
Apply Trend Filter: Limits large candle signals to those aligned with the current trend.
Trend Colors:
Customize colors for uptrend (green), downtrend (red), and neutral (gray) states, and enable/disable shadow fill.
Retracement Settings:
Retracement Level (0.0-1.0): Sets the level for lines on signal candles (e.g., 0.618).
Line Width: Sets the thickness of retracement lines.
Interpreting Signals:
Bullish Signal: A green triangle below the candle indicates a large bullish candle aligned with an uptrend (if the trend filter is enabled). A horizontal line is drawn to the right of the candle at the retracement level, measured from the top of the body downward.
Bearish Signal: A red triangle above the candle indicates a large bearish candle aligned with a downtrend (if the trend filter is enabled). A horizontal line is drawn to the right of the candle at the retracement level, measured from the bottom of the body upward.
rend Line: Shows the market direction (green for uptrend, red for downtrend, gray for neutral). Unlike many indicators, the trend line’s color is not tied to its breakout, allowing for more flexible interpretation of market dynamics.
Alerts: Set up alerts in TradingView for large signal candles or trend changes to receive real-time notifications.
Combining with Other Tools: Use the indicator alongside other technical analysis tools, such as support/resistance levels, RSI, moving averages, or Fair Value Gaps (FVG), to confirm signals.
█ APPLICATIONS
Price Action Trading: Large signal candles can indicate key market moments, such as breakouts of support/resistance levels or strong price rejections. Use signal candles in conjunction with support/resistance levels or FVG to identify entry opportunities. Retracement lines help set Stop Loss levels (e.g., below the line for bullish candles, above for bearish) or delayed entries after price returns to the retracement level and confirms trend continuation. Note that large candles often generate Fair Value Gaps (FVG), which should be considered when setting Stop Loss levels.
Trend Strategies: Enable the trend filter to limit signals to those aligned with the dominant market direction. For example, in an uptrend, look for large bullish candles as continuation signals. The indicator can also be used for position pyramiding, adding positions as subsequent large candles confirm trend continuation.
Practical Approach:
Large candles with high volume may indicate strong market participation, increasing signal reliability.
The trend line helps visually assess market direction and confirm large candle signals.
Retracement lines on signal candles aid in identifying key levels for Stop Loss or delayed entries.
█ NOTES
The indicator works across all markets and timeframes due to its universal logic based on candle body size and relative positioning.
Adjust settings (e.g., trend period, large candle multiplier, retracement level) to suit your trading style and timeframe.
Test the indicator on various markets (stocks, forex, cryptocurrencies) and timeframes to optimize its performance.
Use in conjunction with other technical analysis tools to enhance signal accuracy.

Tzotchev Trend Measure [EdgeTools]Are you still measuring trend strength with moving averages? Here is a better variant at scientific level:
Tzotchev Trend Measure: A Statistical Approach to Trend Following
The Tzotchev Trend Measure represents a sophisticated advancement in quantitative trend analysis, moving beyond traditional moving average-based indicators toward a statistically rigorous framework for measuring trend strength. This indicator implements the methodology developed by Tzotchev et al. (2015) in their seminal J.P. Morgan research paper "Designing robust trend-following system: Behind the scenes of trend-following," which introduced a probabilistic approach to trend measurement that has since become a cornerstone of institutional trading strategies.
Mathematical Foundation and Statistical Theory
The core innovation of the Tzotchev Trend Measure lies in its transformation of price momentum into a probability-based metric through the application of statistical hypothesis testing principles. The indicator employs the fundamental formula ST = 2 × Φ(√T × r̄T / σ̂T) - 1, where ST represents the trend strength score bounded between -1 and +1, Φ(x) denotes the normal cumulative distribution function, T represents the lookback period in trading days, r̄T is the average logarithmic return over the specified period, and σ̂T represents the estimated daily return volatility.
This formulation transforms what is essentially a t-statistic into a probabilistic trend measure, testing the null hypothesis that the mean return equals zero against the alternative hypothesis of non-zero mean return. The use of logarithmic returns rather than simple returns provides several statistical advantages, including symmetry properties where log(P₁/P₀) = -log(P₀/P₁), additivity characteristics that allow for proper compounding analysis, and improved validity of normal distribution assumptions that underpin the statistical framework.
The implementation utilizes the Abramowitz and Stegun (1964) approximation for the normal cumulative distribution function, achieving accuracy within ±1.5 × 10⁻⁷ for all input values. This approximation employs Horner's method for polynomial evaluation to ensure numerical stability, particularly important when processing large datasets or extreme market conditions.
Comparative Analysis with Traditional Trend Measurement Methods
The Tzotchev Trend Measure demonstrates significant theoretical and empirical advantages over conventional trend analysis techniques. Traditional moving average-based systems, including simple moving averages (SMA), exponential moving averages (EMA), and their derivatives such as MACD, suffer from several fundamental limitations that the Tzotchev methodology addresses systematically.
Moving average systems exhibit inherent lag bias, as documented by Kaufman (2013) in "Trading Systems and Methods," where he demonstrates that moving averages inevitably lag price movements by approximately half their period length. This lag creates delayed signal generation that reduces profitability in trending markets and increases false signal frequency during consolidation periods. In contrast, the Tzotchev measure eliminates lag bias by directly analyzing the statistical properties of return distributions rather than smoothing price levels.
The volatility normalization inherent in the Tzotchev formula addresses a critical weakness in traditional momentum indicators. As shown by Bollinger (2001) in "Bollinger on Bollinger Bands," momentum oscillators like RSI and Stochastic fail to account for changing volatility regimes, leading to inconsistent signal interpretation across different market conditions. The Tzotchev measure's incorporation of return volatility in the denominator ensures that trend strength assessments remain consistent regardless of the underlying volatility environment.
Empirical studies by Hurst, Ooi, and Pedersen (2013) in "Demystifying Managed Futures" demonstrate that traditional trend-following indicators suffer from significant drawdowns during whipsaw markets, with Sharpe ratios frequently below 0.5 during challenging periods. The authors attribute these poor performance characteristics to the binary nature of most trend signals and their inability to quantify signal confidence. The Tzotchev measure addresses this limitation by providing continuous probability-based outputs that allow for more sophisticated risk management and position sizing strategies.
The statistical foundation of the Tzotchev approach provides superior robustness compared to technical indicators that lack theoretical grounding. Fama and French (1988) in "Permanent and Temporary Components of Stock Prices" established that price movements contain both permanent and temporary components, with traditional moving averages unable to distinguish between these elements effectively. The Tzotchev methodology's hypothesis testing framework specifically tests for the presence of permanent trend components while filtering out temporary noise, providing a more theoretically sound approach to trend identification.
Research by Moskowitz, Ooi, and Pedersen (2012) in "Time Series Momentum in the Cross Section of Asset Returns" found that traditional momentum indicators exhibit significant variation in effectiveness across asset classes and time periods. Their study of multiple asset classes over decades revealed that simple price-based momentum measures often fail to capture persistent trends in fixed income and commodity markets. The Tzotchev measure's normalization by volatility and its probabilistic interpretation provide consistent performance across diverse asset classes, as demonstrated in the original J.P. Morgan research.
Comparative performance studies conducted by AQR Capital Management (Asness, Moskowitz, and Pedersen, 2013) in "Value and Momentum Everywhere" show that volatility-adjusted momentum measures significantly outperform traditional price momentum across international equity, bond, commodity, and currency markets. The study documents Sharpe ratio improvements of 0.2 to 0.4 when incorporating volatility normalization, consistent with the theoretical advantages of the Tzotchev approach.
The regime detection capabilities of the Tzotchev measure provide additional advantages over binary trend classification systems. Research by Ang and Bekaert (2002) in "Regime Switches in Interest Rates" demonstrates that financial markets exhibit distinct regime characteristics that traditional indicators fail to capture adequately. The Tzotchev measure's five-tier classification system (Strong Bull, Weak Bull, Neutral, Weak Bear, Strong Bear) provides more nuanced market state identification than simple trend/no-trend binary systems.
Statistical testing by Jegadeesh and Titman (2001) in "Profitability of Momentum Strategies" revealed that traditional momentum indicators suffer from significant parameter instability, with optimal lookback periods varying substantially across market conditions and asset classes. The Tzotchev measure's statistical framework provides more stable parameter selection through its grounding in hypothesis testing theory, reducing the need for frequent parameter optimization that can lead to overfitting.
Advanced Noise Filtering and Market Regime Detection
A significant enhancement over the original Tzotchev methodology is the incorporation of a multi-factor noise filtering system designed to reduce false signals during sideways market conditions. The filtering mechanism employs four distinct approaches: adaptive thresholding based on current market regime strength, volatility-based filtering utilizing ATR percentile analysis, trend strength confirmation through momentum alignment, and a comprehensive multi-factor approach that combines all methodologies.
The adaptive filtering system analyzes market microstructure through price change relative to average true range, calculates volatility percentiles over rolling windows, and assesses trend alignment across multiple timeframes using exponential moving averages of varying periods. This approach addresses one of the primary limitations identified in traditional trend-following systems, namely their tendency to generate excessive false signals during periods of low volatility or sideways price action.
The regime detection component classifies market conditions into five distinct categories: Strong Bull (ST > 0.3), Weak Bull (0.1 < ST ≤ 0.3), Neutral (-0.1 ≤ ST ≤ 0.1), Weak Bear (-0.3 ≤ ST < -0.1), and Strong Bear (ST < -0.3). This classification system provides traders with clear, quantitative definitions of market regimes that can inform position sizing, risk management, and strategy selection decisions.
Professional Implementation and Trading Applications
The indicator incorporates three distinct trading profiles designed to accommodate different investment approaches and risk tolerances. The Conservative profile employs longer lookback periods (63 days), higher signal thresholds (0.2), and reduced filter sensitivity (0.5) to minimize false signals and focus on major trend changes. The Balanced profile utilizes standard academic parameters with moderate settings across all dimensions. The Aggressive profile implements shorter lookback periods (14 days), lower signal thresholds (-0.1), and increased filter sensitivity (1.5) to capture shorter-term trend movements.
Signal generation occurs through threshold crossover analysis, where long signals are generated when the trend measure crosses above the specified threshold and short signals when it crosses below. The implementation includes sophisticated signal confirmation mechanisms that consider trend alignment across multiple timeframes and momentum strength percentiles to reduce the likelihood of false breakouts.
The alert system provides real-time notifications for trend threshold crossovers, strong regime changes, and signal generation events, with configurable frequency controls to prevent notification spam. Alert messages are standardized to ensure consistency across different market conditions and timeframes.
Performance Optimization and Computational Efficiency
The implementation incorporates several performance optimization features designed to handle large datasets efficiently. The maximum bars back parameter allows users to control historical calculation depth, with default settings optimized for most trading applications while providing flexibility for extended historical analysis. The system includes automatic performance monitoring that generates warnings when computational limits are approached.
Error handling mechanisms protect against division by zero conditions, infinite values, and other numerical instabilities that can occur during extreme market conditions. The finite value checking system ensures data integrity throughout the calculation process, with fallback mechanisms that maintain indicator functionality even when encountering corrupted or missing price data.
Timeframe validation provides warnings when the indicator is applied to unsuitable timeframes, as the Tzotchev methodology was specifically designed for daily and higher timeframe analysis. This validation helps prevent misapplication of the indicator in contexts where its statistical assumptions may not hold.
Visual Design and User Interface
The indicator features eight professional color schemes designed for different trading environments and user preferences. The EdgeTools theme provides an institutional blue and steel color palette suitable for professional trading environments. The Gold theme offers warm colors optimized for commodities trading. The Behavioral theme incorporates psychology-based color contrasts that align with behavioral finance principles. The Quant theme provides neutral colors suitable for analytical applications.
Additional specialized themes include Ocean, Fire, Matrix, and Arctic variations, each optimized for specific visual preferences and trading contexts. All color schemes include automatic dark and light mode optimization to ensure optimal readability across different chart backgrounds and trading platforms.
The information table provides real-time display of key metrics including current trend measure value, market regime classification, signal strength, Z-score, average returns, volatility measures, filter threshold levels, and filter effectiveness percentages. This comprehensive dashboard allows traders to monitor all relevant indicator components simultaneously.
Theoretical Implications and Research Context
The Tzotchev Trend Measure addresses several theoretical limitations inherent in traditional technical analysis approaches. Unlike moving average-based systems that rely on price level comparisons, this methodology grounds trend analysis in statistical hypothesis testing, providing a more robust theoretical foundation for trading decisions.
The probabilistic interpretation of trend strength offers significant advantages over binary trend classification systems. Rather than simply indicating whether a trend exists, the measure quantifies the statistical confidence level associated with the trend assessment, allowing for more nuanced risk management and position sizing decisions.
The incorporation of volatility normalization addresses the well-documented problem of volatility clustering in financial time series, ensuring that trend strength assessments remain consistent across different market volatility regimes. This normalization is particularly important for portfolio management applications where consistent risk metrics across different assets and time periods are essential.
Practical Applications and Trading Strategy Integration
The Tzotchev Trend Measure can be effectively integrated into various trading strategies and portfolio management frameworks. For trend-following strategies, the indicator provides clear entry and exit signals with quantified confidence levels. For mean reversion strategies, extreme readings can signal potential turning points. For portfolio allocation, the regime classification system can inform dynamic asset allocation decisions.
The indicator's statistical foundation makes it particularly suitable for quantitative trading strategies where systematic, rules-based approaches are preferred over discretionary decision-making. The standardized output range facilitates easy integration with position sizing algorithms and risk management systems.
Risk management applications benefit from the indicator's ability to quantify trend strength and provide early warning signals of potential trend changes. The multi-timeframe analysis capability allows for the construction of robust risk management frameworks that consider both short-term tactical and long-term strategic market conditions.
Implementation Guide and Parameter Configuration
The practical application of the Tzotchev Trend Measure requires careful parameter configuration to optimize performance for specific trading objectives and market conditions. This section provides comprehensive guidance for parameter selection and indicator customization.
Core Calculation Parameters
The Lookback Period parameter controls the statistical window used for trend calculation and represents the most critical setting for the indicator. Default values range from 14 to 63 trading days, with shorter periods (14-21 days) providing more sensitive trend detection suitable for short-term trading strategies, while longer periods (42-63 days) offer more stable trend identification appropriate for position trading and long-term investment strategies. The parameter directly influences the statistical significance of trend measurements, with longer periods requiring stronger underlying trends to generate significant signals but providing greater reliability in trend identification.
The Price Source parameter determines which price series is used for return calculations. The default close price provides standard trend analysis, while alternative selections such as high-low midpoint ((high + low) / 2) can reduce noise in volatile markets, and volume-weighted average price (VWAP) offers superior trend identification in institutional trading environments where volume concentration matters significantly.
The Signal Threshold parameter establishes the minimum trend strength required for signal generation, with values ranging from -0.5 to 0.5. Conservative threshold settings (0.2 to 0.3) reduce false signals but may miss early trend opportunities, while aggressive settings (-0.1 to 0.1) provide earlier signal generation at the cost of increased false positive rates. The optimal threshold depends on the trader's risk tolerance and the volatility characteristics of the traded instrument.
Trading Profile Configuration
The Trading Profile system provides pre-configured parameter sets optimized for different trading approaches. The Conservative profile employs a 63-day lookback period with a 0.2 signal threshold and 0.5 noise sensitivity, designed for long-term position traders seeking high-probability trend signals with minimal false positives. The Balanced profile uses a 21-day lookback with 0.05 signal threshold and 1.0 noise sensitivity, suitable for swing traders requiring moderate signal frequency with acceptable noise levels. The Aggressive profile implements a 14-day lookback with -0.1 signal threshold and 1.5 noise sensitivity, optimized for day traders and scalpers requiring frequent signal generation despite higher noise levels.
Advanced Noise Filtering System
The noise filtering mechanism addresses the challenge of false signals during sideways market conditions through four distinct methodologies. The Adaptive filter adjusts thresholds based on current trend strength, increasing sensitivity during strong trending periods while raising thresholds during consolidation phases. The Volatility-based filter utilizes Average True Range (ATR) percentile analysis to suppress signals during abnormally volatile conditions that typically generate false trend indications.
The Trend Strength filter requires alignment between multiple momentum indicators before confirming signals, reducing the probability of false breakouts from consolidation patterns. The Multi-factor approach combines all filtering methodologies using weighted scoring to provide the most robust noise reduction while maintaining signal responsiveness during genuine trend initiations.
The Noise Sensitivity parameter controls the aggressiveness of the filtering system, with lower values (0.5-1.0) providing conservative filtering suitable for volatile instruments, while higher values (1.5-2.0) allow more signals through but may increase false positive rates during choppy market conditions.
Visual Customization and Display Options
The Color Scheme parameter offers eight professional visualization options designed for different analytical preferences and market conditions. The EdgeTools scheme provides high contrast visualization optimized for trend strength differentiation, while the Gold scheme offers warm tones suitable for commodity analysis. The Behavioral scheme uses psychological color associations to enhance decision-making speed, and the Quant scheme provides neutral colors appropriate for quantitative analysis environments.
The Ocean, Fire, Matrix, and Arctic schemes offer additional aesthetic options while maintaining analytical functionality. Each scheme includes optimized colors for both light and dark chart backgrounds, ensuring visibility across different trading platform configurations.
The Show Glow Effects parameter enhances plot visibility through multiple layered lines with progressive transparency, particularly useful when analyzing multiple timeframes simultaneously or when working with dense price data that might obscure trend signals.
Performance Optimization Settings
The Maximum Bars Back parameter controls the historical data depth available for calculations, with values ranging from 5,000 to 50,000 bars. Higher values enable analysis of longer-term trend patterns but may impact indicator loading speed on slower systems or when applied to multiple instruments simultaneously. The optimal setting depends on the intended analysis timeframe and available computational resources.
The Calculate on Every Tick parameter determines whether the indicator updates with every price change or only at bar close. Real-time calculation provides immediate signal updates suitable for scalping and day trading strategies, while bar-close calculation reduces computational overhead and eliminates signal flickering during bar formation, preferred for swing trading and position management applications.
Alert System Configuration
The Alert Frequency parameter controls notification generation, with options for all signals, bar close only, or once per bar. High-frequency trading strategies benefit from all signals mode, while position traders typically prefer bar close alerts to avoid premature position entries based on intrabar fluctuations.
The alert system generates four distinct notification types: Long Signal alerts when the trend measure crosses above the positive signal threshold, Short Signal alerts for negative threshold crossings, Bull Regime alerts when entering strong bullish conditions, and Bear Regime alerts for strong bearish regime identification.
Table Display and Information Management
The information table provides real-time statistical metrics including current trend value, regime classification, signal status, and filter effectiveness measurements. The table position can be customized for optimal screen real estate utilization, and individual metrics can be toggled based on analytical requirements.
The Language parameter supports both English and German display options for international users, while maintaining consistent calculation methodology regardless of display language selection.
Risk Management Integration
Effective risk management integration requires coordination between the trend measure signals and position sizing algorithms. Strong trend readings (above 0.5 or below -0.5) support larger position sizes due to higher probability of trend continuation, while neutral readings (between -0.2 and 0.2) suggest reduced position sizes or range-trading strategies.
The regime classification system provides additional risk management context, with Strong Bull and Strong Bear regimes supporting trend-following strategies, while Neutral regimes indicate potential for mean reversion approaches. The filter effectiveness metric helps traders assess current market conditions and adjust strategy parameters accordingly.
Timeframe Considerations and Multi-Timeframe Analysis
The indicator's effectiveness varies across different timeframes, with higher timeframes (daily, weekly) providing more reliable trend identification but slower signal generation, while lower timeframes (hourly, 15-minute) offer faster signals with increased noise levels. Multi-timeframe analysis combining trend alignment across multiple periods significantly improves signal quality and reduces false positive rates.
For optimal results, traders should consider trend alignment between the primary trading timeframe and at least one higher timeframe before entering positions. Divergences between timeframes often signal potential trend reversals or consolidation periods requiring strategy adjustment.
Conclusion
The Tzotchev Trend Measure represents a significant advancement in technical analysis methodology, combining rigorous statistical foundations with practical trading applications. Its implementation of the J.P. Morgan research methodology provides institutional-quality trend analysis capabilities previously available only to sophisticated quantitative trading firms.
The comprehensive parameter configuration options enable customization for diverse trading styles and market conditions, while the advanced noise filtering and regime detection capabilities provide superior signal quality compared to traditional trend-following indicators. Proper parameter selection and understanding of the indicator's statistical foundation are essential for achieving optimal trading results and effective risk management.
References
Abramowitz, M. and Stegun, I.A. (1964). Handbook of Mathematical Functions with Formulas, Graphs, and Mathematical Tables. Washington: National Bureau of Standards.
Ang, A. and Bekaert, G. (2002). Regime Switches in Interest Rates. Journal of Business and Economic Statistics, 20(2), 163-182.
Asness, C.S., Moskowitz, T.J., and Pedersen, L.H. (2013). Value and Momentum Everywhere. Journal of Finance, 68(3), 929-985.
Bollinger, J. (2001). Bollinger on Bollinger Bands. New York: McGraw-Hill.
Fama, E.F. and French, K.R. (1988). Permanent and Temporary Components of Stock Prices. Journal of Political Economy, 96(2), 246-273.
Hurst, B., Ooi, Y.H., and Pedersen, L.H. (2013). Demystifying Managed Futures. Journal of Investment Management, 11(3), 42-58.
Jegadeesh, N. and Titman, S. (2001). Profitability of Momentum Strategies: An Evaluation of Alternative Explanations. Journal of Finance, 56(2), 699-720.
Kaufman, P.J. (2013). Trading Systems and Methods. 5th Edition. Hoboken: John Wiley & Sons.
Moskowitz, T.J., Ooi, Y.H., and Pedersen, L.H. (2012). Time Series Momentum. Journal of Financial Economics, 104(2), 228-250.
Tzotchev, D., Lo, A.W., and Hasanhodzic, J. (2015). Designing robust trend-following system: Behind the scenes of trend-following. J.P. Morgan Quantitative Research, Asset Management Division.

Adaptive Trend Following Suite [Alpha Extract]A sophisticated multi-filter trend analysis system that combines advanced noise reduction, adaptive moving averages, and intelligent market structure detection to deliver institutional-grade trend following signals. Utilizing cutting-edge mathematical algorithms and dynamic channel adaptation, this indicator provides crystal-clear directional guidance with real-time confidence scoring and market mode classification for professional trading execution.
🔶 Advanced Noise Reduction
Filter Eliminates market noise using sophisticated Gaussian filtering with configurable sigma values and period optimization. The system applies mathematical weight distribution across price data to ensure clean signal generation while preserving critical trend information, automatically adjusting filter strength based on volatility conditions.
advancedNoiseFilter(sourceData, filterLength, sigmaParam) =>
weightSum = 0.0
valueSum = 0.0
centerPoint = (filterLength - 1) / 2
for index = 0 to filterLength - 1
gaussianWeight = math.exp(-0.5 * math.pow((index - centerPoint) / sigmaParam, 2))
weightSum += gaussianWeight
valueSum += sourceData * gaussianWeight
valueSum / weightSum
🔶 Adaptive Moving Average Core Engine
Features revolutionary volatility-responsive averaging that automatically adjusts smoothing parameters based on real-time market conditions. The engine calculates adaptive power factors using logarithmic scaling and bandwidth optimization, ensuring optimal responsiveness during trending markets while maintaining stability during consolidation phases.
// Calculate adaptive parameters
adaptiveLength = (periodLength - 1) / 2
logFactor = math.max(math.log(math.sqrt(adaptiveLength)) / math.log(2) + 2, 0)
powerFactor = math.max(logFactor - 2, 0.5)
relativeVol = avgVolatility != 0 ? volatilityMeasure / avgVolatility : 0
adaptivePower = math.pow(relativeVol, powerFactor)
bandwidthFactor = math.sqrt(adaptiveLength) * logFactor
🔶 Intelligent Market Structure Analysis
Employs fractal dimension calculations to classify market conditions as trending or ranging with mathematical precision. The system analyzes price path complexity using normalized data arrays and geometric path length calculations, providing quantitative market mode identification with configurable threshold sensitivity.
🔶 Multi-Component Momentum Analysis
Integrates RSI and CCI oscillators with advanced Z-score normalization for statistical significance testing. Each momentum component receives independent analysis with customizable periods and significance levels, creating a robust consensus system that filters false signals while maintaining sensitivity to genuine momentum shifts.
// Z-score momentum analysis
rsiAverage = ta.sma(rsiComponent, zAnalysisPeriod)
rsiDeviation = ta.stdev(rsiComponent, zAnalysisPeriod)
rsiZScore = (rsiComponent - rsiAverage) / rsiDeviation
if math.abs(rsiZScore) > zSignificanceLevel
rsiMomentumSignal := rsiComponent > 50 ? 1 : rsiComponent < 50 ? -1 : rsiMomentumSignal
❓How It Works
🔶 Dynamic Channel Configuration
Calculates adaptive channel boundaries using three distinct methodologies: ATR-based volatility, Standard Deviation, and advanced Gaussian Deviation analysis. The system automatically adjusts channel multipliers based on market structure classification, applying tighter channels during trending conditions and wider boundaries during ranging markets for optimal signal accuracy.
dynamicChannelEngine(baselineData, channelLength, methodType) =>
switch methodType
"ATR" => ta.atr(channelLength)
"Standard Deviation" => ta.stdev(baselineData, channelLength)
"Gaussian Deviation" =>
weightArray = array.new_float()
totalWeight = 0.0
for i = 0 to channelLength - 1
gaussWeight = math.exp(-math.pow((i / channelLength) / 2, 2))
weightedVariance += math.pow(deviation, 2) * array.get(weightArray, i)
math.sqrt(weightedVariance / totalWeight)
🔶 Signal Processing Pipeline
Executes a sophisticated 10-step signal generation process including noise filtering, trend reference calculation, structure analysis, momentum component processing, channel boundary determination, trend direction assessment, consensus calculation, confidence scoring, and final signal generation with quality control validation.
🔶 Confidence Transformation System
Applies sigmoid transformation functions to raw confidence scores, providing 0-1 normalized confidence ratings with configurable threshold controls. The system uses steepness parameters and center point adjustments to fine-tune signal sensitivity while maintaining statistical robustness across different market conditions.
🔶 Enhanced Visual Presentation
Features dynamic color-coded trend lines with adaptive channel fills, enhanced candlestick visualization, and intelligent price-trend relationship mapping. The system provides real-time visual feedback through gradient fills and transparency adjustments that immediately communicate trend strength and direction changes.
🔶 Real-Time Information Dashboard
Displays critical trading metrics including market mode classification (Trending/Ranging), structure complexity values, confidence scores, and current signal status. The dashboard updates in real-time with color-coded indicators and numerical precision for instant market condition assessment.
🔶 Intelligent Alert System
Generates three distinct alert types: Bullish Signal alerts for uptrend confirmations, Bearish Signal alerts for downtrend confirmations, and Mode Change alerts for market structure transitions. Each alert includes detailed messaging and timestamp information for comprehensive trade management integration.
🔶 Performance Optimization
Utilizes efficient array management and conditional processing to maintain smooth operation across all timeframes. The system employs strategic variable caching, optimized loop structures, and intelligent update mechanisms to ensure consistent performance even during high-volatility market conditions.
This indicator delivers institutional-grade trend analysis through sophisticated mathematical modelling and multi-stage signal processing. By combining advanced noise reduction, adaptive averaging, intelligent structure analysis, and robust momentum confirmation with dynamic channel adaptation, it provides traders with unparalleled trend following precision. The comprehensive confidence scoring system and real-time market mode classification make it an essential tool for professional traders seeking consistent, high-probability trend following opportunities with mathematical certainty and visual clarity.

Draw Trend LinesSometimes the simplest indicators help traders make better decisions. This indicator draws simple trend lines, the same lines you would draw manually.
To trade with an edge, traders need to interpret the recent price action, whether it's noisy or choppy, or it's trending. Trend Lines will help traders with that interpretation.
The lines drawn are:
1. lower tops
2. higher bottoms
Because trends are defined as higher lows, or lower highs.
When you see "Wedges", formed by prices chopping between top and bottom trend lines, that's noisy environment not to be traded. When you learn to "stop yourself", you already have an edge.
Often when you see a trend, it's still not too late. Trend will continue until it doesn't. But the caveat is a very steep trend is unlikely to continue, because buying volume is extremely unbalanced to cause the steep trend, and that volume will run out of energy. (Same on the sell side of course)
Trends can reverse, and when price action breaks the trend line, Breakout/Breakdown traders can take this as an entry signal.
Enjoy, and good trading!

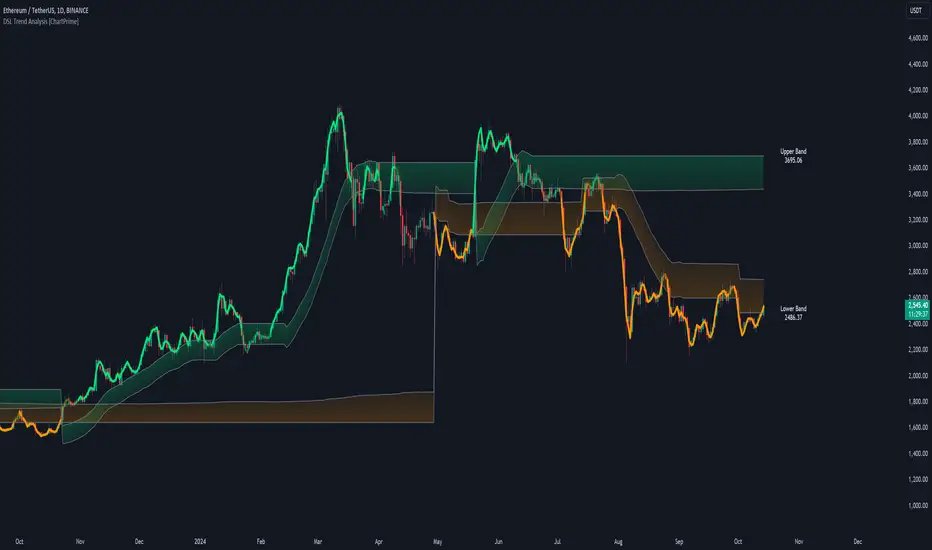
Trend Band Oscillator📌 Trend Band Oscillator
📄 Description
Trend Band Oscillator is a momentum-based trend indicator that calculates the spread between two EMAs and overlays it with a volatility filter using a standard deviation band. It helps traders visualize not only the trend direction but also the strength and stability of the trend.
📌 Features
🔹 EMA Spread Calculation: Measures the difference between a fast and slow EMA to quantify short-term vs mid-term trend dynamics.
🔹 Volatility Band Overlay: Applies an EMA of standard deviation to the spread to filter noise and highlight valid momentum shifts.
🔹 Color-Based Visualization: Positive spread values are shown in lime (bullish), negative values in fuchsia (bearish) for quick directional insight.
🔹 Upper/Lower Bands: Help detect potential overbought/oversold conditions or strong trend continuation.
🔹 Zero Line Reference: A horizontal baseline at zero helps identify trend reversals and neutral zones.
🛠️ How to Use
✅ Spread > 0: Indicates a bullish trend. Consider maintaining or entering long positions.
✅ Spread < 0: Indicates a bearish trend. Consider maintaining or entering short positions.
⚠️ Spread exceeds bands: May signal overextension or strong momentum; consider using with additional confirmation indicators.
🔄 Band convergence: Suggests weakening trend and potential transition to a ranging market.
Recommended timeframes: 1H, 4H, Daily
Suggested complementary indicators: RSI, MACD, OBV, SuperTrend
✅ TradingView House Rules Compliance
This script is open-source and published under Pine Script v5.
It does not repaint, spam alerts, or cause performance issues.
It is designed as an analytical aid only and should not be considered financial advice.
All calculations are transparent, and no external data sources or insecure functions are used.
====================================================================
📌 Trend Band Oscillator
📄 설명 (Description)
Trend Band Oscillator는 두 개의 EMA 간 스프레드(차이)를 기반으로 한 모멘텀 중심의 추세 오실레이터입니다. 여기에 표준편차 기반의 변동성 밴드를 적용하여, 추세의 방향뿐 아니라 강도와 안정성까지 시각적으로 분석할 수 있도록 설계되었습니다.
📌 주요 특징 (Features)
🔹 EMA 기반 스프레드 계산: Fast EMA와 Slow EMA의 차이를 활용해 시장 추세를 정량적으로 표현합니다.
🔹 표준편차 필터링: Spread에 대해 EMA 및 표준편차 기반의 밴드를 적용해 노이즈를 줄이고 유효한 추세를 강조합니다.
🔹 컬러 기반 시각화: 오실레이터 값이 양수일 경우 초록색, 음수일 경우 마젠타 색으로 추세 방향을 직관적으로 파악할 수 있습니다.
🔹 밴드 범위 시각화: 상·하위 밴드를 통해 스프레드의 평균 편차 범위를 보여주며, 추세의 강약과 포화 여부를 진단할 수 있습니다.
🔹 제로 라인 표시: 추세 전환 가능 지점을 시각적으로 확인할 수 있도록 중심선(0선)을 제공합니다.
🛠️ 사용법 (How to Use)
✅ 오실레이터가 0 이상 유지: 상승 추세 구간이며, 롱 포지션 유지 또는 진입 검토
✅ 오실레이터가 0 이하 유지: 하락 추세 구간이며, 숏 포지션 유지 또는 진입 검토
⚠️ 상·하위 밴드를 이탈: 일시적인 과매수/과매도 혹은 강한 추세 발현 가능성 있음 → 다른 보조지표와 함께 필터링 권장
🔄 밴드 수렴: 추세가 약해지고 있음을 나타냄 → 변동성 하락 또는 방향성 상실 가능성 있음
권장 적용 시간대: 1시간봉, 4시간봉, 일봉
보조 적용 지표: RSI, MACD, OBV, SuperTrend 등과 함께 사용 시 신호 필터링에 유리
✅ 트레이딩뷰 하우스룰 준수사항 (TV House Rules Compliance)
이 지표는 **무료 공개용(Open-Source)**이며, Pine Script Version 5로 작성되어 있습니다.
과도한 리페인트, 비정상적 반복 경고(alert spam), 실시간 성능 저하 등의 요소는 포함되어 있지 않습니다.
사용자는 본 지표를 투자 결정의 참고용 보조 도구로 활용해야 하며, 독립적인 매매 판단이 필요합니다.
데이터 소스 및 계산 방식은 완전히 공개되어 있으며, 외부 API나 보안 취약점을 유발하는 구성 요소는 없습니다.

Two Poles Trend Finder MTF [BigBeluga]🔵 OVERVIEW
Two Poles Trend Finder MTF is a refined trend-following overlay that blends a two-pole Gaussian filter with a multi-timeframe dashboard. It provides a smooth view of price dynamics along with a clear summary of trend directions across multiple timeframes—perfect for traders seeking alignment between short and long-term momentum.
🔵 CONCEPTS
Two-Pole Filter: A smoothing algorithm that responds faster than traditional moving averages but avoids the noise of short-term fluctuations.
var float f = na
var float f_prev1 = na
var float f_prev2 = na
// Apply two-pole Gaussian filter
if bar_index >= 2
f := math.pow(alpha, 2) * source + 2 * (1 - alpha) * f_prev1 - math.pow(1 - alpha, 2) * f_prev2
else
f := source // Warm-up for first bars
// Shift state
f_prev2 := f_prev1
f_prev1 := f
Trend Detection Logic: Trend direction is determined by comparing the current filtered value with its value n bars ago (shifted comparison).
MTF Alignment Dashboard: Trends from 5 configurable timeframes are monitored and visualized as colored boxes:
• Green = Uptrend
• Magenta = Downtrend
Summary Arrow: An average trend score from all timeframes is used to plot an overall arrow next to the asset name.
🔵 FEATURES
Two-Pole Gaussian Filter offers ultra-smooth trend curves while maintaining responsiveness.
Multi-Timeframe Trend Detection:
• Default: 1H, 2H, 4H, 12H, 1D (fully customizable)
• Each timeframe is assessed independently using the same trend logic.
Visual Trend Dashboard positioned at the bottom-right of the chart with color-coded trend blocks.
Dynamic Summary Arrow shows overall market bias (🢁 / 🢃) based on majority of uptrends/downtrends.
Bold + wide trail plot for the filter value with gradient coloring based on directional bias.
🔵 HOW TO USE
Use the multi-timeframe dashboard to identify aligned trends across your preferred trading horizons.
Confirm trend strength or weakness by observing filter slope direction .
Look for dashboard consensus (e.g., 4 or more timeframes green] ) as confirmation for breakout, continuation, or trend reentry strategies.
Combine with volume or price structure to enhance entry timing.
🔵 CONCLUSION
Two Poles Trend Finder MTF delivers a clean and intuitive trend-following solution with built-in multi-timeframe awareness. Whether you’re trading intra-day or positioning for swing setups, this tool helps filter out market noise and keeps you focused on directional consensus.

EMA Trend Dashboard
Trend Indicator using 3 custom EMA lines. Displays a table with 5 rows(position configurable)
-First line shows relative position of EMA lines to each other and outputs Bull, Weak Bull, Flat, Weak Bear, or Bear. EMA line1 should be less than EMA line2 and EMA line 2 should be less than EMA line3. Default is 9,21,50.
-Second through fourth line shows the slant of each EMA line. Up, Down, or Flat. Threshold for what is considered a slant is configurable. Also added a "steep" threshold configuration for steep slants.
-Fifth line shows exhaustion and is a simple, configurable calculation of the distance between EMA line1 and EMA line2.
--Lines one and five change depending on its value but ALL other colors are able to be changed.
--Default is somewhat set to work well with Micro E-mini Futures but this indicator can be changed to work on anything. I created it to help get a quick overview of short-term trend on futures. I used ChatGPT to help but I am still not sure if it actually took longer because of it.

Multi-Timeframe Trend Lines📌 What This Indicator Does
This tool helps you see the direction of the market across different timeframes—all on one chart.
Imagine you're looking at the price of a stock, crypto, or any other asset. You probably know the price can move differently in the short term and the long term. This indicator draws slanted lines to show if the price is generally going up or down over different time periods—like the past 1 minute, 5 minutes, 1 hour, 1 day, or even 1 month.
These lines are colored:
Green if the price is going up (a rising trend).
Red if the price is going down (a falling trend).
You can choose which timeframes you want to see—like 5 minutes or 1 day—by ticking checkboxes.
✅ Why This Is Useful
1. Helps You See the Bigger Picture
Even if you’re trading on a short timeframe (like 5 minutes), this indicator shows you the trend in longer timeframes (like 1 hour or 1 day). This helps you avoid going against the overall direction of the market.
2. Gives You More Confidence
When several timeframes show the same direction (all lines green, for example), it gives you more confidence that the trend is strong.
3. Saves Time
Instead of switching between different charts (like going from a 1-hour chart to a daily chart), you can see all the trends right on your current chart.
4. Easier Decision Making
You can quickly decide if it’s a good idea to buy (when most lines are green) or sell (when most lines are red).
👶 Example for a Beginner
Let’s say you’re looking at a 15-minute chart and thinking of buying.
* The 15-minute line is green (short-term price is going up).
* The 1-hour line is also green (medium-term price is going up).
* The 1-day line is green too (long-term price is going up).
This is a good sign that everything is moving upward, and it may be safer to buy.
But if the 1-day line is red while the shorter ones are green, it might mean the upward move is just temporary. That’s something to be careful about.

Trend Table ZeeZeeMonMulti-Timeframe Trend Indicator
Overview
This indicator identifies trends across multiple higher timeframes and displays them in a widget on the right side of the chart. It serves as an alternative trend-filtering tool, helping traders align with the dominant market direction. Unlike traditional moving average-based trend detection (e.g., price above/below a 200 MA), this indicator assesses whether higher timeframes are genuinely trending by analyzing swing highs and lows.
Trend Definition
Uptrend: Higher highs and higher lows.
Downtrend: Lower highs and lower lows.
A trend reversal occurs when a prior high/low is breached (e.g., in a downtrend, breaking the last high signals an uptrend).
Customization Options
Lookback Period: Adjusts the sensitivity for identifying swing highs/lows (pivot points). A shorter lookback detects more frequent pivots.
Historical Pivot Visibility: Toggle to display past swing highs/lows for verification.
Support/Resistance Lines: Show dynamic levels from recent pivots on higher timeframes. Breaching these lines indicates potential trend changes.
Purpose
Helps traders:
Confirm higher timeframe trends before entering trades.
Monitor proximity to trend reversals.
Fine-tune pivot sensitivity for optimal trend detection.
Note: Works best as a supplementary trend filter alongside other trading strategies.

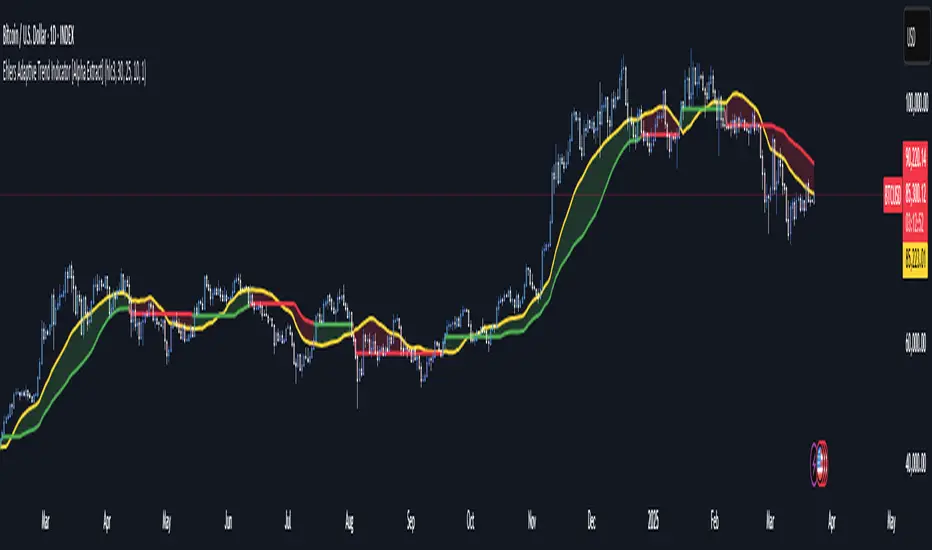
Ehlers Adaptive Trend Indicator [Alpha Extract]Ehlers Adaptive Trend Indicator
The Ehlers Adaptive Trend Indicator combines Ehlers' advanced digital signal processing techniques with dynamic volatility bands to identify robust trend conditions and potential reversals. This powerful tool helps traders visualize trend strength, adaptive support/resistance levels, and momentum shifts across various market conditions.
🔶 CALCULATION
The indicator employs a sophisticated adaptive algorithm that responds to changing market conditions:
• Ehlers Filter : Calculates a weighted average based on momentum differences to create an adaptive trend baseline.
• Dynamic Bands : Volatility-adjusted bands that expand and contract based on recent price action.
• Trend Level : A dynamic support/resistance level that adapts to the current trend direction.
• Smoothed Volatility : Market volatility measured and smoothed to provide reliable band width.
Formula:
• Ehlers Basis = Weighted average of price, with weights determined by momentum differences
• Volatility = Standard deviation of price over Ehlers Length period
• Smoothed Volatility = EMA of volatility over Smoothing Length
• Upper Band = Ehlers Basis + Smoothed Volatility × Sensitivity
• Lower Band = Ehlers Basis - Smoothed Volatility × Sensitivity
• Trend Level = Adaptive support in uptrends, resistance in downtrends
🔶 DETAILS
Visual Features :
• Ehlers Basis Line (Yellow): The core adaptive trend reference that serves as the primary trend indicator.
• Trend Level Line (Dynamic Color): Changes between green (bullish) and red (bearish) based on the current trend state.
• Fill Areas : Transparent green fill during bullish trends and transparent red fill during bearish trends for clear visual identification.
• Bar Coloring : Optional price bar coloring that reflects the current trend direction for enhanced visualization.
Interpretation :
• **Bullish Signal**: Price crosses above the upper band, triggering a trend change with the Trend Level becoming dynamic support.
• **Bearish Signal**: Price drops below the lower band, confirming a trend change with the Trend Level becoming dynamic resistance.
• **Trend Continuation**: Trend Level rises in bullish markets and falls in bearish markets, providing adaptive trailing support/resistance.
🔶 EXAMPLES
The chart demonstrates:
• Bullish Trend Identification : When price breaks above the upper band, the indicator shifts to bullish mode with green trend level and fill.
• Bearish Trend Identification : When price falls below the lower band, the indicator shifts to bearish mode with red trend level and fill.
• Trend Persistence : Trend Level adapts to market movement, rising during uptrends to provide dynamic support and falling during downtrends to act as resistance.
Example Snapshots :
• During a strong uptrend, the Trend Level continuously adjusts upward, keeping traders in the trend while filtering out minor retracements.
• During trend reversals, clear color changes and Trend Level shifts provide early warning of potential direction changes.
🔶 SETTINGS
Customization Options :
• Ehlers Length (p1) (Default: 30): Controls the primary adaptive calculation period, balancing responsiveness with stability.
• Momentum Length (p2) (Default: 25): Determines the lag for momentum calculations used in the adaptive weighting.
• Smoothing Length (Default: 10): Adjusts the volatility smoothing period—higher values provide more stable bands.
• Sensitivity (Default: 1.0): Multiplier for band width—higher values increase distance between bands, lower values tighten them.
• Visual Settings : Customizable colors for bullish and bearish trends, basis line, and optional bar coloring.
The Ehlers Adaptive Trend Indicator combines John Ehlers' digital signal processing expertise with modern volatility analysis to create a robust trend-following system that adapts to changing market conditions, helping traders stay on the right side of the market.
Gradient Trend Filter STRATEGY [ChartPrime/PineIndicators]This strategy is based on the Gradient Trend Filter indicator developed by ChartPrime. Full credit for the concept and indicator goes to ChartPrime.
The Gradient Trend Filter Strategy is designed to execute trades based on the trend analysis and filtering system provided by the Gradient Trend Filter indicator. It integrates a noise-filtered trend detection system with a color-gradient visualization, helping traders identify trend strength, momentum shifts, and potential reversals.
How the Gradient Trend Filter Strategy Works
1. Noise Filtering for Smoother Trends
To reduce false signals caused by market noise, the strategy applies a three-stage smoothing function to the source price. This function ensures that trend shifts are detected more accurately, minimizing unnecessary trade entries and exits.
The filter is based on an Exponential Moving Average (EMA)-style smoothing technique.
It processes price data in three successive passes, refining the trend signal before generating trade entries.
This filtering technique helps eliminate minor fluctuations and highlights the true underlying trend.
2. Multi-Layered Trend Bands & Color-Based Trend Visualization
The Gradient Trend Filter constructs multiple trend bands around the filtered trend line, acting as dynamic support and resistance zones.
The mid-line changes color based on the trend direction:
Green for uptrends
Red for downtrends
A gradient cloud is formed around the trend line, dynamically shifting colors to provide early warning signals of trend reversals.
The outer bands function as potential support and resistance, helping traders determine stop-loss and take-profit zones.
Visualization elements used in this strategy:
Trend Filter Line → Changes color between green (bullish) and red (bearish).
Trend Cloud → Dynamically adjusts color based on trend strength.
Orange Markers → Appear when a trend shift is confirmed.
Trade Entry & Exit Conditions
This strategy automatically enters trades based on confirmed trend shifts detected by the Gradient Trend Filter.
1. Trade Entry Rules
Long Entry:
A bullish trend shift is detected (trend direction changes to green).
The filtered trend value crosses above zero, confirming upward momentum.
The strategy enters a long position.
Short Entry:
A bearish trend shift is detected (trend direction changes to red).
The filtered trend value crosses below zero, confirming downward momentum.
The strategy enters a short position.
2. Trade Exit Rules
Closing a Long Position:
If a bearish trend shift occurs, the strategy closes the long position.
Closing a Short Position:
If a bullish trend shift occurs, the strategy closes the short position.
The trend shift markers (orange diamonds) act as a confirmation signal, reinforcing the validity of trade entries and exits.
Customization Options
This strategy allows traders to adjust key parameters for flexibility in different market conditions:
Trade Direction: Choose between Long Only, Short Only, or Long & Short .
Trend Length: Modify the length of the smoothing function to adapt to different timeframes.
Line Width & Colors: Customize the visual appearance of trend lines and cloud colors.
Performance Table: Enable or disable the equity performance table that tracks historical trade results.
Performance Tracking & Reporting
A built-in performance table is included to monitor monthly and yearly trading performance.
The table calculates monthly percentage returns, displaying them in a structured format.
Color-coded values highlight profitable months (blue) and losing months (red).
Tracks yearly cumulative performance to assess long-term strategy effectiveness.
Traders can use this feature to evaluate historical performance trends and optimize their strategy settings accordingly.
How to Use This Strategy
Identify Trend Strength & Reversals:
Use the trend line and cloud color changes to assess trend strength and detect potential reversals.
Monitor Momentum Shifts:
Pay attention to gradient cloud color shifts, as they often appear before the trend line changes color.
This can indicate early momentum weakening or strengthening.
Act on Trend Shift Markers:
Use orange diamonds as confirmation signals for trend shifts and trade entry/exit points.
Utilize Cloud Bands as Support/Resistance:
The outer bands of the cloud serve as dynamic support and resistance, helping with stop-loss and take-profit placement.
Considerations & Limitations
Trend Lag: Since the strategy applies a smoothing function, entries may be slightly delayed compared to raw price action.
Volatile Market Conditions: In high-volatility markets, trend shifts may occur more frequently, leading to higher trade frequency.
Optimized for Trend Trading: This strategy is best suited for trending markets and may produce false signals in sideways (ranging) conditions.
Conclusion
The Gradient Trend Filter Strategy is a trend-following system based on the Gradient Trend Filter indicator by ChartPrime. It integrates noise filtering, trend visualization, and gradient-based color shifts to help traders identify strong market trends and potential reversals.
By combining trend filtering with a multi-layered cloud system, the strategy provides clear trade signals while minimizing noise. Traders can use this strategy for long-term trend trading, momentum shifts, and support/resistance-based decision-making.
This strategy is a fully automated system that allows traders to execute long, short, or both directions, with customizable settings to adapt to different market conditions.
Credit for the original concept and indicator goes to ChartPrime.

Market Trend Levels Detector [BigBeluga]Market Trend Levels Detector is an trend-following tool that utilizes moving average crossovers to identify key market trend levels. By detecting local highs and lows after EMA crossovers, the indicator helps traders track significant price zones and trend strength.
🔵 Key Features:
EMA Crossover-Based Trend Levels Detection:
Uses a fast and slow EMA to detect market flow shifts.
When the fast EMA crosses under the slow EMA, the indicator searches for the most recent local top and marks it with a label and horizontal level.
When the fast EMA crosses over the slow EMA, it searches for the most recent local low and marks it accordingly.
Dynamic Zone Levels:
Each detected high or low is plotted as a horizontal level, highlighting important price zones.
Traders can extend these levels to observe how price interacts with them over time.
If price crosses a level, its extension stops. Uncrossed levels continue expanding.
Gradient Trend Band Visualization:
The trend band is formed by shading the area between the two EMAs.
Color intensity varies based on volatility and trend strength.
Strong trends and high volatility areas appear with more intense colors, making trend shifts visually distinct.
🔵 Usage:
Trend Identification: Use EMA crossovers and trend bands to confirm bullish or bearish momentum.
Key Zone Mapping: Observe local high/low levels to track historical reaction points.
Breakout & Rejection Signals: Monitor price interactions with extended levels to assess potential breakouts or reversals.
Volatility Strength Analysis: Use color intensity in the trend band to gauge trend power and possible exhaustion points.
Scalping & Swing Trading: Ideal for both short-term scalping strategies and larger swing trade setups.
Market Trend Levels Detector is a must-have tool for traders looking to track market flow, key price levels, and trend momentum with dynamic visual cues. It provides a comprehensive approach to identifying high-probability trade setups using EMA-based flow detection and trend analysis.

MT-Trend Zone IdentifierTrend Zone Identifier – A Dynamic Market Trend Mapping Tool
Overview
The Trend Zone Identifier is an advanced TradingView indicator that helps traders visualize different market trend phases. By leveraging Pivot Points, Moving Averages (MA), ADX (Average Directional Index), and Retest Confirmation, this tool identifies uptrend, downtrend, and ranging (sideways) conditions dynamically.
This indicator is designed to segment the market into clear trend zones, allowing traders to distinguish between confirmed trends, trend transitions (pending zones), and ranging markets. It provides an intuitive visual overlay to enhance market structure analysis and assist in decision-making.
Key Features
✔ Trend Zone Identification – Classifies price action into Uptrend (Green), Downtrend (Red), Pending Confirmation (Light Colors), and Sideways Market (Gray/Neutral)
✔ Pivot-Based Breakout & Breakdown Detection – Uses pivot highs/lows to determine trend shifts
✔ Moving Average & ADX Validation – Ensures the trend is backed by MA structure and ADX trend strength
✔ Pullback Confirmation – Allows trend confirmation based on price retesting key levels
✔ Extreme Volatility & Gaps Filtering – Optional ATR-based extreme movement filtering to avoid false signals
✔ Multi-Timeframe Support – Option to integrate higher timeframe trend validation
✔ Customizable Sensitivity – Fine-tune MA smoothing, ADX thresholds, pivot detection, and pullback range
How It Works
1. Trend Classification
• Uptrend (Green): Price is above a key MA, ADX confirms strength, and a pivot breakout occurs
• Downtrend (Red): Price is below a key MA, ADX confirms strength, and a pivot breakdown occurs
• Pending Trend (Light Colors): Initial trend breakout or breakdown is detected but requires further confirmation
• Sideways/Ranging (Gray): ADX signals a weak trend, and price remains within a neutral zone
2. Retest & Confirmation Logic
• A trend is only confirmed after a breakout or breakdown followed by a successful retest
• If the market fails the retest, the indicator resets to a neutral state
3. Custom Filters for Optimization
• Enable or disable volume filtering for confirmation
• Adjust pivot sensitivity to detect major or minor swing points
• Choose to require consecutive bars confirming the breakout/breakdown
Ideal Use Cases
🔹 Swing traders who want to capture trend transitions early
🔹 Trend-following traders who rely on confirmed market cycles
🔹 Range traders looking to identify sideways market zones
🔹 Algorithmic traders who need clean trend segmentation for automated strategies
Final Thoughts
The Trend Zone Identifier is a versatile market structure indicator that helps traders define trend cycles visually and avoid trading against weak trends. By providing clear breakout, breakdown, and retest conditions, it enhances market clarity and reduces decision-making errors.
➡ Add this to your TradingView workspace and start analyzing market trends like a pro! 🚀
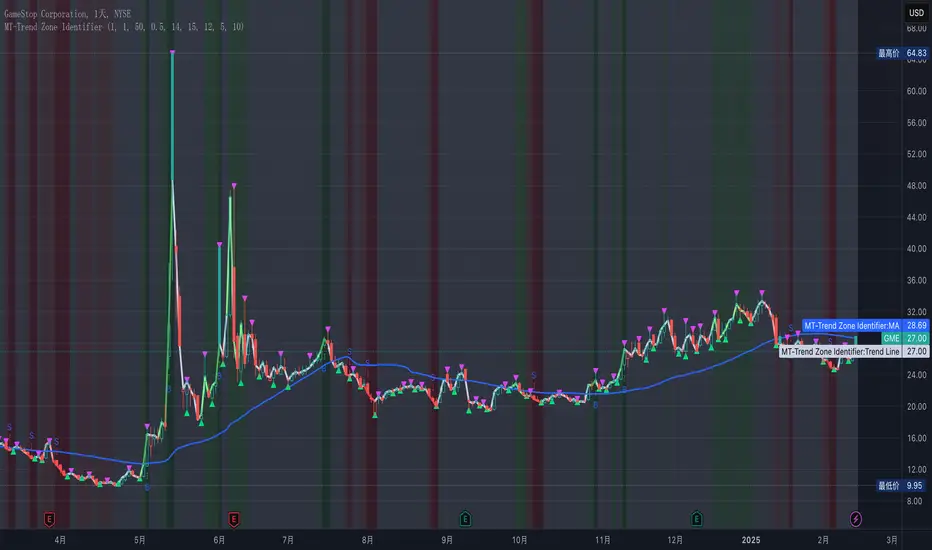
Trend Strength/DirectionThis is a really good, though complex indicator, so I will add two different explanations so to appease both the laymen and those who take the time to read thoroughly.
Simple Explanation
This indicator utilizes 6HMA's to display their angles
The greater the angle ---> the stronger the trend
If more angles are positive, then trend is very strong
If more are negative, then very negative
Comprehensive Explanation
6 angles, each of a different time frame are used to represent direction and trend strength. Angles are used because they intrinsically represent momentum and speed. An angle of 45 represents a perfect balance between something that can cover the furthest distance without compensating for speed. 1 of the 6 angles is intended(though customizable) to represent the 5 hma's angle. This is because the 5hma is very good at representing very near term price action.
Angle Levels
Its important to understand what the angle levels mean for the underlying hma's. The 0 level represents a hma that is horizontal. This is important because this is the point at which it decides to be bullish or bearish. +/- 45, as noted before, represent bullishness/bearishness that represent strong trends without compensating for speed. A continuous increase/decrease and or a cross of these levels generally indicate significant change in sentiment, of which trades may be taken.
Strategy
You should weigh your decision by those angles that represent the longer time frame. If more angles represent a certain sentiment, it is obviously unwise to fight against that long term sentiment. The purpose of this indicator was to provide a proper representation of trend direction and strength, but also solve the problem of when you should 'dip' buy.
For an example: if all angles are increase or decreasing, then you may use the 5hma's angle to find the proper points at which you will enter a position.
***NOTE: I dont think the +/- 45 bands should indicate 'overbought' or 'oversold' zones that some might assume. Instead you should wait for a crossing of this zone.

Trend Condition [TradersPro]
OVERVIEW
The Trend Condition Indicator measures the strength of the bullish or bearish trend by using a ribbon pattern of exponential moving averages and scoring system. Trend cycles naturally expand and contract as a normal part of the cycle. It is the rhythm of the market. Perpetual expansion and contraction of trend.
As trend cycles develop the indicator shows a compression of the averages. These compression zones are key locations as trends typically expand from there. The expansion of trend can be up or down.
As the trend advances the ribbon effect of the indicator can be seen as each average expands with the price action. Once they have “fanned” the probability of the current trend slowing is high.
This can be used to recognize a powerful trend may be concluding. Traders can tighten stops, exit positions or utilize other prudent strategies.
CONCEPTS
Each line will display green if it is higher than the prior period and red if it is lower than the prior period. If the average is green it is considered bullish and will score one point in the bullish display. Red lines are considered bearish and will score one point in the bearish display.
The indicator can then be used at a quick glance to see the number of averages that are bullish and the number that are bearish.
A trader may use these on any tradable instrument. They can be helpful in stock portfolio management when used with an index like the S&P 500 to determine the strength of the current market trend. This may affect trade decisions like possession size, stop location and other risk factors.
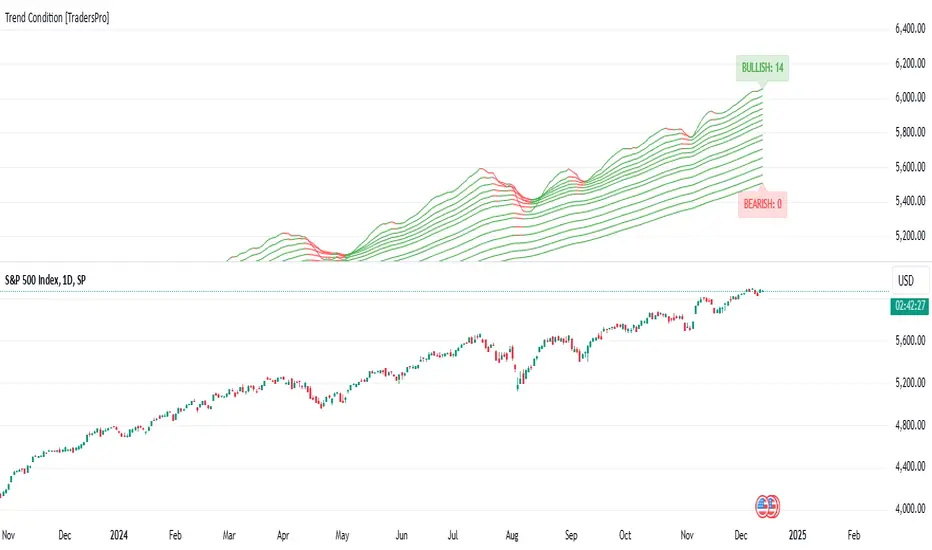
Volume-Adjusted Schaff Trend Cycle (VASTC)Volume-Adjusted Schaff Trend Cycle (VASTC)
The VASTC is a fairly fast-moving oscillator designed to identify trends early and signal when trends may be nearing their end. While it can be used for both trend-following and mean-reversion strategies , it shines in trend-following setups. It’s particularly useful for catching the start of a trend and giving early warnings that a trend might end soon, making it a valuable addition to a multi-indicator system.
How It Works:
The VASTC adapts the traditional Schaff Trend Cycle by adjusting the MACD component with volume data. This volume-adjusted MACD is run through two stochastic processes , applying exponential smoothing to enhance responsiveness. Volume sensitivity allows the VASTC to adapt dynamically to periods of high or low trading activity, providing more reliable trend signals.
Recommended Use:
Use VASTC in confluence with other indicators to confirm trend entries and exits. It’s best for identifying early trend setups rather than sustaining prolonged trend trades. When used alongside other indicators, especially those with a longer-term outlook or momentum based trend indicators, you’ll gain a clearer signal for potential exits or entries. Always backtest the VASTC on your chosen assets to determine the most effective input parameters, as the defaults may not suit all markets or assets. Different assets behave differently, and adjustments in parameters can improve its ability to analyze the assets you're looking at.
Parameters:
Length : Sets the primary smoothing length.
Fast/Slow Length : Adjust the speed of the volume-adjusted MACD component.
Factor : Controls the final smoothing applied to the STC.
Overbought/Oversold Levels : Defines overbought/oversold levels.
Experiment with these settings to customize the VASTC to your trading strategy and asset.
Disclaimer : This indicator is a tool to complement your trading analysis and should not be used in isolation. Always backtest and use other confluence signals for best results. The assets I looked at when making this indicator are almost certainly different than what you're looking at.

Trend Levels [ChartPrime]The Trend Levels indicator is designed to identify key trend levels (High, Mid, and Low) during market trends, based on real-time calculations of highest, lowest, and mid-level values over a customizable length. Additionally, the indicator calculates trend strength by measuring the ratio of candles closing above or below the midline, providing a clear view of the ongoing trend dynamics and strength.
⯁ KEY FEATURES AND HOW TO USE
⯌ Trend Shift Signals :
Trend shifts, based on highest and lowest values during input length. When high is == to highest it will change trend to up when low == lowest value it will be shift to down trend.
// Calculate highest and lowest over the specified length
h = ta.highest(length)
l = ta.lowest(length)
// Determine trend direction: if the current high is the highest value, set trend to true
if h == high
trend := true
// If the current low is the lowest value, set trend to false
if l == low
trend := false
Whenever the trend changes direction (from uptrend to downtrend or vice versa), the indicator provides visual cues in the form of arrows. This gives traders clear signals to identify potential trend reversals, enabling them to adjust their strategies accordingly.
⯌ Trend Level Calculation :
As soon as a trend is detected (uptrend or downtrend), the indicator starts calculating the highest, lowest, and mid-level values over the defined period. These levels are plotted on the chart as color-coded lines for easy visualization, allowing traders to quickly spot the key levels within a trend.
⯌ Midline Retests :
Throughout the trend, the mid-level line is often retested, acting as a potential zone for pullbacks or rejections. Traders can use these retests as opportunities for entering positions or confirming trend continuation. The chart shows how price frequently interacts with the midline, helping to identify important reaction levels.
⯌ Trend Strength Calculation :
The indicator measures the trend strength by calculating the delta between the number of candles closing above and below the midline. This percentage-based delta is displayed in real-time, providing a clear indication of whether the trend is gaining or losing momentum.
⯁ USER INPUTS
Length : Specifies the lookback period for calculating the highest and lowest values, which determines the key trend levels.
Candle Counting : Measures the number of candles closing above and below the midline to calculate the trend strength delta.
⯁ CONCLUSION
The Trend Levels indicator provides traders with a powerful tool for visualizing trend dynamics, key levels of support and resistance, and real-time trend strength. By identifying midline retests, tracking candle counts, and providing trend shift signals, this indicator can help traders make well-informed decisions during market trends.

Trend indicatorThe Trend Indicator script is a custom oscillator-based tool designed for identifying potential entry and exit points in the market. Using a combination of Exponential Moving Average (EMA) and Relative Moving Average (RMA) calculations, it captures the trend direction and signals market momentum shifts. The indicator visually presents buy and sell signals and color-codes background conditions based on potential trend reversals, offering a clear and structured approach for trend-based trading strategies.
Key Components
1. User Inputs
Smoothing Length (smoothLength): The script allows the trader to input a smoothing length for adjusting the EMA and RMA calculations. This parameter fine-tunes the indicator's sensitivity to price movements, where lower values result in a more responsive oscillator, while higher values make it smoother and less reactive to minor fluctuations.
Source (source): This is the price data input for the script, defaulting to the close price but customizable to other price points (e.g., open, high, or low) based on user preference.
2. Smoothed Price Calculation
Using an Exponential Moving Average (EMA), the script smooths the selected source price to reduce noise and make trends clearer. The EMA’s calculation length is determined by the smoothLength input, and this moving average forms the baseline from which other components derive.
3. Oscillator Calculation
The oscillator value represents the relative strength or weakness of price momentum. Here, the oscillator is computed using Relative Moving Average (RMA), applied to the difference between the smoothed price and the SMA of the source price. The RMA further filters short-term fluctuations to identify the core trend direction.
This oscillator measures the divergence between the smoothed price and the SMA, providing insight into whether the market is experiencing bullish or bearish pressure.
4. Signal Line
The Signal Line is a Simple Moving Average (SMA) of the oscillator, using the same smoothLength parameter. The SMA smooths the oscillator’s values, offering a secondary reference that traders can use to identify changes in momentum when it crosses the oscillator line.
5. Buy and Sell Signals
Buy Signal (bullSignal): The script triggers a buy signal when the oscillator crosses above zero. This indicates that momentum may be shifting in favor of buyers, potentially signaling an uptrend.
Sell Signal (bearSignal): The script triggers a sell signal when the oscillator crosses below zero, suggesting a shift in momentum to the downside, potentially initiating a downtrend.
Visualization
1. Plotting the Oscillator and Signal Line
The oscillator line is plotted in blue, representing the current momentum of the price. The signal line, plotted in red, serves as a smoother baseline.
When the oscillator crosses the signal line, it hints at a potential trend shift, which can be a signal for cautious traders to pay attention to trend reversals.
2. Buy/Sell Signal Markers
Buy Signal Marker: A green label appears below the bar whenever the oscillator crosses above zero, indicating a potential buying opportunity.
Sell Signal Marker: A red label appears above the bar whenever the oscillator crosses below zero, marking a potential selling opportunity.
These visual cues make it easy for traders to spot signals directly on the chart without needing to watch the oscillator values closely.
3. Background Coloring for Trend Direction
To further aid in trend identification, the background color changes to green when a bullish signal is active and red during bearish signals. This coloring helps visually reinforce the current trend direction, allowing traders to spot prolonged uptrends or downtrends easily.
Trading Strategy Suggestions
This indicator can be adapted to various trading strategies. Here are a few practical suggestions:
Trend-Following Strategy:
When the oscillator crosses above zero (green background), it could indicate the start of a potential uptrend. Consider entering a long position on this signal and holding it until the oscillator crosses back below zero.
Conversely, a cross below zero (red background) may signal a downtrend, making it suitable for short positions or exiting long trades.
Cross-Confirmation with Signal Line:
Use the crossover of the oscillator and signal line to confirm trends. For example, when the oscillator is above zero and crosses above the signal line, it could reinforce a strong buy signal. Similarly, a cross below the signal line when the oscillator is below zero could strengthen a sell signal.
Combining with Other Indicators:
For added accuracy, combine this indicator with other trend-confirming tools like Moving Averages or Bollinger Bands to confirm the validity of buy/sell signals.
Risk Management:
Always set stop-losses below recent lows in uptrends or above recent highs in downtrends. This indicator is useful for entry and exit points but should always be paired with solid risk management practices.
The Trend Indicator is a comprehensive tool for identifying market momentum and potential reversal points. By smoothing out price data and using an oscillator to track momentum shifts, it offers traders a structured approach to trading trends. Its built-in buy/sell markers and background coloring make it visually accessible and easy to interpret at a glance. However, as with any indicator, it's most effective when combined with other strategies and a disciplined approach to risk management.
DSL Trend Analysis [ChartPrime]The DSL Trend Analysis indicator utilizes Discontinued Signal Lines (DSL) deployed directly on price, combined with dynamic bands, to analyze the trend strength and momentum of price movements. By tracking the high and low price values and comparing them to the DSL bands, it provides a visual representation of trend momentum, highlighting both strong and weakening phases of market direction.
⯁ KEY FEATURES AND HOW TO USE
⯌ DSL-Based Trend Detection :
This indicator uses Discontinued Signal Lines (DSL) to evaluate price action. When the high stays above the upper DSL band, the line turns lime, indicating strong upward momentum. Similarly, when the low stays below the lower DSL band, the line turns orange, indicating strong downward momentum. Traders can use these visual signals to identify strong trends in either direction.
⯌ Bands for Trend Momentum :
The indicator plots dynamic bands around the DSL lines based on ATR (Average True Range). These bands provide a range within which price can fluctuate, helping to distinguish between strong and weakening trends. If the high remains within the upper band, the lime-colored line becomes transparent, showing weakening upward momentum. The same concept applies for the lower band, where the line turns orange with transparency, indicating weakening downward momentum.
If high and low stays between bands line has no color
to make sure indicator catches only strong momentum of price
⯌ Real-Time Band Price Labels :
The indicator places two labels on the chart, one at the upper DSL band and one at the lower DSL band, displaying the real-time price values of these bands. These labels help traders track the current price relative to the key bands, which are essential in determining potential breakout or reversal zones.
⯌ Visual Confirmation of Momentum Shifts :
By monitoring the relationship between the high and low values of the price relative to the DSL bands, this indicator provides a reliable way to confirm whether the trend is gaining or losing strength. This allows traders to act accordingly, whether it's to enter or exit positions based on trend strength or weakness.
⯁ USER INPUTS
Length : Defines the period used to calculate the DSL lines, influencing the sensitivity of the trend detection.
Offset : Adjusts the offset applied to the upper and lower DSL bands, affecting how the thresholds for strong or weak momentum are set.
Width (ATR Multiplier) : Determines the width of the DSL bands based on an ATR multiplier, providing a dynamic range around the price for momentum analysis.
⯁ CONCLUSION
The DSL Trend Analysis indicator is a powerful tool for assessing price momentum and trend strength. By combining Discontinued Signal Lines with dynamically calculated bands, traders can easily spot key moments when momentum shifts from strong to weak or vice versa. The color-coded lines and real-time price labels provide valuable insights for trading decisions in both trending and ranging markets.