Volume Standard Deviation Alert GusPurpose
The script detects and alerts traders when the volume of a trading asset significantly exceeds a calculated threshold based on the standard deviation of volume over a specified lookback period. It optionally filters these alerts based on whether the price action is bullish or bearish.
Key Components
Inputs
lookback (default: 20)
The number of bars to consider when calculating the moving average and standard deviation of volume.
stdDevFactor (default: 2.0)
The multiplier for the standard deviation to determine the threshold for a volume spike.
alertOnClose (default: true)
Determines whether alerts should only be triggered after the bar has closed.
checkBullBear (default: false)
Enables filtering of alerts based on the bullishness or bearishness of the bar.
Calculations
volSMA
The simple moving average (SMA) of the volume over the lookback period.
volStd
The standard deviation of the volume over the lookback period.
threshold
The alert threshold is calculated as:
Threshold
=
volSMA
+
(
stdDevFactor
×
volStd
)
Threshold=volSMA+(stdDevFactor×volStd)
isBullish & isBearish
Determines whether the current bar is bullish (close > open) or bearish (close < open).
volumeSpikeCondition
A condition that triggers when the current volume exceeds the calculated threshold.
bullishCondition & bearishCondition
Refines the spike condition by requiring the bar to be bullish or bearish when checkBullBear is enabled.
finalCondition
The ultimate alert condition based on the user’s preference for bullish/bearish filtering.
finalTrigger
Ensures the alert only triggers at bar close if alertOnClose is set to true.
Visualization
Plots the SMA of the volume (volSMA) and the threshold line (threshold), helping traders visually understand the conditions.
Histograms the current volume and colors the bars:
Red: Volume exceeds the threshold.
Blue: Volume is below the threshold.
Alerts
The script generates an alert message when the finalTrigger condition is met:
"Bullish Volume Spike!" if the bar is bullish.
"Bearish Volume Spike!" if the bar is bearish.
"High Volume Spike!" if no bull/bear filter is applied.
Alerts are sent using alert() with the message and set to trigger once per bar close.
Usage
Traders can use this script to identify unusual volume activity, which often precedes significant price movements.
Customizability allows traders to tune the lookback period, standard deviation multiplier, and whether to filter for bullish/bearish spikes.
Visual and audible cues help in identifying important market events in real time.
This indicator is particularly useful for spotting market breakouts or breakdowns driven by high trading activity.
ابحث في النصوص البرمجية عن "trigger"

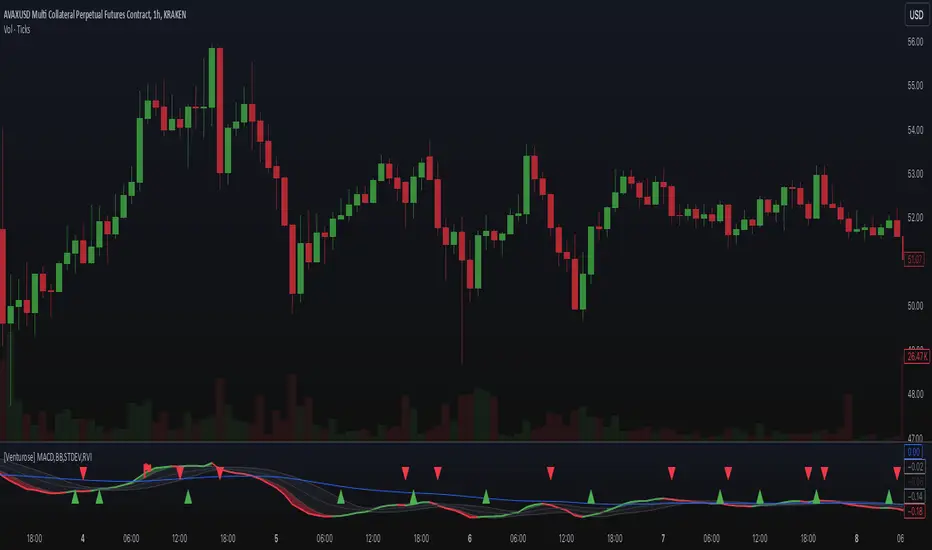
[Venturose] MACD x BB x STDEV x RVIDescription:
The MACD x BB x STDEV x RVI combines MACD, Bollinger Bands, Standard Deviation, and Relative Volatility Index into a single tool. This indicator is designed to provide insights into market trends, momentum, and volatility. It generates buy and sell signals, by analyzing the interactions between these components. These buy and sell signals are not literal, and should be used in combination with the current trend.
How It Works:
MACD: Tracks momentum and trend direction using customizable fast and slow EMA periods.
Bollinger Bands: Adds volatility bands to MACD to identify overextension zones.
Standard Deviation: Dynamically adjusts the Bollinger Band width based on MACD volatility.
RVI (Relative Volatility Index): Confirms momentum extremes with upper and lower threshold markers.
Custom Logic: Includes a trigger system ("inside" or "flipped") to adapt signals to various market conditions and an optional filter to reduce noise.
Key Features:
Combines MACD and Bollinger Bands with volatility and momentum confirmations from RVI.
Dynamic color-coded plots for identifying bullish, bearish, and neutral trends.
Customizable parameters for tailoring the indicator to different strategies.
Optional signal filtering to refine buy and sell triggers.
Alerts for buy and sell signals based on signal logic.
Why It’s Unique:
This indicator combines momentum (MACD), volatility (Bollinger Bands and Standard Deviation), and confirmation signals (RVI thresholds) into a unified system. It introduces custom "inside" and "flipped" triggers for adaptable signal generation and includes signal filtering to reduce noise. The addition of RVI-based hints helps identify early overbought or oversold conditions, providing an extra layer of insight for decision-making. The dynamic integration of these components ensures a comprehensive yet straightforward analysis tool for various market conditions.
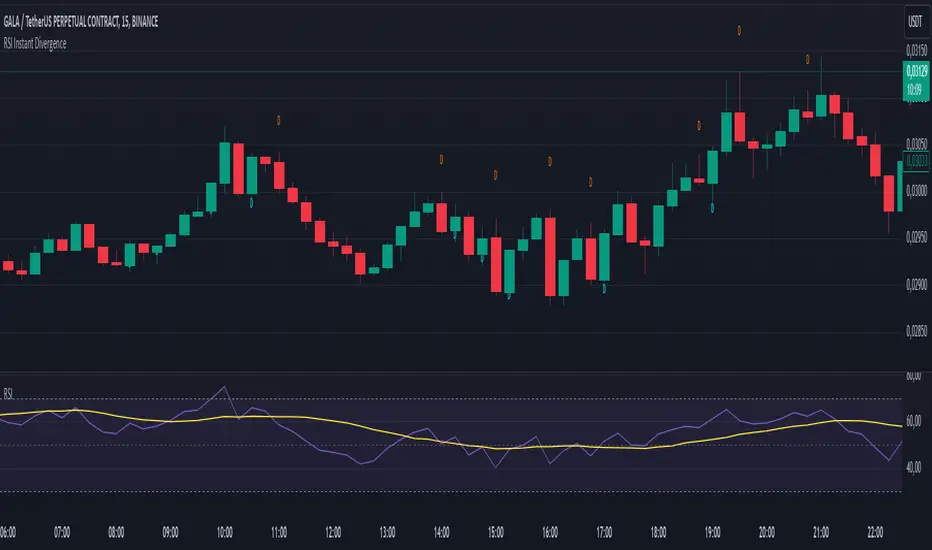
RSI Instant DivergenceThis script detects RSI divergence—a common signal indicating potential trend reversals. It compares price action and RSI behavior to identify two types of divergences:
1- Bearish Divergence (Sell Signal):
Occurs when the price forms a higher high while RSI drops (weaker momentum).
A label appears above the candle, and an alert is triggered: "Divergence: Sell Signal."
2 -Bullish Divergence (Buy Signal):
Occurs when the price makes a lower low while RSI rises (stronger momentum).
A label appears below the candle, and an alert is triggered: "Divergence: Buy Signal."
The labels are color-coded (orange for sell, blue for buy) and include detailed RSI and price info in a tooltip. Alerts help you act immediately when divergence is detected.
This tool is perfect for spotting potential trend reversals and refining your entry/exit strategy. Let me know if you'd like to customize it further! 😊
Tooltip Feature: Each label includes a tooltip with precise RSI and price details (current and previous values) as well as the percentage change in RSI, giving you deeper insight into the divergence. This tool is great for identifying trend reversal points and includes visual labels, tooltips, and alerts to make real-time trading decisions easier. Let me know if you’d like adjustments!
Support/ResistanceUse this code to stop support and resistance
This can be used with the momentum indicators that I have to see if we are likely to breakout or get rejected
Indicator Settings:
The indicator is titled "Support/Resistance | Breaks & Bounces" and is set to overlay on the price chart.
max_lines_count is set to 500, indicating the maximum number of support/resistance lines that can be plotted.
User Input:
The script allows users to customize the pivot method, sensitivity, and line width through input variables.
point_method determines whether the pivot calculation is based on "Candle Wicks" or "Candle Body".
left_bars represents the number of bars to the left used to identify pivot highs/lows.
right_bars is set equal to left_bars.
line_width controls the width of the support/resistance lines.
Global Variables and Arrays:
The script declares several variables and arrays to store information related to support and resistance levels, breakouts, and bounces.
high_source and low_source are calculated based on the selected pivot method.
fixed_pivot_high and fixed_pivot_low store the pivot highs and lows using the chosen sensitivity.
Variables and arrays are initialized for tracking support/resistance lines, breakout triggers, and bounce triggers.
Main Operation:
The main operation occurs when barstate.isconfirmed is true, indicating that a new bar has formed and its data is final.
The script iterates through the support/resistance lines to update their end points (x2) to the current bar.
For each support/resistance line, it checks if a breakout or bounce event has occurred based on the current and previous bar's price levels.
If a breakout or bounce event is detected, the corresponding trigger variables (red_breakout_trigger, red_rejection_trigger, green_breakout_trigger, green_rejection_trigger) are set to true.
The script also checks for changes in the pivot highs and lows and updates the support/resistance lines accordingly.
If a change is detected, it clears the existing lines, breakout, and bounce arrays and adds new lines for the updated pivot levels.

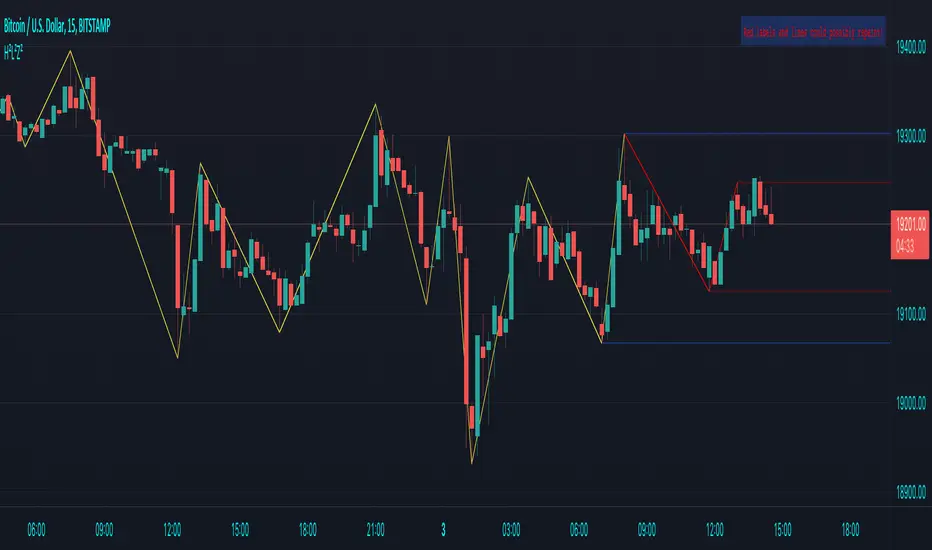
HH-LL ZZAnother ZigZag, yes...
I believe though this concerns another angle/principle, therefore I wanted to share
How does it work?
Given:
source for level breach -> close
X breaches -> 3
Let's say this is the latest found 'lower low' (LL - blue dot under bar):
This bar has been triggered because 3 bars closed under low of previous 'trigger bar' (TB )
The high and low of this new TB will act as triggers
(aqua blue lines, seen in image above)
Then there are 2 options:
- again 3 bars closes under the latest TB , in that case the TB moves to that new LL.
- 3 bars closes higher than the high of previous TB
The high and low of this new TB act again as trigger
If a new TB LL/HH is found, the script checks previous LL/HH
and searches the highest/lowest point in between.
If necessary, the temporary highest/lowest will be adjusted:
Another example:
The last 2 points can change (repaint).
Yellow coloured lines/labels are set and won't change anymore.
Concluded:
In case of these settings:
source for level breach -> close
X breaches -> 3
once a new TB is found, the high and low act as trigger lines
- when 3 bars closes under that low , a new LL is found, this will be the new TB
- when 3 bars closes above that high , a new HH is found, this will be the new TB
and so on...
Settings:
source for level breach -> close or high/low - H/L
X breaches -> 1 -> 10
line style -> solid, dotted, dashed
show level breaches -> new found TB (blue/lime coloured)
show Support/Resistance (lines at the right)
repaint warning can be removed
show labels / lines
This ZZ can be used for Harmonic patterns, Trend evaluation, support/resistance,...
In this script, I also used new features
- text_font_family = font.family_monospace -> link
- display=display.pane -> link
Cheers!
Triple ThreatThis indicator provides buy and sell signals for Bitcoin based on confluence from well-known momentum, volatility, and trend indicators. It has successfully captured the major directional trends on Bitcoin's daily chart since 2018, and the settings are currently optimized for this chart in particular. This indicator implements RSI to gauge momentum, BBWP to gauge volatility, and an EMA to gauge trend. Maximum confluence signals are represented by horizontal bars in the indicator's pane, where the tallest green bar is a confirmed buy signal, and the tallest red bar is a confirmed sell signal. The shortest bar represents a momentum-only signal, and the second-shortest bar represents a volatility signal in confluence with the previously given momentum signal.
To track momentum, the RSI is plotted to the indicator plane against a moving average of the RSI. A momentum signal is generated when the RSI crosses over its moving average, retests/approaches the moving average, and then continues in the crossover direction (i.e., it fails to cross the moving average to the opposite side, creating a successful retest). The settings that affect this trigger are the "Crossover Threshold," which specifies how much the RSI should exceed the moving average to be considered a crossover, and the "Retest threshold," which specifies how closely the RSI should approach the moving average to be considered a retest. A momentum signal is ALSO generated if the RSI or its moving average exceed their counterpart by a certain threshold. For example, if the threshold was set at 10, a BUY signal would be generated when the RSI exceeds the moving average by 10, or a SELL signal would be generated when the moving average exceeds the RSI by 10. This threshold can be set using the "Instant Signal Threshold" setting. Either type of momentum signal will be plotted on the pane as the shortest horizontal bar, with its color indicating the signal's direction.
Volatility is primarily measured using the Bollinger Band Width Percentile (BBWP) indicator, which was created by The_Caretaker. BBWP plots the volatility of the asset's price, given by Bollinger Band width, relative to past volatility by assigning the volatility readings into percentiles. The indicator also includes a moving average of the BBWP itself, where a crossover to the upside represents expanding volatility and a crossover to the downside represents contracting volatility. This indicator is used to confirm a signal given by the momentum indicators - a momentum signal that is given during a period of expanding volatility has a greater likelihood of success. Therefore, when the BBWP crosses above its moving average by a given threshold, a previously triggered momentum signal is considered to be "confirmed." The threshold for this crossover can be set using the "BBWP Confirmation Threshold" setting. However, it is also relevant that periods of extreme volatility often accompany an extremity in price action (a "top" or "bottom"), in which case the BBWP is likely to contract after price reaches such an extremity. This phenomenon is captured by also using "extreme reads" on the momentum indicator to signal that there has already been enough volatility to confirm a momentum signal. If the RSI gives an "extreme read" before triggering a signal, the momentum signal is also considered to be confirmed. For example, if the RSI is above 80, breaks below 80, and then gives a SELL signal, this sell signal is considered to be confirmed without requiring the BBWP to crossover its moving average to the upside. The threshold that would confirm a SELL signal can be set with the "Overbought" setting, and the threshold that would confirm a BUY signal can be set with the "Oversold" setting. Whenever a volatility signal confirms a momentum signal, a medium-sized horizontal bar will be plotted on the pane in the same directional color as the momentum signal. Note that a momentum signal may trigger at the exact same time as the volatility signal which confirms it; in this case, only the medium-sized bar will be visible on the pane, but its direction can still be identified by its color.
Lastly, to reduce the likelihood of "false signals," a trend indicator is used to confirm the direction of the signal. This is typically an exponential moving average. If a confirmed volatility SELL signal is given, and the closing price is below the moving average, then the SELL signal is also confirmed by the trend. Likewise, if a confirmed volatility BUY signal is given, and the closing price is above the moving average, then the BUY signal is confirmed by the trend. The type and length of the moving average used to verify the trend can be set using the "Moving Average Type" and "Moving Average Length" settings found below the momentum/volatility settings. A trend signal is plotted on the pane as a tall horizontal bar, and is more deeply colored than the momentum and volatility signals.
For maximum confluence, it is recommended that the trend signal, given by the tallest bar, is the one that forms the basis of trades executed while using the Triple Threat indicator. It is possible to enter more aggressive trades with better entries by using only the volatility signal, given by the medium-sized bar, however this entails greater risk and should only be done in confluence with an additional trading strategy of your own discretion. Backtesting has shown that using the volatility signal alone underperforms using the volatility signal in confluence with the trend signal.
Please also be advised that the default setting are optimized for Bitcoin's daily chart only. The indicator is still applicable to other timeframes and asset classes, but the settings may need to be modified. I have a list of settings for other Bitcoin timeframes, and I would be happy to share them upon request.
I hope you can find this indicator to be of some use to your trading strategies. I'd be happy to hear any feedback from the community, so please don't hesitate to reach out. Stay safe, and happy trading.

888 BOT #alerts█ 888 BOT #alerts (open source)
This is an Expert Advisor 'EA' or Automated trading script for ‘longs’ and ‘shorts’, which uses only a Take Profit or, in the worst case, a Stop Loss to close the trade.
It's a much improved version of the previous ‘Repanocha’. It doesn`t use 'Trailing Stop' or 'security ()' functions (although using a security function doesn`t mean that the script repaints) and all signals are confirmed, therefore the script doesn`t repaint in alert mode and is accurate in backtest mode.
Apart from the previous indicators, some more and other functions have been added for Stop-Loss, re-entry and leverage.
It uses 8 indicators, (many of you already know what they are, but in case there is someone new), these are the following:
1. Jurik Moving Average
It's a moving average created by Mark Jurik for professionals which eliminates the 'lag' or delay of the signal. It's better than other moving averages like EMA , DEMA , AMA or T3.
There are two ways to decrease noise using JMA . Increasing the 'LENGTH' parameter will cause JMA to move more slowly and therefore reduce noise at the expense of adding 'lag'
The 'JMA LENGTH', 'PHASE' and 'POWER' parameters offer a way to select the optimal balance between 'lag' and over boost.
Green: Bullish , Red: Bearish .
2. Range filter
Created by Donovan Wall, its function is to filter or eliminate noise and to better determine the price trend in the short term.
First, a uniform average price range 'SAMPLING PERIOD' is calculated for the filter base and multiplied by a specific quantity 'RANGE MULTIPLIER'.
The filter is then calculated by adjusting price movements that do not exceed the specified range.
Finally, the target ranges are plotted to show the prices that will trigger the filter movement.
Green: Bullish , Red: Bearish .
3. Average Directional Index ( ADX Classic) and ( ADX Masanakamura)
It's an indicator designed by Welles Wilder to measure the strength and direction of the market trend. The price movement is strong when the ADX has a positive slope and is above a certain minimum level 'ADX THRESHOLD' and for a given period 'ADX LENGTH'.
The green color of the bars indicates that the trend is bullish and that the ADX is above the level established by the threshold.
The red color of the bars indicates that the trend is down and that the ADX is above the threshold level.
The orange color of the bars indicates that the price is not strong and will surely lateralize.
You can choose between the classic option and the one created by a certain 'Masanakamura'. The main difference between the two is that in the first it uses RMA () and in the second SMA () in its calculation.
4. Parabolic SAR
This indicator, also created by Welles Wilder, places points that help define a trend. The Parabolic SAR can follow the price above or below, the peculiarity that it offers is that when the price touches the indicator, it jumps to the other side of the price (if the Parabolic SAR was below the price it jumps up and vice versa) to a distance predetermined by the indicator. At this time the indicator continues to follow the price, reducing the distance with each candle until it is finally touched again by the price and the process starts again. This procedure explains the name of the indicator: the Parabolic SAR follows the price generating a characteristic parabolic shape, when the price touches it, stops and turns ( SAR is the acronym for 'stop and reverse'), giving rise to a new cycle. When the points are below the price, the trend is up, while the points above the price indicate a downward trend.
5. RSI with Volume
This indicator was created by LazyBear from the popular RSI .
The RSI is an oscillator-type indicator used in technical analysis and also created by Welles Wilder that shows the strength of the price by comparing individual movements up or down in successive closing prices.
LazyBear added a volume parameter that makes it more accurate to the market movement.
A good way to use RSI is by considering the 50 'RSI CENTER LINE' centerline. When the oscillator is above, the trend is bullish and when it is below, the trend is bearish .
6. Moving Average Convergence Divergence ( MACD ) and ( MAC-Z )
It was created by Gerald Appel. Subsequently, the histogram was added to anticipate the crossing of MA. Broadly speaking, we can say that the MACD is an oscillator consisting of two moving averages that rotate around the zero line. The MACD line is the difference between a short moving average 'MACD FAST MA LENGTH' and a long moving average 'MACD SLOW MA LENGTH'. It's an indicator that allows us to have a reference on the trend of the asset on which it is operating, thus generating market entry and exit signals.
We can talk about a bull market when the MACD histogram is above the zero line, along with the signal line, while we are talking about a bear market when the MACD histogram is below the zero line.
There is the option of using the MAC-Z indicator created by LazyBear, which according to its author is more effective, by using the parameter VWAP ( volume weighted average price ) 'Z-VWAP LENGTH' together with a standard deviation 'STDEV LENGTH' in its calculation.
7. Volume Condition
Volume indicates the number of participants in this war between bulls and bears, the more volume the more likely the price will move in favor of the trend. A low trading volume indicates a lower number of participants and interest in the instrument in question. Low volumes may reveal weakness behind a price movement.
With this condition, those signals whose volume is less than the volume SMA for a period 'SMA VOLUME LENGTH' multiplied by a factor 'VOLUME FACTOR' are filtered. In addition, it determines the leverage used, the more volume , the more participants, the more probability that the price will move in our favor, that is, we can use more leverage. The leverage in this script is determined by how many times the volume is above the SMA line.
The maximum leverage is 8.
8. Bollinger Bands
This indicator was created by John Bollinger and consists of three bands that are drawn superimposed on the price evolution graph.
The central band is a moving average, normally a simple moving average calculated with 20 periods is used. ('BB LENGTH' Number of periods of the moving average)
The upper band is calculated by adding the value of the simple moving average X times the standard deviation of the moving average. ('BB MULTIPLIER' Number of times the standard deviation of the moving average)
The lower band is calculated by subtracting the simple moving average X times the standard deviation of the moving average.
the band between the upper and lower bands contains, statistically, almost 90% of the possible price variations, which means that any movement of the price outside the bands has special relevance.
In practical terms, Bollinger bands behave as if they were an elastic band so that, if the price touches them, it has a high probability of bouncing.
Sometimes, after the entry order is filled, the price is returned to the opposite side. If price touch the Bollinger band in the same previous conditions, another order is filled in the same direction of the position to improve the average entry price, (% MINIMUM BETTER PRICE ': Minimum price for the re-entry to be executed and that is better than the price of the previous position in a given %) in this way we give the trade a chance that the Take Profit is executed before. The downside is that the position is doubled in size. 'ACTIVATE DIVIDE TP': Divide the size of the TP in half. More probability of the trade closing but less profit.
█ STOP LOSS and RISK MANAGEMENT.
A good risk management is what can make your equity go up or be liquidated.
The % risk is the percentage of our capital that we are willing to lose by operation. This is recommended to be between 1-5%.
% Risk: (% Stop Loss x % Equity per trade x Leverage) / 100
First the strategy is calculated with Stop Loss, then the risk per operation is determined and from there, the amount per operation is calculated and not vice versa.
In this script you can use a normal Stop Loss or one according to the ATR. Also activate the option to trigger it earlier if the risk percentage is reached. '% RISK ALLOWED' wich is calculated according with: '%EQUITY ON EACH ENTRY'. Only works with Stop Loss on 'NORMAL' or 'BOTH' mode.
'STOP LOSS CONFIRMED': The Stop Loss is only activated if the closing of the previous bar is in the loss limit condition. It's useful to prevent the SL from triggering when they do a ‘pump’ to sweep Stops and then return the price to the previous state.
█ ALERTS
There is an alert for each leverage, therefore a maximum of 8 alerts can be set for 'long' and 8 for 'short', plus an alert to close the trade with Take Profit or Stop Loss in market mode. You can also place Take Profit limit and Stop Loss limit orders a few seconds after filling the position entry order.
- 'MAXIMUM LEVERAGE': It is the maximum allowed multiplier of the % quantity entered on each entry for 1X according to the volume condition.
- 'ADVANCE ALERTS': There is always a time delay from when the alert is triggered until it reaches the exchange and can be between 1-15 seconds. With this parameter, you can advance the alert by the necessary seconds to activate it earlier. In this way it can be synchronized with the exchange so that the execution time of the entry order to the position coincides with the opening of the bar.
The settings are for Bitcoin at Binance Futures (BTC: USDTPERP) in 15 minutes.
For other pairs and other timeframes, the settings have to be adjusted again. And within a month, the settings will be different because we all know the market and the trend are changing.

Pivots MTF [LucF]Pivots detected at higher timeframes are more significant because more market activity—or work—is required to produce them. This indicator displays pivots calculated on the higher timeframe of your choice.
Features
► Timeframe selection
— The higher timeframe (HTF) can be selected in 3 different ways:
• By steps (15 min., 60 min., 4H, 1D, 3D, 1W, 1M, 1Y). This setting is the default.
• As a multiple of the current chart's resolution, which can be fractional, so 3.5 will work.
• Fixed.
— The HTF used can be displayed near the last bar (default).
— Note that using the HTF is not mandatory. If it is disabled, the indicator will calculate on the chart's resolution.
— Non-repainting or repainting mode can be selected. This has no impact on the display of historical bars, but when no repainting is selected, pivot detection in the realtime bar will be delayed by one chart bar (not one bar at the HTF).
► Pivots
— Three color schemes are provided: green/red, aqua/pink and coral/violet (the default).
— Both the thickness and brightness of lines can be controlled separately for the hi and lo pivots.
— The visibility of the last hi/lo pivots can be enhanced.
— Prices can be displayed on pivot lines and the text's size and color can be adjusted.
— The number of bars required for the left/right pivot legs can be controlled (the default is 4).
— The source can be selected individually for hi and lo pivots (the default is hlc3 and low .
— The mean of the hi/lo pivot values of the last few thousand chart bars can be displayed. Pivots having lasted longer during the mean's period will weigh more in the calculation. The mean can be displayed in running mode and/or only showing its last level as a long horizontal line. I don't find it very useful; maybe others will.
► Markers and Alerts
— Markers can be configured on breaches of either the last hi/lo pivot levels, or the hi/lo mean. Crossovers and crossunders are controlled separately.
— Alerts can be configured using any of the marker combinations. As is usual for my indicators, only one alert is used. It will trigger on the markers that are active when you create your alert. Once your markers are set up the way you want, create your alert from the chart/timeframe you want the alert to run on, and be sure to use the “Once Per Bar Close” triggering condition. Use an alert message that will remind you of the combination of markers used when creating the alert. If you use multiple markers to trigger one alert, then having the indicator show those markers will be important to help you figure out which marker triggered the alert when it fired.
A quick look at the pattern of these markers will hopefully convince you that using them as entry/exit signals would be perilous, as they are prone to whipsaw. I have included them because some traders may use the markers as reminders.
Using Pivots
These pivots can be used in a few different ways:
— When using the high / low sources they will show extreme levels, breaches of which should be more significant.
— Another way to use them is with hlc3 (the average of the high , low and close ) for hi pivots and low for the lo pivots. This accounts for my personal mythology to the effect that drops typically reach previous lows more easily than rallies make newer highs.
— Using low for hi pivots and high for lo pivots (so backward) can be a useful way to set stops or to detect weakness in movements.
You will usually be better served by pivots if you consider them as denoting regions rather than precise levels. The flexibility in the display options of this indicator will help you adapt it to the way you use your pivots. To indicate areas rather than levels, for example, try using a brightness of 1 with a line thickness of 30. The cloud effect generated this way will show areas better than fine lines.
Realize that these pivot lines are positioned in the past, and so they are drawn after the fact because a given number of bars need to elapse before calculations determine a pivot has occurred. You will thus never see a pivot top, for example, identified on the realtime bar. To detect a pivot, it takes a number of bars corresponding to the dilation of the higher timeframe in the current one, multiplied by the number of bars you use for your pivots' right leg. Also note that the Pine native function used to detect pivots in this indicator considers a summit to be a top when the number of bars in each leg are lower or equal to that top. Bars in legs do not need to be progressively lower on each side of the pivot for a pivot to be detected.
If you program in Pine
— See the Pinecoders MTF Selection Framework for an explanation of the functions used in this script to provide the selection mechanism for the higher timeframe.
— This code uses the Pine Script Coding Conventions .
Thanks
— To the Pine coders asking questions in the Pine Script chat on TV ; your questions got me to write this indicator.
Alert Batches v2This version triggers every batch within each candle. The previous version only triggered one batch per candle.
This will not trigger batches in perfect order, but I left the "sequential" option because it still triggers the batches in order more often than not.

TwinSmooth ATR Bands | QuantEdgeBTwinSmooth ATR Bands | QuantEdgeB
🔍 Overview
TwinSmooth ATR Bands | QuantEdgeB is a dual-smoothing, ATR-adaptive trend filter that blends two complementary smoothing engines into a single baseline, then builds dynamic ATR bands around it to detect decisive breakouts. When price closes above the upper band it triggers a Long regime; when it closes below the lower band it flips to Short—otherwise it stays neutral. The script enhances clarity with regime-colored candles, an active-band fill, and an optional on-chart backtest table.
✨ Key Features
1. 🧠 Twin-Smooth Baseline (Dual Engine Blend)
- Computes two separate smoothed baselines (a slower “smooth” leg + a faster “responsive” leg).
- Blends them into a single midpoint baseline for balanced stability + speed.
- Applies an extra EMA smoothing pass to produce a clean trend_base.
2. 📏 ATR Volatility Bands
- Builds upper/lower bands using ATR × multiplier around the trend_base.
- Bands expand in volatile conditions and contract when markets quiet down—auto-adapting without manual tweaks.
3. ⚡ Clear Breakout Regime Logic
- Long when close > upperBand.
- Short when close < lowerBand.
- Neutral otherwise (no forced signals inside the band zone).
4. 🎨 Visual Clarity
- Plots only the active band (lower band in long regime, upper band in short regime).
- Fills between active band and price for instant regime context.
- Colors candles to match the current state (bullish / bearish / neutral).
- Multiple color palettes + transparency control.
💼 Use Cases
• Trend Confirmation Filter: Use the regime as a higher-confidence trend gate for entries from other indicators.
• Breakout/Breakdown Trigger: Trade closes outside ATR bands to catch momentum expansions.
• Volatility-Aware Stops/Targets: Bands naturally reflect volatility, making them useful as adaptive reference levels.
• Multi-Timeframe Alignment: Confirm higher-timeframe regime before executing on lower timeframes.
🎯 For Who
• Trend Traders who want clean regime shifts without constant whipsaw.
• Breakout Traders who prefer confirmation via ATR expansion rather than raw MA crossovers.
• System Builders needing a simple, robust “state engine” (Long / Short / Neutral) to plug into larger strategies.
• Analysts who want quick on-chart validation with a backtest table.
⚙️ Default Settings
• SMMA Length (Base Smooth Leg): 24
• TEMA Length (Base Responsive Leg): 8
• EMA Extra Smoothing: 14
• ATR Length: 14
• ATR Multiplier: 1.1
• Color Mode: Alpha
• Color Transparency: 30
• Backtest Table: On (toggleable)
• Backtest Start Date: 09 Oct 2017
• Labels: Off by default
📌 Conclusion
TwinSmooth ATR Bands | QuantEdgeB merges a dual-speed smoothing core into a single trend baseline, then wraps it with ATR-based bands to deliver clean, volatility-adjusted breakout signals. With regime coloring, active-band plotting, and optional backtest stats, it’s a compact, readable tool for spotting momentum shifts and trend continuation across any market and timeframe.
🔹 Disclaimer: Past performance is not indicative of future results. Always backtest and align settings with your risk tolerance and objectives before live trading.
🔹 Strategic Advice: Always backtest, optimize, and align parameters with your trading objectives and risk tolerance before live trading.

CryptoFlux Dynamo [JOAT]CryptoFlux Dynamo: Velocity Scalping Strategy
This Pine Script v6 strategy is designed for cryptocurrency markets operating on 5-minute and faster timeframes. It combines volatility regime detection, multi-path signal confirmation, and adaptive risk management to identify momentum-based trading opportunities in perpetual futures markets.
Core Design Principles
The strategy addresses three challenges specific to cryptocurrency trading:
24/7 market operation without session boundaries requires continuous monitoring and execution logic
Volatility regimes shift rapidly, demanding adaptive stop and target calculations
Tick-level responsiveness is critical for capturing momentum moves before they complete
Strategy Architecture
1. Signal Generation Stack
The strategy uses multiple technical indicators calibrated for cryptocurrency momentum:
MACD with parameters 8/21/5 (fast/slow/signal) optimized for crypto acceleration phases
EMA ribbon using 8/21/34 periods with slope analysis to assess trend structure
Volume impulse detection combining SMA baseline, standard deviation, and z-score filtering
RSI (21 period) and MFI (21 period) for momentum confirmation
Bollinger Bands and Keltner Channels for squeeze detection
2. Volatility Regime Classification
The strategy normalizes ATR as a percentage of price and classifies market conditions into three regimes:
Compression (< 0.8% ATR): Reduced position sizing, tighter stops (1.05x ATR), lower profit targets (1.6x ATR)
Expansion (0.8% - 1.6% ATR): Standard risk parameters, balanced risk-reward (1.55x stop, 2.05x target)
Velocity (> 1.6% ATR): Wider stops (2.1x ATR), amplified targets (2.8x ATR), tighter trailing offsets
ATR is calculated over 21 periods and smoothed with a 13-period EMA to reduce noise from wicks.
3. Multi-Path Entry System
Four independent signal pathways contribute to a composite strength score (0-100):
Trend Break (30 points): Requires EMA ribbon alignment, positive slope, and structure breakout above/below recent highs/lows
Momentum Surge (30 points): MACD histogram exceeds adaptive baseline, MACD line crosses signal, RSI/MFI above/below thresholds, with volume impulse confirmation
Squeeze Release (25 points): Bollinger Bands compress inside Keltner Channels, then release with momentum bias
Micro Pullback (15 points): Shallow retracements within trend structure that reset without breaking support/resistance
Additional scoring modifiers:
Volume impulse: +5 points when present, -5 when absent
Regime bonus: +5 in velocity, -2 in compression
Cycle bias: +5 when aligned, -5 when counter-trend
Trades only execute when the composite score reaches the minimum threshold (default: 55) and all filters agree.
4. Risk Management Framework
Position sizing is calculated from:
RiskCapital = Equity × (riskPerTradePct / 100)
StopDistance = ATR × StopMultiplier(regime)
Quantity = min(RiskCapital / StopDistance, MaxExposure / Price)
The strategy includes:
Risk per trade: 0.65% of equity (configurable)
Maximum exposure: 12% of equity (configurable)
Regime-adaptive stop and target multipliers
Adaptive trailing stops based on ATR and regime
Kill switch that disables new entries after 6.5% drawdown
Momentum fail-safe exits when MACD polarity flips or ribbon structure breaks
5. Additional Filters
Cycle Oscillator : Measures price deviation from 55-period EMA. Requires cycle bias alignment (default: ±0.15%) before entry
BTC Dominance Filter : Optional filter using CRYPTOCAP:BTC.D to reduce long entries during risk-off periods (rising dominance) and short entries during risk-on periods
Session Filter : Optional time-based restriction (disabled by default for 24/7 operation)
Strategy Parameters
All default values used in backtesting:
Core Controls
Enable Short Structure: true
Restrict to Session Window: false
Execution Session: 0000-2359:1234567 (24/7)
Allow Same-Bar Re-Entry: true
Optimization Constants
MACD Fast Length: 8
MACD Slow Length: 21
MACD Signal Length: 5
EMA Fast: 8
EMA Mid: 21
EMA Slow: 34
EMA Slope Lookback: 8
Structure Break Window: 9
Regime Intelligence
ATR Length: 21
Volatility Soothing: 13
Low Vol Regime Threshold: 0.8% ATR
High Vol Regime Threshold: 1.6% ATR
Cycle Bias Length: 55
Cycle Bias Threshold: 0.15%
BTC Dominance Feed: CRYPTOCAP:BTC.D
BTC Dominance Confirmation: true
Signal Pathways
Volume Baseline Length: 34
Volume Impulse Multiplier: 1.15
Volume Z-Score Threshold: 0.5
MACD Histogram Smoothing: 5
MACD Histogram Sensitivity: 1.15
RSI Length: 21
RSI Momentum Trigger: 55
MFI Length: 21
MFI Momentum Trigger: 55
Squeeze Length: 20
Bollinger Multiplier: 1.5
Keltner Multiplier: 1.8
Squeeze Release Momentum Gate: 1.0
Micro Pullback Depth: 7
Minimum Composite Signal Strength: 55
Risk Architecture
Risk Allocation per Trade: 0.65%
Max Exposure: 12% of Equity
Base Risk/Reward Anchor: 1.8
Stop Multiplier • Low Regime: 1.05
Stop Multiplier • Medium Regime: 1.55
Stop Multiplier • High Regime: 2.1
Take Profit Multiplier • Low Regime: 1.6
Take Profit Multiplier • Medium Regime: 2.05
Take Profit Multiplier • High Regime: 2.8
Adaptive Trailing Engine: true
Trailing Offset Multiplier: 0.9
Quantity Granularity: 0.001
Kill Switch Drawdown: 6.5%
Strategy Settings
Initial Capital: $100,000
Commission: 0.04% (0.04 commission_value)
Slippage: 1 tick
Pyramiding: 1 (no position stacking)
calc_on_every_tick: true
calc_on_order_fills: true
Visualization Features
The strategy includes:
EMA ribbon overlay (8/21/34) with customizable colors
Regime-tinted background (compression: indigo, expansion: purple, velocity: magenta)
Dynamic bar coloring based on signal strength divergence
Signal labels for entry points
On-chart dashboard displaying regime, ATR%, signal strength, position status, stops, targets, and risk metrics
Recommended Usage
Timeframes
The strategy is optimized for 5-minute charts. It can operate on 3-minute and 1-minute timeframes for faster scalping, or 15-minute for swing confirmation. When using higher timeframes, consider:
Increasing structure lookback windows
Raising RSI trigger thresholds above 58 to filter noise
Extending volume baseline length
Markets
Designed for high-liquidity cryptocurrency perpetual futures:
BTC/USDT, BTC/USD perpetuals
ETH perpetuals
Major L1 tokens with sufficient volume
For thinner order books, increase volume impulse multiplier and adjust quantity granularity to match exchange minimums.
Limitations and Compromises
Backtesting Considerations
TradingView strategy backtesting does not replicate broker execution. Actual fills, slippage, and commissions may differ
The strategy uses calc_on_every_tick=true and calc_on_order_fills=true to reduce bar-close distortions, but real execution still depends on broker infrastructure
At least 200 historical bars are required to stabilize regime classification, volume baselines, and cycle context
Market Structure Dependencies
BTC dominance feed ( CRYPTOCAP:BTC.D ) may lag during low-liquidity periods or weekends. Consider disabling the filter if data quality degrades
Volume impulse detection assumes consistent order book depth. During extreme volatility or exchange issues, volume signatures may be unreliable
Regime classification based on ATR percentage assumes normal volatility distributions. During black swan events, regime thresholds may not adapt quickly enough
Parameter Sensitivity
Default parameters are tuned for BTC/ETH perpetuals on 5-minute charts. Different assets or timeframes require recalibration
The composite signal strength threshold (55) balances selectivity vs. opportunity. Higher values reduce false signals but may miss valid setups
Risk per trade (0.65%) and max exposure (12%) are conservative defaults. Aggressive scaling increases drawdown risk
Execution Constraints
Same-bar re-entry requires broker support for rapid order placement
Quantity granularity must match exchange contract minimums
Kill switch drawdown (6.5%) may trigger during normal volatility cycles, requiring manual reset
Performance Expectations
This strategy is a framework for momentum-based cryptocurrency trading. Performance depends on:
Market conditions (trending vs. ranging)
Exchange execution quality
Parameter calibration for specific assets
Risk management discipline
Backtest results shown in publications reflect specific market conditions and parameter sets. Past performance does not indicate future results. Always forward test with paper trading or broker simulation before deploying live capital.
Code Structure
The strategy is organized into functional sections:
Configuration groups for parameter organization
Helper functions for position sizing and normalization
Core indicator calculations (MACD, EMA, ATR, RSI, MFI, volume analytics)
Regime classification logic
Multi-path signal generation and composite scoring
Entry/exit orchestration with risk management
Visualization layer with dashboard and chart elements
The source code is open and can be modified to suit your trading requirements. Everyone is encouraged to understand the logic before deploying and to test thoroughly in their target markets.
Modification Guidelines
When adapting this strategy:
Document any parameter changes in your publication
Test modifications across different market regimes
Validate position sizing logic for your exchange's contract specifications
Consider exchange-specific limitations (funding rates, liquidation mechanics, order types)
Conclusion
This strategy provides a structured approach to cryptocurrency momentum trading with regime awareness and adaptive risk controls. It is not a guaranteed profit system, but rather a framework that requires understanding, testing, and ongoing calibration to market conditions.
You should thoroughly understand the logic, test extensively in their target markets, and manage risk appropriately. The strategy's effectiveness depends on proper parameter tuning, reliable execution infrastructure, and disciplined risk management.
Disclaimer
This script and its documentation are for educational and informational purposes only. They do not constitute financial advice, investment recommendations, or trading advice of any kind. Trading cryptocurrencies and derivatives involves substantial risk of loss and is not suitable for all investors. Past performance, whether real or indicated by backtesting, does not guarantee future results.
This strategy is provided "as is" without any warranties or guarantees of profitability
You should not rely solely on this strategy for making trading decisions
Always conduct your own research and analysis before making any financial decisions
Consider consulting with a qualified financial advisor before engaging in trading activities
The authors and contributors are not responsible for any losses incurred from using this strategy
Cryptocurrency trading can result in the loss of your entire investment
Only trade with capital you can afford to lose
Use this strategy at your own risk. The responsibility for any trading decisions and their consequences lies entirely with you.

Sniper VFI: Institutional Breakout & HeatmapDescription:
Overview This is a professional-grade momentum indicator designed to track Institutional Smart Money flow while filtering for high-probability breakout setups. It combines volume analysis, trend filtration, and price action triggers into a single dashboard.
How It Works The indicator operates on a three-step validation process:
Trend Filter: Uses a 150 EMA to define the major trend. Long positions are only permitted above the 150 EMA, and Short positions only below it.
Institutional Volume (VFI): Analyzes the Volume Flow Indicator to ensure Smart Money is participating in the move.
Micro-Breakout Trigger: Signals are only generated if the price breaks the High (for Longs) or Low (for Shorts) of the last 3 candles, ensuring immediate momentum.
Visual Guide & Legend
The Histogram (Volume & Momentum):
Bright Lime: Strong Bullish Impulse. Institutional money is flowing in, and momentum is accelerating.
Dark Green: Stable Uptrend. The trend is healthy.
Bright Red: Strong Bearish Impulse. Institutional money is flowing out, and downside momentum is accelerating.
Maroon: Stable Downtrend.
The Heatmap Tips (RSI Temperature):
Orange Tips: Overbought Warning (RSI > 70). The asset is heating up; caution is advised for new long entries. The opacity increases as RSI approaches 100.
White Tips: Oversold Warning (RSI < 30). The asset is extended to the downside.
The Signals (L/S):
L (Long): Confirmed entry. Trend is Up + VFI Positive + Price broke the recent 3-candle High.
S (Short): Confirmed entry. Trend is Down + VFI Negative + Price broke the recent 3-candle Low.
Note: This tool includes an alternating signal filter to prevent repetitive signals during trends. A Long signal will not repeat until a Short signal or a trend reset occurs.

Mickey's Breaker Engine⚡ Breaker Engine | Auto Retest + Smart R:R Targets
A precision-grade breaker-block detection system built for traders who live and breathe clean structure.
This indicator automatically detects Breaker Candles, confirms them, marks their zones, and executes intelligent retest-based entry logic — complete with Stop-Loss and Risk-to-Reward (R:R) tracking up to 3R (or any custom ratio).
🧠 Core Concept
A Breaker Block is a structural shift where price violates liquidity from a failed order block and flips the zone’s polarity — turning a former supply into demand (or vice-versa).
This script identifies those setups automatically, confirms them only after a valid structure break, and waits for a clean retest to trigger a trade signal.
🚀 Key Features
⚙️ Smart Zone Detection
Detects both Bullish Breakers and Bearish Breakers.
Zones are drawn precisely using the breaker’s middle candle body (or full wick range if enabled).
Fully configurable transparency, width, and extension for better visual context.
🎯 Auto Retest Entry Logic
Entry triggers only on a clean retest, not on immediate breakout.
Includes logical filters to ensure retests are structurally valid and not overlapping candles.
Works in any timeframe or market — crypto, forex, indices, or commodities.
💡 Dynamic Risk–Reward Tracking
Automatically plots 1R, 2R, 3R, ...R targets based on your defined stop range.
Risk is calculated from entry to zone boundary or ATR offset.
Each target label appears precisely when hit.
Targets automatically stop updating once Stop-Loss is triggered.
🧱 Visual Clarity
BUY 🟢 / SELL 🔴 bubbles at entries.
SL ❌ marker when stop is hit.
🎯 1R / 2R / 3R labels dynamically plotted when each reward level is reached.
Non-overlapping placement using ATR-based spacing.
⚡ Real-Time Alerts - Instant alerts for:
✅ “Breaker BUY” – Clean retest confirmed (Long setup)
✅ “Breaker SELL” – Clean retest confirmed (Short setup)
❌ “Breaker BUY SL” – Stop hit for Long
❌ “Breaker SELL SL” – Stop hit for Short
🧩 Customization Panel
| Setting | Description |
| :-------------------------- | :------------------------------------------------------------------------------ |
| **ATR Length** | Controls volatility-based offset sizing. |
| **Entry / SL Offset × ATR** | Adjusts label spacing and dynamic positioning. |
| **Risk-Reward Ratio** | Define default R:R (e.g. 1:3). |
| **Multiple Retests** | Enable if you want the same breaker zone to allow multiple retests/entries. |
| **Banner Design** | Control opacity, extension, and wick usage for the breaker block visualization. |
| **Color Controls** | Choose your BUY/SELL/SL bubble colors to match your chart theme. |
⚙️ Underlying Logic (At a Glance)
Pattern Detection:
Identifies a 5-bar sequence that forms a valid Breaker Candle (the middle bar flips structure).
Confirmation:
Requires a follow-through candle to validate a real liquidity break.
Zone Registration:
Stores the breaker zone’s body range in arrays for tracking.
Clean Retest Entry:
Waits for price to retest the zone from the opposite side and close cleanly inside.
Stop Loss / Target Projection:
Defines stop loss just beyond the zone and plots up to 3 × reward targets dynamically.
Monitoring & Alerts:
Tracks each setup independently until either an R-target or SL is reached.
💬 Recommended Usage
Works best with market-structure traders, smart-money concepts, or liquidity-based systems.
Combine it with an external displacement confirmation or BOS/CHOCH tool for best precision.
Ideal for backtesting breaker-based R:R consistency or forward-testing retest entries.
Compatible with any asset / timeframe.
🧭 Disclaimer
This script is for educational and analytical purposes only.
It is not financial advice and should not be used to make trading decisions without independent confirmation or risk management.
Always test on demo data before deploying live.

Multi EMA + Indicators + Mini-Dashboard + Reversals v6📘 Multi EMA + Indicators + Mini-Dashboard + Reversals v6
🧩 Overview
This indicator is a multi-EMA setup that combines trend, momentum, and reversal analysis in a single visual framework.
It integrates four exponential moving averages (EMAs), key oscillators (RSI, MACD, Stochastic, CCI), volatility filtering (ATR), and a dynamic mini-dashboard that summarizes all signals in real time.
Its purpose is to help traders visually confirm trend alignment, filter valid entries, and identify possible trend continuation or reversal points.
It can display buy/sell arrows, detect reversal candles, and issue alerts when trading conditions are met.
⚙️ Core Components
1. Moving Averages (EMA Setup)
EMA1 (fast) and EMA2 (medium) define the short-term trend and trigger bias.
When the price is above both EMAs → bullish bias.
When below → bearish bias.
EMA3 and EMA4 act as trend filters. Their slopes (up or down) confirm overall momentum and help validate signals.
Each EMA has customizable lengths, sources, and colors for up/down trends.
This “EMA stack” is the foundation of the setup — a structured trend-following framework that adapts to market speed and volatility.
2. Momentum and Confirmation Filters
Each indicator can be individually enabled or disabled for flexibility.
RSI: confirms direction (above/below 50).
MACD: detects momentum crossover (MACD > Signal for bullish confirmation).
Stochastic: identifies trend continuation (K > D for longs, K < D for shorts).
CCI: adds trend bias above/below a threshold.
ATR Filter: filters out small, low-volatility candles to reduce noise.
You can activate only the filters that fit your trading plan — for instance, trend traders often use RSI and MACD, while scalpers may rely on Stochastic and ATR.
3. Reversal Detection
The indicator includes an optional Reversal Section that independently detects potential turning points.
It combines multiple configurable criteria:
Candlestick patterns (Bullish Hammer, Shooting Star).
Large Candle filter — detects unusually large bars (relative to close).
Price-to-EMA distance — identifies overextended moves that might revert.
RSI Divergence — detects potential momentum shifts.
RSI Overbought/Oversold zones (70/30 by default).
Doji Candles — sign of indecision.
A bullish or bearish reversal signal appears when enough selected criteria are met.
All sub-modules can be toggled on/off individually, giving you full control over sensitivity.
4. Signal Logic
Buy and sell signals are triggered when EMA alignment and the chosen confirmations agree:
Buy Signal
→ Price above EMA1 & EMA2
→ Confirmations (RSI/MACD/Stoch/CCI/ATR) pass
→ Trend filters (EMA3/EMA4) point upward
Sell Signal
→ Price below EMA1 & EMA2
→ Confirmations align bearishly
→ Trend filters (EMA3/EMA4) slope downward
Reversal signals can appear independently, even against the current EMA trend, depending on your settings.
5. Visual Dashboard
A mini-dashboard appears near the chart showing:
Current trade bias (LONG / SHORT / NEUTRAL)
EMA3 and EMA4 trend directions (↑ / ↓)
Quick visual bars (🟩 / 🟥) for each filter: RSI, MACD, Stoch, ATR, CCI, EMA filters
Reversal criteria status (Doji, RSI divergence, candle size, etc.)
This panel gives you a compact overview of all indicator states at a glance.
The color of the panel changes dynamically — green for bullish, red for bearish, gray for neutral.
6. Alerts
Built-in alerts allow automation or notifications:
Buy Alert
Sell Alert
Reversal Buy
Reversal Sell
You can connect these alerts to TradingView notifications or external bots for semi-automated execution.
💡 How to Use
✅ Trend-Following Setup
Focus on trades in the direction of EMA1 & EMA2.
Confirm with EMA3 & EMA4 trending in the same direction.
Use RSI/MACD/Stoch filters to ensure momentum supports the trade.
Avoid entries when ATR filter indicates low volatility.
🔄 Reversal Setup
Enable the Reversal section for potential tops/bottoms.
Look for reversal buy signals near support zones or after strong downtrends.
Use RSI divergence or Doji + Hammer signals as confirmation.
Combine with key chart areas (supply/demand or previous swing levels).
⚖️ Combination Approach
Trade continuation signals when all EMAs are aligned and filters are green.
Trade reversals only when at a key area (support/resistance) and confirmed by reversal conditions.
Always check higher-timeframe bias before entering a trade.
🧭 Practical Tips
Use different EMA sets for different timeframes:
9/21/50/100 for swing or trend trades.
5/13/34/89 for intraday scalping.
Turn off filters you don’t use to reduce lag.
Always validate signals with price structure, not just indicator alignment.
Practice in replay mode before live trading.
🗺️ Key Chart Confluence (Highly Recommended)
Although the indicator provides structured signals, its best use is in confluence with:
Support and resistance levels
Supply/demand zones
Trendlines and channels
Liquidity pools
Volume clusters
Signals aligned with strong key areas on the chart tend to have greater reliability than isolated indicator triggers.
I use EMA 1 - 20 Open ; EMA 2 - 20 Close ; EMA 3 - 50 ; EMA 4 - 200 or 100 , but that's me...
⚠️ Important Disclaimer
This indicator is a technical tool, not a guarantee of results.
Trading involves risk, and no signal is ever 100% accurate.
Every trader should develop a personal strategy, use proper risk management, and adapt settings to their instrument and timeframe.
Always combine indicator signals with key chart areas, higher-timeframe context, and your own analysis before taking a trade.

Liquidity Lines 2.0Liquidity Lines Indicator Description:
This indicator detects points of liquidity based on reversals in price action. It simulates simple moving average (SMA) candles and identifies when raw price candles engulf either the low of a bullish SMA candle or the high of a bearish SMA candle. The liquidity point is then placed at the high of the bearish SMA candle or the low of the bullish SMA candle. These levels often correspond to areas where many traders place stop-loss orders and can provide insight into where “smart money” might be hunting liquidity.
Features and Alerts:
Liquidity Lines automatically track upper and lower liquidity levels and plot them as customizable horizontal lines on the chart. Users can adjust line length, color, width, and style, and choose whether lines extend to the right. The indicator also detects when these liquidity levels are “swept” by price and triggers alerts in real time, allowing traders to be notified of potential stop-loss hunts or key market reactions as they happen. This makes it easy to monitor critical liquidity zones without constantly watching the chart.
How to Use Strategically:
Traders can use these liquidity points to anticipate potential price reactions. For example, if price approaches a lower liquidity line from above, it may act as support or a zone where stop orders are being triggered. Conversely, an upper liquidity line may act as resistance or a trigger zone for stops above the market. Combining these levels with your existing market structure, trend analysis, or confirmation signals can help identify high-probability entries, exits, and areas where smart money activity may occur.

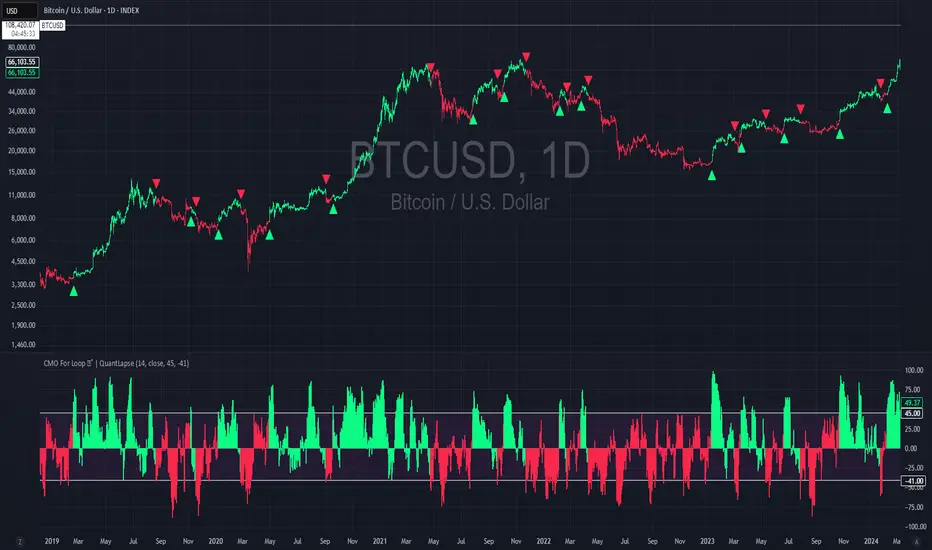
CMO For Loop | QuantLapseCMO For Loop Indicator
The CMO For Loop indicator, inspired by Alex Orekhov's, "Chande Momentum Oscillator," and indicator originally made by Tushar Chande, the CMO designed as a fast and responsive tool to capture quick price movements in financial markets. This oscillator leverages Momentum to measure price deviations, providing a concise yet powerful framework for identifying potential trade entry and exit points. What makes this
"enhanced" CMO indicator special is its ability to identify trending periods more accurately. By using thresholds, this allows the script to enter accurate long and short conditions extremely quickly.
Intended Uses:
Used to capture long-term trends:
Used to identify quick reversals:
Recommended Uses
Best suited for higher timeframes (8H+) to improve accuracy of signals.
Designed for strategies that require fast entries and exits.
Can also be applied to scalping approaches.
Not Recommended For
Should not be used as a mean reversion tool.
Should not be interpreted as a valuation indicator (overbought/oversold levels).
Key Features
Rapid Market Reaction
Built to prioritize speed over smoothing, making it ideal for traders who want to take advantage of quick price shifts in trending or highly volatile markets.
Flexible Thresholds
Users can customize the upper and lower CMO levels to trigger long or short conditions, allowing the indicator to adapt to different assets and trading styles.
Embracing the Noise
Signals may appear frequently, but this is intentional. The tool is optimized for traders who thrive on fast rotations, using the “noise” to catch short-lived yet impactful moves.
Clear Visual Feedback
Plots key oscillator levels and provides dynamic, color-coded candles and shapes that make it easy to identify bias and react quickly.
How It Works
Oscillator Calculation
The CMO (Chande Momentum Oscillator) is derived from comparing the source price’s deviations relative to its momentum. This approach emphasizes trend-driven price shifts.
Signal Triggers
When the oscillator rises above the upper threshold, a long bias is triggered and remains until the CMO drops below the lower threshold.
When the oscillator falls below the lower threshold, a short bias is triggered and remains until the CMO crosses back above the upper threshold.
No bias is active when the oscillator is between thresholds.
Visual Signals
Green candles = long bias
Red candles = short bias
Gray candles = neutral/no signal
Triangles mark points of change in signal direction.
Breakout Volume Momentum [5m]Breakout Volume Momentum Indicator (Pine Script v5)
This TradingView Pine Script v5 indicator plots a green dot below a 5-minute price bar whenever all the breakout and volume conditions are met. It is optimized for live intraday trading (not backtesting) and includes customizable inputs for thresholds and trading session times. Key features and conditions of this indicator:
Gap Up Threshold: Current price is up at least X% (default 20%) from the previous day’s close (uses higher-timeframe daily data) before any signal can trigger.
Relative Volume (RVOL): Current bar’s volume is at least Y× (default 2×) the average volume of the last 20 bars. This ensures unusually high volume is present, indicating strong interest.
Trend Alignment: Price is trading above the VWAP (Volume-Weighted Average Price) and above a fast EMA. In addition, the fast EMA (default 9) is above the slower EMA (default 20) to confirm bullish momentum
tradingview.com
tradingview.com
. These filters ensure the stock is in an intraday uptrend (above the average price and rising EMAs).
Intraday Breakout (optional): Optionally require the price to break above the recent intraday high (default last 30 bars). If enabled, a signal only occurs when the stock exceeds its prior range high, confirming a breakout. This can be toggled on/off in the settings.
Avoid Parabolic Spikes: The script skips any bar with an excessively large range (default >12% from low to high), to avoid triggering on spiky or unsustainable parabolic candles.
Time Window Filter: Signals are restricted to a specific session window (by default 09:30 – 11:00 exchange time, typically the morning session) and will not trigger outside these hours. The session window is adjustable via inputs
stackoverflow.com
.
Alerts: An alert condition is provided so you can set a Trading View alert to send a push notification when a green dot signal fires. The alert message includes the ticker and price at the time of signal.

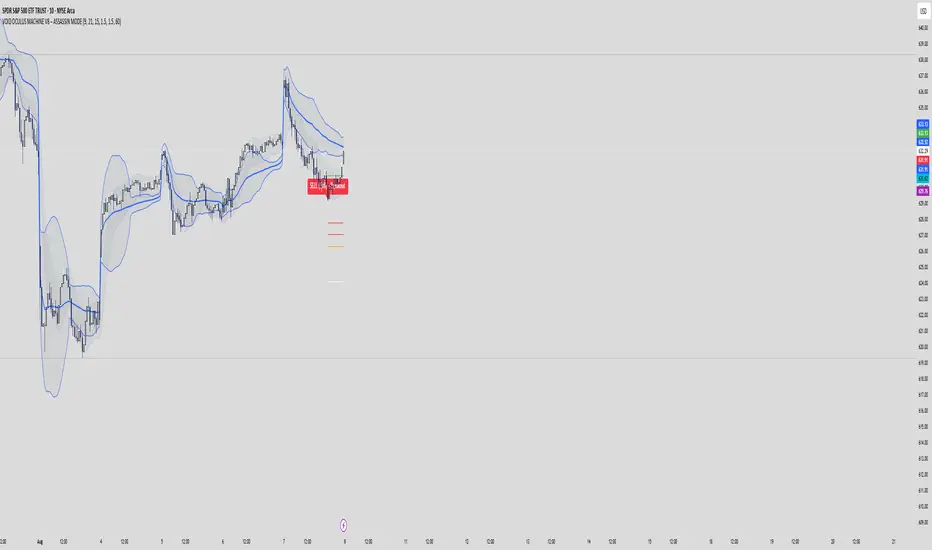
VOID OCULUS MACHINE V8 – ASSASSIN MODEVOID OCULUS MACHINE V8 – ASSASSIN MODE
Version 8.0 | Pine Script v6
Purpose & Originality
VOID OCULUS MACHINE V8 – ASSASSIN MODE brings together four advanced trading filters—EMA crossovers, TRIX momentum, VWAP band positioning, and a proprietary “Predictive Cloud”—into a single, high-precision entry system. Rather than relying on any one signal, it calculates a confidence score combining trend, momentum, volume, and volatility cues, then triggers only the highest-probability setups once a user-defined threshold is met. This multi-layer architecture offers traders laser-focused entries (“Assassin Mode”) with built-in risk (stop) and reward (targets) visualization.
How It Works & Component Rationale
EMA Trend Alignment
Fast EMA (9) vs. Slow EMA (21): Captures short-term versus medium-term trend. A bullish bias requires EMA9 > EMA21, bearish bias EMA9 < EMA21.
TRIX Momentum Filter
A triple-smoothed EMA oscillator over 15 bars, expressed as a percentage change. Positive TRIX confirms upward momentum; negative TRIX confirms downward momentum.
Gaussian Noise Reduction
Dual 5-period EMA smoothing of price removes short-term noise, creating a “cloud base.” Entries only fire when price interacts favorably with this smoothed baseline.
VWAP Band Confirmation (Optional)
Calculates session VWAP ± one standard deviation over 20 bars, plotting upper/lower bands. Traders can require price to sit above/below VWAP mid for trend confirmation.
Predictive Cloud Overlay
A dynamic band (Gaussian ± ATR) forecasts a near-term “value zone.” Pullback and reversal entries can occur as price re-enters or breaks out of this cloud.
Confidence Scoring
Starts at 0 and adds:
+30 for EMA trend alignment (bull or bear)
+20 for volume spike (>20-bar SMA)
+20 for non-zero TRIX slope
+20 for ATR expansion (volatility ramping)
+10 if price is above or below VWAP mid (if VWAP filter is enabled)
Only fires signals when confidence ≥ 60% (configurable), ensuring multi-factor confluence.
Entry Type Differentiation
Breakout: Price pierces prior 10-bar high/low on volume and ATR expansion.
Pullback: Trend bias plus a crossover of price with EMA9.
Reversal: Price crosses back into the Predictive Cloud from outside, confirmed by VWAP cross.
Automated Trade Visualization
On each signal, clears previous objects, plots a “BUY (xx%) – ” or “SELL (xx%) – ” label, four tiered ATR-based targets (1×, 1.5×, 2×, 3.5×), and a stop-loss (ATR × 1.5).
Inputs & Customization
Input Description Default
Fast EMA Length for short-term trend EMA 9
Slow EMA Length for medium-term trend EMA 21
TRIX Length Period for triple-smoothed momentum oscillator 15
Stop Multiplier ATR multiple for stop-loss distance 1.5
Target Multiplier ATR multiple for first profit target 1.5
Enable VWAP Filter Require price alignment above/below VWAP mid On
Minimum Confidence Confidence % threshold to trigger a signal 60
Show Predictive Cloud Toggle the Gaussian ± ATR cloud on/off On
How to Use
Apply to Chart: Suitable on 5 m–1 h timeframes for swing entries.
Adjust Confidence & Filters: Raise the Minimum Confidence to tighten setups; disable VWAP filter for pure price/momentum plays.
Read Signals:
“BUY (75%) – Breakout” label means 75% confluence across filters, triggered by a breakout entry type.
Four colored horizontal lines mark TP1–TP4; a red line marks your stop.
Manage the Trade:
Use the plotted stop-loss line; scale out at targets or trail behind the Predictive Cloud.
Unique Value
VOID OCULUS MACHINE V8 stands out by quantifying multi-dimensional market context into a single confidence score and providing automated trade object plotting—no more manual target calculations or cluttered charts. Its “Assassin Mode” ensures only the most compelling setups trigger, saving traders time and reducing noise.
Disclaimer
This indicator is for educational purposes. Past performance does not guarantee future results. Always backtest across symbols/timeframes, combine with personal discretion, and apply strict risk management before trading live.
Opening-Range BreakoutNote: Default trading date range looks mediocre. Set date range to "Entire History" to see full effect of the strategy. 50.91% profitable trades, 1.178 profit factor, steady profits and limited drawdown. Total P&L: $154,141.18, Max Drawdown: $18,624.36. High R^2
█ Overview
The Opening-Range Breakout strategy is a mechanical, session‑based day‑trading system designed to capture the initial burst of directional momentum immediately following the market open. It defines a user‑configurable “opening range” window, measures its high and low boundaries, then places breakout stop orders at those levels once the range closes. Built‑in filters on minimum range width, reward‑to‑risk ratios, and optional reversal logic help refine entries and manage risk dynamically.
█ How It Works
Opening‑Range Formation
Between 9:30–10:15 AM ET (configurable), the script tracks the highest high and lowest low to form the day’s opening range box.
On the first bar after the range window closes, the range high (OR_high) and low (OR_low) are “locked in.”
Range‑Width Filter
To avoid false breakouts in low‑volatility mornings, the range must be at least X% of the current price (default 0.35%).
If the measured opening-range width < minimum threshold, no orders are placed that day.
Entry & Order Placement
Long: a stop‑buy order at the opening‑range high.
Short: a stop‑sell order at the opening‑range low.
Only one side can trigger (or both if reverse logic is enabled after a losing trade).
Risk Management
Once triggered, each trade uses an ATR‑style stop-loss defined as a percentage retracement of the range (default 50% of range width).
Profit target is set at a configurable Reward/Risk Ratio (default 1.1×).
Optional: Reverse on Stop‑Loss – if the initial breakout loses, immediately reverse into the opposite side on the same day.
Session Exit
Any open positions are closed at the end of the regular trading day (default 3:45 PM ET window end, with hard flat at session close).
Visual cues are provided via green (range high) and red (range low) step‑line plots directly on the chart, allowing you to see the range box and breakout triggers in real time.
█ Why It Works
Early Momentum Capture: The first 15 – 60 minutes of trading encapsulate overnight news digestion and institutional order flow, creating a well‑defined volatility “range.”
Mechanical Discipline: Clear, rule‑based entries and exits remove emotional guesswork, ensuring consistency.
Volatility Filtering: By requiring a minimum range width, the system avoids choppy, low‑range days where false breakouts are common.
Dynamic Sizing: Stops and targets scale with the opening range, adapting automatically to each day’s volatility environment.
█ How to Use
Set Your Instruments & Timeframe
-Apply to any futures contract on a 1‑ to 5‑minute chart.
-Ensure chart timezone is set to America/New_York.
Configure Inputs
-Opening‑Range Window: e.g. “0930-1015” for a 45‑minute range.
-Min. OR Width (%): e.g. 0.35 for 0.35% of current price.
-Reward/Risk Ratio: e.g. 1.1 for a modest profit target above your stop.
-Max OR Retracement %: e.g. 50 to set stop at 50% of range width.
-One Trade Per Day: toggle to limit to a single breakout.
-Reverse on Stop Loss: toggle to flip direction after a losing breakout.
Monitor the Chart
-Watch the green and red range boundaries form during the session open.
-Orders will automatically submit on the first bar after the range window closes, conditioned on your filters.
Review & Adjust
-Backtest across multiple months to validate performance on your preferred contract.
-Tweak range duration, minimum width, and R/R multiple to fit your risk tolerance and desired win‑rate vs. expectancy balance.
█ Settings Reference
Input Defaults
Opening‑Range Window - Time window to form OR (HHMM-HHMM) - 0930–1015
Regular Trading Day - Full session for EOD flat (HHMM-HHMM) - 0930–1545
Min. OR Width (%) - Minimum OR size as % of close to trigger orders - 0.35
Reward/Risk Ratio - Profit target multiple of stop‑loss distance - 1.1
Max OR Retracement (%) - % of OR width to use as stop‑loss distance - 50
One Trade Per Day - Limit to a single breakout order per day - false
Reverse on Stop Loss - Reverse direction immediately after a losing trade - true
Disclaimer
This strategy description and any accompanying code are provided for educational purposes only and do not constitute financial advice or a solicitation to trade. Futures trading involves substantial risk, including possible loss of capital. Past performance is not indicative of future results. Traders should assess their own risk tolerance and conduct thorough backtesting and forward-testing before committing real capital.

[blackcat] L1 Net Volume DifferenceOVERVIEW
The L1 Net Volume Difference indicator serves as an advanced analytical tool designed to provide traders with deep insights into market sentiment by examining the differential between buying and selling volumes over precise timeframes. By leveraging these volume dynamics, it helps identify trends and potential reversal points more accurately, thereby supporting well-informed decision-making processes. The key focus lies in dissecting intraday changes that reflect short-term market behavior, offering critical input for both swing and day traders alike. 📊
Key benefits encompass:
• Precise calculation of net volume differences grounded in real-time data.
• Interactive visualization elements enhancing interpretability effortlessly.
• Real-time generation of buy/sell signals driven by dynamic volume shifts.
TECHNICAL ANALYSIS COMPONENTS
📉 Volume Accumulation Mechanisms:
Monitors cumulative buy/sell volumes derived from comparative closing prices.
Periodically resets accumulation counters aligning with predefined intervals (e.g., 5-minute bars).
Facilitates identification of directional biases reflecting underlying market forces accurately.
🕵️♂️ Sentiment Detection Algorithms:
Employs proprietary logic distinguishing between bullish/bearish sentiments dynamically.
Ensures consistent adherence to predefined statistical protocols maintaining accuracy.
Supports adaptive thresholds adjusting sensitivities based on changing market conditions flexibly.
🎯 Dynamic Signal Generation:
Detects transitions indicating dominance shifts between buyers/sellers promptly.
Triggers timely alerts enabling swift reactions to evolving market dynamics effectively.
Integrates conditional logic reinforcing signal validity minimizing erroneous activations.
INDICATOR FUNCTIONALITY
🔢 Core Algorithms:
Utilizes moving averages along with standardized deviation formulas generating precise net volume measurements.
Implements Arithmetic Mean Line Algorithm (AMLA) smoothing techniques improving interpretability.
Ensures consistent alignment with established statistical principles preserving fidelity.
🖱️ User Interface Elements:
Dedicated plots displaying real-time net volume markers facilitating swift decision-making.
Context-sensitive color coding distinguishing positive/negative deviations intuitively.
Background shading highlighting proximity to key threshold activations enhancing visibility.
STRATEGY IMPLEMENTATION
✅ Entry Conditions:
Confirm bullish/bearish setups validated through multiple confirmatory signals.
Validate entry decisions considering concurrent market sentiment factors.
Assess alignment between net volume readings and broader trend directions ensuring coherence.
🚫 Exit Mechanisms:
Trigger exits upon hitting predetermined thresholds derived from historical analyses.
Monitor continuous breaches signifying potential trend reversals promptly executing closures.
Execute partial/total closes contingent upon cumulative loss limits preserving capital efficiently.
PARAMETER CONFIGURATIONS
🎯 Optimization Guidelines:
Reset Interval: Governs responsiveness versus stability balancing sensitivity/stability.
Price Source: Dictates primary data series driving volume calculations selecting relevant inputs accurately.
💬 Customization Recommendations:
Commence with baseline defaults; iteratively refine parameters isolating individual impacts.
Evaluate adjustments independently prior to combined modifications minimizing disruptions.
Prioritize minimizing erroneous trigger occurrences first optimizing signal fidelity.
Sustain balanced risk-reward profiles irrespective of chosen settings upholding disciplined approaches.
ADVANCED RISK MANAGEMENT
🛡️ Proactive Risk Mitigation Techniques:
Enforce strict compliance with pre-defined maximum leverage constraints adhering strictly to guidelines.
Mandatorily apply trailing stop-loss orders conforming to script outputs reinforcing discipline.
Allocate positions proportionately relative to available capital reserves managing exposures prudently.
Conduct periodic reviews gauging strategy effectiveness rigorously identifying areas needing refinement.
⚠️ Potential Pitfalls & Solutions:
Address frequent violations arising during heightened volatility phases necessitating manual interventions judiciously.
Manage false alerts warranting immediate attention avoiding adverse consequences systematically.
Prepare contingency plans mitigating margin call possibilities preparing proactive responses effectively.
Continuously assess automated system reliability amidst fluctuating conditions ensuring seamless functionality.
PERFORMANCE AUDITS & REFINEMENTS
🔍 Critical Evaluation Metrics:
Assess win percentages consistently across diverse trading instruments gauging reliability.
Calculate average profit ratios per successful execution measuring profitability efficiency accurately.
Measure peak drawdown durations alongside associated magnitudes evaluating downside risks comprehensively.
Analyze signal generation frequencies revealing hidden patterns potentially skewing outcomes uncovering systematic biases.
📈 Historical Data Analysis Tools:
Maintain comprehensive records capturing every triggered event meticulously documenting results.
Compare realized profits/losses against backtested simulations benchmarking actual vs expected performances accurately.
Identify recurrent systematic errors demanding corrective actions implementing iterative refinements steadily.
Document evolving performance metrics tracking progress dynamically addressing identified shortcomings proactively.
PROBLEM SOLVING ADVICE
🔧 Frequent Encountered Challenges:
Unpredictable behaviors emerging within thinly traded markets requiring filtration processes.
Latency issues manifesting during abrupt price fluctuations causing missed opportunities.
Overfitted models yielding suboptimal results post-extensive tuning demanding recalibrations.
Inaccuracies stemming from incomplete/inaccurate data feeds necessitating verification procedures.
💡 Effective Resolution Pathways:
Exclude low-liquidity assets prone to erratic movements enhancing signal integrity.
Introduce buffer intervals safeguarding major news/event impacts mitigating distortions effectively.
Limit ongoing optimization attempts preventing model degradation maintaining optimal performance levels consistently.
Verify reliable connections ensuring uninterrupted data flows guaranteeing accurate interpretations reliably.
USER ENGAGEMENT SEGMENT
🤝 Community Contributions Welcome
Highly encourage active participation sharing experiences & recommendations!
THANKS
Heartfelt acknowledgment extends to all developers contributing invaluable insights about volume-based trading methodologies! ✨

Ensemble Alerts█ OVERVIEW
This indicator creates highly customizable alert conditions and messages by combining several technical conditions into groups , which users can specify directly from the "Settings/Inputs" tab. It offers a flexible framework for building and testing complex alert conditions without requiring code modifications for each adjustment.
█ CONCEPTS
Ensemble analysis
Ensemble analysis is a form of data analysis that combines several "weaker" models to produce a potentially more robust model. In a trading context, one of the most prevalent forms of ensemble analysis is the aggregation (grouping) of several indicators to derive market insights and reinforce trading decisions. With this analysis, traders typically inspect multiple indicators, signaling trade actions when specific conditions or groups of conditions align.
Simplifying ensemble creation
Combining indicators into one or more ensembles can be challenging, especially for users without programming knowledge. It usually involves writing custom scripts to aggregate the indicators and trigger trading alerts based on the confluence of specific conditions. Making such scripts customizable via inputs poses an additional challenge, as it often involves complicated input menus and conditional logic.
This indicator addresses these challenges by providing a simple, flexible input menu where users can easily define alert criteria by listing groups of conditions from various technical indicators in simple text boxes . With this script, you can create complex alert conditions intuitively from the "Settings/Inputs" tab without ever writing or modifying a single line of code. This framework makes advanced alert setups more accessible to non-coders. Additionally, it can help Pine programmers save time and effort when testing various condition combinations.
█ FEATURES
Configurable alert direction
The "Direction" dropdown at the top of the "Settings/Inputs" tab specifies the allowed direction for the alert conditions. There are four possible options:
• Up only : The indicator only evaluates upward conditions.
• Down only : The indicator only evaluates downward conditions.
• Up and down (default): The indicator evaluates upward and downward conditions, creating alert triggers for both.
• Alternating : The indicator prevents alert triggers for consecutive conditions in the same direction. An upward condition must be the first occurrence after a downward condition to trigger an alert, and vice versa for downward conditions.
Flexible condition groups
This script features six text inputs where users can define distinct condition groups (ensembles) for their alerts. An alert trigger occurs if all the conditions in at least one group occur.
Each input accepts a comma-separated list of numbers with optional spaces (e.g., "1, 4, 8"). Each listed number, from 1 to 35, corresponds to a specific individual condition. Below are the conditions that the numbers represent:
1 — RSI above/below threshold
2 — RSI below/above threshold
3 — Stoch above/below threshold
4 — Stoch below/above threshold
5 — Stoch K over/under D
6 — Stoch K under/over D
7 — AO above/below threshold
8 — AO below/above threshold
9 — AO rising/falling
10 — AO falling/rising
11 — Supertrend up/down
12 — Supertrend down/up
13 — Close above/below MA
14 — Close below/above MA
15 — Close above/below open
16 — Close below/above open
17 — Close increase/decrease
18 — Close decrease/increase
19 — Close near Donchian top/bottom (Close > (Mid + HH) / 2)
20 — Close near Donchian bottom/top (Close < (Mid + LL) / 2)
21 — New Donchian high/low
22 — New Donchian low/high
23 — Rising volume
24 — Falling volume
25 — Volume above average (Volume > SMA(Volume, 20))
26 — Volume below average (Volume < SMA(Volume, 20))
27 — High body to range ratio (Abs(Close - Open) / (High - Low) > 0.5)
28 — Low body to range ratio (Abs(Close - Open) / (High - Low) < 0.5)
29 — High relative volatility (ATR(7) > ATR(40))
30 — Low relative volatility (ATR(7) < ATR(40))
31 — External condition 1
32 — External condition 2
33 — External condition 3
34 — External condition 4
35 — External condition 5
These constituent conditions fall into three distinct categories:
• Directional pairs : The numbers 1-22 correspond to pairs of opposing upward and downward conditions. For example, if one of the inputs includes "1" in the comma-separated list, that group uses the "RSI above/below threshold" condition pair. In this case, the RSI must be above a high threshold for the group to trigger an upward alert, and the RSI must be below a defined low threshold to trigger a downward alert.
• Non-directional filters : The numbers 23-30 correspond to conditions that do not represent directional information. These conditions act as filters for both upward and downward alerts. Traders often use non-directional conditions to refine trending or mean reversion signals. For instance, if one of the input lists includes "30", that group uses the "Low relative volatility" condition. The group can trigger an upward or downward alert only if the 7-period Average True Range (ATR) is below the 40-period ATR.
• External conditions : The numbers 31-35 correspond to external conditions based on the plots from other indicators on the chart. To set these conditions, use the source inputs in the "External conditions" section near the bottom of the "Settings/Inputs" tab. The external value can represent an upward, downward, or non-directional condition based on the following logic:
▫ Any value above 0 represents an upward condition.
▫ Any value below 0 represents a downward condition.
▫ If the checkbox next to the source input is selected, the condition becomes non-directional . Any group that uses the condition can trigger upward or downward alerts only if the source value is not 0.
To learn more about using plotted values from other indicators, see this article in our Help Center and the Source input section of our Pine Script™ User Manual.
Group markers
Each comma-separated list represents a distinct group , where all the listed conditions must occur to trigger an alert. This script assigns preset markers (names) to each condition group to make the active ensembles easily identifiable in the generated alert messages and labels. The markers assigned to each group use the format "M", where "M" is short for "Marker" and "x" is the group number. The titles of the inputs at the top of the "Settings/Inputs" tab show these markers for convenience.
For upward conditions, the labels and alert messages show group markers with upward triangles (e.g., "M1▲"). For downward conditions, they show markers with downward triangles (e.g., "M1▼").
NOTE: By default, this script populates the "M1" field with a pre-configured list for a mean reversion group ("2,18,24,28"). The other fields are empty. If any "M*" input does not contain a value, the indicator ignores it in the alert calculations.
Custom alert messages
By default, the indicator's alert message text contains the activated markers and their direction as a comma-separated list. Users can override this message for upward or downward alerts with the two text fields at the bottom of the "Settings/Inputs" tab. When the fields are not empty , the alerts use that text instead of the default marker list.
NOTE: This script generates alert triggers, not the alerts themselves. To set up an alert based on this script's conditions, open the "Create Alert" dialog box, then select the "Ensemble Alerts" and "Any alert() function call" options in the "Condition" tabs. See the Alerts FAQ in our Pine Script™ User Manual for more information.
Condition visualization
This script offers organized visualizations of its conditions, allowing users to inspect the behaviors of each condition alongside the specified groups. The key visual features include:
1) Conditional plots
• The indicator plots the history of each individual condition, excluding the external conditions, as circles at different levels. Opposite conditions appear at positive and negative levels with the same absolute value. The plots for each condition show values only on the bars where they occur.
• Each condition's plot is color-coded based on its type. Aqua and orange plots represent opposing directional conditions, and purple plots represent non-directional conditions. The titles of the plots also contain the condition numbers to which they apply.
• The plots in the separate pane can be turned on or off with the "Show plots in pane" checkbox near the top of the "Settings/Inputs" tab. This input only toggles the color-coded circles, which reduces the graphical load. If you deactivate these visuals, you can still inspect each condition from the script's status line and the Data Window.
• As a bonus, the indicator includes "Up alert" and "Down alert" plots in the Data Window, representing the combined upward and downward ensemble alert conditions. These plots are also usable in additional indicator-on-indicator calculations.
2) Dynamic labels
• The indicator draws a label on the main chart pane displaying the activated group markers (e.g., "M1▲") each time an alert condition occurs.
• The labels for upward alerts appear below chart bars. The labels for downward alerts appear above the bars.
NOTE: This indicator can display up to 500 labels because that is the maximum allowed for a single Pine script.
3) Background highlighting
• The indicator can highlight the main chart's background on bars where upward or downward condition groups activate. Use the "Highlight background" inputs in the "Settings/Inputs" tab to enable these highlights and customize their colors.
• Unlike the dynamic labels, these background highlights are available for all chart bars, irrespective of the number of condition occurrences.
█ NOTES
• This script uses Pine Script™ v6, the latest version of TradingView's programming language. See the Release notes and Migration guide to learn what's new in v6 and how to convert your scripts to this version.
• This script imports our new Alerts library, which features functions that provide high-level simplicity for working with complex compound conditions and alerts. We used the library's `compoundAlertMessage()` function in this indicator. It evaluates items from "bool" arrays in groups specified by an array of strings containing comma-separated index lists , returning a tuple of "string" values containing the marker of each activated group.
• The script imports the latest version of the ta library to calculate several technical indicators not included in the built-in `ta.*` namespace, including Double Exponential Moving Average (DEMA), Triple Exponential Moving Average (TEMA), Fractal Adaptive Moving Average (FRAMA), Tilson T3, Awesome Oscillator (AO), Full Stochastic (%K and %D), SuperTrend, and Donchian Channels.
• The script uses the `force_overlay` parameter in the label.new() and bgcolor() calls to display the drawings and background colors in the main chart pane.
• The plots and hlines use the available `display.*` constants to determine whether the visuals appear in the separate pane.
Look first. Then leap.

ORB - Alerts, VWAP and MACD Checks, Extended Fib Levels
ORB Range Alerter with Shading, VWAP Check, MACD Check, and Extended Fibonacci Levels for TP – Fully Customizable
This indicator is designed to give you a comprehensive analysis of the Opening Range Breakout (ORB) combined with advanced conditions based on VWAP and MACD indicators, along with Extended Fibonacci Levels for both long and short TP positions.
Key Features:
Opening Range Breakout (ORB):
Defines the opening range at the market open (9:30 AM by default) based on your chart timeframe and shades it for visibility.
The high and low of the first candle after the open are plotted on the chart, creating a breakout range that traders can use to identify potential long or short positions.
VWAP Condition (Optional):
This indicator includes the option to enforce the VWAP (Volume-Weighted Average Price) as a condition for entering trades.
- Longs will only trigger if the price is above VWAP (when enabled).
- Shorts will only trigger if the price is below VWAP (when enabled).
Customizable : You can enable or disable the VWAP condition through a simple checkbox in the indicator’s settings.
MACD Condition (Optional):
Includes an optional MACD (Moving Average Convergence Divergence) condition.
- Longs will only trigger if the MACD line is above 0 and the signal line, providing confirmation of bullish momentum.
- Shorts will only trigger if the MACD line is below 0 and the signal line, indicating bearish momentum.
Customizable : You can enable or disable the MACD condition through a checkbox in the indicator’s settings, allowing you to trade with or without the MACD confirmation.
Fibonacci Extensions for Profit Targets:
Automatically calculates Fibonacci extension levels based on the ORB range for TP levels.
These levels provide key areas for potential profit-taking or reversal points.
Fibonacci extensions are plotted only after a confirmed breakout, either long or short.
The extensions include 127.2%, 161.8%, 200%, 261.8%, 423.6%, and 685.4%, offering a comprehensive set of targets for different trading strategies.
Shading of ORB Range:
The ORB high and low are visually emphasized on the chart with a shaded area for easy identification.
The shading is semi-transparent to help keep your chart clean and easy to read.
Customizable Timeframe:
The ORB range is defined based on the time of day (default is 9:30 AM to 4:00 PM), but you can adjust the timeframe to suit different trading sessions or markets.
Alerts for Breakouts:
Built-in alerts notify you when price crosses above or below the ORB high or low, along with the optional VWAP and MACD conditions.
Alerts can be used to create automated notifications or even execute automated trades based on your chosen settings.
How to Use:
Long Trade Example: When the price crosses above the ORB high, VWAP is above the price, and MACD shows bullish momentum (if these conditions are enabled), a potential long entry is triggered. You can use the Fibonacci extensions for profit targets.
Short Trade Example: When the price crosses below the ORB low, VWAP is below the price, and MACD confirms bearish momentum (if these conditions are enabled), a short entry is triggered. Fibonacci levels for the short position can guide your exit strategy.
Flexibility: You can enable or disable both VWAP and MACD conditions based on your trading style. This flexibility allows the indicator to adapt to different market conditions and strategies.
Customization Options:
Enable/Disable VWAP Condition: Decide if you want to include VWAP as a trade filter.
Enable/Disable MACD Condition: Choose whether to require MACD as confirmation for trade entries.
Adjust ORB Timeframe: Customize the time range for defining the ORB based on the market you're trading.
Fibonacci Extensions: Visualize key profit targets using Fibonacci extensions, which are automatically calculated and displayed after a breakout.

[The_lurker] RSI-MFI-WPR Indicatoris an advanced trading indicator developed for the TradingView platform, which synergistically refers to the insights of three popular technical analysis tools: the Relative Strength Index (RSI), the Money Flow Index (MFI) and the Williams Indicator. Percentage range (WPR). This indicator is precisely designed to help traders identify potential buy and sell opportunities by accurately interpreting market momentum, volume, and price position relative to recent highs and lows.
The primary goal of the RSI-MFI-WPR Indicator is to provide a comprehensive tool that leverages the combined power of RSI, MFI and WPR to detect overbought and oversold conditions, indicating potential market reversal points. This multi-faceted approach aims to provide traders with a more robust framework for making informed decisions, and enhance their trading strategy through multi-indicator analysis.
Explanation of the indicator conditions
The essence of this indicator lies in its strategic conditions that indicate possible entry and exit points:
Oversold Condition (Condition): This is determined when the RSI and MFI are below 30, and the WPR drops below -91, indicating a strong oversold condition in the market. Such a scenario usually indicates a buying opportunity, assuming that the market may rebound from this oversold state.
Divergence Condition (Condition 1): Checks if the MFI exceeds 2.1 times the RSI. This unique case aims to highlight instances where there is a significant inflow of funds into an asset, which is not proportionately reflected in its RSI, which may indicate an upcoming price increase or highlight an unusual market situation for further From the analysis.
Overbought Warning (conditionExit): An exit signal is triggered when both the MFI and RSI exceed 85, and the WPR is above -15. This combination indicates an overbought condition in the market, indicating that the asset may be overvalued and that a price correction or reversal may be imminent, thus indicating a potential selling opportunity or a warning of initiating new positions.
Application and visualization
The RSI-MFI-WPR Indicator not only provides numerical insights but also displays these conditions on a TradingView chart. Through the use of color coding and plotting, it provides traders with an intuitive way to distinguish market conditions, enabling quick and effective decision-making. Incorporating alert conditions ensures that traders are immediately notified of important market events, in line with their strategic trading objectives.
Planning and alerts in “RSI-MFI-WPR Indicator”
Collected alert status
CombinedAlertCondition is a logical statement that combines all individual conditions (Condition, Condition1, Condition Exit, and The_lurkerMFI_oversold) into a single alert trigger. This condition becomes true and triggers an alert if any of the conditions specified for potential trading opportunities or warnings are met. It is designed to provide a comprehensive alert system that informs the trader of any important signal identified by the indicator, including entry and exit signals as well as oversold conditions.
Visual indicators
Background color for oversold condition: The script sets the background color to a specific shade of blue ( with 90% transparency) when the custom MFI indicates an oversold condition (The_lurkerMFI_oversold). This visual signal helps traders quickly recognize periods when the market may be undervalued and potentially poised for a rebound.
Drawing warning and exit signs:
Entry Signals: For Condition and Condition 1, which identify potential entry points, the indicator draws upward pointing triangles below the price bars. These triangles are colored in specific shades to differentiate signals from a fundamental oversold condition and a divergence condition, making it intuitive for traders to recognize the type of signal.
Exit Signals: For an exit condition, which indicates overbought conditions that may indicate an impending price correction, red downward-pointing triangles are drawn above the price bars. This serves as a clear visual warning to consider exiting positions or proceed with caution.
Configure the alarm
The script uses the conditional alert function to create an alert based on the AlertCondition combination. When this condition is met, any of the predefined signals are indicated
Conclusion
In short, the “RSI-MFI-WPR Indicator” stands out as a versatile and dynamic indicator that enriches a trader's toolkit by combining the analytical strengths of RSI, MFI and WPR. By setting clear conditions for entry and exit points from the market, it facilitates a proactive approach to trading, based on a detailed examination of market dynamics. This indicator demonstrates how mixing multiple technical tools can lead to more informed and accurate market analysis, with the aim of elevating the trading experience on Tradingview.
==================================================================================
هو مؤشر تداول متقدم تم تطويره لمنصة TradingView،
والذي يشير بشكل تآزري إلى رؤى ثلاث أدوات تحليل فني شائعة:
1- مؤشر القوة النسبية (RSI)،
2- مؤشر تدفق الأموال (MFI)،
3- مؤشر ويليامز. نطاق النسبة المئوية (WPR).
تم تصميم هذا المؤشر بدقة لمساعدة المتداولين على تحديد فرص الشراء والبيع المحتملة من خلال التفسير الدقيق لزخم السوق وحجمه وموقع السعر بالنسبة إلى الارتفاعات والانخفاضات الأخيرة.
الهدف الأساسي لمؤشر RSI-MFI-WPR هو توفير أداة شاملة تستفيد من القوة المشتركة لمؤشر RSI وMFI وWPR للكشف عن ظروف ذروة الشراء والمبالغة في البيع، مما يشير إلى نقاط انعكاس السوق المحتملة. ويهدف هذا النهج متعدد الأوجه إلى تزويد المتداولين بإطار أكثر قوة لاتخاذ قرارات مستنيرة، وتعزيز استراتيجية التداول الخاصة بهم من خلال تحليل متعدد المؤشرات.
شرح شروط المؤشر
يكمن جوهر هذا المؤشر في ظروفه الإستراتيجية التي تشير إلى نقاط الدخول والخروج المحتملة:
حالة ذروة البيع (الحالة): يتم تحديد ذلك عندما يكون مؤشر القوة النسبية RSI وMFI أقل من 30، وينخفض WPR إلى أقل من -92، مما يشير إلى حالة ذروة بيع قوية في السوق. يشير مثل هذا السيناريو عادةً إلى فرصة شراء، على افتراض أن السوق قد ينتعش من حالة ذروة البيع هذه.
شرط الاختلاف (الشرط 1): يتحقق مما إذا كانت السيولة تتجاوز 2.1 مرة مؤشر القوة النسبية. تهدف هذه الحالة الفريدة إلى تسليط الضوء على الحالات التي يوجد فيها تدفق كبير للأموال إلى أحد الأصول، وهو ما لا ينعكس بشكل متناسب في مؤشر القوة النسبية الخاص به، مما قد يشير إلى زيادة قادمة في الأسعار أو يسلط الضوء على وضع غير عادي في السوق لمزيد من التحليل.
تحذير ذروة الشراء (conditionExit): يتم إطلاق إشارة خروج عندما يتجاوز مؤشر MFI ومؤشر القوة النسبية 85، ويكون WPR أعلى من -15. يشير هذا المزيج إلى حالة ذروة الشراء في السوق، مما يشير إلى أن الأصل قد يكون مبالغًا في قيمته وأن تصحيح السعر أو انعكاسه قد يكون وشيكًا، مما يشير إلى فرصة بيع محتملة أو تحذير ببدء مراكز جديدة.
التطبيق والتصور
لا يوفر مؤشر RSI-MFI-WPR رؤى رقمية فحسب، بل يعرض أيضًا هذه الشروط على مخطط TradingView. من خلال استخدام الترميز اللوني والتخطيط، فإنه يوفر للمتداولين طريقة بديهية للتمييز بين ظروف السوق، مما يتيح اتخاذ قرارات سريعة وفعالة. يضمن دمج شروط التنبيه إخطار المتداولين على الفور بأحداث السوق المهمة، بما يتماشى مع أهدافهم التجارية الإستراتيجية.
التخطيط والتنبيهات في مؤشر RSI-MFI-WPR
حالة التنبيه التي تم جمعها ( CombinedAlertCondition ) عبارة منطقية تجمع كل الشروط الفردية
Condition، Condition1، Condition Exit، وThe_lurkerMFI_oversold في مشغل تنبيه واحد.
ليصبح هذا الشرط صحيحًا ويطلق تنبيهًا في حالة استيفاء أي من الشروط المحددة لفرص التداول المحتملة أو التحذيرات. وهو مصمم لتوفير نظام تنبيه شامل يُعلم المتداول بأي إشارة مهمة يحددها المؤشر، بما في ذلك إشارات الدخول والخروج بالإضافة إلى ظروف ذروة البيع.
المؤشرات البصرية
لون الخلفية لحالة ذروة البيع: يقوم البرنامج النصي بتعيين لون الخلفية إلى ظل معين من اللون الأزرق (بشفافية 90٪) عندما تشير مؤسسة التمويل الأصغر المخصصة إلى حالة ذروة البيع (The_lurkerMFI_oversold). تساعد هذه الإشارة المرئية المتداولين على التعرف بسرعة على الفترات التي قد تكون فيها السوق مقومة بأقل من قيمتها الحقيقية ومن المحتمل أن تكون مستعدة للانتعاش.
رسم علامات التحذير والخروج:
إشارات الدخول: بالنسبة للحالة والحالة 1، التي تحدد نقاط الدخول المحتملة، يرسم المؤشر مثلثات تشير إلى الأعلى أسفل أشرطة السعر. يتم تلوين هذه المثلثات بظلال محددة لتمييز الإشارات عن حالة ذروة البيع الأساسية وحالة التباعد، مما يجعل من السهل على المتداولين التعرف على نوع الإشارة.
إشارات الخروج: بالنسبة لحالة الخروج، التي تشير إلى ظروف ذروة الشراء التي قد تشير إلى تصحيح وشيك للسعر، يتم رسم مثلثات حمراء تشير إلى الأسفل فوق أشرطة السعر. يعد هذا بمثابة تحذير مرئي واضح للنظر في الخروج من المواقف أو المضي قدمًا بحذر.
تكوين المنبه
يستخدم البرنامج النصي وظيفة التنبيه الشرطي لإنشاء تنبيه بناءً على مجموعة AlertCondition. عند استيفاء هذا الشرط، تتم الإشارة إلى أي من الإشارات المحددة مسبقًا
خاتمة
باختصار، يبرز "مؤشر RSI-MFI-WPR" كمؤشر متعدد الاستخدامات وديناميكي يثري مجموعة أدوات المتداول من خلال الجمع بين نقاط القوة التحليلية لـ RSI وMFI وWPR. ومن خلال وضع شروط واضحة لنقاط الدخول والخروج من السوق، فإنه يسهل اتباع نهج استباقي للتداول، بناءً على فحص تفصيلي لديناميكيات السوق. يوضح هذا المؤشر كيف أن الجمع بين أدوات فنية متعددة يمكن أن يؤدي إلى تحليل سوق أكثر استنارة ودقة، بهدف رفع مستوى تجربة التداول على Tradingview.
==================================================================================
باختصار :
1- ظهور المثلث الاصفر يعني تواجد سيولة كبيره ( مفيد جدا لعملات البومب ) .
2- ظهور المثلث الأبيض يعني وصول الى مستويات تشبع البيع وهي فرصة ممتازه للشراء ( منطقة دخول ).
3- ظهور خط افقي يعني قرب عكس الاتجاه الى أعلى ( منطقة دخول ) .
4- ظهور مثلث أحمر يعني قرب عكس الاتجاه الى أسفل ( منطقة خروج ) .
5- التنبيه يعمل على جميع ما ذكر أعلاه في تنبيه واحد حتى تسهل المراقبة .
6- أفضل فواصل الاستخدام ( 4 ساعات ، 12 ساعه ، يوم ) .
