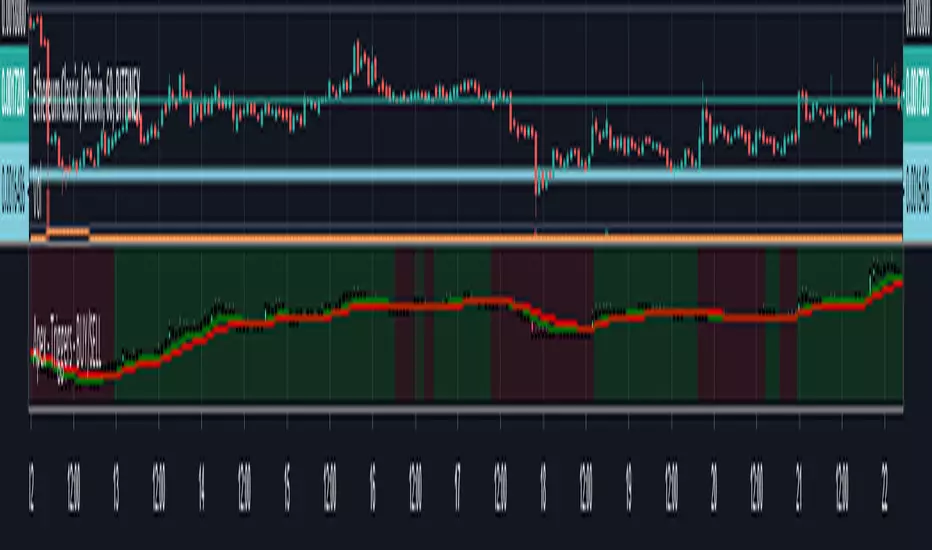
Adaptive Bandpass Trigger Oscillator Ver 3This is an improvement of the Adaptive Bandpass Trigger Oscillator. It adds an option for a multiplier to the dominant cycle to filter out smaller swings.
Feel free to message me if you would like development work or would just like to donate ; )
This is based off of Ehlers' Bandpass Filter system (link below slides 15-17). I then used Ehlers' methods for finding the dominant cycle to automatically input the dominant cycle to the length. Essentially Ehlers runs a band pass with a given period to detrend the price data and highlight a cycle with the given frequency(length). This represents the In phase cycle. Ehlers then creates the trigger line by taking the one bar momentum of the In Phase line, multiplying by 2Pi and then using this to create a 60 degree leading signal. The triggers are crossovers of the In Phase and Lead lines. You can also use conservative signals by waiting for the In Phase line to trend in the direction of the trigger crossover as well.
Delta represents how much to influence the oscillator by the price (Delta 0 is a perfect wave)
Alpha represents how quickly to adapt between the dominant cycle changes in the price.
Thanks to LazyBear for implementing Ehlers' original adaptive code, which I used for this system
Thanks to HPotter for the BandPass Filter code, which I used as a base for implementing the rest of the system
ابحث في النصوص البرمجية عن "trigger"

PT Magic Triggers / Show blue when greater than trigger 1 AND...I just wanted to roll this out as well there will be no detailed description.
Please fill all triggers otherwise it will not work ( use the same value if you are using lower number of triggers )
If the value is greater then your defined Trend value (absolute) it will make the background aqua.

FVG + Bank Level Targeting w/ Alert TriggerDescription:
FVG + Bank Level Targeting w/ Alert Trigger is an intraday trading tool that combines Fair Value Gap (FVG) detection with dynamic institutional targeting using prior-day, weekly, and monthly high/low "Bank Levels." When a Fair Value Gap is detected, the script projects a logical target using the closest bank level in price's direction, and visually extends that level on your chart.
This tool is designed to help traders anticipate where price is most likely to move after an FVG appears — and alert them when price breaks through key target zones.
How It Works:
* Bank Level Calculation:
The indicator calculates Daily, Weekly, and Monthly high and low levels from the previous bar of each respective timeframe.
These are optionally plotted on the chart with a slight tick offset to avoid overlap with price.
* FVG Detection:
Bullish FVGs are defined by a gap between the low of the current candle and the high two candles prior, with a confirming middle candle.
Bearish FVGs follow the reverse pattern.
Once detected, the script finds the nearest unbroken institutional level (Bank Level) in the direction of the FVG and anchors a target line at that price level.
* Target Line Projection:
The script draws a persistent horizontal line (not just a plotted value) at the selected bank level.
These lines automatically extend a set number of bars into the future for clarity and trade planning.
* Breakout Detection:
When price crosses above a Bull Target or below a Bear Target, the script triggers a breakout condition.
These breakouts are useful for trade continuation or reversal setups.
* Alerts:
Built-in alert conditions notify you in real time when price crosses above or below a target.
These can be used to set TradingView alerts for your preferred Futures symbols or intraday pairs.
Parameters:
Tick Offset Multiplier: Adds distance between price and plotted levels.
Show Daily/Weekly/Monthly Levels: Toggle for each institutional level group.
FVG Extend Right (bars): Controls how far the target lines extend into the future.
Color Controls: Customize colors for FVG fill and target lines.
Use Case:
This indicator is designed for traders who want to:
Trade continuation or reversal moves around institutional price zones
Integrate Fair Value Gap concepts with more logical, historically anchored price targets
Trigger alerts when market structure evolves around key levels
It is especially useful for intraday Futures traders on the 15-minute chart or lower, but adapts well to any instrument with strong reactionary behavior at prior session highs/lows.

Average Daily Volume with Anomalies A trigger program to print volume triggers on stocks that are being watched.
It helps with identifying the trigger volume on a candle and helps determine whether one can enter a position or not.

Adaptive Bandpass Trigger OscillatorThis is based off of Ehler's Bandpass Filter system (link below slides 15-17). I then used Ehler's methods for finding the dominant cycle to automatically input the dominant cycle to the length. Essentially Ehler runs a band pass with a given period to detrend the price data and highlight a cycle with the given frequency(length). This represents the In phase cycle. Ehler then creates the trigger line by taking the one bar momentum of the In Phase line, multiplying by 2Pi and then using this to create a 60 degree leading signal. The triggers are crossovers of the In Phase and Lead lines. You can also use conservative signals by waiting for the In Phase line to trend in the direction of the trigger crossover as well.
Delta represents how much to influence the oscillator by the price (Delta 0 is a perfect wave)
Alpha represents how quickly to adapt between the dominant cycle changes in the price.
Thanks to LazyBear for implementing Ehler's original adaptive code, which I used for this system
Thanks to HPotter for the BandPass Filter code, which I used as a base for implementing the rest of the system
www.mesasoftware.com

Ehler Bandpass Trigger OscillatorThis is based off of Ehler's Bandpass Filter system (link below slides 15-17). Essentially Ehler runs a band pass with a given period to detrend the price data and highlight a cycle with the given frequency(length). This represents the In phase cycle. Ehler then creates the trigger line by taking the one bar momentum of the In Phase line, multiplying by 2Pi and then using this to create a 60 degree leading signal. The triggers are crossovers of the In Phase and Lead lines. You can also use conservative signals by waiting for the In Phase line to trend in the direction of the trigger crossover as well.
Length represent the cycle period you want to highlight.
Delta represents how much to influence the oscillator by the price (Delta 0 is a perfect wave)
Thanks to HPotter for the BandPass Filter code, which I used as a base for implementing the rest of the system
www.mesasoftware.com
PT Magic - BTC/ETH Trigger Trend ChangesThis Script shows you how BTC/ETH Percentage change in trends affect coins you trade.
- For ETH market please change BTC in Setting for ETH
What you need it PT Magic:
{
"Name": "BTC1h", // UNIQUE market trend name (to be referenced by your triggers below)
"Platform": "CoinMarketCap", // Platform to grab prices from (Allowed values are: CoinMarketCap, Exchange)
"MaxMarkets": 1, // Number of markets/pairs to analyze sorted by 24h volume
"TrendMinutes": 60 // Number of minutes to build a trend (1440 = 24h, 720 = 12h, 60 = 1h)
},
{
"Name": "ETH1h", // UNIQUE market trend name (to be referenced by your triggers below)
"Platform": "CoinMarketCap", // Platform to grab prices from (Allowed values are: CoinMarketCap, Exchange)
"MaxMarkets": 2, // Number of markets/pairs to analyze sorted by 24h volume
"IgnoredMarkets": "BTC",
"TrendMinutes": 60 // Number of minutes to build a trend (1440 = 24h, 720 = 12h, 60 = 1h)
},

PT Magic Triggers So its me again. I have decided to create Trend Trigger Script for PT Magic addon for a trading bot Profit Trailer. If you do not own this bot and Addon the following explanation will not help you.
For each Trend you define number of minutes and it then calculates the percentage change between the close price now and X candles before.
Same calculation is for all 6 Triggers i beleive that is all you need :)
Hope it helps you all.
LTC: LYHj4WDN7BPu5294cSpqK3SgWSWdDX56Qt
BTC: 1NPVzeDSsenaCS9QdPro877hkMk93nRLcD

PDB - RSI Based Buy/Sell signals with 4 MARSI Based Buy/Sell Signals on Price chart + 4 MA System
This indicator plots RSI-based Buy & Sell signals directly on the price chart , combined with a 4-Moving-Average trend filter (20/50/100/200) for higher accuracy and cleaner trade timing.
The signal triggers when RSI reaches user-defined overbought/oversold levels, but unlike a standard RSI, this version plots the signals **on the chart**, not in the RSI window — making entries and exits easier to see in real time.
RSI Levels Are Fully Customizable
The default RSI thresholds are 30 (oversold) and 70 (overbought).
However, you can adjust these to fit your trading style. For example:
> When day trading on the 5–15 min timeframe, I personally use 35 (oversold) and 75 (overbought) to catch moves earlier.
> The example shown in the preview image uses 10-minute timeframe settings.
You can change the RSI levels to trigger signals from **any value you choose**, allowing you to tailor the indicator to scalping, day trading, or swing trading.
4 Moving Averages Included:
20, 50, 100, 200 MAs act as dynamic trend filters so you can:
✔ trade signals only in the direction of trend
✔ avoid false reversals
✔ identify momentum shifts more clearly
Works on all markets and timeframes — crypto, stocks, FX, indices.

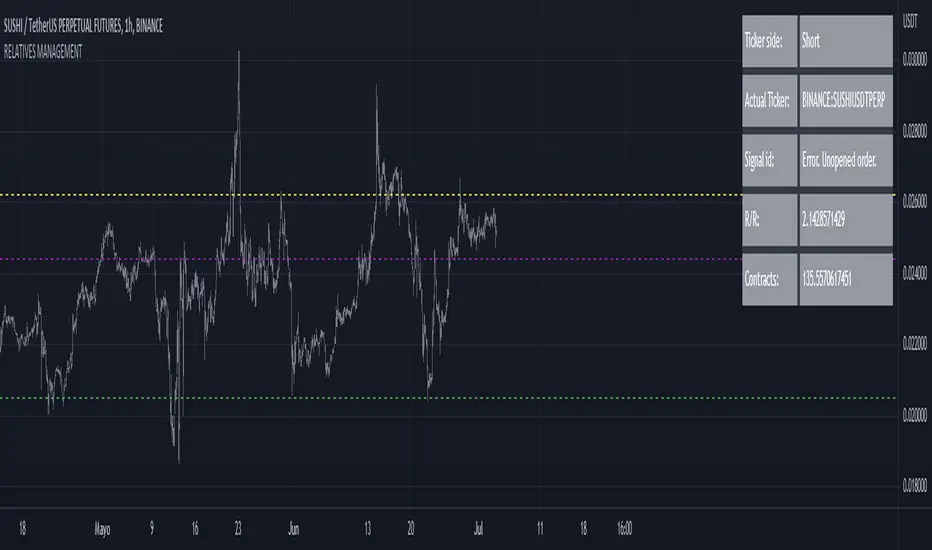
RELATIVE VALUE TRADE MANAGEMENT WEBHOOKThis script it's created to send open-close signals via webhook. It allows you to open a relative value position based in the relative graph. You can set the TP and SL levels and the script will send the signal to your exchange.
Due a pine limitations it is necessary apply the script in the 2 different actives and set the alerts. You can just do the relative analysis and then go to the first asset and set the script. Create your alert and then just go to the other asset and create the alert. It doesn't necessary to change anything in the script because the levels are the same.
It is also possible to do the analysis using the script, deploying the relative graph, but could be annoying sometimes due scales.
Positions will be placed at close always.
THIS IS IMPORTANT: I use Zignaly as a exhange so if you are using Binance or other YOU MUST CHANGE the code. If you know the JSON format that It requires would be easy.
Here is tips in all the important imputs. But let me explain the most important.
The MANDATORY fields are:
Ticker IDs: Here you must write the EXACT ID code for the active. Caps included.
Example : BINANCE:SUSHIUSDTPERP
It is also important select the correct market side. If you want to be long of ANY active you must write that ID in the LONG ID. For short positions is the same.
Time frame: Here you can select the time frame of the graph (not the current active graph, I mean the relative one.) The orders will be send using that time frame. I recommend to do the analysis in other window and then use the script to trigger the order in the time frame that you want.
Money management: In these fields you can select the qty that you will lose if the SL level is reach. Based in a determinated amount of currency or in a % of your capital.
Dates: It is important to select the start date. If the order is already open, we must look for the moment where the activation price was reached. If the order is unopened it is better to select the current date, so the order will be triggered when the entry level is reached.
Ids: If you have current open position you can set here that ID to send the correct order to the exchange.
To set the alert just call the function {{{strategy.order.alert_message}}}
Mesa Advanced TriggersThis indicator is based on the indicator 'MESA Phase ' by shayankm (so shoutouts to him for the open source code)
MESA Phase :
sayankm: www.tradingview.com
In this advanced version of the indicator, green/red dots will be printed on the pivot points & alerts can be triggered on these. There is also a zone (which you can adjust) that dot's will not be printed in, you want to adjust this to try and avoid dots being printed during sideways movement.

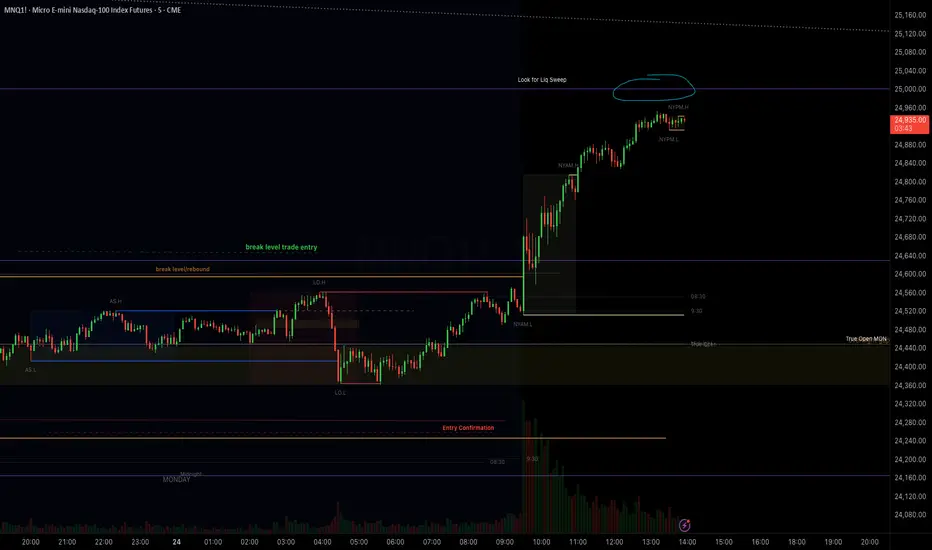
Silent 60pt Volatility Trigger (60pt Range in 5min)This alert triggers when a 5 minute candle reaches a range of 60pts in a 5 min candle /MNQ. Good for a mid day vol alert
EMA Bot Trigger - 14,26,55Work In Progress - Currently will send Long/Short triggers when EMA 14 Crosses EMA 26 - whether the cross is above the EMA 55 determines whether to Long or Short.
ATR Trailing Stop Loss [V5]A complete ATR Trailing Stop Loss in version 5.
Features Include:
Timeframe Option
Long/Short Triggers (Green/Red Triangles)
Long/Short Conditions (Bottom Colored Line)
"Golden" Long/Short Triggers (Yellow Triangles)(Hanging Man or Shooting Star Candlestick patterns breaking ATR trailing stop)
Alerts

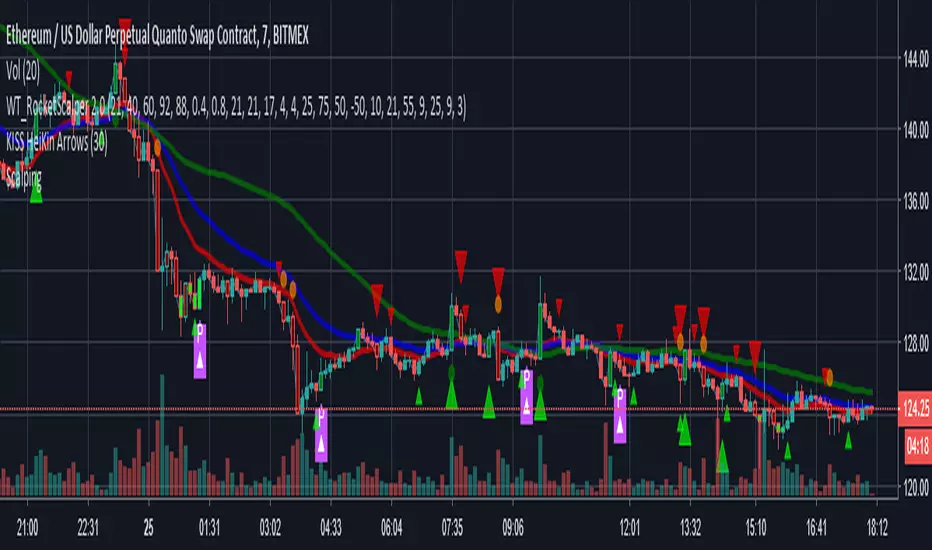
Scalping The Bull IndicatorName: Scalping The Bull Indicator
Category: Scalping, Trend Following, Mean Reversion.
Timeframe: 1M, 5M, 30M, 1D depending on the specific technique.
Technical Analysis: The indicator supports the operations of the trader named "Scalping The Bull" which uses price action and exponential moving averages.
Suggested usage: Altcoin showing strong trends for scalping and intra-day trades. Trigger points are used as entry and exit points and to be used to understand when a signal has more power.
It is possible to identify the following conformations:
Shimano: look at the price records of a consecutive series of closings between the EMA 60 and the EMA 223 when a certain threshold is reached. Use the trigger points as price structures to identify entry and exit zones (e.g. breakout of the yesterday high as for entry point) .
Bomb: look at the price registers a percentage variation in a single candle, greater than a threshold such as 2%, in particular on shorter timeframes and around the trigger points.
Viagra: look at there is a consecutive series of closes below the EMA 10.
Downward fake: look when, after a cross under (Death Cross), the price returns above the EMA 223 using the yesterday high as a trigger point.
Emergence: look at the EMA 60 is about to cross over the EMA 223.
Anti-crossing: look at, after an important price rise and a subsequent retracement, the EMA 60 is about to cross under the EMA 223 but a bullish impulse brings the price back above the EMAs.
For Sales: look at two types of situations: 1) when the price falls by more than 10% from the opening price and around the yesterday’s low or 2) when the price falls and then reaches, in the last 5 days, a bigger percentage and then breaks a trigger point.
Colour change: look at the opening price of the session - indicated as a trigger point.
Third touch of EMA 60: look for 3 touches below the EMA 60, and enter when there is a close above the EMA 60.
Third touch of EMA 223: look for 3 touches when there are 3 touches below the EMA 223, and enter when there is a close above the EMA 60.
Bud: look at price when it crosses upwards the average 10 and subsequently at least 2 "rest" candles are between the maximum and minimum of the breaking candle.
Fake on EMA 10: look for the open of a candle higher than the EMA 10, the minimum of the candle lower and the closing price returns above the EMA 10..
For Stop Loss and Profit Targets consider a proper R/R depending on Risk Management, using price structures such as the low of the entering candle and a quick Position Management moving quickly the Stop-Loss at Break-Even.
Configuration:
Market
EMA: The indicator automatically configure itself on market it knows (Binance, Piazza Affari and NASDAQ) otherwise it can be configured manually fo Crypto market (5/10/60/223) or Stock Market (5/10/50/200).
Additional Average: You can display an additional average, e.g. 20-period average.
Chart elements:
Session Separators: indicates the beginning of the current session (in blue)
Background: signals with the background in green an uptrend situation ( 60 > 223) and in red background a downtrend situation (60 < 223).
Trigger points:
Today's highs and lows: draw on the chart the opening price of the daily candle and the highs and lows of the day (high in purple, low in red and open in green)
Yesterday's highs and lows: draw on the chart the opening price of the daily candle, the highs and lows of the previous day (high in yellow, low in red).
Credits
Massimo : for refactoring and suggestions.


Day Trader Trend & Triggers + Mini-Meter — v6**Day Trader Trend & Triggers — Intraday**
A fast, intraday trend and entry tool designed for **1m–15m charts**. It identifies **strong up/down trends** using:
* **MA ribbon:** EMA9 > EMA21 > EMA50 (or inverse) for directional bias.
* **Momentum:** RSI(50-line) and MACD histogram flips.
* **Volume & VWAP:** only confirms when volume expands above SMA(20) and price is above/below VWAP.
* **Higher-TF bias filter (optional):** e.g., align 1m/5m signals with the 15m trend.
When all align, the background highlights and the mini-meter shows UP/DOWN.
It also plots **entries**:
* **Pullbacks** to EMA21/EMA50 with a MACD re-cross,
* **Breakouts** of recent highs/lows on strong volume.
Built-in **alerts** for trend flips, pullbacks, and breakouts let you trade hands-off.
Best used on **5m for active day trades**, with 1m/3m for scalping and 15m for cleaner intraday swings.
Day Trader Trend & Triggers — v6**Day Trader Trend & Triggers — Intraday**
A fast, intraday trend and entry tool designed for **1m–15m charts**. It identifies **strong up/down trends** using:
* **MA ribbon:** EMA9 > EMA21 > EMA50 (or inverse) for directional bias.
* **Momentum:** RSI(50-line) and MACD histogram flips.
* **Volume & VWAP:** only confirms when volume expands above SMA(20) and price is above/below VWAP.
* **Higher-TF bias filter (optional):** e.g., align 1m/5m signals with the 15m trend.
When all align, the background highlights and the mini-meter shows UP/DOWN.
It also plots **entries**:
* **Pullbacks** to EMA21/EMA50 with a MACD re-cross,
* **Breakouts** of recent highs/lows on strong volume.
Built-in **alerts** for trend flips, pullbacks, and breakouts let you trade hands-off.
Best used on **5m for active day trades**, with 1m/3m for scalping and 15m for cleaner intraday swings.

MACROFLOW 200 — Bias & Triggersstephtradez model
MACROFLOW 200 — at a glance (the elevator pitch)
Trade direction = Macro Bias + 1H 200 EMA filter + DXY confirm.
Locations = 1H supply/demand zones.
Triggers (15m): (T1) Retest rejection, (T2) Liquidity sweep + BOS/CHOCH, (T3) Momentum break + shallow pullback.
Stops: structure‑based beyond zone with ATR buffer.
Targets: 2R base, scale at 1.5R, trail to next HTF zone.
Sessions: 7–10 pm ET and 9:30–10:30 am ET.
Risk: tight, prop‑friendly max 1% per session

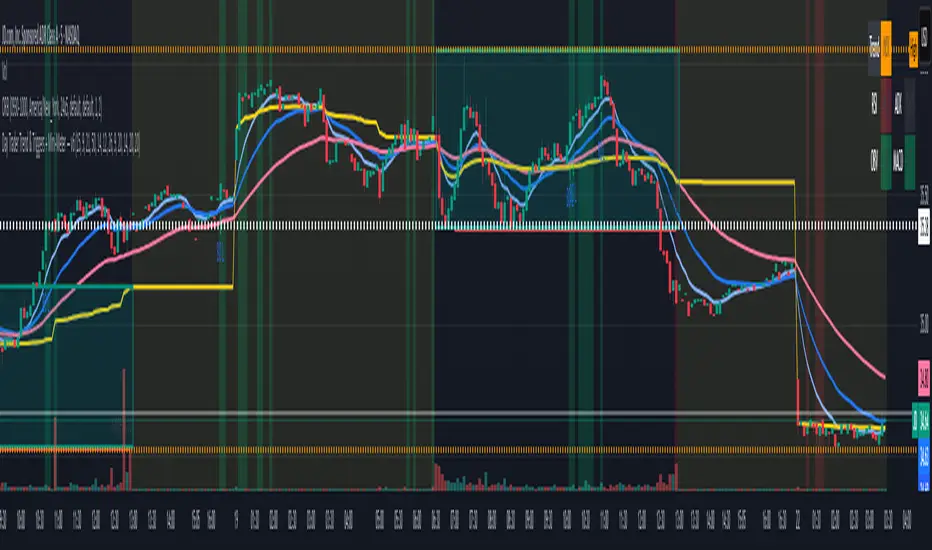
BINANCE-BYBIT Cross Chart: Spot-Perpetual CorrelationName: "Binance-Bybit Cross Chart: Spot-Perpetual Correlation"
Category: Scalping, Trend Analysis
Timeframe: 1M, 5M, 30M, 1D (depending on the specific technique)
Technical analysis: This indicator facilitates a comparison between the price movements shown on the Binance spot chart and the Bybit perpetual chart, with the aim of discerning the correlation between the two charts and identifying the dominant market trends. It automatically generates the corresponding chart based on the ticker selected in the primary chart. When a Binance pair is selected in the main chart, the indicator replicates the Bybit perpetual chart for the same pair and timeframe, and vice versa, selecting the Bybit perpetual chart as the primary chart generates the Binance spot chart.
Suggested use: You can utilize this tool to conduct altcoin trading on Binance or Bybit, facilitating the comparison of price actions and real-time monitoring of trigger point sensitivity across both exchanges. We recommend prioritizing the Binance Spot chart in the main panel due to its typically longer historical data availability compared to Bybit.
The primary objective is to efficiently and automatically manage the following three aspects:
- Data history analysis for higher timeframes, leveraging the extensive historical data of the Binance spot market. Variations in indicators such as slow moving averages may arise due to differences in historical data between exchanges.
- Assessment of coin liquidity on both exchanges by observing candlestick consistency on smaller timeframes or the absence of gaps. In the crypto market, clean charts devoid of gaps indicate dominance and offer enhanced reliability.
- Identification of precise trigger point levels, including daily, previous day, or previous week highs and lows, which serve as sensitive areas for breakout or reversal operations.
All-Time High (ATH) and All-Time Low (ATL) levels may vary significantly across exchanges due to disparities in historical data series.
This tool empowers traders to make informed decisions by leveraging historical data, liquidity insights, and precise trigger point identification across Binance Spot and Bybit Perpetual market.
Configuration:
EMA length:
- EMA 1: Default 5, user configurable
- EMA 2: Default 10, user configurable
- EMA 3: Default 60, user configurable
- EMA 4: Default 223, user configurable
- Additional Average: Optional display of an additional average, such as a 20-period average.
Chart Elements:
- Session separator: Indicates the beginning of the current session (in blue)
- Background: Indicates an uptrend (60 > 223) with a green background and a downtrend (60 < 223) with a red background.
Instruments:
- EMA Daily: Shows daily averages on an intraday timeframe.
- EMA levels 1h - 30m: Shows the levels of the 1g-30m EMAs.
- EMA Levels Highest TF: Provides the option to select additional EMA levels from the major timeframes, customizable via the drop-down menu.
- "Hammer Detector: Marks hammers with a green triangle and inverted hammers with a red triangle on the chart
- "Azzeramento" signal on TF > 30m: Indicates a small candlestick on the EMA after a dump.
- "No Fomo" signal on TF < 30m: Indicates a hyperextended movement.
Trigger Points:
- Today's highs and lows: Shows the opening price of the day's candlestick, along with the day's highs and lows (high in purple, low in red, open in green).
- Yesterday's highs and lows: Displays the opening price of the daily candlestick, along with the previous day's highs and lows (high in yellow, low in red).
You can customize the colors in "Settings" > "Style".
It is best used with the Scalping The Bull indicator on the main panel.
Credits:
@tumiza999: for tests and suggestions.
Thanks for your attention, happy to support the TradingView community.

[DT] ATR Trigger Bar OverlayATR Trigger candle is an idea that I originally heard about studying alexander elder's work at spike trade. This code is my interpretation of his work.
The idea behind an ATR trigger bar is to find areas where price is likely trapping market participants. In some cases a trigger will not form in one bar so a two bar analysis is also included in study.
Bull trap condition:
- price moves above previous bar high and in the same candle will close below previous bar close
Bear trap condition:
- price moves below previous bar low and in the same candle will close above previous bar close
TODO:
- categorize trigger bar as 1 bar or 2 bar price action
- allow user to filter 1 bar or 2 bar price action
- multiple timeframes
- volume filter
- horizontal line for average price on a trigger bar

[blackcat] L2 Ehlers ITrendline Trigger Trend-Following SystemLevel: 2
Background
John F. Ehlers introuced the Instantaneous Trendline and the Trigger of the trend-following system in his "Cybernetic Analysis for Stocks and Futures" chapter 3 on 2004.
Function
The process for creating a trendfollowing trading system from the indicators is simple. One unique aspect of the code is that the ITrend is forced to be a finite impulse response (FIR)-smoothed version of price for the first seven bars of the calculation.
This initialization is included to cause the ITrend to converge more rapidly to its correct value from the beginning transient. The strategy enters a long position when the trigger crosses over the Instantaneous Trendline and enters a short position when the trigger crosses under the Instantaneous Trendline. However, an effective trading system is more than following a simple set of indicators.
First, experience has shown that greater profits result from using limit orders rather than market orders or stop orders. Market orders are selfexplanatory. Stop orders mean the market must be going in the direction of the trade before the order is filled. For example, for long-position trades, the stop order must be placed above the current price. Thus, the price must increase from its current level before you get stopped into the long-position trade. This means you necessarily give up some of the profits you would otherwise have gotten if you had entered on a market order at the instant of your signal. You can lose additional profits from stop orders due to slippage.
Key Signal
Trigger ---> trend-following system fast line
ITrend ---> trend-following system slow line
Pros and Cons
100% John F. Ehlers definition translation of original work, even variable names are the same. This help readers who would like to use pine to read his book. If you had read his works, then you will be quite familiar with my code style.
Remarks
The 22th script for Blackcat1402 John F. Ehlers Week publication.
Readme
In real life, I am a prolific inventor. I have successfully applied for more than 60 international and regional patents in the past 12 years. But in the past two years or so, I have tried to transfer my creativity to the development of trading strategies. Tradingview is the ideal platform for me. I am selecting and contributing some of the hundreds of scripts to publish in Tradingview community. Welcome everyone to interact with me to discuss these interesting pine scripts.
The scripts posted are categorized into 5 levels according to my efforts or manhours put into these works.
Level 1 : interesting script snippets or distinctive improvement from classic indicators or strategy. Level 1 scripts can usually appear in more complex indicators as a function module or element.
Level 2 : composite indicator/strategy. By selecting or combining several independent or dependent functions or sub indicators in proper way, the composite script exhibits a resonance phenomenon which can filter out noise or fake trading signal to enhance trading confidence level.
Level 3 : comprehensive indicator/strategy. They are simple trading systems based on my strategies. They are commonly containing several or all of entry signal, close signal, stop loss, take profit, re-entry, risk management, and position sizing techniques. Even some interesting fundamental and mass psychological aspects are incorporated.
Level 4 : script snippets or functions that do not disclose source code. Interesting element that can reveal market laws and work as raw material for indicators and strategies. If you find Level 1~2 scripts are helpful, Level 4 is a private version that took me far more efforts to develop.
Level 5 : indicator/strategy that do not disclose source code. private version of Level 3 script with my accumulated script processing skills or a large number of custom functions. I had a private function library built in past two years. Level 5 scripts use many of them to achieve private trading strategy.

Apex - Triggers - BUY/SELLThis script builds up a chart of a Pair that you are setting triggers for.
Currently supported following pairs:
- BTCUSDT
- ETHUSDT
- ETHBTC
- BNBBTC
- BNBETH
- BUY will be marked green and SELL will be marked red everything else will be default
- It is build up of the same scripts used for for Other APEX Scripts for more detailed overview please have a look here: