Multi-Timeframe SFP (Swing Failure Pattern)How to Use
1. Set Pivot Timeframe: Choose the timeframe for identifying major swing points (e.g., 'D' for Daily pivots).
2. Set SFP Timeframe: Choose the timeframe to find the SFP candle (e.g., '240' for the 4-Hour chart).
3. Set Confirmation Bars: Set how many SFP Timeframe bars must pass without invalidating the level. A value of '0' confirms immediately on the SFP bar's close. A value of '1' waits for one more bar to close.
4. Adjust Filters (Optional): Enable the 'Wick % Filter' to add a quality check for strong rejections.
5. Watch & Wait: The indicator will draw lines and labels and fire alerts for fully confirmed signals.
In-Depth Explanation
1. Overview
The Dynamic Pivot SFP Engine is a multi-timeframe tool designed to identify and validate Swing Failure Patterns (SFPs) at significant price levels.
An SFP is a common price action pattern where price briefly trades beyond a previous swing high or low (sweeping liquidity) but then fails to hold those new prices, closing back inside the previous range. This "failure" often signals a reversal.
This indicator enhances SFP detection by separating the Pivot (Liquidity) from the SFP (Rejection), allowing you to monitor them on different timeframes.
2. The Core Multi-Timeframe Logic
The indicator's power comes from two key inputs:
• Pivot Timeframe (Pivot Timeframe)
This is the "high timeframe" used to establish significant support and resistance levels. The script finds standard pivots (swing highs and lows) on this timeframe based on the Pivot Left Strength and Pivot Right Strength inputs. These pivots are the "liquidity" levels the SFP will target. The Pivot Lookback input controls how long (in Pivot Timeframe bars) a pivot remains active and monitored.
• SFP Timeframe (SFP Timeframe)
This is the "execution timeframe" where the script looks for the actual SFP. On every new bar of this timeframe, the script checks if price has swept and rejected any of the active pivots.
Example Setup:
You might set Pivot Timeframe to 'D' (Daily) to find major daily swing points. You then set SFP Timeframe to '240' (4-Hour) to find a 4-hour candle that sweeps a daily pivot and closes back below/above it.
3. The SFP Confirmation Process
An SFP is not confirmed instantly. It must pass a rigorous, multi-step validation process.
Step 1: The SFP Candle (The Sweep)
A potential SFP is identified when an SFP Timeframe bar does the following:
• Bearish SFP: The bar's high trades above an active pivot high, but the bar closes below that same pivot high.
• Bullish SFP: The bar's low trades below an active pivot low, but the bar closes above that same pivot low.
Step 2: The Wick Filter (Optional Quality Check)
If Enable Wick % Filter is checked, the SFP candle from Step 1 is also measured.
• For a bearish SFP, the upper wick (from the high to the open/close) must be at least Min. Wick % of the entire candle's range (high-to-low).
• For a bullish SFP, the lower wick (from the low to the open/close) must meet the same percentage requirement.
If the SFP candle fails this test, it is discarded, even if it met the sweep/close criteria.
Step 3: The Validation Window (The Confirmation)
This is the most critical feature, controlled by Confirmation Bars.
• If Confirmation Bars = 0: The SFP is confirmed immediately on the SFP candle's close (assuming it passed the optional wick check). The label, line, and alert are triggered at this moment.
• If Confirmation Bars > 0: The SFP enters a "pending" state. The script will wait for $N$ more SFP Timeframe bars to close.
o Invalidation: If, during this waiting period, any bar closes back across the pivot (e.g., a close above the pivot for a bearish SFP), the SFP is considered failed and invalidated. All pending plots are deleted.
o Confirmation: If the $N$ confirmation bars all complete without invalidating the level, the SFP is finally confirmed. The label, line, and alert are only triggered after this entire process is complete. This adds a significant layer of robustness, ensuring the rejection holds for a period of time.
4. Visuals & Alerts
• Lines: A horizontal line is drawn from the original pivot to the SFP bar, showing which level was targeted. Note: These lines will only be drawn on chart timeframes equal to or lower than the 'SFP Timeframe'.
• Labels: A label is placed at the SFP's extreme (the high/low of the SFP bar). The label text conveniently includes the Ticker, Pivot TF, SFP TF, and Confirmation bar settings (e.g., "Bearish SFP BTCUSD / Pivot: 1D / SFP: 4H | Conf: 1").
• MTF Boxes (Show SFP Box, Show Conf. Boxes): These boxes highlight the SFP and confirmation bars. Crucially, they are only visible when your chart timeframe is lower than the SFP Timeframe. For example, if your SFP Timeframe is '240' (4H), you will only see these boxes on the 1H, 15M, 5M, etc., charts. This allows you to see the higher-timeframe SFP unfolding on your lower-timeframe chart.
• Alerts (Enable Alerts): An alert is fired only when an SFP is fully confirmed (i.e., after the Confirmation Bars have passed successfully). For efficient, real-time monitoring, it is highly recommended to run this indicator server-side by creating an alert on TradingView set to trigger on "Any alert() function call".
ابحث في النصوص البرمجية عن "trigger"

RSI VWAP v1 [JopAlgo]RSI VWAP v1.1 made stronger by volume-aware!
We know there's nothing new and the original RSI already does an excellent job. We're just working on small, practical improvements – here's our take: The same basic idea, clearer display, and a single, specially developed rolling line: a VWAP of the RSI that incorporates volume (participation) into the calculation.
Do you prefer the pure classic?
You can still use Wilder or Cutler engines –
but the star here is the VW-RSI + rolling line.
This RSI also offers the possibility of illustrating a possible
POC (Point of Control - or the HAL or VAL) level.
However, the indicator does NOT plot any of these levels itself.
We have included an illustration in the chart for this!
We hope this version makes your decision-making easier.
What you’ll see
The RSI line with a 50 midline and optional bands: either static 70/30 or adaptive μ±k·σ of the Rolling Line.
One smoothing concept only: the Rolling Line (light blue) = VWAP of RSI.
Shadow shading between RSI and the Rolling Line (green when RSI > line, red when RSI < line).
A lighter tint only on the parts of that shadow that sit above the upper band or below the lower band (quick overbought/oversold context).
Simple divergence lines drawn from RSI pivots (green for regular bullish, red for regular bearish). No labels, no buy/sell text—kept deliberately clean.
What’s new, and why it helps
VW-RSI engine (default):
RSI can be computed from volume-weighted up/down moves, so momentum reflects how much traded when price moved—not just the direction.
Rolling Line (VWAP of RSI) with pure VWAP adaptation:
Low volume: blends toward a faster VWAP so early, thin starts aren’t missed.
Volume spikes: blends toward a slower VWAP so a single heavy bar doesn’t whip the curve.
You can reveal the Base Rolling (pre-adaptation) line to see exactly how much adaptation is happening.
Adaptive bands (optional):
Instead of fixed 70/30, use mean ± k·stdev of the Rolling Line over a lookback. Levels breathe with the market—useful in strong trends where static bounds stay pinned.
Minimal, readable panel:
One smoothing, one story. The shadow tells you who’s in control; the lighter highlight shows stretch beyond your lines.
How to read it (fast)
Bias: RSI above 50 (and a rising Rolling Line) → bullish bias; below 50 → bearish bias.
Trigger: RSI crossing the Rolling Line with the bias (e.g., above 50 and crossing up).
Stretch: Near/above the upper band, avoid chasing; near/below the lower band, avoid panic—prefer a cross back through the line.
Divergence lines: Use as context, not as standalone signals. They often help you wait for the next cross or avoid late entries into exhaustion.
Settings that actually matter
RSI Engine: VW-RSI (default), Wilder, or Cutler.
Rolling Line Length: the VWAP length on RSI (higher = calmer, lower = earlier).
Adaptive behavior (pure VWAP):
Speed-up on Low Volume → blends toward fast VWAP (factor of your length).
Dampen Spikes (volume z-score) → blends toward slow VWAP.
Fast/Slow Factors → how far those fast/slow variants sit from the base length.
Bands: choose Static 70/30 or Adaptive μ±k·σ (set the lookback and k).
Visuals: show/hide Base Rolling (ref), main shadow, and highlight beyond bands.
Signal gating: optional “ignore first bars” per day/session if you dislike open noise.
Starter presets
Scalp (1–5m): RSI 9–12, Rolling 12–18, FastFactor ~0.5, SlowFactor ~2.0, Adaptive on.
Intraday (15m–1H): RSI 10–14, Rolling 18–26, Bands k = 1.0–1.4.
Swing (4H–1D): RSI 14–20, Rolling 26–40, Bands k = 1.2–1.8, Adaptive on.
Where it shines (and limits)
Best: liquid markets where volume structure matters (majors, indices, large caps).
Works elsewhere: even with imperfect volume, the shadow + bands remain useful.
Limits: very thin/illiquid assets reduce the benefit of volume-weighting—lengthen settings if needed.
Attribution & License
Based on the concept and baseline implementation of the “Relative Strength Index” by TradingView (Pine v6 built-in).
Released as Open-source (MPL-2.0). Please keep the license header and attribution intact.
Disclaimer
For educational purposes only; not financial advice. Markets carry risk. Test first, use clear levels, and manage risk. This project is independent and not affiliated with or endorsed by TradingView.

Solana 4H RSI->MACD — Counter-Trend By TetradTetrad RSI→RSI Cross→MACD (Sequenced) — Counter-Trend (SL-Only)
Category: Market-neutral, counter-trend, sequenced entries
Timeframe default: Works on any TF; designed around 4H On Solana
Markets: Any (spot, perp, futures); parameterize to your asset
What it does
This strategy hunts reversals using a 3-step sequence on RSI and MACD, then optionally restricts entries by market regime and a price gate. It shows stop-loss lines only when hit (clean chart), and paints a Donchian glow for quick read of backdrop conditions.
Entry logic (sequenced)
1. RSI Extreme:
Long path activates when RSI < Oversold (default 27.5).
Short path activates when RSI > Overbought (default 74).
2. RSI Cross confirmation:
Long path: RSI crosses up back above the oversold level.
Short path: RSI crosses down back below the overbought level.
Each step has a max bar lookback so stale signals time out.
3. MACD Cross trigger:
Long: MACD line crosses above Signal.
Short: MACD line crosses below Signal.
→ When step 3 fires and gates are satisfied, a trade is entered.
Optional gates & filters
Regime Filter (Counter-Trend):
Longs allowed in **Range / Short Trend / Short Parabolic** regimes.
Shorts allowed in **Range / Long Trend / Long Parabolic** regimes.
Based on ADX/DI and ATR% intensity.
* Price Gate (Long Ceiling):
Toggle to **disable new longs above a chosen price (default 209.0 For SOL).
Useful for assets like SOL where you want longs only below a cap.
Exits / Risk
* Stop-Loss (% of entry):** default **14%**, toggleable.
* SL visualization:** plots a **thin dashed red line only on the bar it’s hit**.
* (No take-profit or time-based exit in this version—keep it pure to the sequence and regime. Add TP/time exits if desired.)
Visuals
* Donchian Glow (50): background band only (upper/lower lines hidden).
* Regime HUD: compact table (top-right) highlighting the active regime.
* Minimal marks: no entry/exit “arms” clutter; only SL-hit lines render.
Inputs (key)
* Core: RSI Length, Oversold/Overbought, MACD Fast/Slow/Signal.
* Sequence: Max bars from Extreme→RSI Cross and RSI Cross→MACD Cross.
* Regime: ADX Length, Trend/Parabolic thresholds, ATR length & floor.
* Stops: Enable/disable; SL %.
* Price Gate: Enable; Long ceiling price.
Alerts
Sequenced Long (CT): RSIhigh → RSI cross down → MACD bear cross.
## Notes & Tips
Designed for counter-trend fades that become trend rides. The regime filter helps avoid fading true parabolics and aligns entries with safer contexts.
The sequence is stateful (steps must occur in order). If a step times out, the path resets.
Works on lower TFs, but the 4H baseline reduces noise and over-trading.
Consider pairing with volume or structure filters if you want fewer but higher-conviction entries.
Past performance ≠ future results. **Educational use only. Not financial advice.

Directional Indicator Crossovers v1[JopAlgo]Directional Indicator Crossovers v1 — the classic DMI, made clearer and easier to act on
We'd like to introduce you to a more relaxed, streamlined version of DI. While it may not seem like it at first glance, we've taken the D+/D- method as a starting point and developed our own version of this indicator: two lines, a smooth green/red field indicating who's in control, and clear crossover alerts for a flip. We deliberately chose the step line representation because it closely matches the candlestick patterns on the chart. Designed to help you react faster—without clutter.
What you’ll see
+DI (green) and −DI (red) using classic Wilder smoothing.
A soft control zone between the lines: green when +DI dominates, red when −DI dominates.
Crossover alerts (no labels, no background flooding)—just the turning points.
Why this helps
Instant bias: the shaded field tells you who’s in control without reading values.
Cleaner execution: minimal visuals keep focus on the handoff (+DI↔−DI) and your price levels.
Actionable by design: built-in alerts fire right at the flip to route into your workflow.
How to read it
Bias: Green zone → buyers lead. Red zone → sellers lead.
Trigger: Consider entries on the DI crossover that aligns with your higher-timeframe context (trend, S/R, OB).
Patience in chop: If flips are frequent in tight ranges, wait for sustained zone dominance or confirm on a higher TF.
Exit/flip: Opposite crossover or a clear loss of dominance.
Settings that matter
DI Length (default 14): Higher = calmer, fewer flips. Lower = faster, more signals.
Visuals: Keep the control zone on for quick reads; hide crossover marks if you prefer pure lines.
Alerts: Enable bullish and bearish DI cross alerts; connect to notifications or webhooks as needed.
Starter presets
Intraday (15m–1H): DI Length 12–14 for quicker handoffs.
Swing (4H–1D): DI Length 14–20 for cleaner signals.
Choppy assets: Nudge length higher to dampen noise.
Where it shines (and limits)
Best: Liquid markets (crypto majors, indices, large caps) where handoffs matter.
Works elsewhere: Still useful on slower pairs; extend length for stability.
Limit: Frequent flips in low-range sessions—pair with HTF bias or structure.
Alerts included
Bullish DI Crossover: +DI crosses above −DI.
Bearish DI Crossover: −DI crosses above +DI.
Attribution & License
Built on the Directional Movement Index concept by J. Welles Wilder Jr. (1978).
Independent Pine v6 implementation (not derived from TradingView’s built-in source).
Released as Open Source (MPL-2.0)—please keep the license header intact.
Disclaimer
For educational purposes only; not financial advice. Trading involves risk. Test first, use clear levels, and manage risk. This project is independent and not affiliated with or endorsed by TradingView.
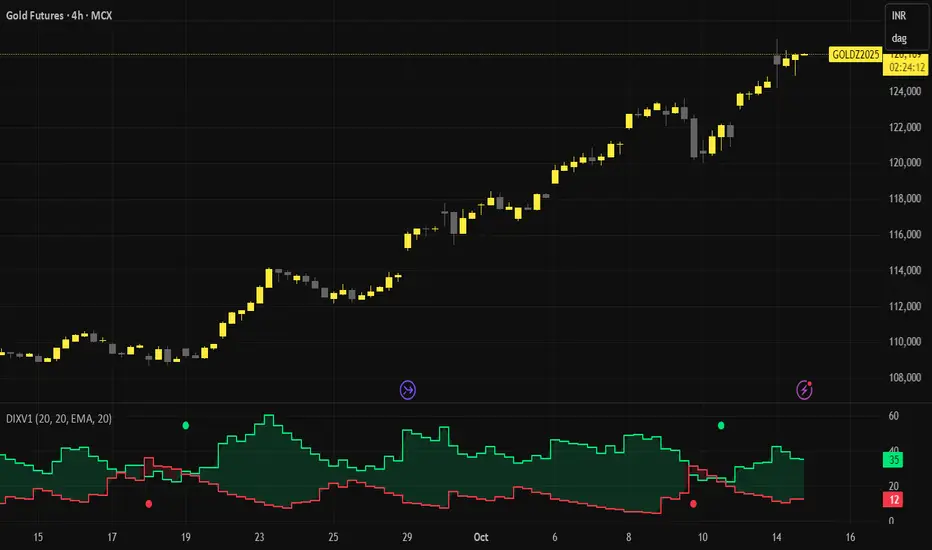
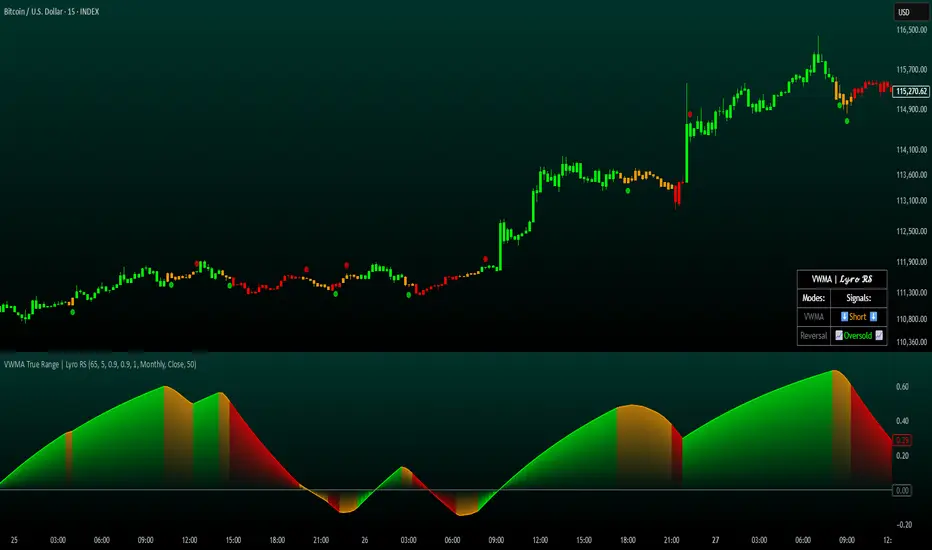
VWMA True Range | Lyro RSVWMA True Range | Lyro RS
This script is a hybrid technical analysis tool designed to identify trends and spot potential reversals. It employs a consensus-based system that uses multiple smoothed, Volume-Weighted Moving Averages (VWMA) to generate both trend-following and counter-trend signals.
Understanding the Indicator's Components
The indicator plots a main line on a separate pane and provides visual alerts directly on the chart.
The Main Line: This line represents a smoothed average of momentum scores derived from multiple VWMAs. Its direction and value are the foundation of the analysis.
Signal Generation: The tool provides two distinct types of signals:
Trend Signals: These trend-following signals ("⬆️Long" / "⬇️Short") activate when the indicator's consensus reaches a pre-set strength threshold, indicating sustained momentum in one direction.
Reversal Signals: These counter-trend alerts ("📈Oversold" / "📉Overbought") trigger when the main line breaks a previous period's level, hinting at exhaustion and a potential short-term reversal.
Visual Alerts:
Colored Background: The indicator's background highlights during strong trend signals for added visual emphasis.
Chart Shapes: Small circles appear on the main chart to mark where potential reversals are detected.
Colored Candles: You can choose to color the price candles to reflect the current trend signal.
Information Table: A compact table provides an at-a-glance summary of all currently active signals.
Suggested Use and Interpretation
Here are a few ways to incorporate this indicator into your analysis:
Following the Trend: Use the "Long" or "Short" trend signals to align your trades with the prevailing market momentum.
Spotting Reversals: Watch for "Oversold" or "Overbought" reversal signals, often accompanied by chart shapes, to identify potential market turning points.
Combining Signals: Use the primary trend signal for context and look for reversal signals that may indicate a pullback within the larger trend, potentially offering favorable entry points.
Customization Options:
You can tailor the indicator's behavior and appearance through several settings:
Core Settings: Adjust the Calculation Period and Smooth Length to make the main line more or less responsive to price movements.
Signal Thresholds: Fine-tune the Long threshold and Short threshold to control how easily trend signals are triggered.
Visual Settings: Toggle various visual elements like the indicator band, candle coloring, and the information table on or off.
Table Settings: Customize where the information table appears and its size to suit your chart layout.
⚠️Disclaimer
This indicator is a tool for technical analysis and does not guarantee future results. It should be used as part of a comprehensive trading strategy that includes other analysis techniques and strict risk management. The creators are not responsible for any financial decisions made based on its signals.
Keltner Channel Enhanced [DCAUT]█ Keltner Channel Enhanced
📊 ORIGINALITY & INNOVATION
The Keltner Channel Enhanced represents an important advancement over standard Keltner Channel implementations by introducing dual flexibility in moving average selection for both the middle band and ATR calculation. While traditional Keltner Channels typically use EMA for the middle band and RMA (Wilder's smoothing) for ATR, this enhanced version provides access to 25+ moving average algorithms for both components, enabling traders to fine-tune the indicator's behavior to match specific market characteristics and trading approaches.
Key Advancements:
Dual MA Algorithm Flexibility: Independent selection of moving average types for middle band (25+ options) and ATR smoothing (25+ options), allowing optimization of both trend identification and volatility measurement separately
Enhanced Trend Sensitivity: Ability to use faster algorithms (HMA, T3) for middle band while maintaining stable volatility measurement with traditional ATR smoothing, or vice versa for different trading strategies
Adaptive Volatility Measurement: Choice of ATR smoothing algorithm affects channel responsiveness to volatility changes, from highly reactive (SMA, EMA) to smoothly adaptive (RMA, TEMA)
Comprehensive Alert System: Five distinct alert conditions covering breakouts, trend changes, and volatility expansion, enabling automated monitoring without constant chart observation
Multi-Timeframe Compatibility: Works effectively across all timeframes from intraday scalping to long-term position trading, with independent optimization of trend and volatility components
This implementation addresses key limitations of standard Keltner Channels: fixed EMA/RMA combination may not suit all market conditions or trading styles. By decoupling the trend component from volatility measurement and allowing independent algorithm selection, traders can create highly customized configurations for specific instruments and market phases.
📐 MATHEMATICAL FOUNDATION
Keltner Channel Enhanced uses a three-component calculation system that combines a flexible moving average middle band with ATR-based (Average True Range) upper and lower channels, creating volatility-adjusted trend-following bands.
Core Calculation Process:
1. Middle Band (Basis) Calculation:
The basis line is calculated using the selected moving average algorithm applied to the price source over the specified period:
basis = ma(source, length, maType)
Supported algorithms include EMA (standard choice, trend-biased), SMA (balanced and symmetric), HMA (reduced lag), WMA, VWMA, TEMA, T3, KAMA, and 17+ others.
2. Average True Range (ATR) Calculation:
ATR measures market volatility by calculating the average of true ranges over the specified period:
trueRange = max(high - low, abs(high - close ), abs(low - close ))
atrValue = ma(trueRange, atrLength, atrMaType)
ATR smoothing algorithm significantly affects channel behavior, with options including RMA (standard, very smooth), SMA (moderate smoothness), EMA (fast adaptation), TEMA (smooth yet responsive), and others.
3. Channel Calculation:
Upper and lower channels are positioned at specified multiples of ATR from the basis:
upperChannel = basis + (multiplier × atrValue)
lowerChannel = basis - (multiplier × atrValue)
Standard multiplier is 2.0, providing channels that dynamically adjust width based on market volatility.
Keltner Channel vs. Bollinger Bands - Key Differences:
While both indicators create volatility-based channels, they use fundamentally different volatility measures:
Keltner Channel (ATR-based):
Uses Average True Range to measure actual price movement volatility
Incorporates gaps and limit moves through true range calculation
More stable in trending markets, less prone to extreme compression
Better reflects intraday volatility and trading range
Typically fewer band touches, making touches more significant
More suitable for trend-following strategies
Bollinger Bands (Standard Deviation-based):
Uses statistical standard deviation to measure price dispersion
Based on closing prices only, doesn't account for intraday range
Can compress significantly during consolidation (squeeze patterns)
More touches in ranging markets
Better suited for mean-reversion strategies
Provides statistical probability framework (95% within 2 standard deviations)
Algorithm Combination Effects:
The interaction between middle band MA type and ATR MA type creates different indicator characteristics:
Trend-Focused Configuration (Fast MA + Slow ATR): Middle band uses HMA/EMA/T3, ATR uses RMA/TEMA, quick trend changes with stable channel width, suitable for trend-following
Volatility-Focused Configuration (Slow MA + Fast ATR): Middle band uses SMA/WMA, ATR uses EMA/SMA, stable trend with dynamic channel width, suitable for volatility trading
Balanced Configuration (Standard EMA/RMA): Classic Keltner Channel behavior, time-tested combination, suitable for general-purpose trend following
Adaptive Configuration (KAMA + KAMA): Self-adjusting indicator responding to efficiency ratio, suitable for markets with varying trend strength and volatility regimes
📊 COMPREHENSIVE SIGNAL ANALYSIS
Keltner Channel Enhanced provides multiple signal categories optimized for trend-following and breakout strategies.
Channel Position Signals:
Upper Channel Interaction:
Price Touching Upper Channel: Strong bullish momentum, price moving more than typical volatility range suggests, potential continuation signal in established uptrends
Price Breaking Above Upper Channel: Exceptional strength, price exceeding normal volatility expectations, consider adding to long positions or tightening trailing stops
Price Riding Upper Channel: Sustained strong uptrend, characteristic of powerful bull moves, stay with trend and avoid premature profit-taking
Price Rejection at Upper Channel: Momentum exhaustion signal, consider profit-taking on longs or waiting for pullback to middle band for reentry
Lower Channel Interaction:
Price Touching Lower Channel: Strong bearish momentum, price moving more than typical volatility range suggests, potential continuation signal in established downtrends
Price Breaking Below Lower Channel: Exceptional weakness, price exceeding normal volatility expectations, consider adding to short positions or protecting against further downside
Price Riding Lower Channel: Sustained strong downtrend, characteristic of powerful bear moves, stay with trend and avoid premature covering
Price Rejection at Lower Channel: Momentum exhaustion signal, consider covering shorts or waiting for bounce to middle band for reentry
Middle Band (Basis) Signals:
Trend Direction Confirmation:
Price Above Basis: Bullish trend bias, middle band acts as dynamic support in uptrends, consider long positions or holding existing longs
Price Below Basis: Bearish trend bias, middle band acts as dynamic resistance in downtrends, consider short positions or avoiding longs
Price Crossing Above Basis: Potential trend change from bearish to bullish, early signal to establish long positions
Price Crossing Below Basis: Potential trend change from bullish to bearish, early signal to establish short positions or exit longs
Pullback Trading Strategy:
Uptrend Pullback: Price pulls back from upper channel to middle band, finds support, and resumes upward, ideal long entry point
Downtrend Bounce: Price bounces from lower channel to middle band, meets resistance, and resumes downward, ideal short entry point
Basis Test: Strong trends often show price respecting the middle band as support/resistance on pullbacks
Failed Test: Price breaking through middle band against trend direction signals potential reversal
Volatility-Based Signals:
Narrow Channels (Low Volatility):
Consolidation Phase: Channels contract during periods of reduced volatility and directionless price action
Breakout Preparation: Narrow channels often precede significant directional moves as volatility cycles
Trading Approach: Reduce position sizes, wait for breakout confirmation, avoid range-bound strategies within channels
Breakout Direction: Monitor for price breaking decisively outside channel range with expanding width
Wide Channels (High Volatility):
Trending Phase: Channels expand during strong directional moves and increased volatility
Momentum Confirmation: Wide channels confirm genuine trend with substantial volatility backing
Trading Approach: Trend-following strategies excel, wider stops necessary, mean-reversion strategies risky
Exhaustion Signs: Extreme channel width (historical highs) may signal approaching consolidation or reversal
Advanced Pattern Recognition:
Channel Walking Pattern:
Upper Channel Walk: Price consistently touches or exceeds upper channel while staying above basis, very strong uptrend signal, hold longs aggressively
Lower Channel Walk: Price consistently touches or exceeds lower channel while staying below basis, very strong downtrend signal, hold shorts aggressively
Basis Support/Resistance: During channel walks, price typically uses middle band as support/resistance on minor pullbacks
Pattern Break: Price crossing basis during channel walk signals potential trend exhaustion
Squeeze and Release Pattern:
Squeeze Phase: Channels narrow significantly, price consolidates near middle band, volatility contracts
Direction Clues: Watch for price positioning relative to basis during squeeze (above = bullish bias, below = bearish bias)
Release Trigger: Price breaking outside narrow channel range with expanding width confirms breakout
Follow-Through: Measure squeeze height and project from breakout point for initial profit targets
Channel Expansion Pattern:
Breakout Confirmation: Rapid channel widening confirms volatility increase and genuine trend establishment
Entry Timing: Enter positions early in expansion phase before trend becomes overextended
Risk Management: Use channel width to size stops appropriately, wider channels require wider stops
Basis Bounce Pattern:
Clean Bounce: Price touches middle band and immediately reverses, confirms trend strength and entry opportunity
Multiple Bounces: Repeated basis bounces indicate strong, sustainable trend
Bounce Failure: Price penetrating basis signals weakening trend and potential reversal
Divergence Analysis:
Price/Channel Divergence: Price makes new high/low while staying within channel (not reaching outer band), suggests momentum weakening
Width/Price Divergence: Price breaks to new extremes but channel width contracts, suggests move lacks conviction
Reversal Signal: Divergences often precede trend reversals or significant consolidation periods
Multi-Timeframe Analysis:
Keltner Channels work particularly well in multi-timeframe trend-following approaches:
Three-Timeframe Alignment:
Higher Timeframe (Weekly/Daily): Identify major trend direction, note price position relative to basis and channels
Intermediate Timeframe (Daily/4H): Identify pullback opportunities within higher timeframe trend
Lower Timeframe (4H/1H): Time precise entries when price touches middle band or lower channel (in uptrends) with rejection
Optimal Entry Conditions:
Best Long Entries: Higher timeframe in uptrend (price above basis), intermediate timeframe pulls back to basis, lower timeframe shows rejection at middle band or lower channel
Best Short Entries: Higher timeframe in downtrend (price below basis), intermediate timeframe bounces to basis, lower timeframe shows rejection at middle band or upper channel
Risk Management: Use higher timeframe channel width to set position sizing, stops below/above higher timeframe channels
🎯 STRATEGIC APPLICATIONS
Keltner Channel Enhanced excels in trend-following and breakout strategies across different market conditions.
Trend Following Strategy:
Setup Requirements:
Identify established trend with price consistently on one side of basis line
Wait for pullback to middle band (basis) or brief penetration through it
Confirm trend resumption with price rejection at basis and move back toward outer channel
Enter in trend direction with stop beyond basis line
Entry Rules:
Uptrend Entry:
Price pulls back from upper channel to middle band, shows support at basis (bullish candlestick, momentum divergence)
Enter long on rejection/bounce from basis with stop 1-2 ATR below basis
Aggressive: Enter on first touch; Conservative: Wait for confirmation candle
Downtrend Entry:
Price bounces from lower channel to middle band, shows resistance at basis (bearish candlestick, momentum divergence)
Enter short on rejection/reversal from basis with stop 1-2 ATR above basis
Aggressive: Enter on first touch; Conservative: Wait for confirmation candle
Trend Management:
Trailing Stop: Use basis line as dynamic trailing stop, exit if price closes beyond basis against position
Profit Taking: Take partial profits at opposite channel, move stops to basis
Position Additions: Add to winners on subsequent basis bounces if trend intact
Breakout Strategy:
Setup Requirements:
Identify consolidation period with contracting channel width
Monitor price action near middle band with reduced volatility
Wait for decisive breakout beyond channel range with expanding width
Enter in breakout direction after confirmation
Breakout Confirmation:
Price breaks clearly outside channel (upper for longs, lower for shorts), channel width begins expanding from contracted state
Volume increases significantly on breakout (if using volume analysis)
Price sustains outside channel for multiple bars without immediate reversal
Entry Approaches:
Aggressive: Enter on initial break with stop at opposite channel or basis, use smaller position size
Conservative: Wait for pullback to broken channel level, enter on rejection and resumption, tighter stop
Volatility-Based Position Sizing:
Adjust position sizing based on channel width (ATR-based volatility):
Wide Channels (High ATR): Reduce position size as stops must be wider, calculate position size using ATR-based risk calculation: Risk / (Stop Distance in ATR × ATR Value)
Narrow Channels (Low ATR): Increase position size as stops can be tighter, be cautious of impending volatility expansion
ATR-Based Risk Management: Use ATR-based risk calculations, position size = 0.01 × Capital / (2 × ATR), use multiples of ATR (1-2 ATR) for adaptive stops
Algorithm Selection Guidelines:
Different market conditions benefit from different algorithm combinations:
Strong Trending Markets: Middle band use EMA or HMA, ATR use RMA, capture trends quickly while maintaining stable channel width
Choppy/Ranging Markets: Middle band use SMA or WMA, ATR use SMA or WMA, avoid false trend signals while identifying genuine reversals
Volatile Markets: Middle band and ATR both use KAMA or FRAMA, self-adjusting to changing market conditions reduces manual optimization
Breakout Trading: Middle band use SMA, ATR use EMA or SMA, stable trend with dynamic channels highlights volatility expansion early
Scalping/Day Trading: Middle band use HMA or T3, ATR use EMA or TEMA, both components respond quickly
Position Trading: Middle band use EMA/TEMA/T3, ATR use RMA or TEMA, filter out noise for long-term trend-following
📋 DETAILED PARAMETER CONFIGURATION
Understanding and optimizing parameters is essential for adapting Keltner Channel Enhanced to specific trading approaches.
Source Parameter:
Close (Most Common): Uses closing price, reflects daily settlement, best for end-of-day analysis and position trading, standard choice
HL2 (Median Price): Smooths out closing bias, better represents full daily range in volatile markets, good for swing trading
HLC3 (Typical Price): Gives more weight to close while including full range, popular for intraday applications, slightly more responsive than HL2
OHLC4 (Average Price): Most comprehensive price representation, smoothest option, good for gap-prone markets or highly volatile instruments
Length Parameter:
Controls the lookback period for middle band (basis) calculation:
Short Periods (10-15): Very responsive to price changes, suitable for day trading and scalping, higher false signal rate
Standard Period (20 - Default): Represents approximately one month of trading, good balance between responsiveness and stability, suitable for swing and position trading
Medium Periods (30-50): Smoother trend identification, fewer false signals, better for position trading and longer holding periods
Long Periods (50+): Very smooth, identifies major trends only, minimal false signals but significant lag, suitable for long-term investment
Optimization by Timeframe: 1-15 minute charts use 10-20 period, 30-60 minute charts use 20-30 period, 4-hour to daily charts use 20-40 period, weekly charts use 20-30 weeks.
ATR Length Parameter:
Controls the lookback period for Average True Range calculation, affecting channel width:
Short ATR Periods (5-10): Very responsive to recent volatility changes, standard is 10 (Keltner's original specification), may be too reactive in whipsaw conditions
Standard ATR Period (10 - Default): Chester Keltner's original specification, good balance between responsiveness and stability, most widely used
Medium ATR Periods (14-20): Smoother channel width, ATR 14 aligns with Wilder's original ATR specification, good for position trading
Long ATR Periods (20+): Very smooth channel width, suitable for long-term trend-following
Length vs. ATR Length Relationship: Equal values (20/20) provide balanced responsiveness, longer ATR (20/14) gives more stable channel width, shorter ATR (20/10) is standard configuration, much shorter ATR (20/5) creates very dynamic channels.
Multiplier Parameter:
Controls channel width by setting ATR multiples:
Lower Values (1.0-1.5): Tighter channels with frequent price touches, more trading signals, higher false signal rate, better for range-bound and mean-reversion strategies
Standard Value (2.0 - Default): Chester Keltner's recommended setting, good balance between signal frequency and reliability, suitable for both trending and ranging strategies
Higher Values (2.5-3.0): Wider channels with less frequent touches, fewer but potentially higher-quality signals, better for strong trending markets
Market-Specific Optimization: High volatility markets (crypto, small-caps) use 2.5-3.0 multiplier, medium volatility markets (major forex, large-caps) use 2.0 multiplier, low volatility markets (bonds, utilities) use 1.5-2.0 multiplier.
MA Type Parameter (Middle Band):
Critical selection that determines trend identification characteristics:
EMA (Exponential Moving Average - Default): Standard Keltner Channel choice, Chester Keltner's original specification, emphasizes recent prices, faster response to trend changes, suitable for all timeframes
SMA (Simple Moving Average): Equal weighting of all data points, no directional bias, slower than EMA, better for ranging markets and mean-reversion
HMA (Hull Moving Average): Minimal lag with smooth output, excellent for fast trend identification, best for day trading and scalping
TEMA (Triple Exponential Moving Average): Advanced smoothing with reduced lag, responsive to trends while filtering noise, suitable for volatile markets
T3 (Tillson T3): Very smooth with minimal lag, excellent for established trend identification, suitable for position trading
KAMA (Kaufman Adaptive Moving Average): Automatically adjusts speed based on market efficiency, slow in ranging markets, fast in trends, suitable for markets with varying conditions
ATR MA Type Parameter:
Determines how Average True Range is smoothed, affecting channel width stability:
RMA (Wilder's Smoothing - Default): J. Welles Wilder's original ATR smoothing method, very smooth, slow to adapt to volatility changes, provides stable channel width
SMA (Simple Moving Average): Equal weighting, moderate smoothness, faster response to volatility changes than RMA, more dynamic channel width
EMA (Exponential Moving Average): Emphasizes recent volatility, quick adaptation to new volatility regimes, very responsive channel width changes
TEMA (Triple Exponential Moving Average): Smooth yet responsive, good balance for varying volatility, suitable for most trading styles
Parameter Combination Strategies:
Conservative Trend-Following: Length 30/ATR Length 20/Multiplier 2.5, MA Type EMA or TEMA/ATR MA Type RMA, smooth trend with stable wide channels, suitable for position trading
Standard Balanced Approach: Length 20/ATR Length 10/Multiplier 2.0, MA Type EMA/ATR MA Type RMA, classic Keltner Channel configuration, suitable for general purpose swing trading
Aggressive Day Trading: Length 10-15/ATR Length 5-7/Multiplier 1.5-2.0, MA Type HMA or EMA/ATR MA Type EMA or SMA, fast trend with dynamic channels, suitable for scalping and day trading
Breakout Specialist: Length 20-30/ATR Length 5-10/Multiplier 2.0, MA Type SMA or WMA/ATR MA Type EMA or SMA, stable trend with responsive channel width
Adaptive All-Conditions: Length 20/ATR Length 10/Multiplier 2.0, MA Type KAMA or FRAMA/ATR MA Type KAMA or TEMA, self-adjusting to market conditions
Offset Parameter:
Controls horizontal positioning of channels on chart. Positive values shift channels to the right (future) for visual projection, negative values shift left (past) for historical analysis, zero (default) aligns with current price bars for real-time signal analysis. Offset affects only visual display, not alert conditions or actual calculations.
📈 PERFORMANCE ANALYSIS & COMPETITIVE ADVANTAGES
Keltner Channel Enhanced provides improvements over standard implementations while maintaining proven effectiveness.
Response Characteristics:
Standard EMA/RMA Configuration: Moderate trend lag (approximately 0.4 × length periods), smooth and stable channel width from RMA smoothing, good balance for most market conditions
Fast HMA/EMA Configuration: Approximately 60% reduction in trend lag compared to EMA, responsive channel width from EMA ATR smoothing, suitable for quick trend changes and breakouts
Adaptive KAMA/KAMA Configuration: Variable lag based on market efficiency, automatic adjustment to trending vs. ranging conditions, self-optimizing behavior reduces manual intervention
Comparison with Traditional Keltner Channels:
Enhanced Version Advantages:
Dual Algorithm Flexibility: Independent MA selection for trend and volatility vs. fixed EMA/RMA, separate tuning of trend responsiveness and channel stability
Market Adaptation: Choose configurations optimized for specific instruments and conditions, customize for scalping, swing, or position trading preferences
Comprehensive Alerts: Enhanced alert system including channel expansion detection
Traditional Version Advantages:
Simplicity: Fewer parameters, easier to understand and implement
Standardization: Fixed EMA/RMA combination ensures consistency across users
Research Base: Decades of backtesting and research on standard configuration
When to Use Enhanced Version: Trading multiple instruments with different characteristics, switching between trending and ranging markets, employing different strategies, algorithm-based trading systems requiring customization, seeking optimization for specific trading style and timeframe.
When to Use Standard Version: Beginning traders learning Keltner Channel concepts, following published research or trading systems, preferring simplicity and standardization, wanting to avoid optimization and curve-fitting risks.
Performance Across Market Conditions:
Strong Trending Markets: EMA or HMA basis with RMA or TEMA ATR smoothing provides quicker trend identification, pullbacks to basis offer excellent entry opportunities
Choppy/Ranging Markets: SMA or WMA basis with RMA ATR smoothing and lower multipliers, channel bounce strategies work well, avoid false breakouts
Volatile Markets: KAMA or FRAMA with EMA or TEMA, adaptive algorithms excel by automatic adjustment, wider multipliers (2.5-3.0) accommodate large price swings
Low Volatility/Consolidation: Channels narrow significantly indicating consolidation, algorithm choice less impactful, focus on detecting channel width contraction for breakout preparation
Keltner Channel vs. Bollinger Bands - Usage Comparison:
Favor Keltner Channels When: Trend-following is primary strategy, trading volatile instruments with gaps, want ATR-based volatility measurement, prefer fewer higher-quality channel touches, seeking stable channel width during trends.
Favor Bollinger Bands When: Mean-reversion is primary strategy, trading instruments with limited gaps, want statistical framework based on standard deviation, need squeeze patterns for breakout identification, prefer more frequent trading opportunities.
Use Both Together: Bollinger Band squeeze + Keltner Channel breakout is powerful combination, price outside Bollinger Bands but inside Keltner Channels indicates moderate signal, price outside both indicates very strong signal, Bollinger Bands for entries and Keltner Channels for trend confirmation.
Limitations and Considerations:
General Limitations:
Lagging Indicator: All moving averages lag price, even with reduced-lag algorithms
Trend-Dependent: Works best in trending markets, less effective in choppy conditions
No Direction Prediction: Indicates volatility and deviation, not future direction, requires confirmation
Enhanced Version Specific Considerations:
Optimization Risk: More parameters increase risk of curve-fitting historical data
Complexity: Additional choices may overwhelm beginning traders
Backtesting Challenges: Different algorithms produce different historical results
Mitigation Strategies:
Use Confirmation: Combine with momentum indicators (RSI, MACD), volume, or price action
Test Parameter Robustness: Ensure parameters work across range of values, not just optimized ones
Multi-Timeframe Analysis: Confirm signals across different timeframes
Proper Risk Management: Use appropriate position sizing and stops
Start Simple: Begin with standard EMA/RMA before exploring alternatives
Optimal Usage Recommendations:
For Maximum Effectiveness:
Start with standard EMA/RMA configuration to understand classic behavior
Experiment with alternatives on demo account or paper trading
Match algorithm combination to market condition and trading style
Use channel width analysis to identify market phases
Combine with complementary indicators for confirmation
Implement strict risk management using ATR-based position sizing
Focus on high-quality setups rather than trading every signal
Respect the trend: trade with basis direction for higher probability
Complementary Indicators:
RSI or Stochastic: Confirm momentum at channel extremes
MACD: Confirm trend direction and momentum shifts
Volume: Validate breakouts and trend strength
ADX: Measure trend strength, avoid Keltner signals in weak trends
Support/Resistance: Combine with traditional levels for high-probability setups
Bollinger Bands: Use together for enhanced breakout and volatility analysis
USAGE NOTES
This indicator is designed for technical analysis and educational purposes. Keltner Channel Enhanced has limitations and should not be used as the sole basis for trading decisions. While the flexible moving average selection for both trend and volatility components provides valuable adaptability across different market conditions, algorithm performance varies with market conditions, and past characteristics do not guarantee future results.
Key considerations:
Always use multiple forms of analysis and confirmation before entering trades
Backtest any parameter combination thoroughly before live trading
Be aware that optimization can lead to curve-fitting if not done carefully
Start with standard EMA/RMA settings and adjust only when specific conditions warrant
Understand that no moving average algorithm can eliminate lag entirely
Consider market regime (trending, ranging, volatile) when selecting parameters
Use ATR-based position sizing and risk management on every trade
Keltner Channels work best in trending markets, less effective in choppy conditions
Respect the trend direction indicated by price position relative to basis line
The enhanced flexibility of dual algorithm selection provides powerful tools for adaptation but requires responsible use, thorough understanding of how different algorithms behave under various market conditions, and disciplined risk management.

FVG Scanner ProFVG Scanner Pro — Smart Fair Value Gap Detector (with HTF context & proximity alerts)
What it does
FVG Scanner Pro automatically finds Fair Value Gaps (FVGs) on your current chart and (optionally) on a higher timeframe (HTF), draws them as color-coded zones, and notifies you when price comes close to a gap boundary using an ADR-based proximity trigger and (optional) volume confirmation. It’s designed for ICT-style gap trading, confluence building, and clean visual execution.
How it works:
FVG definition
* Bullish FVG (gap up): low > high (the current candle’s low is above the high 2 bars ago).
* Bearish FVG (gap down): high < low (the current candle’s high is below the low 2 bars ago).
* Gaps smaller than your Min FVG Size (%) are ignored. (Gap size = (top-bottom)/bottom * 100.)
Higher-timeframe logic (auto-selected)
The script auto picks a sensible HTF:
1–5m → 15m, 15m → 1H, 1H → 4H, 4H → 1D, 1D → 1W, 1W → 1M, small 1M → 3M, big ≥3M → 12M.
You can display HTF FVGs and even filter so current-TF FVGs only show when they overlap an HTF gap.
Proximity alerts (ADR-based)
The script computes ADR on the current chart timeframe over a user-set lookback (default 20 bars).
An alert fires when price moves toward the closest actionable boundary and comes within ADR × Multiplier:
Bullish: price moving down, within distance of the bottom of a bullish FVG.
Bearish: price moving up, within distance of the top of a bearish FVG.
Yellow ▲/▼ markers show where a proximity alert triggered.
Volume filter (optional)
Require volume to be greater than SMA(20) × multiplier to accept a newly formed FVG.
Lifecycle
Each gap remains active for Extend FVG Box (Bars) bars.
You can delete the box after fill, or keep filled gaps visible as gray zones, or hide them.
Color legend
Current-TF Bullish: Pink/Magenta box
Current-TF Bearish: Cyan/Turquoise box
HTF Bullish: Gold box
HTF Bearish: Orange box
Filled (if shown): Gray box
Alert markers: Yellow ▲ (bullish), Yellow ▼ (bearish)
Inputs (what to tweak)
Show FVGs: Bullish / Bearish / Both
Max Bars Back to Find FVG: collection window & cleanup guard
Extend FVG Box (Bars): how long a zone stays tradable/active
Min FVG Size (%): ignore micro gaps
Delete Box After Fill & Show Filled FVGs: choose how you want completed gaps handled
Show Alert Markers: show/hide the yellow proximity arrows
Show Higher Timeframe FVG: overlay HTF gaps (auto TF)
HTF Filter: only display current-TF gaps that overlap an HTF gap
ADR Lookback & Proximity Multiplier: tune alert sensitivity to your market & timeframe
Volume Filter & Volume > MA Multiple: require above-average volume for new gaps
Built-in alerts (ready to use)
Create alerts in TradingView (⚠️ “Once per bar” or “Once per bar close”, your choice) and select from:
🟢 Bullish FVG Proximity — price approaching a bullish gap bottom
🔴 Bearish FVG Proximity — price approaching a bearish gap top
✅ New Bullish FVG Formed
⚠️ New Bearish FVG Formed
The alert messages include the symbol and price; proximity markers are also plotted on chart.
Tips & best practices
Use FVGs with market structure (break of structure, swing points), order blocks, or liquidity pools for confluence.
On very low timeframes, raise Min FVG Size and/or lower Max Bars Back to reduce noise and keep things fast.
Extend FVG Box controls how long a zone is considered valid; align it with your holding horizon (scalp vs swing).
Information panel (top-right)
Shows your mode, current HTF, number of gaps in memory, active bull/bear counts, and current-TF ADR.

Trend Discovery by Alex Trend States (Up / Reversal / Down)Author: © Alex Neighbors
Version: v6
The Call/Put Arrow Indicator is a complete market direction tool that identifies high-probability CALL (bullish) and PUT (bearish) opportunities using a combination of:
Simple Moving Averages (SMA)
RSI Momentum
MACD confirmation
VWAP trend filtering
Real-time trend classification (Trending Up, Trending Down, or Reversal)
It provides visual buy/sell arrows, trend labels, and alerts, helping traders quickly recognize optimal option entry points and directional momentum changes.
*** How It Works
✅ CALL Arrow (Green, Up Arrow Below Candle):
Triggered when:
Fast SMA > Slow SMA (uptrend)
RSI > Threshold (default 55)
MACD Line > Signal Line
(Optional) Price > VWAP
🔻 PUT Arrow (Red, Down Arrow Above Candle):
Triggered when:
Fast SMA < Slow SMA (downtrend)
RSI < Threshold (default 45)
MACD Line < Signal Line
(Optional) Price < VWAP
**Trend Detection System:
Trending Up: Both SMAs rising with bullish alignment
Trending Down: Both SMAs falling with bearish alignment
Trend Reversal: Detected instantly when Fast SMA crosses the Slow SMA (marked by a diamond)
Visuals
🟩 Green arrows below candles for CALL entries
🟥 Red arrows above candles for PUT entries
🟢/🔴 Diamonds mark trend reversals
Trend status panel in the top-right corner
Optional background or bar coloring for quick visual confirmation
Alerts
You can create alerts for:
CALL Buy Signal
PUT Buy Signal
Trend Reversal Up
Trend Reversal Down
All alerts trigger exactly when arrows or reversals appear on the chart.
--Best Use
Works on any symbol or timeframe (scalping, swing, or trend trading)
Optimized for SPX, QQQ, TSLA, and high-volume tickers
Ideal for traders combining options flow or price action confirmation
Customization
You can adjust:
SMA lengths
RSI thresholds
MACD parameters
VWAP filter toggle
Background/bar coloring and panel display
Why Traders Love It
Simple, clean chart visuals
Non-repainting, confirmed-bar signals
Multi-filter logic for high accuracy
Trend panel for instant context
Use this indicator to stay on the right side of the market.
Identify reversals early, trade the momentum confidently, and never miss your next CALL or PUT setup again.

BOCS Channel Scalper Indicator - Mean Reversion Alert System# BOCS Channel Scalper Indicator - Mean Reversion Alert System
## WHAT THIS INDICATOR DOES:
This is a mean reversion trading indicator that identifies consolidation channels through volatility analysis and generates alert signals when price enters entry zones near channel boundaries. **This indicator version is designed for manual trading with comprehensive alert functionality.** Unlike automated strategies, this tool sends notifications (via popup, email, SMS, or webhook) when trading opportunities occur, allowing you to manually review and execute trades. The system assumes price will revert to the channel mean, identifying scalp opportunities as price reaches extremes and preparing to bounce back toward center.
## INDICATOR VS STRATEGY - KEY DISTINCTION:
**This is an INDICATOR with alerts, not an automated strategy.** It does not execute trades automatically. Instead, it:
- Displays visual signals on your chart when entry conditions are met
- Sends customizable alerts to your device/email when opportunities arise
- Shows TP/SL levels for reference but does not place orders
- Requires you to manually enter and exit positions based on signals
- Works with all TradingView subscription levels (alerts included on all plans)
**For automated trading with backtesting**, use the strategy version. For manual control with notifications, use this indicator version.
## ALERT CAPABILITIES:
This indicator includes four distinct alert conditions that can be configured independently:
**1. New Channel Formation Alert**
- Triggers when a fresh BOCS channel is identified
- Message: "New BOCS channel formed - potential scalp setup ready"
- Use this to prepare for upcoming trading opportunities
**2. Long Scalp Entry Alert**
- Fires when price touches the long entry zone
- Message includes current price, calculated TP, and SL levels
- Notification example: "LONG scalp signal at 24731.75 | TP: 24743.2 | SL: 24716.5"
**3. Short Scalp Entry Alert**
- Fires when price touches the short entry zone
- Message includes current price, calculated TP, and SL levels
- Notification example: "SHORT scalp signal at 24747.50 | TP: 24735.0 | SL: 24762.75"
**4. Any Entry Signal Alert**
- Combined alert for both long and short entries
- Use this if you want a single alert stream for all opportunities
- Message: "BOCS Scalp Entry: at "
**Setting Up Alerts:**
1. Add indicator to chart and configure settings
2. Click the Alert (⏰) button in TradingView toolbar
3. Select "BOCS Channel Scalper" from condition dropdown
4. Choose desired alert type (Long, Short, Any, or Channel Formation)
5. Set "Once Per Bar Close" to avoid false signals during bar formation
6. Configure delivery method (popup, email, webhook for automation platforms)
7. Save alert - it will fire automatically when conditions are met
**Alert Message Placeholders:**
Alerts use TradingView's dynamic placeholder system:
- {{ticker}} = Symbol name (e.g., NQ1!)
- {{close}} = Current price at signal
- {{plot_1}} = Calculated take profit level
- {{plot_2}} = Calculated stop loss level
These placeholders populate automatically, creating detailed notification messages without manual configuration.
## KEY DIFFERENCE FROM ORIGINAL BOCS:
**This indicator is designed for traders seeking higher trade frequency.** The original BOCS indicator trades breakouts OUTSIDE channels, waiting for price to escape consolidation before entering. This scalper version trades mean reversion INSIDE channels, entering when price reaches channel extremes and betting on a bounce back to center. The result is significantly more trading opportunities:
- **Original BOCS**: 1-3 signals per channel (only on breakout)
- **Scalper Indicator**: 5-15+ signals per channel (every touch of entry zones)
- **Trade Style**: Mean reversion vs trend following
- **Hold Time**: Seconds to minutes vs minutes to hours
- **Best Markets**: Ranging/choppy conditions vs trending breakouts
This makes the indicator ideal for active day traders who want continuous alert opportunities within consolidation zones rather than waiting for breakout confirmation. However, increased signal frequency also means higher potential commission costs and requires disciplined trade selection when acting on alerts.
## TECHNICAL METHODOLOGY:
### Price Normalization Process:
The indicator normalizes price data to create consistent volatility measurements across different instruments and price levels. It calculates the highest high and lowest low over a user-defined lookback period (default 100 bars). Current close price is normalized using: (close - lowest_low) / (highest_high - lowest_low), producing values between 0 and 1 for standardized volatility analysis.
### Volatility Detection:
A 14-period standard deviation is applied to the normalized price series to measure price deviation from the mean. Higher standard deviation values indicate volatility expansion; lower values indicate consolidation. The indicator uses ta.highestbars() and ta.lowestbars() to identify when volatility peaks and troughs occur over the detection period (default 14 bars).
### Channel Formation Logic:
When volatility crosses from a high level to a low level (ta.crossover(upper, lower)), a consolidation phase begins. The indicator tracks the highest and lowest prices during this period, which become the channel boundaries. Minimum duration of 10+ bars is required to filter out brief volatility spikes. Channels are rendered as box objects with defined upper and lower boundaries, with colored zones indicating entry areas.
### Entry Signal Generation:
The indicator uses immediate touch-based entry logic. Entry zones are defined as a percentage from channel edges (default 20%):
- **Long Entry Zone**: Bottom 20% of channel (bottomBound + channelRange × 0.2)
- **Short Entry Zone**: Top 20% of channel (topBound - channelRange × 0.2)
Long signals trigger when candle low touches or enters the long entry zone. Short signals trigger when candle high touches or enters the short entry zone. Visual markers (arrows and labels) appear on chart, and configured alerts fire immediately.
### Cooldown Filter:
An optional cooldown period (measured in bars) prevents alert spam by enforcing minimum spacing between consecutive signals. If cooldown is set to 3 bars, no new long alert will fire until 3 bars after the previous long signal. Long and short cooldowns are tracked independently, allowing both directions to signal within the same period.
### ATR Volatility Filter:
The indicator includes a multi-timeframe ATR filter to avoid alerts during low-volatility conditions. Using request.security(), it fetches ATR values from a specified timeframe (e.g., 1-minute ATR while viewing 5-minute charts). The filter compares current ATR to a user-defined minimum threshold:
- If ATR ≥ threshold: Alerts enabled
- If ATR < threshold: No alerts fire
This prevents notifications during dead zones where mean reversion is unreliable due to insufficient price movement. The ATR status is displayed in the info table with visual confirmation (✓ or ✗).
### Take Profit Calculation:
Two TP methods are available:
**Fixed Points Mode**:
- Long TP = Entry + (TP_Ticks × syminfo.mintick)
- Short TP = Entry - (TP_Ticks × syminfo.mintick)
**Channel Percentage Mode**:
- Long TP = Entry + (ChannelRange × TP_Percent)
- Short TP = Entry - (ChannelRange × TP_Percent)
Default 50% targets the channel midline, a natural mean reversion target. These levels are displayed as visual lines with labels and included in alert messages for reference when manually placing orders.
### Stop Loss Placement:
Stop losses are calculated just outside the channel boundary by a user-defined tick offset:
- Long SL = ChannelBottom - (SL_Offset_Ticks × syminfo.mintick)
- Short SL = ChannelTop + (SL_Offset_Ticks × syminfo.mintick)
This logic assumes channel breaks invalidate the mean reversion thesis. SL levels are displayed on chart and included in alert notifications as suggested stop placement.
### Channel Breakout Management:
Channels are removed when price closes more than 10 ticks outside boundaries. This tolerance prevents premature channel deletion from minor breaks or wicks, allowing the mean reversion setup to persist through small boundary violations.
## INPUT PARAMETERS:
### Channel Settings:
- **Nested Channels**: Allow multiple overlapping channels vs single channel
- **Normalization Length**: Lookback for high/low calculation (1-500, default 100)
- **Box Detection Length**: Period for volatility detection (1-100, default 14)
### Scalping Settings:
- **Enable Long Scalps**: Toggle long alert generation on/off
- **Enable Short Scalps**: Toggle short alert generation on/off
- **Entry Zone % from Edge**: Size of entry zone (5-50%, default 20%)
- **SL Offset (Ticks)**: Distance beyond channel for stop (1+, default 5)
- **Cooldown Period (Bars)**: Minimum spacing between alerts (0 = no cooldown)
### ATR Filter:
- **Enable ATR Filter**: Toggle volatility filter on/off
- **ATR Timeframe**: Source timeframe for ATR (1, 5, 15, 60 min, etc.)
- **ATR Length**: Smoothing period (1-100, default 14)
- **Min ATR Value**: Threshold for alert enablement (0.1+, default 10.0)
### Take Profit Settings:
- **TP Method**: Choose Fixed Points or % of Channel
- **TP Fixed (Ticks)**: Static distance in ticks (1+, default 30)
- **TP % of Channel**: Dynamic target as channel percentage (10-100%, default 50%)
### Appearance:
- **Show Entry Zones**: Toggle zone labels on channels
- **Show Info Table**: Display real-time indicator status
- **Table Position**: Corner placement (Top Left/Right, Bottom Left/Right)
- **Long Color**: Customize long signal color (default: darker green for readability)
- **Short Color**: Customize short signal color (default: red)
- **TP/SL Colors**: Customize take profit and stop loss line colors
- **Line Length**: Visual length of TP/SL reference lines (5-200 bars)
## VISUAL INDICATORS:
- **Channel boxes** with semi-transparent fill showing consolidation zones
- **Colored entry zones** labeled "LONG ZONE ▲" and "SHORT ZONE ▼"
- **Entry signal arrows** below/above bars marking long/short alerts
- **TP/SL reference lines** with emoji labels (⊕ Entry, 🎯 TP, 🛑 SL)
- **Info table** showing channel status, last signal, entry/TP/SL prices, risk/reward ratio, and ATR filter status
- **Visual confirmation** when alerts fire via on-chart markers synchronized with notifications
## HOW TO USE:
### For 1-3 Minute Scalping with Alerts (NQ/ES):
- ATR Timeframe: "1" (1-minute)
- ATR Min Value: 10.0 (for NQ), adjust per instrument
- Entry Zone %: 20-25%
- TP Method: Fixed Points, 20-40 ticks
- SL Offset: 5-10 ticks
- Cooldown: 2-3 bars to reduce alert spam
- **Alert Setup**: Configure "Any Entry Signal" for combined long/short notifications
- **Execution**: When alert fires, verify chart visuals, then manually place limit order at entry zone with provided TP/SL levels
### For 5-15 Minute Day Trading with Alerts:
- ATR Timeframe: "5" or match chart
- ATR Min Value: Adjust to instrument (test 8-15 for NQ)
- Entry Zone %: 20-30%
- TP Method: % of Channel, 40-60%
- SL Offset: 5-10 ticks
- Cooldown: 3-5 bars
- **Alert Setup**: Configure separate "Long Scalp Entry" and "Short Scalp Entry" alerts if you trade directionally based on bias
- **Execution**: Review channel structure on alert, confirm ATR filter shows ✓, then enter manually
### For 30-60 Minute Swing Scalping with Alerts:
- ATR Timeframe: "15" or "30"
- ATR Min Value: Lower threshold for broader market
- Entry Zone %: 25-35%
- TP Method: % of Channel, 50-70%
- SL Offset: 10-15 ticks
- Cooldown: 5+ bars or disable
- **Alert Setup**: Use "New Channel Formation" to prepare for setups, then "Any Entry Signal" for execution alerts
- **Execution**: Larger timeframes allow more analysis time between alert and entry
### Webhook Integration for Semi-Automation:
- Configure alert webhook URL to connect with platforms like TradersPost, TradingView Paper Trading, or custom automation
- Alert message includes all necessary order parameters (direction, entry, TP, SL)
- Webhook receives structured data when signal fires
- External platform can auto-execute based on alert payload
- Still maintains manual oversight vs full strategy automation
## USAGE CONSIDERATIONS:
- **Manual Discipline Required**: Alerts provide opportunities but execution requires judgment. Not all alerts should be taken - consider market context, trend, and channel quality
- **Alert Timing**: Alerts fire on bar close by default. Ensure "Once Per Bar Close" is selected to avoid false signals during bar formation
- **Notification Delivery**: Mobile/email alerts may have 1-3 second delay. For immediate execution, use desktop popups or webhook automation
- **Cooldown Necessity**: Without cooldown, rapidly touching price action can generate excessive alerts. Start with 3-bar cooldown and adjust based on alert volume
- **ATR Filter Impact**: Enabling ATR filter dramatically reduces alert count but improves quality. Track filter status in info table to understand when you're receiving fewer alerts
- **Commission Awareness**: High alert frequency means high potential trade count. Calculate if your commission structure supports frequent scalping before acting on all alerts
## COMPATIBLE MARKETS:
Works on any instrument with price data including stock indices (NQ, ES, YM, RTY), individual stocks, forex pairs (EUR/USD, GBP/USD), cryptocurrency (BTC, ETH), and commodities. Volume-based features are not included in this indicator version. Multi-timeframe ATR requires higher-tier TradingView subscription for request.security() functionality on timeframes below chart timeframe.
## KNOWN LIMITATIONS:
- **Indicator does not execute trades** - alerts are informational only; you must manually place all orders
- **Alert delivery depends on TradingView infrastructure** - delays or failures possible during platform issues
- **No position tracking** - indicator doesn't know if you're in a trade; you must manage open positions independently
- **TP/SL levels are reference only** - you must manually set these on your broker platform; they are not live orders
- **Immediate touch entry can generate many alerts** in choppy zones without adequate cooldown
- **Channel deletion at 10-tick breaks** may be too aggressive or lenient depending on instrument tick size
- **ATR filter from lower timeframes** requires TradingView Premium/Pro+ for request.security()
- **Mean reversion logic fails** in strong breakout scenarios - alerts will fire but trades may hit stops
- **No partial closing capability** - full position management is manual; you determine scaling out
- **Alerts do not account for gaps** or overnight price changes; morning alerts may be stale
## RISK DISCLOSURE:
Trading involves substantial risk of loss. This indicator provides signals for educational and informational purposes only and does not constitute financial advice. Past performance does not guarantee future results. Mean reversion strategies can experience extended drawdowns during trending markets. Alerts are not guaranteed to be profitable and should be combined with your own analysis. Stop losses may not fill at intended levels during extreme volatility or gaps. Never trade with capital you cannot afford to lose. Consider consulting a licensed financial advisor before making trading decisions. Always verify alerts against current market conditions before executing trades manually.
## ACKNOWLEDGMENT & CREDITS:
This indicator is built upon the channel detection methodology created by **AlgoAlpha** in the "Smart Money Breakout Channels" indicator. Full credit and appreciation to AlgoAlpha for pioneering the normalized volatility approach to identifying consolidation patterns. The core channel formation logic using normalized price standard deviation is AlgoAlpha's original contribution to the TradingView community.
Enhancements to the original concept include: mean reversion entry logic (vs breakout), immediate touch-based alert generation, comprehensive alert condition system with customizable notifications, multi-timeframe ATR volatility filtering, cooldown period for alert management, dual TP methods (fixed points vs channel percentage), visual TP/SL reference lines, and real-time status monitoring table. This indicator version is specifically designed for manual traders who prefer alert-based decision making over automated execution.

RSI ADX Bollinger Analysis High-level purpose and design philosophy
This indicator — RSI-ADX-Bollinger Analysis — is a compact, educational market-analysis toolkit that blends momentum (RSI), trend strength (ADX), volatility structure (Bollinger Bands) and simple volumetrics to provide traders a snapshot of market condition and trade idea quality. The design philosophy is explicit and layered: use each component to answer a different question about price action (momentum, conviction, volatility, participation), then combine answers to form a more robust, explainable signal. The mashup is intended for analysis and learning, not automatic execution: it surfaces the why behind signals so traders can test, learn and apply rules with risk management.
________________________________________
What each indicator contributes (component-by-component)
RSI (Relative Strength Index) — role and behavior: RSI measures short-term momentum by comparing recent gains to recent losses. A high RSI (near or above the overbought threshold) indicates strong recent buying pressure and potential exhaustion if price is extended. A low RSI (near or below the oversold threshold) indicates strong recent selling pressure and potential exhaustion or a value area for mean-reversion. In this dashboard RSI is used as the primary momentum trigger: it helps identify whether price is locally over-extended on the buy or sell side.
ADX (Average Directional Index) — role and behavior: ADX measures trend strength independently of direction. When ADX rises above a chosen threshold (e.g., 25), it signals that the market is trending with conviction; ADX below the threshold suggests range or weak trend. Because patterns and momentum signals perform differently in trending vs. ranging markets, ADX is used here as a filter: only when ADX indicates sufficient directional strength does the system treat RSI+BB breakouts as meaningful trade candidates.
Bollinger Bands — role and behavior: Bollinger Bands (20-period basis ± N standard deviations) show volatility envelope and relative price position vs. a volatility-adjusted mean. Price outside the upper band suggests pronounced extension relative to recent volatility; price outside the lower band suggests extended weakness. A band expansion (increasing width) signals volatility breakout potential; contraction signals range-bound conditions and potential squeeze. In this dashboard, Bollinger Bands provide the volatility/structural context: RSI extremes plus price beyond the band imply a stronger, volatility-backed move.
Volume split & basic MA trend — role and behavior: Buy-like and sell-like volume (simple heuristic using close>open or closeopen) or sell-like (close1.2 for validation and compare win rate and expectancy.
4. TF alignment: Accept signals only when higher timeframe (e.g., 4h) trend agrees — compare results.
5. Parameter sensitivity: Vary RSI threshold (70/30 vs 80/20), Bollinger stddev (2 vs 2.5), and ADX threshold (25 vs 30) and measure stability of results.
These exercises teach both statistical thinking and the specific failure modes of the mashup.
________________________________________
Limitations, failure modes and caveats (explicit & teachable)
• ADX and Bollinger measures lag during fast-moving news events — signals can be late or wrong during earnings, macro shocks, or illiquid sessions.
• Volume classification by open/close is a heuristic; it does not equal TAPEDATA, footprint or signed volume. Use it as supportive evidence, not definitive proof.
• RSI can remain overbought or oversold for extended stretches in persistent trends — relying solely on RSI extremes without ADX or BB context invites large drawdowns.
• Small-cap or low-liquidity instruments yield noisy band behavior and unreliable volume ratios.
Being explicit about these limitations is a strong point in a TradingView description — it demonstrates transparency and educational intent.
________________________________________
Originality & mashup justification (text you can paste)
This script intentionally combines classical momentum (RSI), volatility envelope (Bollinger Bands) and trend-strength (ADX) because each indicator answers a different and complementary question: RSI answers is price locally extreme?, Bollinger answers is price outside normal volatility?, and ADX answers is the market moving with conviction?. Volume participation then acts as a practical check for real market involvement. This combination is not a simple “indicator mashup”; it is a designed ensemble where each element reduces the others’ failure modes and together produce a teachable, testable signal framework. The script’s purpose is educational and analytical — to show traders how to interpret the interplay of momentum, volatility, and trend strength.
________________________________________
TradingView publication guidance & compliance checklist
To satisfy TradingView rules about mashups and descriptions, include the following items in your script description (without exposing source code):
1. Purpose statement: One or two lines describing the script’s objective (educational multi-indicator market overview and idea filter).
2. Component list: Name the major modules (RSI, Bollinger Bands, ADX, volume heuristic, SMA trend checks, signal tracking) and one-sentence reason for each.
3. How they interact: A succinct non-code explanation: “RSI finds momentum extremes; Bollinger confirms volatility expansion; ADX confirms trend strength; all three must align for a BUY/SELL.”
4. Inputs: List adjustable inputs (RSI length and thresholds, BB length & stddev, ADX threshold & smoothing, volume MA, table position/size).
5. Usage instructions: Short workflow (check TF alignment → confirm participation → define stop & R:R → backtest).
6. Limitations & assumptions: Explicitly state volume is approximated, ADX has lag, and avoid promising guaranteed profits.
7. Non-promotional language: No external contact info, ads, claims of exclusivity or guaranteed outcomes.
8. Trademark clause: If you used trademark symbols, remove or provide registration proof.
9. Risk disclaimer: Add the copy-ready disclaimer below.
This matches TradingView’s request for meaningful descriptions that explain originality and inter-component reasoning.
________________________________________
Copy-ready short publication description (paste into TradingView)
Advanced RSI-ADX-Bollinger Market Overview — educational multi-indicator dashboard. This script combines RSI (momentum extremes), Bollinger Bands (volatility envelope and band expansion), ADX (trend strength), simple SMA trend bias and a basic buy/sell volume heuristic to surface high-quality idea candidates. Signals require alignment of momentum, volatility expansion and rising ADX; volume participation is displayed to support signal confidence. Inputs are configurable (RSI length/levels, BB length/stddev, ADX length/threshold, volume MA, display options). This tool is intended for analysis and learning — not for automated execution. Users should back test and apply robust risk management. Limitations: volume classification here is a heuristic (close>open), ADX and BB measures lag in fast news events, and results vary by instrument liquidity.
________________________________________
Copy-ready risk & misuse disclaimer (paste into description or help file)
This script is provided for educational and analytical purposes only and does not constitute financial or investment advice. It does not guarantee profits. Indicators are heuristics and may give false or late signals; always back test and paper-trade before using real capital. The author is not responsible for trading losses resulting from the use or misuse of this indicator. Use proper position sizing and risk controls.
________________________________________
Risk Disclaimer: This tool is provided for education and analysis only. It is not financial advice and does not guarantee returns. Users assume all risk for trades made based on this script. Back test thoroughly and use proper risk management.

Smart Breadth [smartcanvas]Overview
This indicator is a market breadth analysis tool focused on the S&P 500 index. It visualizes the percentage of S&P 500 constituents trading above their 50-day and 200-day moving averages, integrates the McClellan Oscillator for advance-decline analysis, and detects various breadth-based signals such as thrusts, divergences, and trend changes. The indicator is displayed in a separate pane and provides visual cues, a summary label with tooltip, and alert conditions to highlight potential market conditions.
The tool uses data symbols like S5FI (percentage above 50-day MA), S5TH (percentage above 200-day MA), ADVN/DECN (S&P advances/declines), and optionally NYSE advances/declines for certain calculations. If primary data is unavailable, it falls back to calculated breadth from advance-decline ratios.
This indicator is intended for educational and analytical purposes to help users observe market internals. My intention was to pack in one indicator things you will only find in a few. It does not provide trading signals as financial advice, and users are encouraged to use it in conjunction with their own research and risk management strategies. No performance guarantees are implied, and historical patterns may not predict future market behavior.
Key Components and Visuals
Plotted Lines:
Aqua line: Percentage of S&P 500 stocks above their 50-day MA.
Purple line: Percentage of S&P 500 stocks above their 200-day MA.
Optional orange line (enabled via "Show Momentum Line"): 10-day momentum of the 50-day MA breadth, shifted by +50 for scaling.
Optional line plot (enabled via "Show McClellan Oscillator"): McClellan Oscillator, colored green when positive and red when negative. Can use actual scale or normalized to fit breadth percentages (0-100).
Horizontal Levels:
Dotted green at 70%: "Strong" level.
Dashed green at user-defined green threshold (default 60%): "Buy Zone".
Dashed yellow at user-defined yellow threshold (default 50%): "Neutral".
Dotted red at 30%: "Oversold" level.
Optional dotted lines for McClellan (when shown and not using actual scale): Overbought (red), Oversold (green), and Zero (gray), scaled to fit.
Background Coloring:
Green shades for bullish/strong bullish states.
Yellow for neutral.
Orange for caution.
Red for bearish.
Signal Shapes:
Rocket emoji (🚀) at bottom for Zweig Breadth Thrust trigger.
Green circle at bottom for recovery signal.
Red triangle down at top for negative divergence warning.
Green triangle up at bottom for positive divergence.
Light green triangle up at bottom for McClellan oversold bounce.
Green diamond at bottom for capitulation signal.
Summary Label (Right Side):
Displays current action (e.g., "BUY", "HOLD") with emoji, breadth percentages with colored circles, McClellan value with emoji, market state, risk/reward stars, and active signals.
Hover tooltip provides detailed breakdown: action priority, breadth metrics, McClellan status, momentum/trend, market state, active signals, data quality, thresholds, recent changes, and a general recommendation category.
Calculations and Logic
Breadth Percentages: Derived from S5FI/S5TH or calculated from advances/(advances + declines) * 100, with fallback adjustments.
McClellan Oscillator: Difference between fast (default 19) and slow (default 39) EMAs of net advances (advances - declines).
Momentum: 10-day change in 50-day MA breadth percentage.
Trend Analysis: Counts consecutive rising days in breadth to detect upward trends.
Breadth Thrust (Zweig): 10-day EMA of advances/total issues crossing from below a bottom level (default 40) to above a top level (default 61.5). Can use S&P or NYSE data.
Divergences: Compares S&P 500 price highs/lows with breadth or McClellan over a lookback period (default 20) to detect positive (bullish) or negative (bearish) divergences.
Market States: Determined by breadth levels relative to thresholds, trend direction, and McClellan conditions (e.g., strong bullish if above green threshold, rising, and McClellan supportive).
Actions: Prioritized logic (0-10) selects an action like "BUY" or "AVOID LONGS" based on signals, states, and conditions. Higher priority (e.g., capitulation at 10) overrides lower ones.
Alerts: Triggered on new occurrences of key conditions, such as breadth thrust, divergences, state changes, etc.
Input Parameters
The indicator offers customization through grouped inputs, but the use of defaults is encouraged.
Usage Notes
Add the indicator to a chart of any symbol (though designed around S&P 500 data; works best on daily or higher timeframes). Monitor the label and tooltip for a consolidated view of conditions. Set up alerts for specific events.
This script relies on external security requests, which may have data availability issues on certain exchanges or timeframes. The fallback mechanism ensures continuity but may differ slightly from primary sources.
Disclaimer
This indicator is provided for informational and educational purposes only. It does not constitute investment advice, financial recommendations, or an endorsement of any trading strategy. Market conditions can change rapidly, and users should not rely solely on this tool for decision-making. Always perform your own due diligence, consult with qualified professionals if needed, and be aware of the risks involved in trading. The author and TradingView are not responsible for any losses incurred from using this script.

BTC(Sats Stacking) - CDC Action zone filterType: Indicator (Pine v6) • Category: Strategy Tools / DCA • Overlay: Yes
Overview
This indicator simulates fixed-amount Bitcoin DCA (dollar-cost averaging) and lets you apply a CDC Action Zone filter to only buy in specific market conditions. It plots EMA(12/26) lines with a shaded zone (green when fast > slow, red when slow > fast), shows buy markers on the chart when a DCA event actually executes, and displays a concise performance table.
The simulation tracks real invested capital (sum of your buys), not hypothetical equity injections, and reports PnL vs invested capital.
Key features
DCA frequency: Everyday, Every week, or Every month
CDC filter: Buy on all days, only when CDC is Green (trend-up above fast EMA), or only when Red (trend-down below fast EMA)
Execution price: Choose to buy at bar close or next bar open
Capital controls: Fixed DCA amount per event, optional max budget cap
Currency support: Portfolio currency label plus optional FX conversion (by symbol or manual rate)
Chart visuals: Buy markers on candles; EMA(12/26) lines with shaded “action zone”
Metrics table: Invested capital, buys executed, BTC accumulated, average price per BTC (quote), equity (portfolio), PnL% vs invested, and CAGR
How it works
CDC state:
Green = EMA(fast) > EMA(slow) and price ≥ EMA(fast)
Red = EMA(fast) < EMA(slow) and price < EMA(fast)
DCA trigger: Fires on new day/week/month boundaries (timeframe-agnostic).
Buy execution: When a DCA event occurs and passes the CDC filter and budget check, the script spends the fixed amount and adds the corresponding BTC at the chosen execution price.
Inputs (highlights)
Simulation
Symbol (blank = current chart), Buy at close/open, DCA amount, Max total invested
DCA Schedule
Everyday / Every week / Every month
CDC Action Zone
Filter mode (All / Green only / Red only), Price source, Fast/Slow EMA lengths (defaults 12/26)
Currency / Conversion
Portfolio currency label, Convert on/off, By symbol (e.g., OANDA:USDTHB) or Manual rate
Backtest Range
Optional start/end dates
Style
Show EMA lines and zone, colors and opacities, buy marker size and color
Display
Show qty/price labels on buys, show metrics table, number formatting
Metrics
Invested capital: Sum of all DCA spends in your portfolio currency
Equity (portfolio): BTC holdings marked to market and converted back if FX is enabled
PnL % vs invested: (Equity / Invested - 1) × 100
CAGR: Based on elapsed time from first in-range bar to the latest bar
Average price per BTC (quote): Spend in quote currency divided by BTC accumulated
Notes
This is an indicator, not a broker-connected strategy. It simulates buys and displays results without placing orders.
For more realistic fills, use Buy at next bar open.
If your portfolio currency differs from the symbol’s quote currency, enable Convert and supply a conversion symbol or manual rate.
EMA shading is purely visual; the filter logic uses the same EMA definitions.
Attribution & License
Inspired by the DCA idea and community simulations; CDC filtering implemented with standard EMA(12/26) logic.
License: MPL-2.0 (see code header).
Author: MiSuNoJo
Disclaimer
This tool is for research and education only and is not financial advice. Past performance does not guarantee future results. Use at your own risk.

HorizonSigma Pro [CHE]HorizonSigma Pro
Disclaimer
Not every timeframe will yield good results . Very short charts are dominated by microstructure noise, spreads, and slippage; signals can flip and the tradable edge shrinks after costs. Very high timeframes adapt more slowly, provide fewer samples, and can lag regime shifts. When you change timeframe, you also change the ratios between horizon, lookbacks, and correlation windows—what works on M5 won’t automatically hold on H1 or D1. Liquidity, session effects (overnight gaps, news bursts), and volatility do not scale linearly with time. Always validate per symbol and timeframe, then retune horizon, z-length, correlation window, and either the neutral band or the z-threshold. On fast charts, “components” mode adapts quicker; on slower charts, “super” reduces noise. Keep prior-shift and calibration enabled, monitor Hit Rate with its confidence interval and the Brier score, and execute only on confirmed (closed-bar) values.
For example, what do “UP 61%” and “DOWN 21%” mean?
“UP 61%” is the model’s estimated probability that the close will be higher after your selected horizon—directional probability, not a price target or profit guarantee. “DOWN 21%” still reports the probability of up; here it’s 21%, which implies 79% for down (a short bias). The label switches to “DOWN” because the probability falls below your short threshold. With a neutral-band policy, for example ±7%, signals are: Long above 57%, Short below 43%, Neutral in between. In z-score mode, fixed z-cutoffs drive the call instead of percentages. The arrow length on the chart is an ATR-scaled projection to visualize reach; treat it as guidance, not a promise.
Part 1 — Scientific description
Objective.
The indicator estimates the probability that price will be higher after a user-defined horizon (a chosen number of bars) and emits long, short, or neutral decisions under explicit thresholds. It combines multi‑feature, z‑normalized inputs, adaptive correlation‑based weighting, a prior‑shifted sigmoid mapping, optional rolling probability calibration, and repaint‑safe confirmation. It also visualizes an ATR‑scaled forward projection and prints a compact statistics panel.
Data and labeling.
For each bar, the target label is whether price increased over the past chosen horizon. Learning is deliberately backward‑looking to avoid look‑ahead: features are associated with outcomes that are only known after that horizon has elapsed.
Feature engineering.
The feature set includes momentum, RSI, stochastic %K, MACD histogram slope, a normalized EMA(20/50) trend spread, ATR as a share of price, Bollinger Band width, and volume normalized by its moving average. All features are standardized over rolling windows. A compressed “super‑feature” is available that aggregates core trend and momentum components while penalizing excessive width (volatility). Users can switch between a “components” mode (weighted sum of individual features) and a “super” mode (single compressed driver).
Weighting and learning.
Weights are the rolling correlations between features (evaluated one horizon ago) and realized directional outcomes, smoothed by an EMA and optionally clamped to a bounded range to stabilize outliers. This produces an adaptive, regime‑aware weighting without explicit machine‑learning libraries.
Scoring and probability mapping.
The raw score is either the weighted component sum or the weighted super‑feature. The score is standardized again and passed through a sigmoid whose steepness is user‑controlled. A “prior shift” moves the sigmoid’s midpoint to the current base rate of up moves, estimated over the evaluation window, so that probabilities remain well‑calibrated when markets drift bullish or bearish. Probabilities and standardized scores are EMA‑smoothed for stability.
Decision policy.
Two modes are supported:
- Neutral band: go long if the probability is above one half plus a user‑set band; go short if it is below one half minus that band; otherwise stay neutral.
- Z‑score thresholds: use symmetric positive/negative cutoffs on the standardized score to trigger long/short.
Repaint protection.
All values used for decisions can be locked to confirmed (closed) bars. Intrabar updates are available as a preview, but confirmed values drive evaluation and stats.
Calibration.
An optional rolling linear calibration maps past confirmed probabilities to realized outcomes over the evaluation window. The mapping is clipped to the unit interval and can be injected back into the decision logic if desired. This improves reliability (probabilities that “mean what they say”) without necessarily improving raw separability.
Evaluation metrics.
The table reports: hit rate on signaled bars; a Wilson confidence interval for that hit rate at a chosen confidence level; Brier score as a measure of probability accuracy; counts of long/short trades; average realized return by side; profit factor; net return; and exposure (signal density). All are computed on rolling windows consistent with the learning scheme.
Visualization.
On the chart, an arrowed projection shows the predicted direction from the current bar to the chosen horizon, with magnitude scaled by ATR (optionally scaled by the square‑root of the horizon). Labels display either the decision probability or the standardized score. Neutral states can display a configurable icon for immediate recognition.
Computational properties.
The design relies on rolling means, standard deviations, correlations, and EMAs. Per‑bar cost is constant with respect to history length, and memory is constant per tracked series. Graphical objects are updated in place to obey platform limits.
Assumptions and limitations.
The method is correlation‑based and will adapt after regime changes, not before them. Calibration improves probability reliability but not necessarily ranking power. Intrabar previews are non‑binding and should not be evaluated as historical performance.
Part 2 — Trader‑facing description
What it does.
This tool tells you how likely price is to be higher after your chosen number of bars and converts that into Long / Short / Neutral calls. It learns, in real time, which components—momentum, trend, volatility, breadth, and volume—matter now, adjusts their weights, and shows you a probability line plus a forward arrow scaled by volatility.
How to set it up.
1) Choose your horizon. Intraday scalps: 5–10 bars. Swings: 10–30 bars. The default of 14 bars is a balanced starting point.
2) Pick a feature mode.
- components: granular and fast to adapt when leadership rotates between signals.
- super: cleaner single driver; less noise, slightly slower to react.
3) Decide how signals are triggered.
- Neutral band (probability based): intuitive and easy to tune. Widen the band for fewer, higher‑quality trades; tighten to catch more moves.
- Z‑score thresholds: consistent numeric cutoffs that ignore base‑rate drift.
4) Keep reliability helpers on. Leave prior shift and calibration enabled to stabilize probabilities across bullish/bearish regimes.
5) Smoothing. A short EMA on the probability or score reduces whipsaws while preserving turns.
6) Overlay. The arrow shows the call and a volatility‑scaled reach for the next horizon. Treat it as guidance, not a promise.
Reading the stats table.
- Hit Rate with a confidence interval: your recent accuracy with an uncertainty range; trust the range, not only the point.
- Brier Score: lower is better; it checks whether a stated “70%” really behaves like 70% over time.
- Profit Factor, Net Return, Exposure: quick triage of tradability and signal density.
- Average Return by Side: sanity‑check that the long and short calls each pull their weight.
Typical adjustments.
- Too many trades? Increase the neutral band or raise the z‑threshold.
- Missing the move? Tighten the band, or switch to components mode to react faster.
- Choppy timeframe? Lengthen the z‑score and correlation windows; keep calibration on.
- Volatility regime change? Revisit the ATR multiplier and enable square‑root scaling of horizon.
Execution and risk.
- Size positions by volatility (ATR‑based sizing works well).
- Enter on confirmed values; use intrabar previews only as early signals.
- Combine with your market structure (levels, liquidity zones). This model is statistical, not clairvoyant.
What it is not.
Not a black‑box machine‑learning model. It is transparent, correlation‑weighted technical analysis with strong attention to probability reliability and repaint safety.
Suggested defaults (robust starting point).
- Horizon 14; components mode; weight EMA 10; correlation window 500; z‑length 200.
- Neutral band around seven percentage points, or z‑threshold around one‑third of a standard deviation.
- Prior shift ON, Calibration ON, Use calibrated for decisions OFF to start.
- ATR multiplier 1.0; square‑root horizon scaling ON; EMA smoothing 3.
- Confidence setting equivalent to about 95%.
Disclaimer
No indicator guarantees profits. HorizonSigma Pro is a decision aid; always combine with solid risk management and your own judgment. Backtest, forward test, and size responsibly.
The content provided, including all code and materials, is strictly for educational and informational purposes only. It is not intended as, and should not be interpreted as, financial advice, a recommendation to buy or sell any financial instrument, or an offer of any financial product or service. All strategies, tools, and examples discussed are provided for illustrative purposes to demonstrate coding techniques and the functionality of Pine Script within a trading context.
Any results from strategies or tools provided are hypothetical, and past performance is not indicative of future results. Trading and investing involve high risk, including the potential loss of principal, and may not be suitable for all individuals. Before making any trading decisions, please consult with a qualified financial professional to understand the risks involved.
By using this script, you acknowledge and agree that any trading decisions are made solely at your discretion and risk.
Enhance your trading precision and confidence 🚀
Best regards
Chervolino

VWAP Executor — v6 (VWAP fix)tarek helishPractical scalping plan with high-rate (sometimes reaching 70–85% in a quiet market)
Concept: “VWAP bounce with a clear trend.”
Tools: 1–3-minute chart for entry, 5-minute trend filter, VWAP, EMA(50) on 5M, ATR(14) on 1M, volume.
When to trade: London session or early New York session; avoid 10–15 minutes before/after high-impact news.
Entry rules (buy for example):
Trend: Price is above the EMA(50) on 5M and has an upward trend.
Entry zone: First bounce to VWAP (or a ±1 standard deviation channel around it).
Signal: Bullish rejection/engulfing candle on 1M with increasing volume, and RSI(2) has exited oversold territory (optional).
Order: Entry after the confirmation candle closes or a limit close to VWAP.
Trade Management:
Stop: Below the bounce low or 0.6xATR(1M) (strongest).
Target: 0.4–0.7xATR(1M) or the previous micro-high (small return to increase success rate).
Trigger: Move the stop to breakeven after +0.25R; close manually if the 1M candle closes strongly against you.
Filter: Do not trade if the spread widens, or the price "saws" around VWAP without a trend.
Sell against the rules in a downtrend.
Why this plan raises the heat-rate? You buy a "small discount" within an existing trend and near the institutional average price (VWAP), with a small target price.
مواقعي شركة الماسة للخدمات المنزلية
شركة تنظيف بالرياض
نقل عفش بالرياض

Close Above/Below Prev 2 Candle Strategy (Any Timeframe)Title: Close Above/Below Previous 2 Candle Strategy (Any Timeframe)
Description:
This strategy identifies potential breakout and trend continuation signals by analyzing the closing price relative to the highs and lows of the previous two candles. It works on any chart timeframe, making it versatile for intraday, swing, and daily trading.
How it works:
Long Entry (Bullish Signal): Triggered when the current candle closes above the highs of the previous two candles.
Short Entry (Bearish Signal): Triggered when the current candle closes below the lows of the previous two candles.
Visual Indicators:
Green triangles above the bar indicate bullish signals.
Red triangles below the bar indicate bearish signals.
Strategy Features:
Works on any timeframe, from 1-minute charts to daily/weekly charts.
Configurable risk/reward ratio for automatic stop-loss and take-profit levels.
Alerts trigger immediately when the condition is met, helping traders react to potential breakouts.
Provides clean visual signals for easy chart reading and decision-making.
Benefits:
Reduces noise by focusing on candle close confirmations.
Versatile and suitable for intraday, swing, and long-term trading.
Easy to combine with other indicators or strategies.

Changing of the GuardChanging of the Guard (COG) - Advanced Reversal Pattern Indicator
🎯 What It Does
The Changing of the Guard (COG) indicator identifies high-probability reversal setups by detecting specific candlestick patterns that occur at key institutional levels. This indicator combines traditional price action analysis with volume-weighted and moving average confluence to filter out noise and focus on the most reliable trading opportunities.
🔧 Key Features
Multi-Timeframe VWAP Analysis
• Daily VWAP (Gray circles) - Intraday institutional reference
• Weekly VWAP (Yellow circles) - Short-term institutional bias
• Monthly VWAP (Orange circles) - Long-term institutional sentiment
Triple EMA System
• EMA 20 (Blue) - Short-term trend direction
• EMA 50 (Purple) - Medium-term momentum
• EMA 200 (Navy) - Long-term market structure
Adaptive COG Pattern Detection
• 2-Bar Mode: Quick reversal signals for scalping
• 3-Bar Mode: Balanced approach for swing trading (default)
• 4-Bar Mode: Conservative signals for position trading
📊 How It Works
The indicator identifies "changing of the guard" moments when:
1. Pattern Formation: 2-4 consecutive bars show exhaustion in one direction
2. Reversal Confirmation: A counter-trend bar appears with strong momentum
3. Confluence Trigger: The reversal bar crosses through a significant VWAP or EMA level
Bullish COG: Green triangle appears below bars when bearish exhaustion meets bullish reversal at key support
Bearish COG: Red triangle appears above bars when bullish exhaustion meets bearish reversal at key resistance
💡 Trading Applications
Swing Trading: Use 3-bar mode with EMA 50/200 confluence for multi-day holds
Day Trading: Use 2-bar mode with Daily VWAP confluence for intraday reversals
Position Trading: Use 4-bar mode with Monthly VWAP confluence for major trend changes
⚙️ Customization Options
• Toggle VWAP display on/off
• Toggle EMA display on/off
• Toggle COG signals on/off
• Select detection mode (2-bar, 3-bar, 4-bar)
• Built-in alert system for automated notifications
🎨 Visual Design
Clean, professional interface with:
• Subtle dotted lines for VWAPs to avoid chart clutter
• Color-coded EMAs for easy trend identification
• Clear triangle signals that don't obstruct price action
• Customizable display options for different trading styles
📈 Best Practices
• Combine with volume analysis for additional confirmation
• Use higher timeframe bias to filter trade direction
• Consider market structure and support/resistance levels
• Backtest different modes to find optimal settings for your strategy
⚠️ Risk Management
This indicator identifies potential reversal points but should be used with proper risk management. Always consider:
• Overall market trend and structure
• Volume confirmation
• Multiple timeframe analysis
• Appropriate position sizing
Perfect for traders who want to catch reversals at institutional levels with high-probability setups. The confluence requirement ensures you're trading with the smart money, not against it.
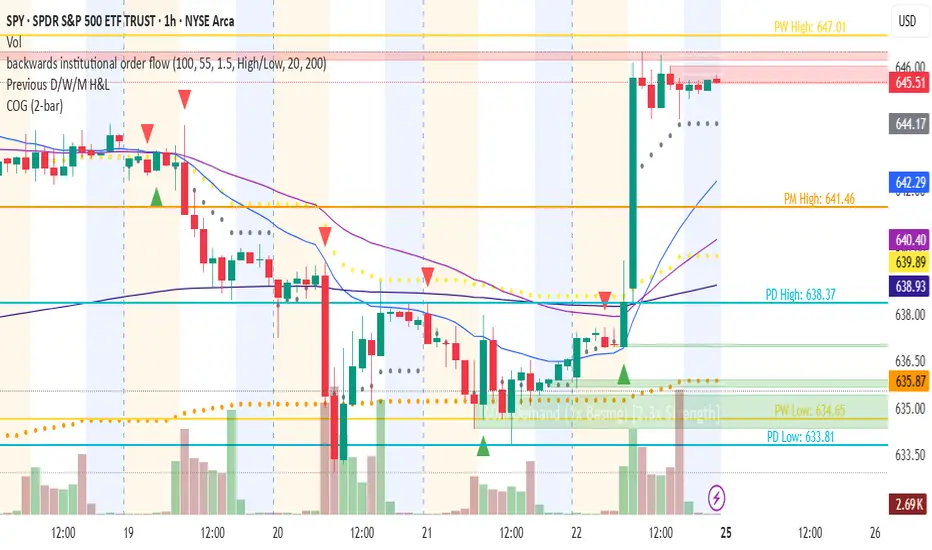
MultiFactor Power Indicator v4 (No-Repaint) 📊 Strategy: Trend + Momentum + Signal Confirmation
This setup uses 3 layers so signals are reliable:
1. Trend Filter: 200 EMA → only take trades in trend direction.
2. Momentum Trigger: RSI + MACD combo to confirm momentum.
3. Entry/Exit Signal: Arrow on chart (Buy/Sell) with alerts — non-repainting because it only confirms on candle close.

Indicador Millo SMA20-SMA200-AO-RSI M1This indicator is designed for scalping in 1-minute timeframes on crypto pairs, combining trend direction, momentum, and oscillator confirmation.
Logic:
Trend Filter:
Only BUY signals when price is above the SMA200.
Only SELL signals when price is below the SMA200.
Entry Trigger:
BUY: Price crosses above the SMA20.
SELL: Price crosses below the SMA20.
Confirmation Window:
After the price cross, the Awesome Oscillator (AO) must cross the zero line in the same direction within a maximum of N bars (configurable, default = 4).
RSI must be > 50 for BUY and < 50 for SELL at the moment AO confirms.
Cooldown:
A cooldown period (configurable, default = 10 bars) prevents multiple signals of the same type in a short time, reducing noise in sideways markets.
Features:
Works on any crypto pair and can be used in other markets.
Adjustable confirmation window, RSI threshold, and cooldown.
Alerts ready for BUY and SELL conditions.
Can be converted into a strategy for backtesting with TP/SL.
Suggested Use:
Pair: BTC/USDT M1 or similar high-liquidity asset.
Combine with manual support/resistance or higher timeframe trend analysis.
Recommended to confirm entries visually and with additional confluence before trading live.

Multi-Timeframe SFP + SMTImportant: Please Read First
This indicator is not a "one size fits all" solution. It is a professional and complex tool that requires you to learn how to use it, in addition to backtesting different settings to discover what works best for your specific trading style and the assets you trade. The default settings provided are my personal preferences for trading higher-timeframe setups, but you are encouraged to experiment and find your own optimal configuration.
Please note that while this initial version is solid, it may still contain small errors or bugs. I will be actively working on improving the indicator over time. Also, be aware that the script is not written for maximum efficiency and may be resource-intensive, but this should not pose a problem for most users.
The source code for this indicator is open. If you truly want to understand precisely how all the logic works, you can copy and paste the code into an AI assistant like Gemini or ChatGPT and ask it to explain any part of the script to you.
Author's Preferred Settings (Guideline)
As a starting point, here are the settings I personally use for my trading:
SFP Timeframe: 4-Hour (Strength: 5-5)
Max Lookback: 35 Bars
Raid Expiration: 1 Bar
SFP Lines Limit: 1
SMT Timeframe 1: 30-Minute (Strength: 2-2) with 3-Minute LTF Detection.
SMT Timeframe 2: 15-Minute (Strength: 3-3) with 3-Minute LTF Detection.
SMT Timeframe 3: 1-Hour (Strength: 1-1) with 3-Minute LTF Detection.
SMT Timeframe 4: 15-Minute (Strength: 1-1) with 3-Minute LTF Detection.
Multi-Timeframe SMT: An Overview
This indicator is a powerful tool designed to identify high-probability trading setups by combining two key institutional concepts: Swing Failure Patterns (SFP) on a higher timeframe and Smart Money Technique (SMT) divergences on a lower timeframe. A key feature is the ability to configure and run up to four independent SMT analyses simultaneously, allowing you to monitor for divergences across multiple timeframes (e.g., 15m, 1H, 4H) from a single indicator.
Its primary purpose is to generate automated signals through TradingView's alert system. By setting up alerts, the script runs server-side, monitoring the market for you. When a setup presents itself, it will send a push notification to your device, allowing you to personally evaluate the trade without being tied to your screen.
The Strategy: HTF Liquidity Sweeps into LTF SMT
The core strategy is built on a classic institutional trading model:
Wait for a liquidity sweep on a significant high timeframe (e.g., 4-hour, Daily).
Once liquidity is taken, look for a confirmation of a shift in market structure on a lower timeframe.
This indicator uses an SMT divergence as that confirmation signal, indicating that smart money may be stepping in to reverse the price.
How It Works: The Two-Step Process
The indicator's logic follows a precise two-step process to generate a signal:
Step 1: The Swing Failure Pattern (SFP)
First, the indicator identifies a high-timeframe liquidity sweep. This is configured in the "Swing Failure Pattern (SFP) Timeframe" settings.
It looks for a candle that wicks above a previous high (or below a previous low) but then closes back within the range of that pivot. This action is known as a "raid" or a "swing failure," suggesting the move failed to find genuine momentum.
Step 2: The SMT Divergence
The moment a valid SFP is confirmed, the indicator's multiple SMT engines activate.
Each engine begins monitoring the specific SMT timeframe you have configured (e.g., "SMT Timeframe 1," "SMT Timeframe 2," etc.) for a Smart Money Technique (SMT) divergence.
An SMT divergence occurs when two closely correlated assets fail to move in sync. For example, after a raid on a high, Asset A makes a new high, but Asset B fails to do so. This disagreement suggests weakness and a potential reversal.
When the script finds this divergence, it plots the SMT line and triggers an alert.
The Power of Alerts
The true strength of this indicator lies in its alert capabilities. You can create alerts for both unconfirmed and confirmed SMTs.
Enable Alerts LTF Detection: These alerts trigger when an unconfirmed, potential SMT is spotted on the lower "LTF Detection" timeframe. While not yet confirmed, these early alerts can notify you of a potential move before it fully happens, allowing you to be ahead of the curve and find the best possible trade entries.
Enable Alerts Confirmed SMT: These alerts trigger only when a permanent, confirmed SMT line is plotted on your chosen SMT timeframe. These signals are more reliable but occur later than the early detection alerts.
Key Concepts Explained
What is Pivot Strength?
Pivot Strength determines how significant a high or low needs to be to qualify as a valid structural point. A setting of 5-5, for example, means that for a candle's high to be considered a valid pivot high, its high must be higher than the highs of the 5 candles to its left and the 5 candles to its right.
Higher Strength (e.g., 5-5, 8-8): Creates fewer, but more significant, pivots. This is ideal for identifying major structural highs and lows on higher timeframes.
Lower Strength (e.g., 2-2, 3-3): Creates more pivots, making it suitable for identifying the smaller shifts in momentum on lower timeframes.
Raid Expiration & Validity
An SFP signal is not valid forever. The "Raid Expiration" setting determines how many SFP timeframe bars can pass after a raid before that signal is considered "stale" and can no longer be used to validate an SMT. This ensures your SMT divergences are always in response to recent liquidity sweeps.
Why You Must Be on the Right Chart Timeframe to See SMT Lines
Pine Script™ has a fundamental rule: an indicator running on a chart can only "see" the bars of that chart's timeframe or higher.
When the SMT logic is set to the 15-minute timeframe, it calculates its pivots based on 15-minute data. To accurately plot lines connecting these pivots, you must be on a 15-minute chart or lower (e.g., 5-minute, 1-minute).
If you are on a higher timeframe chart, like the 1-hour, the 15-minute bars do not exist on that chart, so the indicator has no bars to draw the lines on.
This is precisely why the alert system is so powerful. You can set your alert to run on the 15-minute timeframe, and TradingView's servers will monitor that timeframe for you, sending a notification regardless of what chart you are currently viewing.

LANZ Strategy 6.0 [Backtest]🔷 LANZ Strategy 6.0 — Precision Backtesting Based on 09:00 NY Candle, Dynamic SL/TP, and Lot Size per Trade
LANZ Strategy 6.0 is the simulation version of the original LANZ 6.0 indicator. It executes a single LIMIT BUY order per day based on the 09:00 a.m. New York candle, using dynamic Stop Loss and Take Profit levels derived from the candle range. Position sizing is calculated automatically using capital, risk percentage, and pip value — allowing accurate trade simulation and performance tracking.
📌 This is a strategy script — It simulates real trades using strategy.entry() and strategy.exit() with full money management for risk-based backtesting.
🧠 Core Logic & Trade Conditions
🔹 BUY Signal Trigger:
At 09:00 a.m. NY (New York time), if:
The current candle is bullish (close > open)
→ A BUY order is placed at the candle’s close price (EP)
Only one signal is evaluated per day.
⚙️ Stop Loss / Take Profit Logic
SL can be:
Wick low (0%)
Or dynamically calculated using a % of the full candle range
TP is calculated using the user-defined Risk/Reward ratio (e.g., 1:4)
The TP and SL levels are passed to strategy.exit() for each trade simulation.
💰 Risk Management & Lot Size Calculation
Before placing the trade:
The system calculates pip distance from EP to SL
Computes the lot size based on:
Account capital
Risk % per trade
Pip value (auto or manual)
This ensures every trade uses consistent, scalable risk regardless of instrument.
🕒 Manual Close at 3:00 p.m. NY
If the trade is still open by 15:00 NY time, it will be closed using strategy.close().
The final result is the actual % gain/loss based on how far price moved relative to SL.
📊 Backtest Accuracy
One trade per day
LIMIT order at the candle close
SL and TP pre-defined at execution
No repainting
Session-restricted (only runs on 1H timeframe)
✅ Ideal For:
Traders who want to backtest a clean and simple daily entry system
Strategy developers seeking reproducible, high-conviction trades
Users who prefer non-repainting, session-based simulations
👨💻 Credits:
💡 Developed by: LANZ
🧠 Logic & Money Management Engine: LANZ
📈 Designed for: 1H charts
🧪 Purpose: Accurate simulation of LANZ 6.0's NY Candle Entry system

Warrior Trading Momentum Strategy
# 🚀 Warrior Trading Momentum Strategy - Day Trading Excellence
## Strategy Overview
This comprehensive Pine Script strategy replicates the proven methodologies taught by Ross Cameron and the Warrior Trading community. Designed for active day traders, it identifies high-probability momentum setups with strict risk management protocols.
## 📈 Core Trading Setups
### 1. Gap and Go Trading
- **Primary Focus**: Stocks gapping up 2%+ with volume confirmation
- **Entry Logic**: Breakout above gap open with momentum validation
- **Volume Filter**: 2x average volume requirement for quality setups
### 2. ABCD Pattern Recognition
- **Pattern Detection**: Automated identification of classic ABCD reversal patterns
- **Validation**: A-B and C-D move relationship analysis
- **Entry Trigger**: D-point breakout with volume confirmation
### 3. VWAP Momentum Plays
- **Strategy**: Entries near VWAP with bounce confirmation
- **Distance Filter**: Configurable percentage distance for optimal entries
- **Direction Bias**: Above VWAP bullish momentum validation
### 4. Red to Green Reversals
- **Setup**: Reversal patterns after consecutive red candles
- **Confirmation**: Volume spike with bullish close required
- **Momentum**: Trend change validation with RSI support
### 5. Breakout Momentum
- **Logic**: Breakouts above recent highs with volume
- **Filters**: EMA20 and RSI confirmation for quality
- **Trend**: Established momentum direction validation
## ⚡ Key Features
### Smart Risk Management
- **Position Sizing**: Automatic calculation based on account risk percentage
- **Stop Loss**: 2 ATR-based stops for volatility adjustment
- **Take Profit**: Configurable risk-reward ratios (default 1:2)
- **Trailing Stops**: Profit protection with adjustable triggers
### Advanced Filtering System
- **Time Filters**: Market hours trading with lunch hour avoidance
- **Volume Confirmation**: Multi-timeframe volume analysis
- **Momentum Indicators**: RSI and moving average trend validation
- **Quality Control**: Multiple confirmation layers for signal accuracy
### PDT-Friendly Design
- **Trade Limiting**: Built-in daily trade counter for accounts under $25K
- **Selective Trading**: Priority scoring system for A+ setups only
- **Quality over Quantity**: Maximum 2-3 high-probability trades per day
## 🎯 Optimal Usage
### Best Timeframes
- **Primary**: 5-minute charts for entry timing
- **Secondary**: 1-minute for precise execution
- **Context**: Daily charts for gap analysis
### Ideal Market Conditions
- **Volatility**: High-volume, momentum-driven markets
- **Stocks**: Market cap $100M+, average volume 1M+ shares
- **Sectors**: Technology, biotech, growth stocks with news catalysts
### Account Requirements
- **Minimum**: $500+ for proper position sizing
- **Recommended**: $25K+ for unlimited day trading
- **Risk Tolerance**: Active day trading experience preferred
## 📊 Performance Optimization
### Entry Criteria (All Must Align)
1. ✅ Time filter (market hours, avoid lunch)
2. ✅ Volume spike (2x+ average volume)
3. ✅ Momentum confirmation (RSI 50-80)
4. ✅ Trend alignment (above EMA20)
5. ✅ Pattern completion (setup-specific)
### Risk Parameters
- **Maximum Risk**: 1-2% per trade
- **Position Size**: 25% of account maximum
- **Stop Loss**: 2 ATR below entry
- **Take Profit**: 2:1 risk-reward minimum
## 🔧 Customization Options
### Gap Trading Settings
- Minimum gap percentage threshold
- Volume multiplier requirements
- Gap validation criteria
### Pattern Recognition
- ABCD ratio parameters
- Swing point sensitivity
- Pattern completion filters
### Risk Management
- Risk-reward ratio adjustment
- Maximum daily trade limits
- Trailing stop trigger levels
### Time and Session Filters
- Trading session customization
- Lunch hour avoidance toggle
- Market condition filters
## ⚠️ Important Disclaimers
### Risk Warning
- **High Risk**: Day trading involves substantial risk of loss
- **Capital Requirements**: Only trade with risk capital
- **Experience**: Strategy requires active monitoring and experience
- **Market Conditions**: Performance varies with market volatility
### PDT Considerations
- **Day Trading Rules**: Accounts under $25K limited to 3 day trades per 5 days
- **Compliance**: Strategy includes trade counting for PDT compliance
- **Alternative**: Consider swing trading modifications for smaller accounts
### Backtesting vs Live Trading
- **Slippage**: Real trading involves execution delays and slippage
- **Commissions**: Factor in broker fees for accurate performance
- **Market Impact**: Large positions may affect fill prices
- **Psychological Factors**: Live trading involves emotional challenges
## 📚 Educational Value
This strategy serves as an excellent learning tool for understanding:
- Professional day trading methodologies
- Risk management principles
- Pattern recognition techniques
- Volume and momentum analysis
- Multi-timeframe analysis
## 🤝 Community and Support
Based on proven Warrior Trading methodologies with active community support. Strategy includes comprehensive plotting and information tables for educational purposes and trade analysis.
---
**Disclaimer**: This strategy is for educational purposes. Past performance does not guarantee future results. Always practice proper risk management and never risk more than you can afford to lose.
**Tags**: #DayTrading #Momentum #WarriorTrading #GapAndGo #ABCD #VWAP #PatternTrading #RiskManagement

Uptrick: Fusion Trend Reversion SystemOverview
The Uptrick: Fusion Trend Reversion System is a multi-layered indicator designed to identify potential price reversals during intraday movement while keeping traders informed of the dominant short-term trend. It blends a composite fair value model with deviation logic and a refined momentum filter using the Relative Strength Index (RSI). This tool was created with scalpers and short-term traders in mind and is especially effective on lower timeframes such as 1-minute, 5-minute, and 15-minute charts where price dislocations and quick momentum shifts are frequent.
Introduction
This indicator is built around the fusion of two classic concepts in technical trading: identifying trend direction and spotting potential reversion points. These are often handled separately, but this system merges them into one process. It starts by computing a fair value price using five moving averages, each with its own mathematical structure and strengths. These include the exponential moving average (EMA), which gives more weight to recent data; the simple moving average (SMA), which gives equal weight to all periods; the weighted moving average (WMA), which progressively increases weight with recency; the Arnaud Legoux moving average (ALMA), known for smoothing without lag; and the volume-weighted average price (VWAP), which factors in volume at each price level.
All five are averaged into a single value — the raw fusion line. This fusion acts as a dynamically balanced centerline that adapts to price conditions with both smoothing and responsiveness. Two additional exponential moving averages are applied to the raw fusion line. One is slower, giving a stable trend reference, and the other is faster, used to define momentum and cloud behavior. These two lines — the fusion slow and fusion fast — form the backbone of trend and signal logic.
Purpose
This system is meant for traders who want to trade reversals without losing sight of the underlying directional bias. Many reversal indicators fail because they act too early or signal too frequently in choppy markets. This script filters out noise through two conditions: price deviation and RSI confirmation. Reversion trades are considered only when the price moves a significant distance from fair value and RSI suggests a legitimate shift in momentum. That filtering process gives the trader a cleaner, higher-quality signal and reduces false entries.
The indicator also visually supports the trader through colored bars, up/down labels, and a filled cloud between the fast and slow fusion lines. These features make the market context immediately visible: whether the trend is up or down, whether a reversal just occurred, and whether price is currently in a high-risk reversion zone.
Originality and Uniqueness
What makes this script different from most reversal systems is the way it combines layers of logic — not just to detect signals, but to qualify and structure them. Rather than relying on a single MA or a raw RSI level, it uses a five-MA fusion to create a baseline fair value that incorporates speed, stability, and volume-awareness.
On top of that, the system introduces a dual-smoothing mechanism. It doesn’t just smooth price once — it creates two layers: one to follow the general trend and another to track faster deviations. This structure lets the script distinguish between continuation moves and possible turning points more effectively than a single-line or single-metric system.
It also uses RSI in a more refined way. Instead of just checking if RSI is overbought or oversold, the script smooths RSI and requires directional confirmation. Beyond that, it includes signal memory. Once a signal is generated, a new one will not appear unless the RSI becomes even more extreme and curls back again. This memory-based gating reduces signal clutter and prevents repetition, a rare feature in similar scripts.
Why these indicators were merged
Each moving average in the fusion serves a specific role. EMA reacts quickly to recent price changes and is often favored in fast-trading strategies. SMA acts as a long-term filter and smooths erratic behavior. WMA blends responsiveness with smoothing in a more balanced way. ALMA focuses on minimizing lag without losing detail, which is helpful in fast markets. VWAP anchors price to real trade volume, giving a sense of where actual positioning is happening.
By combining all five, the script creates a fair value model that doesn’t lean too heavily on one logic type. This fusion is then smoothed into two separate EMAs: one slower (trend layer), one faster (signal layer). The difference between these forms the basis of the trend cloud, which can be toggled on or off visually.
RSI is then used to confirm whether price is reversing with enough force to warrant a trade. The RSI is calculated over a 14-period window and smoothed with a 7-period EMA. The reason for smoothing RSI is to cut down on noise and avoid reacting to short, insignificant spikes. A signal is only considered if price is stretched away from the trend line and the smoothed RSI is in a reversal state — below 30 and rising for bullish setups, above 70 and falling for bearish ones.
Calculations
The script follows this structure:
Calculate EMA, SMA, WMA, ALMA, and VWAP using the same base length
Average the five values to form the raw fusion line
Smooth the raw fusion line with an EMA using sens1 to create the fusion slow line
Smooth the raw fusion line with another EMA using sens2 to create the fusion fast line
If fusion slow is rising and price is above it, trend is bullish
If fusion slow is falling and price is below it, trend is bearish
Calculate RSI over 14 periods
Smooth RSI using a 7-period EMA
Determine deviation as the absolute difference between current price and fusion slow
A raw signal is flagged if deviation exceeds the threshold
A raw signal is flagged if RSI EMA is under 30 and rising (bullish setup)
A raw signal is flagged if RSI EMA is over 70 and falling (bearish setup)
A final signal is confirmed for a bullish setup if RSI EMA is lower than the last bullish signal’s RSI
A final signal is confirmed for a bearish setup if RSI EMA is higher than the last bearish signal’s RSI
Reset the bullish RSI memory if RSI EMA rises above 30
Reset the bearish RSI memory if RSI EMA falls below 70
Store last signal direction and use it for optional bar coloring
Draw the trend cloud between fusion fast and fusion slow using fill()
Show signal labels only if showSignals is enabled
Bar and candle colors reflect either trend slope or last signal direction depending on mode selected
How it works
Once the script is loaded, it builds a fusion line by averaging five different types of moving averages. That line is smoothed twice into a fast and slow version. These two fusion lines form the structure for identifying trend direction and signal areas.
Trend bias is defined by the slope of the slow line. If the slow line is rising and price is above it, the market is considered bullish. If the slow line is falling and price is below it, it’s considered bearish.
Meanwhile, the script monitors how far price has moved from that slow line. If price is stretched beyond a certain distance (set by the threshold), and RSI confirms that momentum is reversing, a raw reversion signal is created. But the script only allows that signal to show if RSI has moved further into oversold or overbought territory than it did at the last signal. This blocks repetitive, weak entries. The memory is cleared only if RSI exits the zone — above 30 for bullish, below 70 for bearish.
Once a signal is accepted, a label is drawn. If the signal toggle is off, no label will be shown regardless of conditions. Bar colors are controlled separately — you can color them based on trend slope or last signal, depending on your selected mode.
Inputs
You can adjust the following settings:
MA Length: Sets the period for all moving averages used in the fusion.
Show Reversion Signals: Turns on the plotting of “Up” and “Down” labels when a reversal is confirmed.
Bar Coloring: Enables or disables colored bars based on trend or signal direction.
Show Trend Cloud: Fills the space between the fusion fast and slow lines to reflect trend bias.
Bar Color Mode: Lets you choose whether bars follow trend logic or last signal direction.
Sens 1: Smoothing speed for the slow fusion line — higher values = slower trend.
Sens 2: Smoothing speed for the fast line — lower values = faster signal response.
Deviation Threshold: Minimum distance price must move from fair value to trigger a signal check.
Features
This indicator offers:
A composite fair value model using five moving average types.
Dual smoothing system with user-defined sensitivity.
Slope-based trend definition tied to price position.
Deviation-triggered signal logic filtered by RSI reversal.
RSI memory system that blocks repetitive signals and resets only when RSI exits overbought or oversold zones.
Real-time tracking of the last signal’s direction for optional bar coloring.
Up/Down labels at signal points, visible only when enabled.
Optional trend cloud between fusion layers, visualizing current market bias.
Full user control over smoothing, threshold, color modes, and visibility.
Conclusion
The Fusion Trend-Reversion System is a tool for short-term traders looking to fade price extremes without ignoring trend bias. It calculates fair value using five diverse moving averages, smooths this into two dynamic layers, and applies strict reversal logic based on RSI deviation and momentum strength. Signals are triggered only when price is stretched and momentum confirms it with increasingly strong behavior. This combination makes the tool suitable for scalping, intraday entries, and fast market environments where precision matters.
Disclaimer
This indicator is for informational and educational purposes only. It does not constitute financial advice. All trading involves risk, and no tool can predict market behavior with certainty. Use proper risk management and do your own research before making trading decisions.

Multifractal Forecast [ScorsoneEnterprises]Multifractal Forecast Indicator
The Multifractal Forecast is an indicator designed to model and forecast asset price movements using a multifractal framework. It uses concepts from fractal geometry and stochastic processes, specifically the Multifractal Model of Asset Returns (MMAR) and fractional Brownian motion (fBm), to generate price forecasts based on historical price data. The indicator visualizes potential future price paths as colored lines, providing traders with a probabilistic view of price trends over a specified trading time scale. Below is a detailed breakdown of the indicator’s functionality, inputs, calculations, and visualization.
Overview
Purpose: The indicator forecasts future price movements by simulating multiple price paths based on a multifractal model, which accounts for the complex, non-linear behavior of financial markets.
Key Concepts:
Multifractal Model of Asset Returns (MMAR): Models price movements as a multifractal process, capturing varying degrees of volatility and self-similarity across different time scales.
Fractional Brownian Motion (fBm): A generalization of Brownian motion that incorporates long-range dependence and self-similarity, controlled by the Hurst exponent.
Binomial Cascade: Used to model trading time, introducing heterogeneity in time scales to reflect market activity bursts.
Hurst Exponent: Measures the degree of long-term memory in the price series (persistence, randomness, or mean-reversion).
Rescaled Range (R/S) Analysis: Estimates the Hurst exponent to quantify the fractal nature of the price series.
Inputs
The indicator allows users to customize its behavior through several input parameters, each influencing the multifractal model and forecast generation:
Maximum Lag (max_lag):
Type: Integer
Default: 50
Minimum: 5
Purpose: Determines the maximum lag used in the rescaled range (R/S) analysis to calculate the Hurst exponent. A higher lag increases the sample size for Hurst estimation but may smooth out short-term dynamics.
2 to the n values in the Multifractal Model (n):
Type: Integer
Default: 4
Purpose: Defines the resolution of the multifractal model by setting the size of arrays used in calculations (N = 2^n). For example, n=4 results in N=16 data points. Larger n increases computational complexity and detail but may exceed Pine Script’s array size limits (capped at 100,000).
Multiplier for Binomial Cascade (m):
Type: Float
Default: 0.8
Purpose: Controls the asymmetry in the binomial cascade, which models trading time. The multiplier m (and its complement 2.0 - m) determines how mass is distributed across time scales. Values closer to 1 create more balanced cascades, while values further from 1 introduce more variability.
Length Scale for fBm (L):
Type: Float
Default: 100,000.0
Purpose: Scales the fractional Brownian motion output, affecting the amplitude of simulated price paths. Larger values increase the magnitude of forecasted price movements.
Cumulative Sum (cum):
Type: Integer (0 or 1)
Default: 1
Purpose: Toggles whether the fBm output is cumulatively summed (1=On, 0=Off). When enabled, the fBm series is accumulated to simulate a price path with memory, resembling a random walk with long-range dependence.
Trading Time Scale (T):
Type: Integer
Default: 5
Purpose: Defines the forecast horizon in bars (20 bars into the future). It also scales the binomial cascade’s output to align with the desired trading time frame.
Number of Simulations (num_simulations):
Type: Integer
Default: 5
Minimum: 1
Purpose: Specifies how many forecast paths are simulated and plotted. More simulations provide a broader range of possible price outcomes but increase computational load.
Core Calculations
The indicator combines several mathematical and statistical techniques to generate price forecasts. Below is a step-by-step explanation of its calculations:
Log Returns (lgr):
The indicator calculates log returns as math.log(close / close ) when both the current and previous close prices are positive. This measures the relative price change in a logarithmic scale, which is standard for financial time series analysis to stabilize variance.
Hurst Exponent Estimation (get_hurst_exponent):
Purpose: Estimates the Hurst exponent (H) to quantify the degree of long-term memory in the price series.
Method: Uses rescaled range (R/S) analysis:
For each lag from 2 to max_lag, the function calc_rescaled_range computes the rescaled range:
Calculate the mean of the log returns over the lag period.
Compute the cumulative deviation from the mean.
Find the range (max - min) of the cumulative deviation.
Divide the range by the standard deviation of the log returns to get the rescaled range.
The log of the rescaled range (log(R/S)) is regressed against the log of the lag (log(lag)) using the polyfit_slope function.
The slope of this regression is the Hurst exponent (H).
Interpretation:
H = 0.5: Random walk (no memory, like standard Brownian motion).
H > 0.5: Persistent behavior (trends tend to continue).
H < 0.5: Mean-reverting behavior (price tends to revert to the mean).
Fractional Brownian Motion (get_fbm):
Purpose: Generates a fractional Brownian motion series to model price movements with long-range dependence.
Inputs: n (array size 2^n), H (Hurst exponent), L (length scale), cum (cumulative sum toggle).
Method:
Computes covariance for fBm using the formula: 0.5 * (|i+1|^(2H) - 2 * |i|^(2H) + |i-1|^(2H)).
Uses Hosking’s method (referenced from Columbia University’s implementation) to generate fBm:
Initializes arrays for covariance (cov), intermediate calculations (phi, psi), and output.
Iteratively computes the fBm series by incorporating a random term scaled by the variance (v) and covariance structure.
Applies scaling based on L / N^H to adjust the amplitude.
Optionally applies cumulative summation if cum = 1 to produce a path with memory.
Output: An array of 2^n values representing the fBm series.
Binomial Cascade (get_binomial_cascade):
Purpose: Models trading time (theta) to account for non-uniform market activity (e.g., bursts of volatility).
Inputs: n (array size 2^n), m (multiplier), T (trading time scale).
Method:
Initializes an array of size 2^n with values of 1.0.
Iteratively applies a binomial cascade:
For each block (from 0 to n-1), splits the array into segments.
Randomly assigns a multiplier (m or 2.0 - m) to each segment, redistributing mass.
Normalizes the array by dividing by its sum and scales by T.
Checks for array size limits to prevent Pine Script errors.
Output: An array (theta) representing the trading time, which warps the fBm to reflect market activity.
Interpolation (interpolate_fbm):
Purpose: Maps the fBm series to the trading time scale to produce a forecast.
Method:
Computes the cumulative sum of theta and normalizes it to .
Interpolates the fBm series linearly based on the normalized trading time.
Ensures the output aligns with the trading time scale (T).
Output: An array of interpolated fBm values representing log returns over the forecast horizon.
Price Path Generation:
For each simulation (up to num_simulations):
Generates an fBm series using get_fbm.
Interpolates it with the trading time (theta) using interpolate_fbm.
Converts log returns to price levels:
Starts with the current close price.
For each step i in the forecast horizon (T), computes the price as prev_price * exp(log_return).
Output: An array of price levels for each simulation.
Visualization:
Trigger: Updates every T bars when the bar state is confirmed (barstate.isconfirmed).
Process:
Clears previous lines from line_array.
For each simulation, plots a line from the current bar’s close price to the forecasted price at bar_index + T.
Colors the line using a gradient (color.from_gradient) based on the final forecasted price relative to the minimum and maximum forecasted prices across all simulations (red for lower prices, teal for higher prices).
Output: Multiple colored lines on the chart, each representing a possible price path over the next T bars.
How It Works on the Chart
Initialization: On each bar, the indicator calculates the Hurst exponent (H) using historical log returns and prepares the trading time (theta) using the binomial cascade.
Forecast Generation: Every T bars, it generates num_simulations price paths:
Each path starts at the current close price.
Uses fBm to model log returns, warped by the trading time.
Converts log returns to price levels.
Plotting: Draws lines from the current bar to the forecasted price T bars ahead, with colors indicating relative price levels.
Dynamic Updates: The forecast updates every T bars, replacing old lines with new ones based on the latest price data and calculations.
Key Features
Multifractal Modeling: Captures complex market dynamics by combining fBm (long-range dependence) with a binomial cascade (non-uniform time).
Customizable Parameters: Allows users to adjust the forecast horizon, model resolution, scaling, and number of simulations.
Probabilistic Forecast: Multiple simulations provide a range of possible price outcomes, helping traders assess uncertainty.
Visual Clarity: Gradient-colored lines make it easy to distinguish bullish (teal) and bearish (red) forecasts.
Potential Use Cases
Trend Analysis: Identify potential price trends or reversals based on the direction and spread of forecast lines.
Risk Assessment: Evaluate the range of possible price outcomes to gauge market uncertainty.
Volatility Analysis: The Hurst exponent and binomial cascade provide insights into market persistence and volatility clustering.
Limitations
Computational Intensity: Large values of n or num_simulations may slow down execution or hit Pine Script’s array size limits.
Randomness: The binomial cascade and fBm rely on random terms (math.random), which may lead to variability between runs.
Assumptions: The model assumes log-normal price movements and fractal behavior, which may not always hold in extreme market conditions.
Adjusting Inputs:
Set max_lag based on the desired depth of historical analysis.
Adjust n for model resolution (start with 4–6 to avoid performance issues).
Tune m to control trading time variability (0.5–1.5 is typical).
Set L to scale the forecast amplitude (experiment with values like 10,000–1,000,000).
Choose T based on your trading horizon (20 for short-term, 50 for longer-term for example).
Select num_simulations for the number of forecast paths (5–10 is reasonable for visualization).
Interpret Output:
Teal lines suggest bullish scenarios, red lines suggest bearish scenarios.
A wide spread of lines indicates high uncertainty; convergence suggests a stronger trend.
Monitor Updates: Forecasts update every T bars, so check the chart periodically for new projections.
Chart Examples
This is a daily AMEX:SPY chart with default settings. We see the simulations being done every T bars and they provide a range for us to analyze with a few simulations still in the range.
On this intraday PEPPERSTONE:COCOA chart I modified the Length Scale for fBm, L, parameter to be 1000 from 100000. Adjusting the parameter as you switch between timeframes can give you more contextual simulations.
On BITSTAMP:ETHUSD I modified the L to be 1000000 to have a more contextual set of simulations with crypto's volatile nature.
With L at 100000 we see the range for NASDAQ:TLT is correctly simulated. The recent pop stays within the bounds of the highest simulation. Note this is a cherry picked example to show the power and potential of these simulations.
Technical Notes
Error Handling: The script includes checks for array size limits and division by zero (math.abs(denominator) > 1e-10, v := math.max(v, 1e-10)).
External Reference: The fBm implementation is based on Hosking’s method (www.columbia.edu), ensuring a robust algorithm.
Conclusion
The Multifractal Forecast is a powerful tool for traders seeking to model complex market dynamics using a multifractal framework. By combining fBm, binomial cascades, and Hurst exponent analysis, it generates probabilistic price forecasts that account for long-range dependence and non-uniform market activity. Its customizable inputs and clear visualizations make it suitable for both technical analysis and strategy development, though users should be mindful of its computational demands and parameter sensitivity. For optimal use, experiment with input settings and validate forecasts against other technical indicators or market conditions.
