VIX - SKEW DivergenceThe CBOE VIX is a well-known index representing market expectations for volatility over the next 30 days.
The CBOE SKEW is an index reflecting the perceived tail risk over the next 30 days.
When the SKEW rises over a certain level (~140/150), that means investors are hedging their exposure with options, because they are worried about an incoming market crash or a "black swan". If that happens when the VIX is very low and apparently there is no uncertainty, this can warn of a sudden change in direction of the market. You will see for yourself that an increasing divergence often anticipates a sharp fall of leading stock indexes, usually within two to four months.
This is probably not very relevant for the short-term trader but mid/long-term traders and market analysts may find it useful to clearly visualize the extent of the distance between the VIX and the SKEW. For that reason, I wrote this highly customizable script with which you can plot the two indexes and fill the space within them with a color gradient to highlight the maximum and minimum divergence. Additionally, you can fill the beneath VIX area with four different colors. It is also possible to plot the divergence value itself, so if you want you can draw trendlines and support/resistance levels on it.
Please note that the divergence per se doesn't predict anything and it's meant to be used synergistically with other technical analysis tools.
More informations here:
www.cboe.com
www.cboe.com
ابحث في النصوص البرمجية عن "vix"

VIX + EMA Trend SinyaliOverlay: true (Gösterge, fiyat grafiği üzerine çizilir).
Maksimum Etiket Sayısı: 500 (Grafikteki sinyal işaretlerinin sayısı sınırlıdır).
Indicator Name: VIX + EMA Trend Signal
Platform: TradingView (Pine Script v5)
Purpose: Generate buy (BUY) and sell (SELL) signals in the market using the VIX Index and EMAs (5 and 21 periods).
Features: Evaluates market fear levels using VIX Index data.
Analyzes EMA (5 and 21) trends.
Generates combined signals (BUY, SELL, WAIT).
Displays EMA lines, VIX levels, and signal signals on the chart for visualization.
Provides summary information in a tabular format.
Includes alert conditions for automatic buy/sell signals.
Overlay: true (The indicator is drawn over the price chart).
Maximum Number of Labels: 500 (The number of signal signals on the chart is limited).

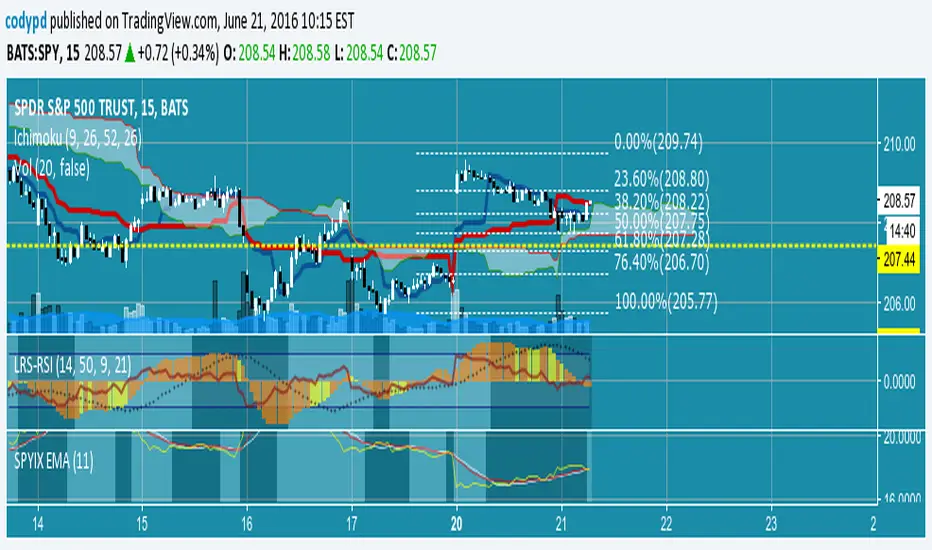
VIX FixHere is the VIX Fix indicator based on research by Amber Hestla-Barnhart and published in the Journal of Technical Analysis issue 69.
The idea behind it was to create an indicator that leverages the power of VIX as an indicator on any security or ETF.
Just like the VIX, this has an inverse correlation to the price movement. The higher and steadier the price action is, the lower the VIX Fix indicator goes.

SPYIX EMAVariation on idea at url below using SPYIX from BATS instead of VIX
from marketsci.wordpress.com
Aids in identifying changes in volatility direction.
EDIT: just noticed that URL is now password protected. The concept from the author is simple: use EMA and SMA smoothing of the VIX as two signal lines. When they cross you have a change in VIX direction. I simply coded that for SPYIX which is a slightly different (but theoretically similar) index vs VIX. SPYIX provides intraday updates without a subscription so this indicator can be used for intraday tracking.
VIX Contango Sentiment IndicatorRegime dependent ONLY USE 2018 ONWARD
Plots VIX3m/VIX measuring the complacency of the VIX term structure
<.8 = COMPLACENCY VIX spike likely
Buy risk on the 2nd downtick from capitulation zone

VIX/VIX3M Ratio計算並顯示 CBOE:VIX 和 CBOE:VIX3M 的比率,幫助交易者評估市場的波動性。
當比率超過設定的高水平或低於低水平時,指標將顯示為紅色,提示潛在的市場異常情況。
Calculates and displays the ratio of CBOE:VIX to CBOE:VIX3M, helping traders assess market volatility.
When the ratio exceeds the set high level or falls below the low level, the indicator will be displayed in red, signaling potential market anomalies.

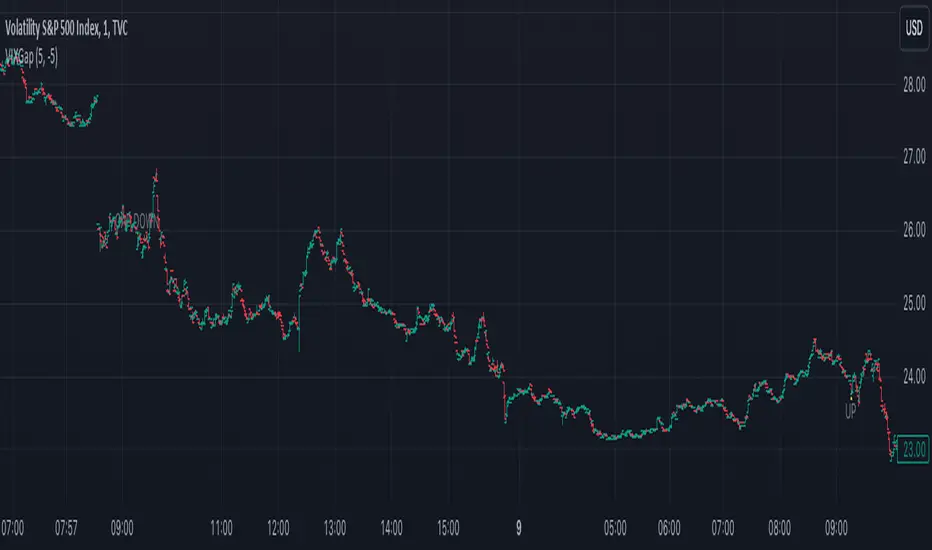
VIX Opening GapOverview
This simple script generates alerts based on the difference between the previous trading day's VIX close and the current trading day's opening bar. It is designed for use on the TVC version of the VIX chart, with 1-minute bars.
Features
The script flags one of four conditions based on the difference between the previous day's close and the current day's open: (1) open up; (2) open down; (3) gap up; and (4) gap down. The thresholds for gaps up and down are expressed as percentages and can be changed in the input settings.
The script can assess the gap at the first bar of the premarket session or at the first bar printed after market open. Change this by toggling the "Use Premarket Hours" feature in the input settings.
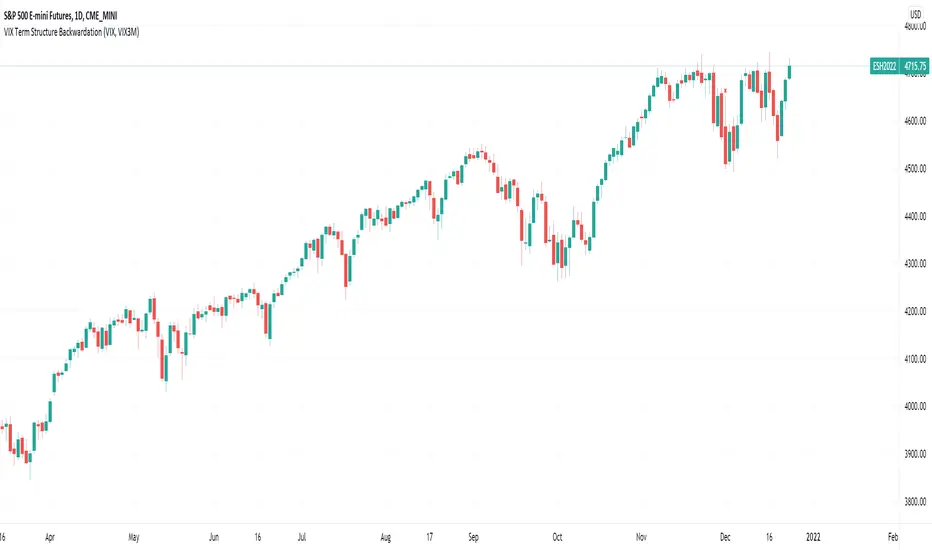
VIX Term Structure BackwardationTracks backwardation of the VIX Term Structure using the difference between 2 custom durations VIX / VIX3M /VIX6M/VIX1Y

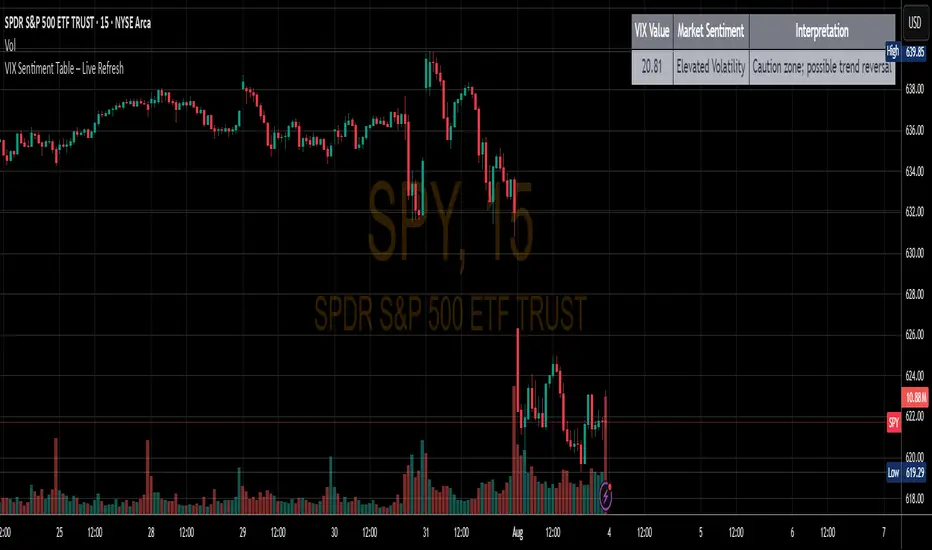
VIX Sentiment Table – ResolutionThis indicator provides verbal representation of the current VIX value and likely market trend for easy to view and interpret
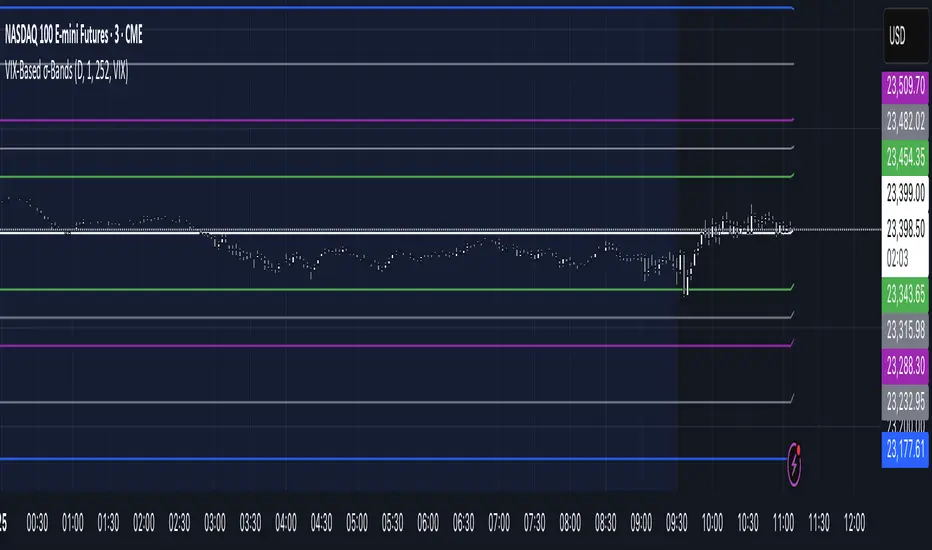
VIX‑Based σ‑BandsThis Pine Script v5 indicator builds a volatility‑based envelope around yesterday’s close using CBOE’s volatility indices. It dynamically pulls VIX, VXN, VXD or RVX—depending on whether you’re charting ES, NQ, YM or RTY—and converts annualized volatility into dollar‑move bands at ±¼ σ, ±½ σ, ±1 σ, and ±2 σ. Optional “mid‑lines” fill in the gaps between each band for even finer precision.
VIX Differential(Melon)Simple indy that measures the difference between VIX9D and VIX to try assessing short-term market sentiment. I've liked this recently as a big clue for market bottom reversals.

Vix Volatality RangeOverview
This indicator calculates and plots the historical volatility of a stock, which is a measure of the stock's price fluctuation over a specific period. The volatility is computed using the standard deviation of the logarithmic returns (log returns) of the stock's closing prices. It is then annualized and displayed as a percentage on the chart.
Additionally, the log return values are printed above each candlestick (or every fifth bar, to reduce clutter). This can help traders observe the daily price changes in a logarithmic scale, providing insights into the magnitude and direction of the price movements.
Key Components
Logarithmic Returns: Log returns represent the percentage change in price, accounting for compounding, and are calculated using the formula log(close / close ).
Historical Volatility: This is calculated by taking the standard deviation of log returns over a specified period and annualizing it. This metric gives an estimate of the stock’s volatility, similar to how the VIX measures volatility in the options market.
Annualization: Volatility is annualized by multiplying by the square root of 252 (the approximate number of trading days in a year), providing a volatility percentage in annual terms.
How to Use
Volatility Levels: Higher volatility indicates larger price swings and potentially higher risk, while lower volatility suggests more stable price movements.
Log Return Display: Use the displayed log return values to see how much the price has changed from one day to the next in percentage terms. The log returns offer a normalized view of price changes, which can be useful for identifying trends or patterns.
Applications
Risk Management: This indicator helps in assessing the riskiness of a stock based on its price volatility. Traders can adjust position sizes and risk management strategies accordingly.
Trend Analysis: By observing periods of high and low volatility, traders can identify potential breakout or reversal points. High volatility often follows periods of consolidation.

VIX CorrelationIndicator tracks the 10 day correlation with VIX. I prefer to use this with SPY. Can be a great way to flag tops/melt-ups.
Default settings are set to when the correlation is above 0.2, bars turn red, but you can change this.


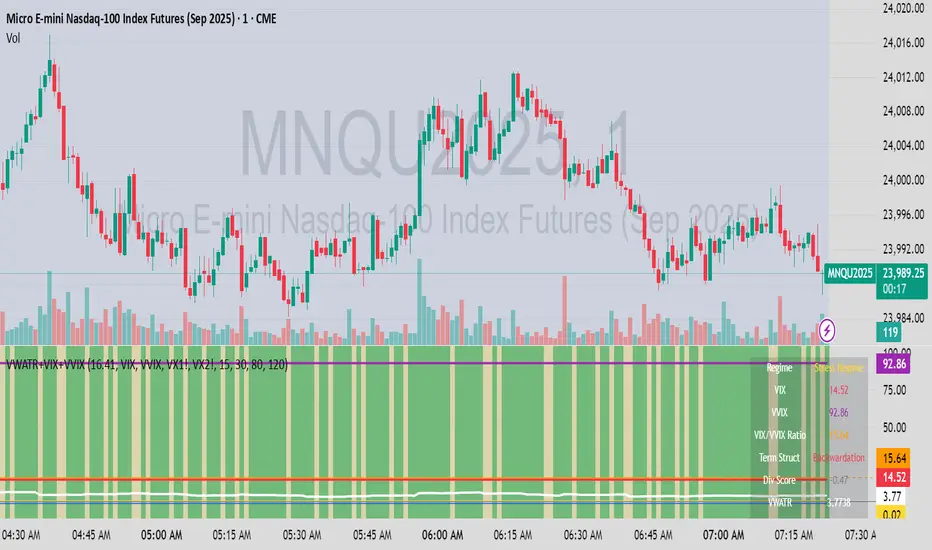
VWATR + VIX + VVIX Trend Regime### 🤖 VWATR + VIX + VVIX Trend Regime — Your Ultimate Volatility Dashboard! 📊
This isn't just another indicator; it's a comprehensive dashboard that brings together everything you need to understand market volatility focused on Futures. It merges price-based movement with market-wide fear and sentiment, giving you a powerful edge in your trading and risk management. Think of it as your personal volatility sidekick, ready to help you navigate market uncertainty like a pro!
***
### ✨ What's Inside?
* **VWATR (Volume-Weighted ATR):** A super-smart measure of price movement that pays close attention to where the big money is flowing.
* **VIX (The "Fear Gauge"):** Tracks the expected volatility of the S&P 500, essentially telling you how nervous the market is feeling.
* **VVIX (The "VIX of VIX"):** This one's for the pros! It measures how volatile the VIX itself is, giving you an early heads-up on potential fear spikes.
* **VX Term Structure:** A clever way to see if traders are preparing for a crisis. It compares the two nearest VIX futures to spot a rare signal called "backwardation."
* **Z-Scores:** It helps you spot when VIX and VVIX are at historic highs or lows, making it easier to predict when things might return to normal.
* **Divergence Score:** A unique tool to flag potential market shifts when the VIX and VVIX start moving in completely different directions.
* **Regime Classification:** The script automatically labels the market as "Full Panic," "Known Crisis," "Surface Calm," "Stress," or "Normal," so you always know where you stand.
* **Gradient Bars:** A visual treat! The background of your chart changes color to reflect real-time volatility shifts, giving you an instant feel for the market's mood.
* **Alerts:** Get push notifications on your phone for key events like "Full Panic" or "Backwardation" so you never miss a beat.
***
### 📝 Panel/Table Outputs
This is your mission control! The on-screen table gives you a clean summary of the current market regime, VIX and VVIX values, their ratios, term structure, Z-scores, and signals. Everything you need, right where you can see it.
***
### 🚀 How to Get Started
1. **Check your data:** You'll need access to real-time data for VIX, VVIX, VX1!, and VX2!. A paid subscription might be necessary for this.
2. **Add it to your chart:** Use the indicator on any chart (we've set it to `overlay=false`) to get your full volatility dashboard.
3. **Tweak it to perfection:** Head over to the Settings panel to customize the thresholds, colors, and your all-important "Jolt Value."
4. **Start trading smarter:** Use the dashboard to inform your trades, hedge your portfolio, and manage risk with confidence.
***
### ⚙️ Customization & Key Settings
* `showVWATR`: Toggle your price-volatility metric on or off.
* `showExpectedVol`: See the expected volatility as a percentage of the current price.
* `joltLevel`: This is a very important line on your chart! It's your personal trigger for when volatility is getting a little too wild. More on this below.
* `enableGradientBars`: Turn the awesome colored background on or off.
* `enableTable`: Hide or show your information table.
* `VIX/VVIX/VX1!/VX2! symbols`: If your broker uses different symbols for these, you can change them here.
* `VIX/VVIX thresholds`: Adjust these levels to fine-tune the indicator to your personal risk tolerance.
***
### 💡 Jolt Value: A Quick Guide for Smart Traders 🧠
The **jolt value** is your personal tripwire for volatility. Think of it as a warning light on your car's dashboard. You set the level, and when volatility (VWATR) crosses that line, you get an instant signal that something interesting is happening.
**How to Set Your Jolt Value:**
The ideal jolt value is dynamic. You want to keep it just a little above the current VIX level to stay alert without getting too many false alarms.
| Current VIX Level | Market Regime | Recommended Jolt Value |
| :--- | :--- | :--- |
| Under 15 | Calm/Complacent | 15–16 |
| 15–20 | Typical/Normal | 16–18 |
| 20–30 | Cautious/Active | 18–22 |
| Over 30 | Stress/Panic | 30+ |
**A Pro Tip for August 2025:** Since the VIX is hovering around 14.7, setting your jolt value to **16.5** is a great starting point for keeping an eye on things. If the VIX starts to climb above 20, you should adjust your jolt level to match the new reality.
***
### ⚠️ Important Things to Note
* You might experience some data delays if you're not on a paid TradingView plan or your broker does not provide real-time data for the VIX also VIX is only active during NY session, so it's not advised to use it outside of normal trading hours!
ETF→Symbol GEX & IM Mapper🧭 ETF→Symbol GEX & IM Mapper — Descripción e Instrucciones
Resumen 🧩
Indicador (overlay) que convierte niveles calculados sobre un ETF (SPY/QQQ/IWM/DIA) al símbolo actual y los dibuja con estilo profesional: muros de GEX (Call/Put), rango de IM (+ desvíos estándar), HVL con sombreado verde/rojo, BS desde bloque, estado de entorno (Basis/VIX) y signo GEX manual/automático. Ideal para quienes operan futuros/acciones pero consumen niveles originados en el ETF.
¿Qué hace? 🎯
Convierte y plotea niveles de GEX/IM/HVL/BS provenientes de un bloque de texto (formato largo en español o compacto “precio,nombre ”). Permite rebase a apertura 09:30 NY o rebase manual, ajusta etiquetas/colores, controla la longitud de líneas (por barras/días/todo el chart) y muestra un InfoBox con BASE (CT/BW), VIX (opcional) y signo GEX (Manual/Auto). El sombreado HVL puede anclarse a IM o GEX L1 y recortarse al mismo span.
El bloque largo se obtiene directamente (podría requerir suscripción de pago) del sitio:
gammetric.com
Ejemplo de formato del bloque largo:
NQ (Nasdaq 100)
Resistencia Call 23500, Soporte Put 23000, HVL 23360, 1D Min 23200.21, 1D Max 23697.29, Resistencia Call 0DTE 23500, Soporte Put 0DTE 23200, HVL 0DTE 23360, Muro Gamma 0DTE 23500, GEX 1 23550, GEX 2 23300, GEX 3 23600, GEX 4 23650, GEX 5 23350, GEX 6 23750, GEX 7 23800, GEX 8 23700, GEX 9 23900, GEX 10 23100, BS 1 23345.2, BS 2 23700.68, BS 3 23202.48, BS 4 24015.01, BS 5 23861.63, BS 6 23600.78, BS 7 23087.68, BS 8 22873.02, BS 9 24043.37, BS 10 23774.72
EL bloque corto se alimenta manualmente de los datos obtenidos desde sitios como Unusual whales, Option Alpha, etc.
Ejemplo del formato del bloque corto:
575, call wall, l1; 567, put wall, l1; 571, call wall, l2; 565, put wall, l2; 572, call wall, l3; 560, put wall, l3; 560, im; 571, im; 570, hvl
Componentes 🧱
• GEX: Resistencia Call (l1), Soporte Put (l1) + GEX extra por lado (l2/l3) coloreados según el lado del precio.
• IM: Rango IM Low/High con opción de SDV ±1/±2/±3.
• HVL: Línea HVL + sombreado dinámico (verde/rojo) según posición del precio, anclaje (IM/GEX L1/Auto).
• BS: Hasta N niveles en gris (etiqueta “BS k”).
• InfoBox: ETF, precio ETF, BASE (suavizada), VIX (spot vs 3M) y GEX Manual/Auto.
• Rebase: 09:30 NY automático o manual; alerta de deriva configurable.
Entrada de datos (bloque pegado) 📦
• Largo (ES): frases con “Resistencia Call”, “Soporte Put”, “HVL 0DTE/Std”, “1D min/max”, “GEX k”, “BS k”, etc.
• Compacto: precio,nombre separados con ; (ej.: 5200,Call Wall,l1; 5150,GEX 2; 5100,BS 1).
• Marca “Valores del bloque están en ETF (convertir con Diff)” cuando el bloque venga en precio del ETF.
• Preferir 0DTE: prioriza variantes intradía si coexisten 0DTE/Std.
⚙️ Instrucciones de uso
Añade el indicador al gráfico del símbolo donde operas (futuros, acción, etc.). Es un overlay.
En “01) Origen de datos” pega tu bloque y elige el formato (Auto/Largo/Compacto).
En “02) ETF → Símbolo” selecciona el ETF de referencia del que provienen los niveles (SPY/QQQ/IWM/DIA).
En “02-b) Ancla / Rebase” elige “Rebase 09:30 NY” o “Rebase manual”. Si usas manual, pulsa “Rebase ahora” tras abrir mercado. Activa la alerta de deriva para recibir sugerencias de rebase.
Ajusta “04) Líneas / Etiquetas”: longitud (Barras/Días/Completo), posición, offsets, colores y fondos (puedes igualar el fondo de etiqueta al color de línea).
En “05) Estilos” define grosores/estilos/colores; activa SDV si quieres ±σ desde IM. Configura HVL y su sombreado (anclaje, opacidad, lado).
En “06) Entorno” activa Basis y/o VIX; pon GEX en “Manual/Auto”. En Auto puedes basarte en VIX term, Basis o Precio vs HVL.
Revisa el InfoBox para ver BASE, VIX y estado GEX; activa la etiqueta flotante si quieres lectura rápida en el gráfico.
Publica en TradingView con esta ficha, capturas de ejemplo y marcando overlay.
🔧 Parámetros clave (rápido)
• block_format_mode: Auto / Largo / Compacto
• block_prices_in_etf: marcar si el bloque viene en precio de ETF
• block_gex_per_side: cuántos GEX extra (además de L1) por lado
• bs_enable / bs_count_plot: activar y limitar cantidad de BS
• hvl_fill_anchor: “IM”, “GEX L1” o “Auto (IM dentro de GEX L1)”
• line_span_mode: “Barras”, “Días” o “Completo”
• gex_mode: “Manual/Auto” con fuentes “VIX term / Basis / HVL”
🧭 ETF→Symbol GEX & IM Mapper — Description & Instructions (for TradingView)
Summary 🧩
Overlay indicator that converts levels computed on an ETF (SPY/QQQ/IWM/DIA) to the current symbol and renders them with a clean visual style: GEX walls (Call/Put), IM range (+ standard-deviation bands), HVL with green/red shading, BS levels from the pasted block, environment state (Basis/VIX), and GEX sign (manual/auto). Ideal for traders who trade futures/stocks but consume levels originated on the ETF.
What it does 🎯
Parses and plots GEX/IM/HVL/BS levels coming from a text block (Spanish long format or compact price,name ). Supports rebase at 09:30 NY or manual rebase, configurable labels/colors, line length (by bars/days/entire chart), and an InfoBox with BASE (CT/BW), optional VIX, and GEX sign (Manual/Auto). HVL shading can anchor to IM or GEX L1 and matches the same line span.
Components 🧱
• GEX: Call Resistance (l1), Put Support (l1) + extra GEX per side (l2/l3) auto-colored by side vs price.
• IM: IM Low/High range with optional SDV ±1/±2/±3.
• HVL: HVL line + dynamic shading (green/red) based on price vs HVL; anchors (IM/GEX L1/Auto).
• BS: Up to N gray levels (label “BS k”).
• InfoBox: ETF, ETF price, BASE (smoothed), VIX (spot vs 3M), and GEX Manual/Auto.
• Rebase: Auto at 09:30 NY or manual click; configurable drift alert.
Data input (pasted block) 📦
• Long (ES): phrases like “Resistencia Call”, “Soporte Put”, “HVL 0DTE/Std”, “1D min/max”, “GEX k”, “BS k”, etc.
• Compact: price,name separated by ; (e.g., 5200,Call Wall,l1; 5150,GEX 2; 5100,BS 1).
• Enable “Valores del bloque están en ETF (convertir con Diff)” when values are in ETF price (not the current symbol).
• Prefer 0DTE: prioritizes intraday variants when both 0DTE/Std exist.
⚙️ How to use
Add the indicator to the chart of the instrument you trade (future, stock, etc.). It’s an overlay.
In “01) Origen de datos”, paste your block and choose the format (Auto/Long/Compact).
In “02) ETF → Símbolo”, pick the reference ETF the levels were computed on (SPY/QQQ/IWM/DIA).
In “02-b) Ancla / Rebase”, choose “Rebase 09:30 NY” or “Rebase manual”. If manual, press “Rebase ahora” after the market opens. Enable the drift alert to get rebase hints.
Tweak “04) Líneas / Etiquetas”: length (Bars/Days/Full), label position, offsets, colors and backgrounds (you can match label background to line color).
In “05) Estilos”, set widths/styles/colors; enable SDV if you want ±σ around IM. Configure HVL and its shading (anchor, opacity, side behavior).
In “06) Entorno”, turn on Basis and/or VIX; set GEX to “Manual/Auto”. In Auto you may base it on VIX term, Basis, or Price vs HVL.
Check the InfoBox for BASE, VIX and GEX sign; enable the floating label if you want a quick on-chart readout.
Publish on TradingView with this write-up, example screenshots, and overlay flagged.
🔧 Key parameters (quick)
• block_format_mode: Auto / Long / Compact
• block_prices_in_etf: enable if the block is in ETF prices
• block_gex_per_side: how many extra GEX levels (besides L1) per side
• bs_enable / bs_count_plot: enable and cap the number of BS levels
• hvl_fill_anchor: “IM”, “GEX L1” or “Auto (IM dentro de GEX L1)”
• line_span_mode: “Barras”, “Días” or “Completo” (Bars/Days/Full)
• gex_mode: “Manual/Auto” with sources “VIX term / Basis / HVL”
🛠️ Troubleshooting
• Levels look shifted: perform a Rebase or enable the drift alert.
• Label overlap: use bar/day offsets and/or disable “Label background = line color”.
• Block is in ETF and not marked: enable “Valores del bloque están en ETF”.
• Extra GEX duplicates L1: increase dedup tolerance (ε).
• VIX missing: enable VIX and confirm the tickers exist for your broker/plan.
🎨 Design notes
• All UI texts, menus and labels shipped in Spanish by design.
• Compatible with short and long block without breaking existing setups.
• Respects Pine v6 syntax; avoids breaking lines inside parentheses.
⚖️ Disclaimer
This indicator is a visualization/level-management tool. It is not financial advice and does not guarantee results. Use at your own discretion and risk.

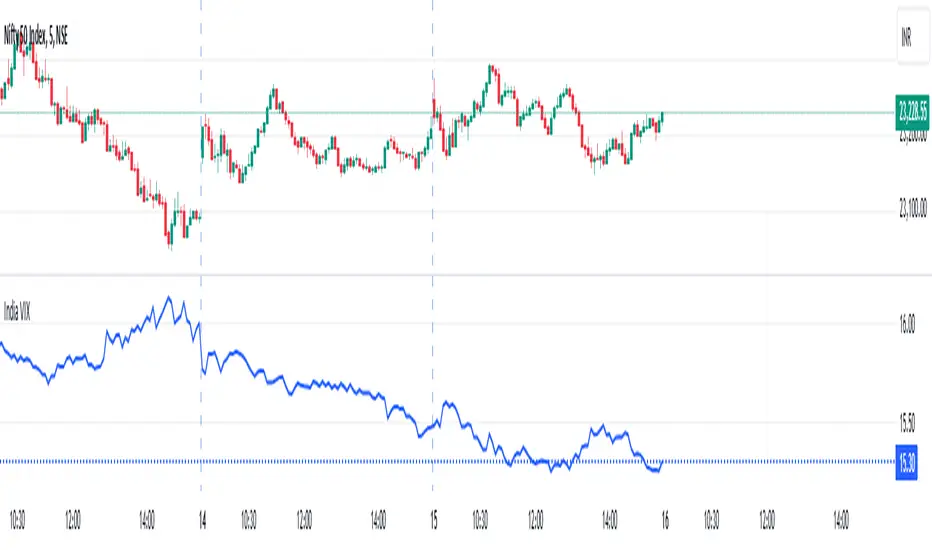
India VIXThe VIX chart represents the Volatility Index, commonly referred to as the "Fear Gauge" of the stock market. It measures the market's expectations of future volatility over the next 30 days, based on the implied volatility of NSE index options. The VIX is often used as an indicator of investor sentiment, reflecting the level of fear or uncertainty in the market.
Here’s a breakdown of what you might observe on a typical VIX chart:
VIX Value: The y-axis typically represents the VIX index value, with higher values indicating higher levels of expected market volatility (more fear or uncertainty), and lower values signaling calm or stable market conditions.
VIX Spikes: Large spikes in the VIX often correspond to market downturns or periods of heightened uncertainty, such as during financial crises or major geopolitical events. A high VIX is often associated with a drop in the stock market.
VIX Drops: A decline in the VIX indicates a reduction in expected market volatility, usually linked with periods of market calm or rising stock prices.
Trend Analysis: Technical traders might use moving averages or other indicators on the VIX chart to assess the potential for future market movements.
Inverse Relationship with the Stock Market: Typically, there is an inverse correlation between the VIX and the stock market. When stocks fall sharply, volatility increases, and the VIX tends to rise. Conversely, when the stock market rallies or remains stable, the VIX tends to fall.
A typical interpretation would be that when the VIX is low, the market is relatively stable, and when the VIX is high, the market is perceived to be uncertain or volatile.
ATR Volatility giua64ATR Volatility giua64 – Smart Signal + VIX Filter
📘 Script Explanation (in English)
Title: ATR Volatility giua64 – Smart Signal + VIX Filter
This script analyzes market volatility using the Average True Range (ATR) and compares it to its moving average to determine whether volatility is HIGH, MEDIUM, or LOW.
It includes:
✅ Custom or preset configurations for different asset classes (Forex, Indices, Gold, etc.).
✅ An optional external volatility index input (like the VIX) to refine directional bias.
✅ A directional signal (LONG, SHORT, FLAT) based on ATR strength, direction, and external volatility conditions.
✅ A clean visual table showing key values such as ATR, ATR average, ATR %, VIX level, current range, extended range, and final signal.
This tool is ideal for traders looking to:
Monitor the intensity of price movements
Filter trading strategies based on volatility conditions
Identify momentum acceleration or exhaustion
⚙️ Settings Guide
Here’s a breakdown of the user inputs:
🔹 ATR Settings
Setting Description
ATR Length Number of periods for ATR calculation (default: 14)
ATR Smoothing Type of moving average used (RMA, SMA, EMA, WMA)
ATR Average Length Period for the ATR moving average baseline
🔹 Asset Class Preset
Choose between:
Manual – Define your own point multiplier and thresholds
Forex (Pips) – Auto-set for FX markets (high precision)
Indices (0.1 Points) – For index instruments like DAX or S&P
Gold (USD) – Preset suitable for XAU/USD
If Manual is selected, configure:
Setting Description
Points Multiplier Multiplies raw price ranges into useful units (e.g., 10 for Gold)
Low Volatility Threshold Threshold to define "LOW" volatility
High Volatility Threshold Threshold to define "HIGH" volatility
🔹 Extended Range and VIX
Setting Description
Timeframe for Extended High/Low Used to compare larger price ranges (e.g., Daily or Weekly)
External Volatility Index (VIX) Symbol for a volatility index like "VIX" or "EUVI"
Low VIX Threshold Below this level, VIX is considered "low" (default: 20)
High VIX Threshold Above this level, VIX is considered "high" (default: 30)
🔹 Table Display
Setting Description
Table Position Where the visual table appears on the chart (e.g., bottom_center, top_left)
Show ATR Line on Chart Whether to display the ATR line directly on the chart
✅ Signal Logic Summary
The script determines the final signal based on:
ATR being above or below its average
ATR rising or falling
ATR percentage being significant (>2%)
VIX being high or low
Conditions Signal
ATR rising + high volatility + low VIX LONG
ATR falling + high volatility + high VIX SHORT
ATR flat or low volatility or low %ATR FLAT

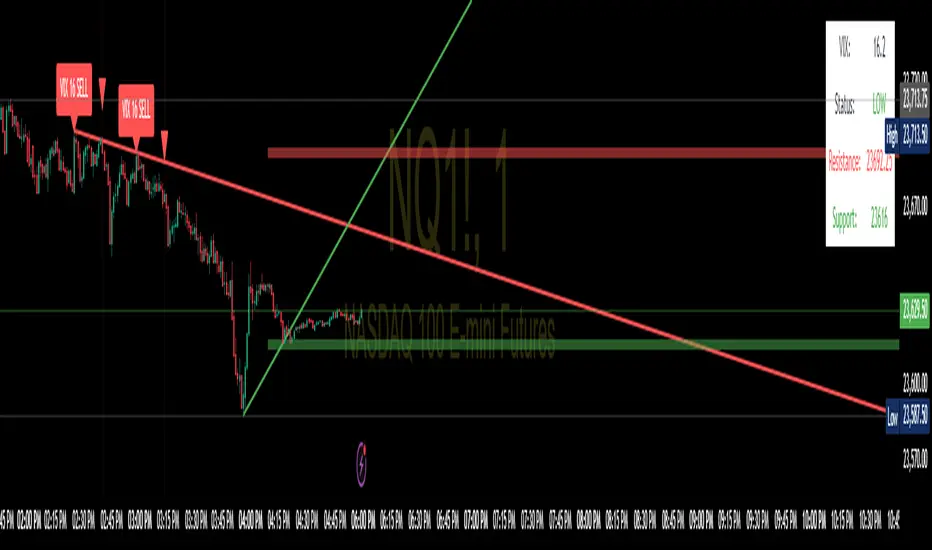
SPX Trendlines with VIX Levels By- Profit gang
This comprehensive technical analysis tool combines SPX trendline analysis with VIX volatility levels to help identify potential market turning points. The indicator is specifically designed with non-repainting logic to ensure reliability for both backtesting and live trading.
🔧 KEY FEATURES:
Non-Repainting Design: All signals and lines are drawn only on confirmed bars using barstate.isconfirmed
Dynamic Trendlines: Automatically draws support and resistance lines connecting recent pivot points
VIX Integration: Displays current VIX levels with customizable thresholds for market sentiment analysis
Multiple Visual Elements: Includes diagonal trendlines, horizontal level lines, and an information table
Comprehensive Alerts: Configurable alert system for both buy and sell signals
Clean Interface: Organized inputs and customizable colors for all elements
📊 TRADING CONCEPT:
The indicator utilizes the inverse relationship between VIX and SPX:
High VIX at pivot lows may indicate oversold conditions (potential buying opportunities)
Low VIX at pivot highs may signal complacency at market tops (potential caution zones)
🎛️ CUSTOMIZATION OPTIONS:
Toggle trendlines, VIX labels, and level lines independently
Adjust VIX thresholds (default: 25 high, 18 low)
Customize pivot length for sensitivity (default: 15)
Choose line styles (solid, dashed, dotted) and widths
Personalize all colors and alert preferences
📈 VISUAL COMPONENTS:
Red Lines: Resistance levels and trendlines
Green Lines: Support levels and trendlines
Information Table: Real-time VIX status and current levels
Signal Shapes: Triangle markers for confirmed buy/sell signals
Background Highlighting: Optional signal emphasis
⚠️ EDUCATIONAL PURPOSE:
This indicator is designed for educational and informational purposes. Past performance does not guarantee future results. Always conduct your own research and consider risk management before making trading decisions.
🔔 ALERT SYSTEM:
Separate alerts for buy and sell signals
All alerts trigger only on confirmed bars
Customizable alert messages with price and VIX data
Multiple alert condition options for flexible setup
Perfect for traders who want to combine technical analysis with volatility sentiment in a reliable, non-repainting format.
TCT - VIX Live DisplayA highly customizable VIX volatility indicator that displays real-time VIX values in a dynamic table overlay. Perfect for monitoring market volatility at your preferred timeframe and visual preferences.
Key Features:
Real-time VIX Monitoring - Live VIX data from CBOE with configurable timeframes (1min to daily)
Smart Color Coding - Automatic background color changes based on your custom VIX threshold
Fully Customizable - Adjust colors, text size, position, and threshold to match your trading style
Clean Visual Display - Prominent table overlay that doesn't clutter your chart
Customization Options:
VIX Threshold - Set your own volatility threshold (default: 20)
Color Scheme - Choose colors for high/low VIX states
Text Styling - Adjust text color and size (tiny to huge)
Position Control - Place the display anywhere on your chart (9 positions available)
Timeframe Selection - Monitor VIX at 1min, 5min, 15min, 30min, 45min, 1hr, or daily intervals
Perfect For:
Volatility traders monitoring market fear/greed
Risk management during market stress periods
Quick visual assessment of market conditions
Custom trading setups requiring VIX awareness
Usage: Simply add to any chart and customize the settings to match your trading preferences. The indicator will automatically update with live VIX data and change colors based on your threshold settings.
Rate Of Change - Weekly SignalsRate of Change - Weekly Signals
This indicator gives a potential "buy signal" using Rate of Change of SPX and VIX together,
using the following criteria:
SPX Weekly ROC(10) has been BELOW -9 and now rises ABOVE -5
*PLUS*
VIX Weekly ROC(10) has been ABOVE +80 and now falls BELOW +10
The background will turn RED when ROC(SPX) is below -9 and ROC(VIX) is above +80.
The background will turn GREEN when ROC(SPX) is above -5 and ROC(VIX) is below +10.
So the potential "buy signal" is when you start to get GREEN BARS AFTER RED - usually with
some white/empty bars in between...but wait for the green. This indicates that the volatility
has settled down, and the market is starting to turn up.
This indicator gives excellent entry points, but be careful of the occasional false signals.
See Nov. 2001 and Nov. 2008, in both cases the market dropped another 25-30% before the final
bottom was formed. Always have an exit strategy, especially when buying in after a downtrend.
How I use this indicator, pretty much as shown in the preview. Weekly SPX as the main chart with
some medium/long moving averages to identify the trend, VIX added as a "Compare Symbol" in red,
and then the Weekly ROC signals below.
For the ROC graphs, you can show SPX+VIX together, SPX alone, or VIX alone. I prefer to display
them separately because they don't scale well together (VIX crowds out the SPX when it spikes).
Background color is still based on both SPX/VIX together, regardless of which graph is shown.
Note that there is no VIX data available on Trading View prior to 1990, so for those dates the
formula is using only ROC(SPX) and the assigned thresholds (-9 and -5, or whatever you choose).
