EMA crossover (daily TF)This strategy is only applicable for daily timeframe only. EMAs have been smoothened out to make sure to include volatility glitches that may occur. I have used following conditions:
>EMA crossover of two frames already occurred
> Significant volume in the candle
> Candles are properly bullish or bearish not doji
> price is near EMA crossover
> trading stoploss to reduce risk as price follows the trend
Positive feedbacks are welcome for incorporation.
NSE:SRF
ابحث في النصوص البرمجية عن "volume"

Binance Estimaed Liquidations indicator/strategy
1) Provides ESTIMATED liquidation amount based od difference on volume between binance futures and coinbase spot(by default, you can change this)
2) Provides some strategies based on this numbers

ATR with EOM and VORTEXThis is a strategy, designed for long trends for stock and crypto market.
Its made of ATR for volatility, EOM for volume and VORTEX for the trend direction.
In this case on the ATR, I applied an EMA to check if current position is above the EMA -> bull trend, below ema -> bear trend
For EOM I am using the positive and negative value scale, if its positive we are in a bull movement, otherwise a bear movement.
Lastly for VORTEX, I took the min and max, and made an average, after that I am using the average and compare it with 1 value. Above 1 -> bull, belowe 1-> bear.
This strategy only goes long.
If you have any questions, let me know.

Carpe Diem [Strategy]Carpe Diem Strategy, a wave cycle strategy that only enters when markets are up trending.
The script uses 3 different trend detection indicators including volume which helps with confirmation.
This script has 10 variations built within it which are fitted for the coins differnt coinditions
The coins included are
BTC/USDT 4H
ETH/USDT 4H
LTC/USDT 4H
ADA/USDT 4H
BNB/USDT 2H
BAND/USDT 4H
BAT/USDT 3H
OGN/USDT 4H
ZIL/USDT 4H
BZRX/USDT 2H
How to use the Indicator
You can change what plots are shown in the settings Cog
When the wave lines are green, the market is up trending and will be looking for a trade whereas when they are red, the market is in a sideways or downtrend.
The buy signal is given by the fast wave either crossing over the slow wave line, or crossing over the value of 25.
The exit signal is when the wave crosses back under the 75 value
This strategy includes Fees and there is NO Repaint. The script is written in version 4
There is an option in the settings cog to choose from 10 Coins and timeframes which the Strategies have been optimised for.
There is also another option in the settings cog to change the backtesting range.
There is also another option to adjust the stop loss. I have left it on the Default value which I believe works best
This strategy performs best on the Binance listings

Combo Backtest 123 Reversal & Market Facilitation Index This is combo strategies for get a cumulative signal.
First strategy
This System was created from the Book "How I Tripled My Money In The
Futures Market" by Ulf Jensen, Page 183. This is reverse type of strategies.
The strategy buys at market, if close price is higher than the previous close
during 2 days and the meaning of 9-days Stochastic Slow Oscillator is lower than 50.
The strategy sells at market, if close price is lower than the previous close price
during 2 days and the meaning of 9-days Stochastic Fast Oscillator is higher than 50.
Second strategy
The Market Facilitation Index is an indicator that relates price range to
volume and measures the efficency of price movement. Use the indicator to
determine if the market is trending. If the Market Facilitation Index increased,
then the market is facilitating trade and is more efficient, implying that the
market is trending. If the Market Facilitation Index decreased, then the market
is becoming less efficient, which may indicate a trading range is developing that
may be a trend reversal.
WARNING:
- For purpose educate only
- This script to change bars colors.

trendOne [Strategy]BITSTAMP:BTCUSD
trendOne
(strategy-tester)
It is not recommended to use this script for generating alerts. Use "trendOne Alerts" instead.
This script combines all our previous trend-based scripts (Bows, Autopilot, Trend Indicator, Price Deviation, etc) in only one script .
To calculate the trend we use:
Volume Weight
Average True Range
Bows calculations
Trends smoothed with alma() function.
For more accuracy on the signals and to filter unwanted signals we layered slower time-frames in the background and added breaking support & resistance rules.
Inputs
Sensitivity
Integer input. Sets the sensitivity for signals generated up and down. Higher values will generate less signals on chart, and vice-versa.
Enjoy!
Disclaimer:
Back-tests do not guarantee performance on the future. Even if a trading setup is profitable in historical data, it could be unprofitable in the future.
To get access to this and other scripts check links below.

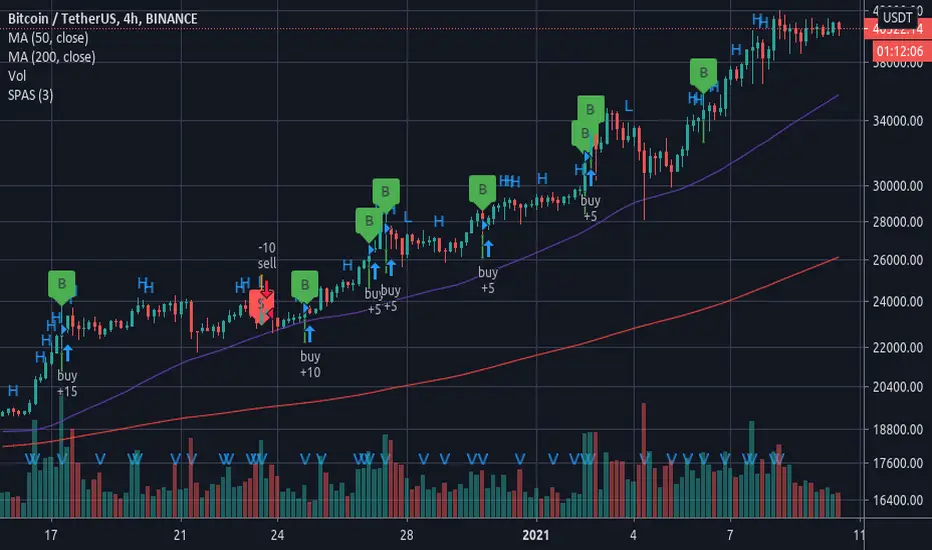
SPAS - Single Price Action StrategyThis strategy is based on a single price action analysis, where volume and price changes will trigger buy and sell orders. This strategy also can be used in combination with alerts to trigger orders in other exchanges or systems.
Best performance is currently achieved using 4H timeframe.
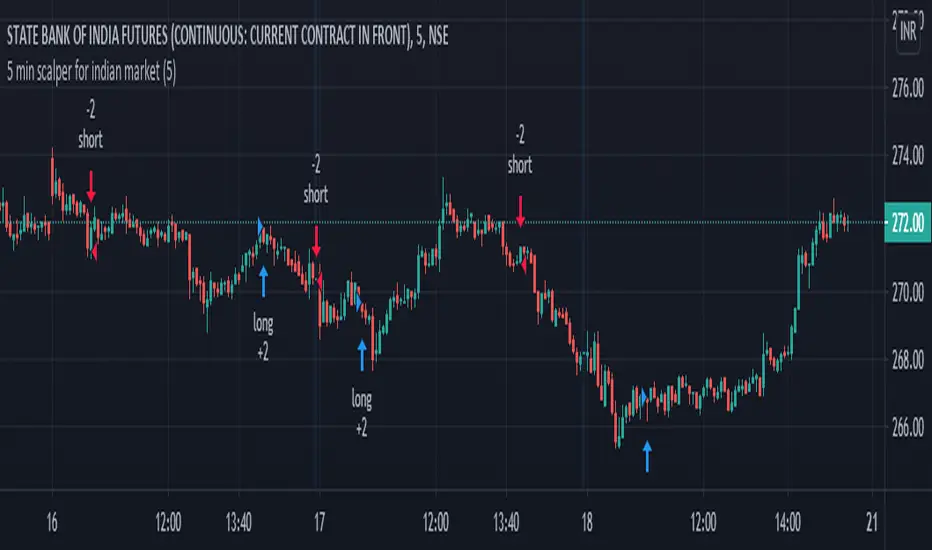
5 min scalper for indian marketHi friends....publishing 5 min scalper for indian market... which shows the movement of price over time and how strong those movements are/will be, regardless of the direction the price moves, up, or down. Indicator specifically useful, as it helps traders and analysts spot points where the market can and will reverse by providing signals long (buy) and short (sell). Show the relative strength of price movements but leave out the directionality of the price movements, best utilized in combination with other technical indicators – such as trend lines and moving averages – which show price trends and directions. Having an alert feature to make aware market players from signals provided by strategy.
It analyz underlying volume and shows buy and sell signal...
U also can modify algo length ..
some tips for new traders to become successful trader
1: always follow risk management...
2: every stock/ forex / crypto has it own cycle.. So pls dont jump from one stock / forex pair to another when u hear some stock / crypto has
made new high or low... Bcs after that consolidation period starts.. During consolidation we can not make more profit as in trending market.. So be patient when u had made some position or tarde in one stock/ pair...
3 : we dont require to trade in every stocks / forex/crypto.. Just one stock and pair trading daily make u profitable beyond ur expection.. Bcs
trading in one stock / forex pair.. make u very comfortable and u may always know its movement... And u also trade in every cycle of this
stock/ pair.. So u also trdae its trend days which made highest profit. We dont know when is trend of any stock... Compare with it
business... Trading is business not one day rich game... Its business... It takes time and u have to do same thing agian and again to become
sucessfull trader for this u can use tradingview alerts. .for that u dont need to seat infrot of ur terminal screen.. u can also do algo trading
by using tradingview alerts
4 : By following risk management and incerase lot size as profit increased... This is the key 🔑 of sucess in stocks / forex / crypto market.
I thinks this tips may help new trader. U can modified according to ur trading style..
You can personal message me if u want to use this strategy
******************if u want to use this indicator u can personal message me********************************************************
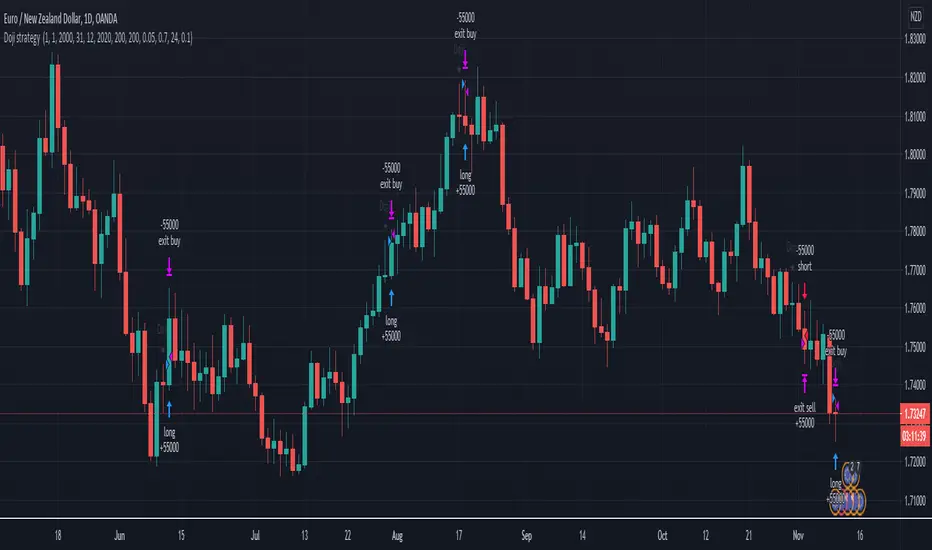
Doji swing strategyThis is a simple strategy based on Doji star candlestick
This strategy is suited for big time frames, like 4h -1Day and so on.
It places two orders: long at doji star high or previous candle high and short at doji star low or previous candle low.
It can also be applied volume average, in order to filter between trades .
This strategy works very well with high time frames like Weekly TF because it eliminates the noise in doji formation.
It also has inside a risk management made of SL/TP , or if not prefered it can exit based on a exit condition.
If you have any questions, please let me know !
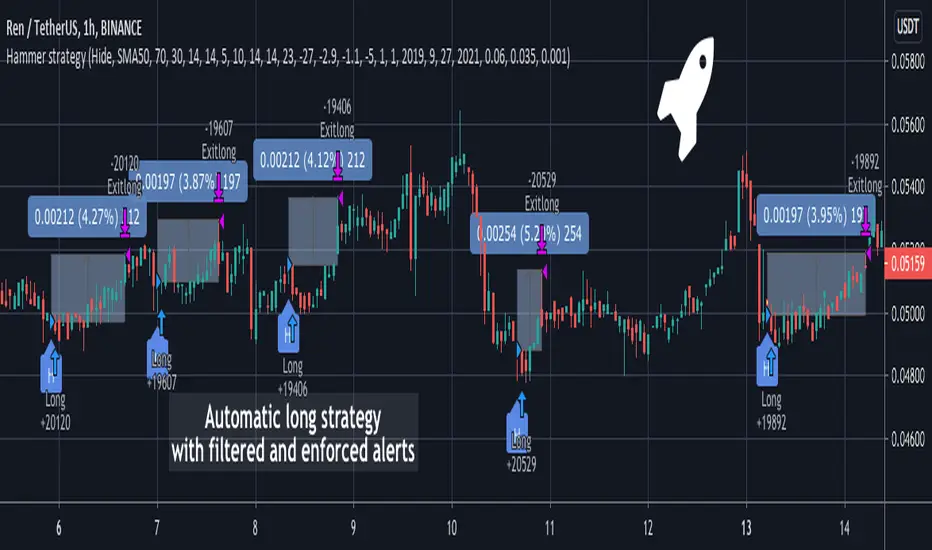
Hammer Long strategy with filtered and enforced alertsA Hammer Long strategy is a price pattern in candlestick charting that occurs when a security trades significantly lower than its opening, but rallies within the period to close near opening price. This pattern forms a hammer-shaped candlestick , in which the lower shadow is at least twice the size of the real body. The body of the candlestick represents the difference between the open and closing prices, while the shadow shows the high and low prices for the period.
Key takeaways:
Hammers have a small real body and a long lower shadow.
Hammers occur after a price decline.
The hammer candlestick shows sellers came into the market during the period but by the close the selling had been absorbed and buyers had pushed the price back to near the open.
The close can be above or below the open, although the close should be near the open in order for the real body to remain small.
The lower shadow should be at least two times the height of the real body.
Hammer candlesticks indicate a potential price reversal to the upside.
The strategy enhances standard Hammer pattern accuracy by clearing out market noises and manipulations from the indicator's triggers. Combination of Volume oscillator filter and Directional Movement Index (DMI) components values adjustments allows to detect only strong signals. The strategy is developed to forecast Long positions entries and exits. The strategy supports spot, futures, options and marginal trading exchanges. It works accurately with BTC, USD, USDT, ETH and BNB quote currencies. Best to use with 30 and 60 minutes timeframe charts. The strategy can be and should be configured for each particular asset. You can change filters and risk management settings to receive the most advanced accurate alerts
Advantages of this script:
1. Weak signals and market noises are filtered. This allows to receive only strong and confirmed alerts
2. Strategy can be easily configured in user interface for each particular asset
3. High performance. At the chart you can see examples of strategy entries and exits, you also can check strategy backtest for RENUSDT position:
Net profit: 26.95%
Percent profitable: 90%
Profit factor: 7.418
Duration of trade: 16 hours
How to use?
1. Apply indicator to the trading pair your are interested in at 30m or 60m timeframe chart
2. Configure the strategy: change filters values and risk management settings until Strategy tester shows good results according to mathematical expectation
3. Set up a TradingView alert to trigger when Hammer strategy conditions are met
4. Strategy will send alerts when to enter and when to exit positions
If you want to obtain access to the indicator please send us a personal message
TC Chart Score StrategyThis is My Call Confidence Strategy
The Strategy is designed to help confirm a bullish reversal after a downtrend.
This uses custom weighted algorithm
The Algorithm combines directional movement, volume over average, and moving averages to formulate a score.
The score is then used in conjunction with a smoothed score of the same criteria to initiate a buy signal on a cross over.
The settings are designed to help you customize how you weight directional movement, and the moving averages to further finetune the algorithm to your timelines.
The default settings are designed to be used on a 1 hour time frame.
You can change the settings for other time frames to further increase effectiveness.
This script will be updated as needed if a better algorithm is designed.

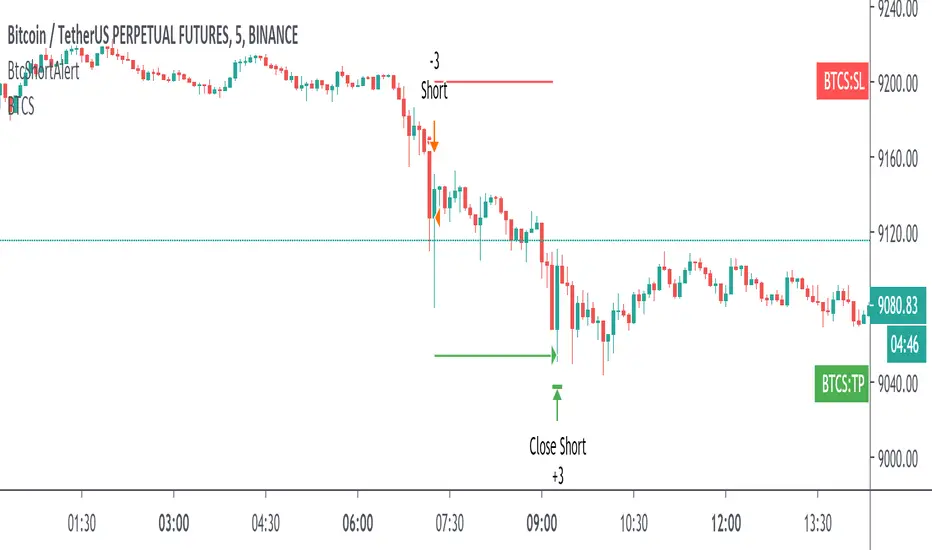
Btc Short StrategyBINANCE:BTCUSDTPERP
Developed for the btc perpetual future contract on Binance Futures .
How to Use:
It's based on a complex strategy for short positions that involves volume analysis, trend analysis, moving averages, supports and resistances and more.
Concretely this indicator opens a short position when there is a bearish trend and a breakout of a support zone and uses fear and volatility to take an edge on the market.
It runs on the 5 min chart for the entry , and it analyses higher timeframes.
It opens and close sell positions and automatically draws SL and TP. The R/R is 1:1.
It's possible to enable alerts of the strategy in order to be notified whenever the indicator opens or closes a position . You can use it in addiction of your strategy or for educational purposes .
(This indicator will be updated when/if there will be a change in the bias of the market)
Access must be given by me to test this. Once access given you can test.
PM me or use the links below to obtain access to this indicator.
Backtesting Results:
Initial Capital= 10000
Order Size= 3 contracts (max loss 2.15% of the capital)
Commission= 0.075% (same of VIP0 of binance)
Slippage=10 ticks
Reviews and Feedback are welcome.
Refer the Release notes for any updates and my posts below and in my idea page for more details.
Report any issues or ideas to me, I'll fix them !
Thank you !
DISCLAIMER:
All trading involves high risk: past performance is not necessarily indicative of future results. Hypothetical or simulated performance results have certain inherent limitations. Unlike an actual performance record, simulated results do not represent actual trading. Also, since the trades have not actually been executed, the results may have under- or over-compensated for the impact , if any, of certain market factors, such as lack of liquidity. Simulated trading programs in general are also subject to the fact that they are designed with the benefit of hindsight. No representation is being made that any account will or is likely to achieve profits or losses similar to those shown.
MystockMoney Trend Trading Tool 0.2THIS INDICATOR IS ADVANCE VERSION OF MystockMoney Trend Trading Tool
This indicator is a trend following indicator its a mix of CPR , VOLUME + TREND INDICATOR. This will help You to understand Market Trend.
CPR Frank Ochoa call it It Pivot Range Histogram in his book.
Use it in conjunction with the Central Pivot Range indicator.
Once the trigger of the trend direction is made, the FollowLine will be placed at High or Low (depending of the trend).

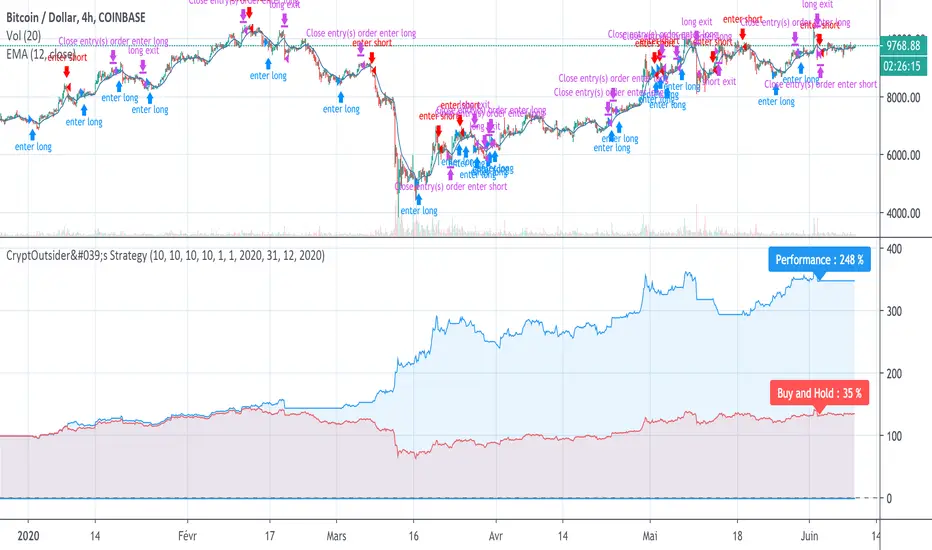
CryptOutsider's StrategyDear Tradingview user,
The present script is a BTC strategy backtest tool based on a proprietary algorithm. The performance calculated (blue on the graph) is compared to a "Buy and Hold" position (red on the graph). You can also compare it with other published strategies or even your own one !
It works with buy/sell signals of an oscillator calculated with both price and volume, evaluating accumulation and distribution over a period.
Please use the ticker COINBASE:BTCUSD, on a 4h resolution (or it won't work).
By default the following conditions used are :
Relative part of equity invested per trade : 10 %
Initial capital : 100 $
Leverage : x10
Commission fees : 0,1%
Slippage : 5 ticks
Feel free to change it in order to reflect your commission or slippage conditions on the strategy's panel (double click on the equity curve or the configuration button). Conditions can also be changed in order to improve performance while seeking a bearable drawdown (speaking of which, a relative part equity could be increased up to 30% with an acceptable drawdown).
Starting and finishing dates for the backtest can also be changed in the panel.
All the best using the strategy !
CryptOutsider
Remark : The backtesting timeframe is partial as the very last week is not available.
MystockMoney Trend Trading ToolThis indicator is a trend following indicator its a mix of CPR , VOLUME + TREND INDICATOR. This will help You to understand Market Trend.
CPR Frank Ochoa call it It Pivot Range Histogram in his book.
Use it in conjunction with the Central Pivot Range indicator.
Once the trigger of the trend direction is made, the FollowLine will be placed at High or Low (depending of the trend).

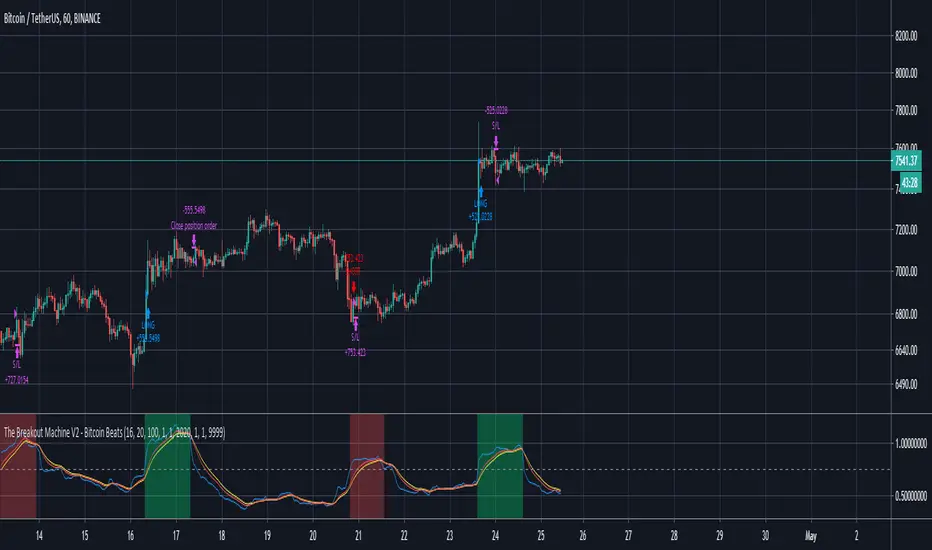
The Breakout Machine V2 BTCUSDT - Bitcoin BeatsHello, Hello, Hello and welcome back to Bitcoin Beats.
As the title suggests, this is Version 2 of The Breakout Machine. Unlike the previous version, this one has been fine-tuned to work best on Binance Futures(BTCUSDT).
The stats shown below are from 2020.
PLEASE BE CAREFUL WITH YOUR LEVERAGE AND DON'T GET REKT.
Trade at your own risk! Good luck!
This strategy takes MACD and Volume spikes to calculate pumps and dumps in the bitcoin market.
I've also added custom backtesting inputs and leverage for you all to experiment with and see the profitability of the Strategy.
Alerts version coming soon...
Thank you, And goodbye, from Bitcoin Beats.
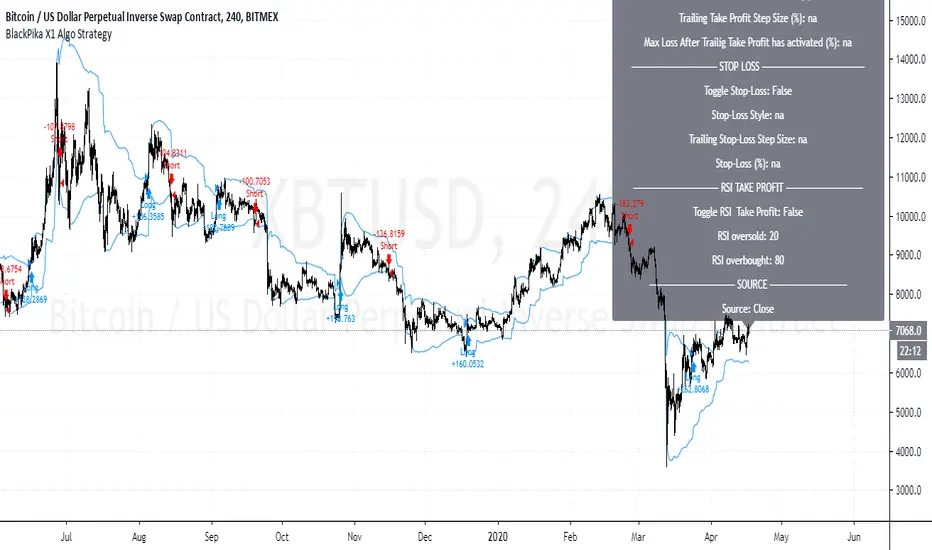
BlackPika X1 Algo StrategyBlackPika X1 Algo is a successor to the original BlackPika Algo.
It uses the following main elements:
RSI
ATR
ADX
Volume
Chopiness Filter
Trailing Profit
Fixed Profit
Trailing Stop loss
Fixed Stop Loss
Donchian channels and some more...
The backtest you see includes a commision of 1% and slippage of 1 tick. and the start date is from 2015
All the above mentioned settings are customisable, and can be adapted to your liking, timeframe and Asset.
Hit me up if you have any questions. This is only a backtest version.
All the best in your trading.
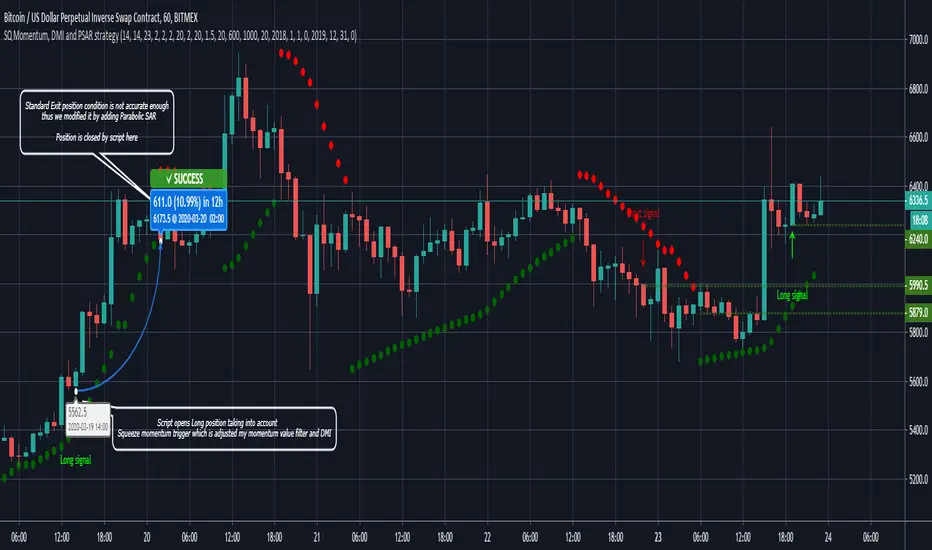
Sqeeze Momentum, DMI and Parabolic SAR strategyThe script combines Sqeeze Momentum, Directional Movement Index (DMI) and Parabolic SAR indicators in long and short scalping strategies
When conditions of long or short position from all mentioned indicators are met script opens position. Once trend changes it closes position and fixes profit
Advantages:
1. Deal start condition includes the folowing filters and requirements:
- Momentum value is adjusted using a relative proportion of volume at each timeframe scale to exclude a chance of opening position at a low impulse stage
- Squeeze momentum trigger condition is automatically checked before a position is opened
- +DI , -DI and ADX values are taken into account to confirm the trend direction
- Position size is taken into account to ensure there will not be opened any excess deals or alerts
2. Exit deal condition was modified using Parabolic SAR indicator. Hence, it is ensured positions will not be closed in a middle of a trend
3. Study is modified into strategy allowing you to use it directly through the trading panel
If you want to obtain access to the strategy please send us a personal message
TimeMachineInspired by Time Travel concepts. Suitable for intermediate & short time frame crypto trading. Based upon MACD + stochastics + volume analysis, yet consults R2D2 indicator for confirmation.

Combo Backtest 123 Reversal & EMA & Volume WeightingThis is combo strategies for get a cumulative signal.
First strategy
This System was created from the Book "How I Tripled My Money In The
Futures Market" by Ulf Jensen, Page 183. This is reverse type of strategies.
The strategy buys at market, if close price is higher than the previous close
during 2 days and the meaning of 9-days Stochastic Slow Oscillator is lower than 50.
The strategy sells at market, if close price is lower than the previous close price
during 2 days and the meaning of 9-days Stochastic Fast Oscillator is higher than 50.
Second strategy
The related article is copyrighted material from Stocks & Commodities 2009 Oct
WARNING:
- For purpose educate only
- This script to change bars colors.

CS Trading Bot Strategy - Crypto EditionWhat is this strategy about?
The CS Trading Bot Strategy is for researching the most lucrative Crypto assets to be selected for in the corresponding Study (that actually generates alerts/signals).
The Strategy is very profitable for a vast amount of Crypto assets and the algorithm behind is not overfitted.
How to use it?
As a rule of thumb, the best time-frames are the 4h, 3h, 2h and 1h (sometimes 30M and 45M).
For many high profile/volume assets such as BTC, ETH and XRP the Daily is very profitable, as well. Weekly and Monthly time-frames should be avoided.
It is not recommended to apply this strategy to new assets with only a few weeks of history. I recommend a history of at least 6 months and 5 trades in the Strategy stats.
In the Strategy settings, you can adjust the time-span to see how the Strategy performs in certain conditions like bear-markets (see for example 4H on BTCUSDT from Jan 2018 - March 2019).
What to look for on researching?
If you are researching, make sure to look for these metrics in the Strategy overview:
Linear equity growth (especially over a larger period of time)
Low drawdown
Profitability above 50%
Average gain per trade of 5%
A satisfying profit for your selected time-span
Min. 5 trades, better 10
Min. 6 Months time-span
As a head-start, I suggest to research on the following assets, so you get a feeling about what to look for based on the list above:
POLONIEX:BTCUSDT
POLONIEX:ETHUSDT
POLONIEX:XRPUSDT
Why Poloniex? Because it has a long history for these assets...
Once you determined your favorite assets, you are ready to add the corresponding Study and within, set alerts for them.
Here the Webhooks are very interesting as you can forward your signals to your own trading bot or simply wait until my trading bot is available (currently in development)
Since I develop myself, rest assured it will be available soon. Look out for comments below as soon as it is available!
The bot is a commercial package including:
This Strategy for finding the best assets
The Study for setting alerts based on the best assets (webhooks, emails, popups, etc)
Access to our automated trading bot (separate download, as soon as available)
How to access?
If you are interested to get access to the complete package, please don't hesitate to send me a private message for a quote.
The amount of concurrent users using the package (=licenses) is limited to max. 500 a month (more we cannot manually handle has Tradingview has no automation for this yet).
Access to the bot package is based on a monthly basis. If you get access, you will asked in person at the end of the month if you want to continue or not.

StarfighterInspired by X-Wing Rebel Alliance Starfighters. Suitable for intermediate & short time frame crypto trading. Based upon MACD + stochastics + volume analysis, yet consults R2D2 indicator for confirmation.

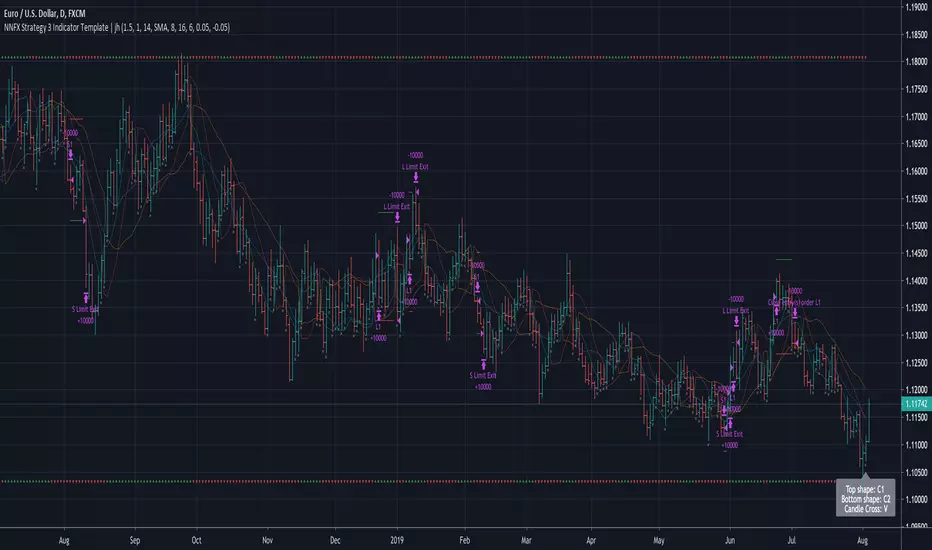
No Nonsense NNFX VP Strategy for Back Testing 3 x Indicators| jhAfter testing your individual indicators, it's time to build up your algo with additional indicators and further backtest the strategy.
Using SSL twice here, faster SSL for 1st confirmation, slower SSL for 2nd confirmation and TDFI for volume validation.