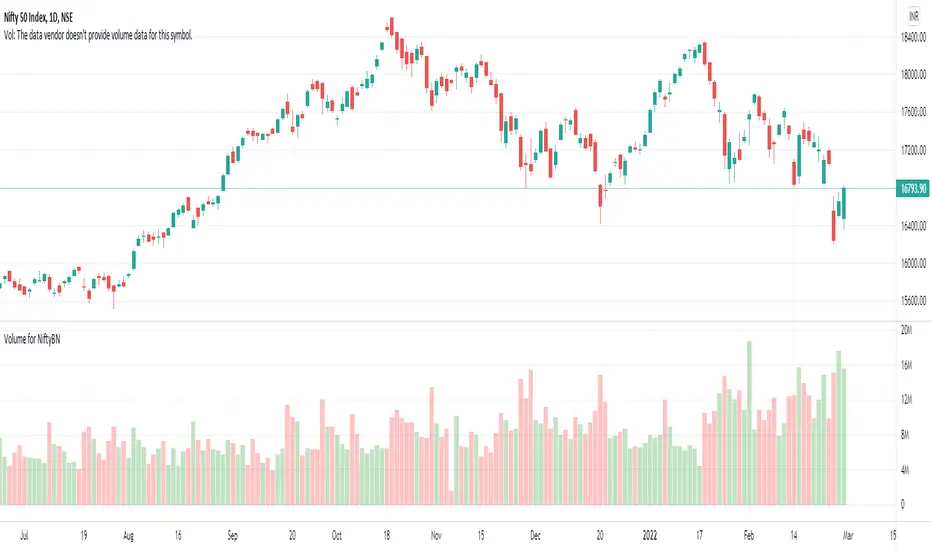
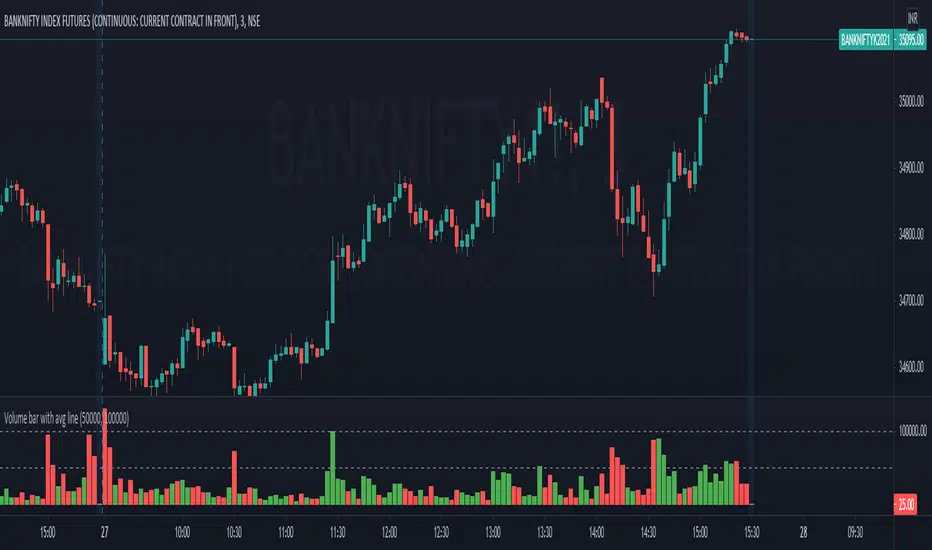
Volume for NiftyBNTo see the volume of Nifty and Banknifty indices we often refer to their Futures chart. With the help of this script, you can directly plot the volume of Nifty Futures over the Nifty chart and Bank Nifty Futures over the Bank Nifty chart.
If the scrip entered is other than Nifty or Bank Nifty it will plot the default volume of that scrip.
ابحث في النصوص البرمجية عن "volume"
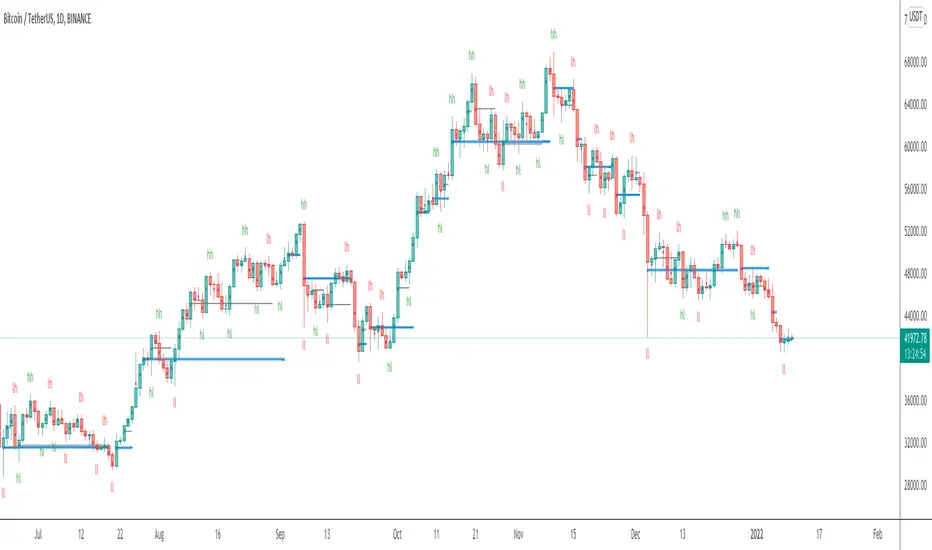
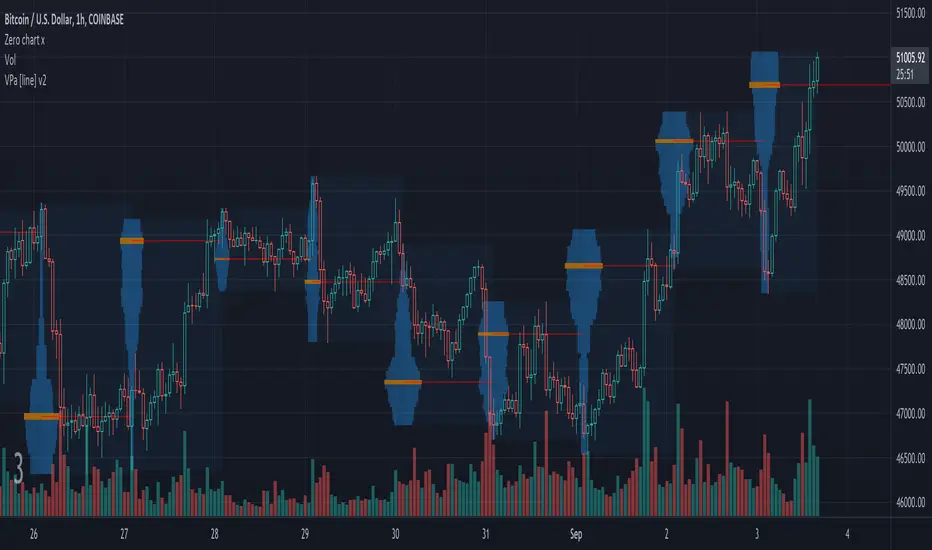
Volume based support resistance with SwingThere has been an endless debate on how to derive volume levels on the Price Action
One such method which I have encountered (being pointed by one of my followers Anjan Gadade)
is to take the (High+Low+close)/3, as an ambient level when volume is above average (sma20) and also when volume is above its Standard Deviation 2
To make sense of the volume level structure I tested it with Swing points, for extra confluence, and i must say, this can be used as a good indication of trend if combined together
So I thought to open Source it, to people who might be looking for a much visual Interpretation!
Enjoy!
Volume Bar Breakout and Breakdown IndicatorVolume shows strength of a movement and highest volume shows the region that pushed price to certain extent with full strength. Breakout or Breakout of the highest volume bar range shows continuity further push by sellers or buyers indicating a trend continuation for a small period if not for long duration. Entries can be taken once signal is generated with stoploss as recommended.
Guidelines:
Don't trade if range is too large
Don't trade if Breakdown or Breakdown candle body / range is too large or if there is high volatility
Use additional indicator to get the idea of overall trend analysis

Volume BiasHere’s an indicator that calculates the difference between the average distance we need to look back to find the up and down volume equal to the total volume of the last n bars. The further we need to look back to find the up or down volume, the more bearish or bullish its value is.
A not-yet published indicator from the PS-V5 blog!

Volume and Moving average,will this model working in real-trade?i`ve recently made this script through few month,understand me if there are some incorrect grammar or something.
basically this script is based on moving average strategy and the bollinger bands
if the buy volume is bigger than sell volume,also buy volume is bigger then daily average volume than it`s defined current market is bullish and entered(of course there is some other conditions)
the exit condition is find the highest price after entered,keep refresh the highest price through time and then,if the current price is ?%lower then highest price,it will closed the position.
my question is this : 1 this model will working in real-trade?
2 why the winning rate is 100%?
- i`ve coded if the position margin over -10%,close the position this code isn`t work? or the other profit line is prevent that happened?
Volume Power Flow - Taylor V1Combination of Volume Average Trend & Volume Power Range
Able to Change Average Moving Type & Length = Depending on How Volatility /Smooth is Require on your Strategy
1# Color Green = The Volume On Trend Up
2# Color Red = The Volume On Trend Down
3# Spiking Higher Volume = End of the Top/ Bottom
Volume Profile Auto [line]This project is about:
- VPSV
- array.new_line()
- array.new_box()
VPSV (pine) is one of the rare features that draws lines/figures BETWEEN bars
It doesn't run on Pine script, which makes it possible to do such things.
I wanted to have something similar while a restriction of Pine script is the impossibility to draw between bars, the only way I could think of is by using line width
In this script the higher timeframe is started with several lines (left) and a box, this box goes further until the higher timeframe ends.
During the creation of the box, each candle (lower timeframe) in this box (higher timeframe - period) is checked for position and volume, the volume is added to the left line, so when you see a thicker line, this means at that level there is more volume traded.
One of the big differences with other volume profiles is that many look back to a previous period, here when a period starts, the lines collect data - volume until the period ends, it is especially very visible in very low TF's (seconds)
This is my first script with array.new_line() - array.new_box(), which is a very nice Pine feature!
I hope this script can be helpful to see the possibilities
Settings:
'Parts' -> amount of lines (left of box)
5 Parts:
15 Parts:
25 Parts:
50 Parts:
'Max Width' -> Sets the max width of the lines
'Automatic Settings' -> Sets the higher time frame automatically, see the tooltip ⓘ for more info
The yellow line is the max volume line of that period, last period has a red line (POC), also referring the max.
Cheers!
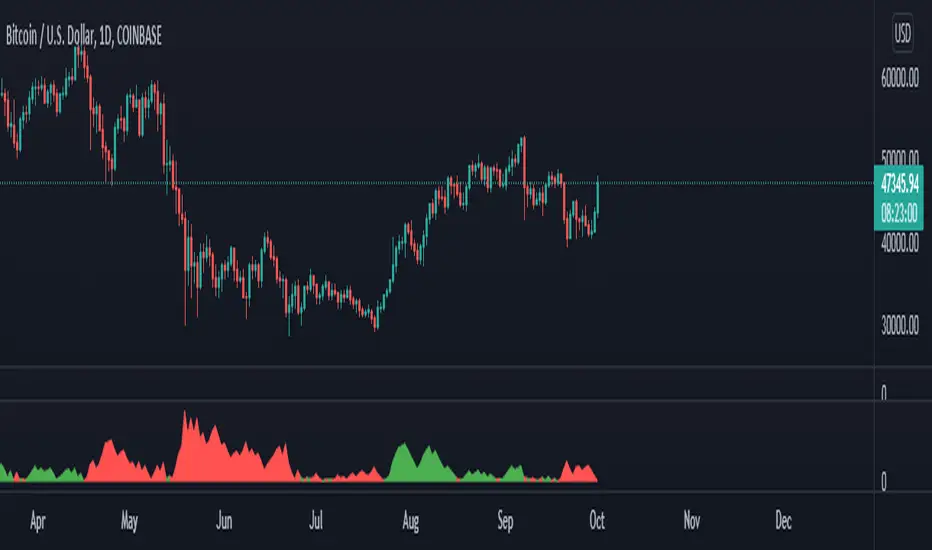
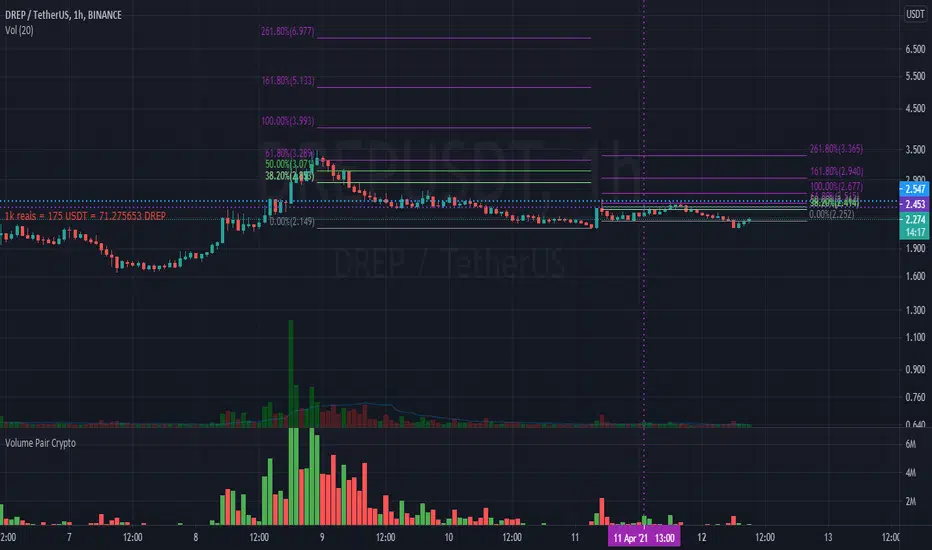
Volume price action and reaction index V1.0 (VPARI V1.0)Volume indicator adjusted according to price movement.
It is used to confirm entry into trades , Each candle represents a measure of the strength of the change in volume with the price calculated by more than one mathematical equation.
the best way to use :
Divergence, either positive or negative
It is used with Crypto currencies and stocks, not suitable for use with commodities .
The example is shown in the attached chart .
If you like it, don't forget to comment your experience using it.

Volume Average / Current Volume / ATR On ChartSimple Study to display volume data and atr value on the chart. It will display the relative volume in percentage, an average volume and the current volume and ATR value for the time resolution.
Thank you to @PriceCatch for the ATR code

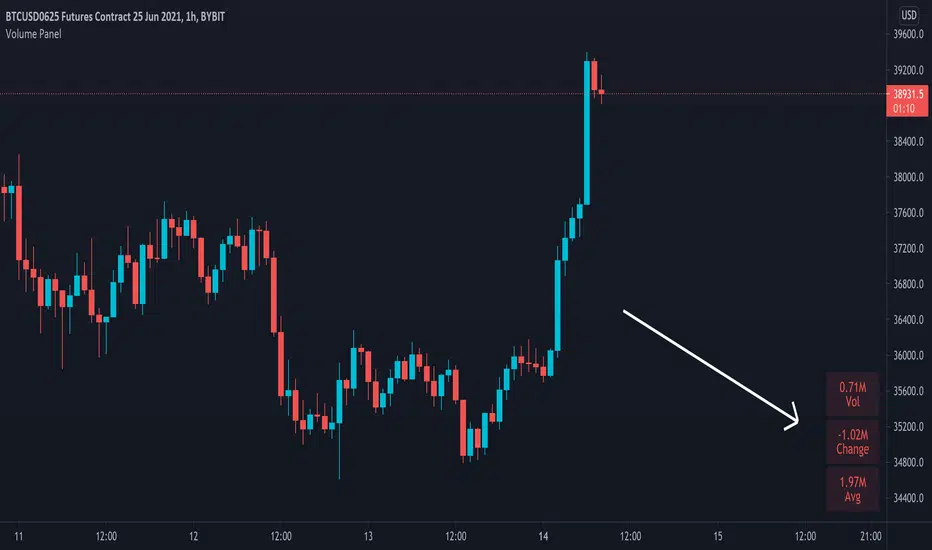
Volume PanelDisplays volume data in panel on bottom right of screen. Shows current bar, change from last bar and average of last 20 bars. This number can be changed in settings if you wish to have the average calculated on a different amount of bars.
Relative VolumeVolume can be a very useful tool if used correctly. Relative volume is designed to filter out the noise and highlight anomalies assisting traders in tracking institutional movements. This tool can be used to identify stop loss hunters and organized dumps. It uses a variety of moving averages to hide usual activity and features an LSMA line to show trend. Trend columns are shown to highlight activity and can be seen at bottom of the volume columns, this is done using ZLSMA and LSMA.
The above chart shows an example of 2 indicators being used on the 15 min chart. The bottom indicator is set to the 1 min chart. Traders can see a large dump on the 1 min chart as institutions wipe out any tight stop losses. Next they buy back in scooping up all those long positions.
This is an example layout using a split screen setup and multiple timeframes ranging from 1 min to 30 mins. This gives a clear indication of trends and make it easy to pickup on institutional behaviour. Tip: Double clicking indicator background will maximize RVOL to the split screen window.

Volume Pump WaveThis indicator displays volume as a pump wave. Can be useful for chart analysis and easy detection of anomalies/trends.

Volume Indicator wih EOD volume predictionThis indicator displays the volume of each session in a similar manner of the default volume indicator
However it add on the last bar a green bar that shows the expected volume for the end of the session
One might use it to anticipate the end of day volume and decide if the current price action is strong or not
This might also be used to anticipate the appearance of a pocket pivot signal or buyable gap up
This indicator is designed to be used on daily chart exclusively
Volume PressureThis script modified from @the_akechi's VolumePressure
The sum of buying and selling volume is NOT always equal to the total volume using the original script because the 2 columns are overlaid, not stacked

Volume & Configurable Moving Averages [LevelUp]Volume with Configurable Moving Averages displays volume based on the current timeframe. For example, on a daily chart the volume shown is for the day. On a weekly chart, the volume is cumulative for the week.
There is also an option to configure the volume moving average lengths. The default for a daily chart is to calculate the 50-day moving average. On a weekly chart, the default is the 10-week moving average.
Features:
■ Configure moving average lengths for various chart timeframes.
■ Set width of volume bars.
■ Option to set bar color based on the previous close.
Learning Pine Script / Creating Your Own Indicators
One goal of this indicator is help others who are interested to learn Pine Script. The code is open source and I've included an abundance of comments. In future updates, I'll show additional Pine Script features and scripting concepts.

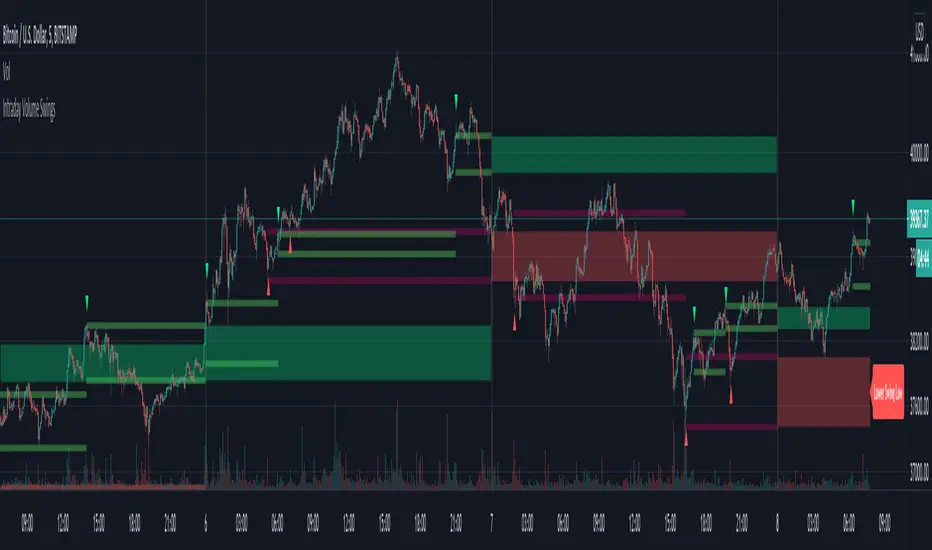
Intraday Volume SwingsVolume swings are defined as increasing volume and higher highs/lower lows over a minimum of three bars.
This script tracks volume swings over an intraday chart and stores the final lowest low swing / highest high swing over the course of the day. The final high swing and low swing are then plotted over the following day as possible retracement / support & resistance levels.
Intraday levels for the current day can also be displayed, which may or may not be the final swings for the day, but are also possible areas of interest.
See code for additional notes.
Volume-Supported Linear Regression TrendHello Traders,
Linear Regression gives us some abilities to calculate the trend and if we combine it with volume then we may get very good results. Because if there is no volume support at up/downtrends then the trend may have a reversal soon. we also need to check the trend in different periods. With all this info, I developed Volume-Supported Linear Regression Trend script. The script checks linear regression of price and volume and then calculates trend direction and strength.
You have option to set Source, Short-Term Period and Long-Term Period. you can set them as you wish.
By default:
Close is used as "Source"
Short-Term Period is 20
Long-Term Period is 50
in following screenshot I tried to explain short term trend (for uptrend). Volume supports the trend? any volume pressure on trend? possible reversal? same idea while there is downtrend.
in following screenshot I tried to explain long term trend:
You can also check Positive/Negative Divergences to figure out possible reversals (to automate it, you can use Divergence for Many Indicators v4 , it has ability to check divergences on external indicators)
Enjoy!

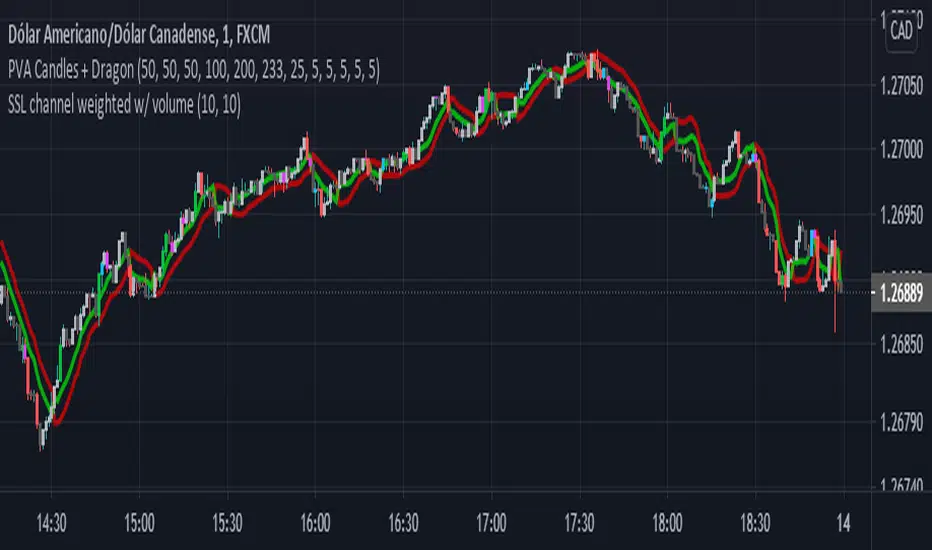
Volume Weighted SSL ChannelVolume-weighted SSl channel.
new concept of indicator that does not have in the entire library, different from SSL based on EMA or MA, this indicator can identify turns faster than a conventional indicator that only takes into account the price.
Enjoy and give the feedback.
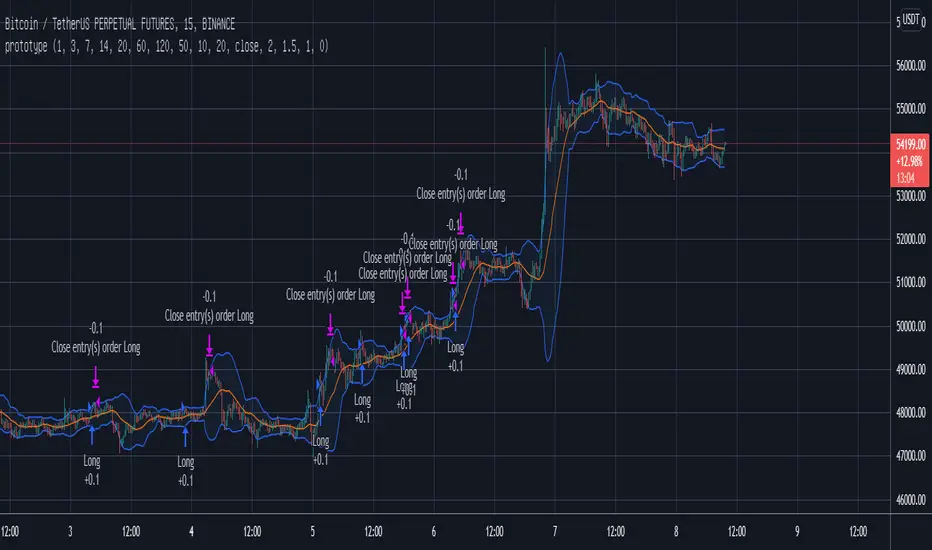
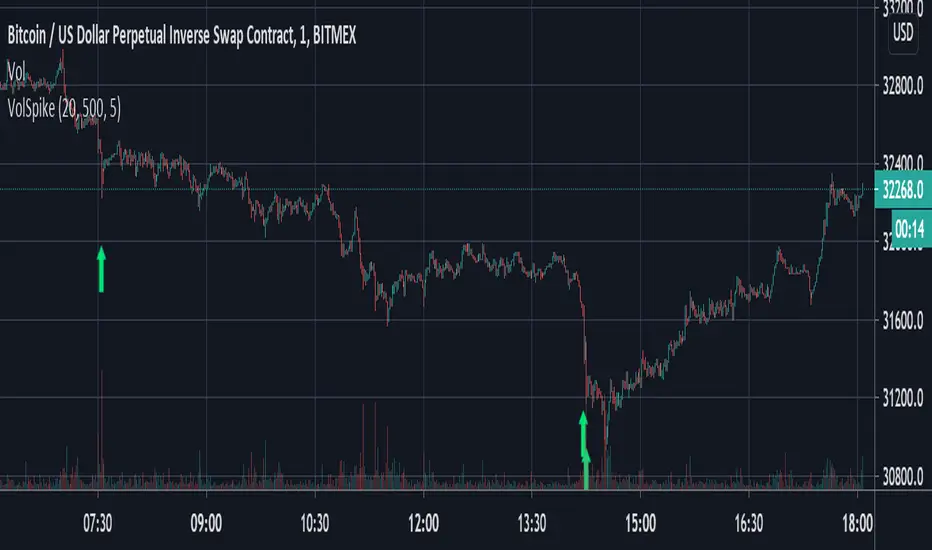
Volume Spike Strategy This is a Pine Script implementation of “Capitalize AI: Volume Spike Strategy" by Bitcoin Trading Challenge (copied with permission).
Original Capital AI formula :
If BTC/USD 1 minute volume > BTC/USD average volume in 20-1m bar by at least 500% and if BTC/USD is below the MA (5,1m,close) of BTC/USD then buy 10,000 USD WORTH of BTC/USD
Tested on XBTUSD 1 minute.
Original strategy is buy-only. Option for sells was added (enable in settings).
First published script -- comments/feedback appreciated
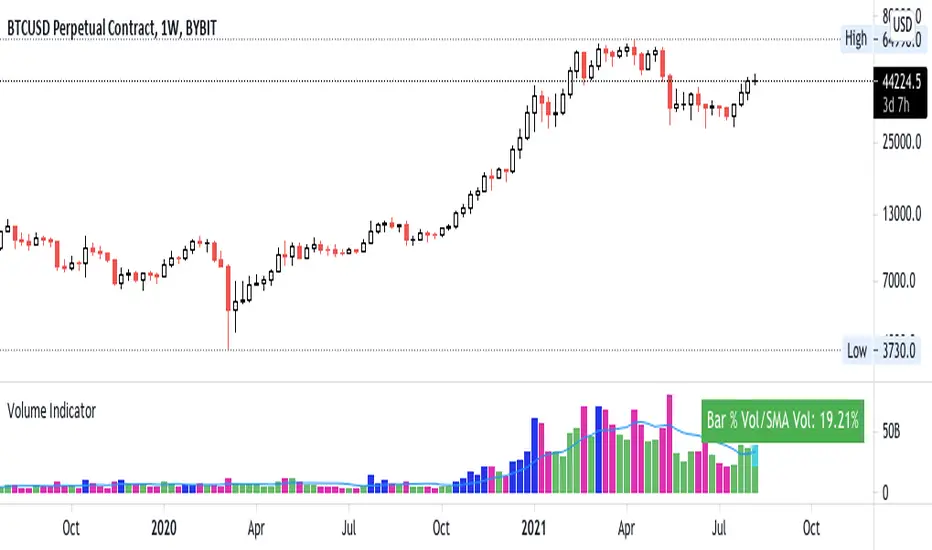
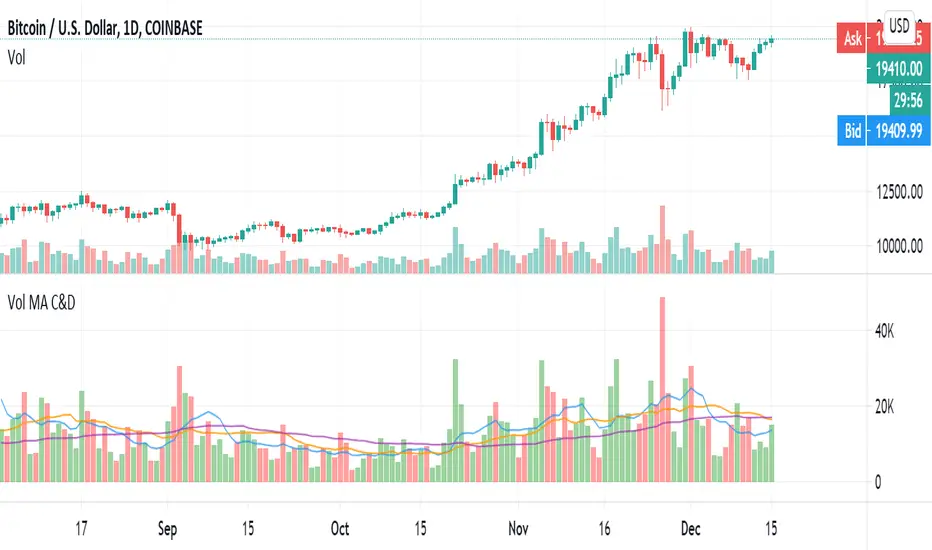
Volume MA Convergence and DivergenceGreetings, I imagine there is already some similar scripts as this one but I couldn't find one so I decided to add something.
We are looking at convergence and divergence signals of moving-average values of 3 different volume time frames. The time frames can of course be tweaked to ones liking, I set up Vol-MA8, 20 and 50. A strong enough divergence in at least 2 of the MAs may perhaps signal an exhausting trend or the beginning of a new one. Convergence of all three to a single point, or close enough to, may signal impending volatility potentially. The latter would best be complimented with another volatility predicative indicator or correlating impending price change data. There are more signals to be studied within this single indicator such as a converging occurrence above OR below the mean, etc, etc.
@OptiSean on Twitter
Enjoy, Cheers
Volume Bars and Regions of InterestThe bars are colored according to the volume traded. The volume weights were distributed logically for a better analysis.
<0.666 low volume
0.666 to 1.333 median volume
1,333 to 2,666 high volume
> 2,666 'institutional' volume
The moving average bands are the average of the highs and lows. They show a region of interest and not just a 'line'.
