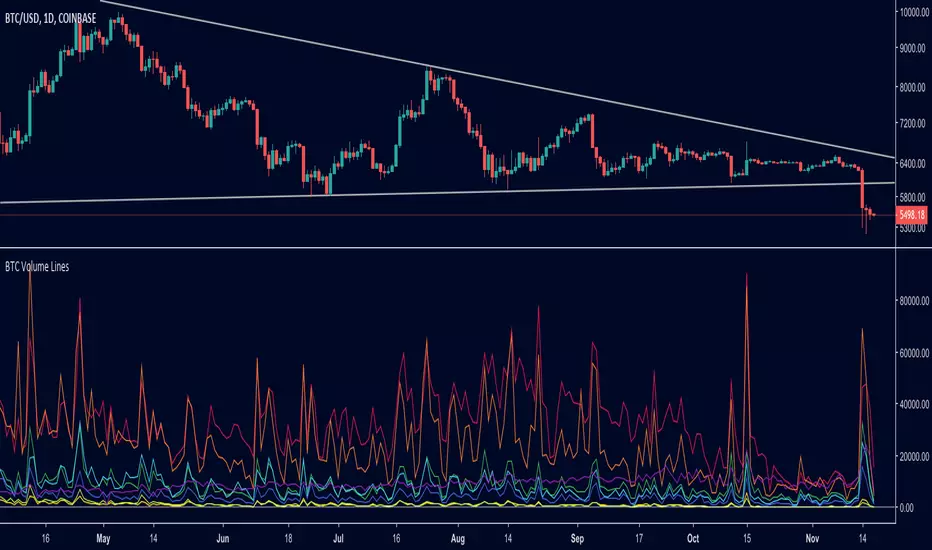
BTC Volume Lines [v2018-11-17] @ LekkerCryptisch.nlCombine the volume of 8 BTCUSD exchanges in one graph.
Three use cases:
1) See the absolute volumes in one graph
2) See the relative volumes in one graph
3) See the deviation of the EMA the volumes in one graph
ابحث في النصوص البرمجية عن "volume"
Smart Volume Radar (TR/EN)
ENGLISH DESCRIPTION
Stop guessing the volume bars! This indicator is designed to be a "Decision Maker" for traders who want to understand the true power behind price movements instantly. It replaces complex volume analysis with a simple, high-contrast dashboard.
Key Features:
🚦 Traffic Light Logic: The entire panel changes color based on the volume status.
Dark Green: Volume is above average (Fuel is ready 🚀).
Dark Red: Volume is below average (No interest / Trap Zone ⚠️).
📊 RVOL (Relative Volume): Shows exactly how many times the current volume is compared to the average (e.g., 2.5x).
🧠 Trader Logic (Smart Status): It doesn't just show numbers; it interprets them for you:
DEAD: No liquidity, stay away.
STANDARD: Routine market flow.
POWER ENTRY: Ideal volume for breakouts.
ULTRA HIGH (FOMO): Warning! Volume is too high, a reversal might be near.
👀 High Contrast Design: Dark solid backgrounds with white bold text for maximum readability on any chart.
How to Use:
Look at the panel color. If it's RED, ignore breakout signals (likely a fakeout).
If it's GREEN, check the "Trader Note" at the bottom.
If you see "POWER ENTRY", the trend is supported by real volume.

RVOL Highlighter (Bullish Volume Spikes)Description:
A simple yet powerful indicator that highlights candles with unusually high buying volume.
What it does:
Identifies candles where relative volume (RVOL) exceeds your chosen threshold AND the candle is bullish (green). These high-volume bullish candles often signal strong institutional buying interest or momentum breakouts.
How it works:
Calculates RVOL by comparing current volume to the simple moving average of volume over your selected period
Only highlights candles that meet BOTH conditions: RVOL above threshold + bullish close
Highlighted candles appear in bright magenta for easy visibility on dark mode charts
Settings:
RVOL Period: Lookback period for average volume calculation (default: 10)
RVOL Threshold: Minimum relative volume multiplier to trigger highlight (default: 2.5x)
Highlight Color: Customizable (default: magenta #FF00FF)
Use cases:
Spot potential breakout entries with volume confirmation
Identify accumulation zones
Filter for high-conviction bullish moves
Works on any timeframe and any asset. The actual RVOL value is available in the data window when hovering over candles.

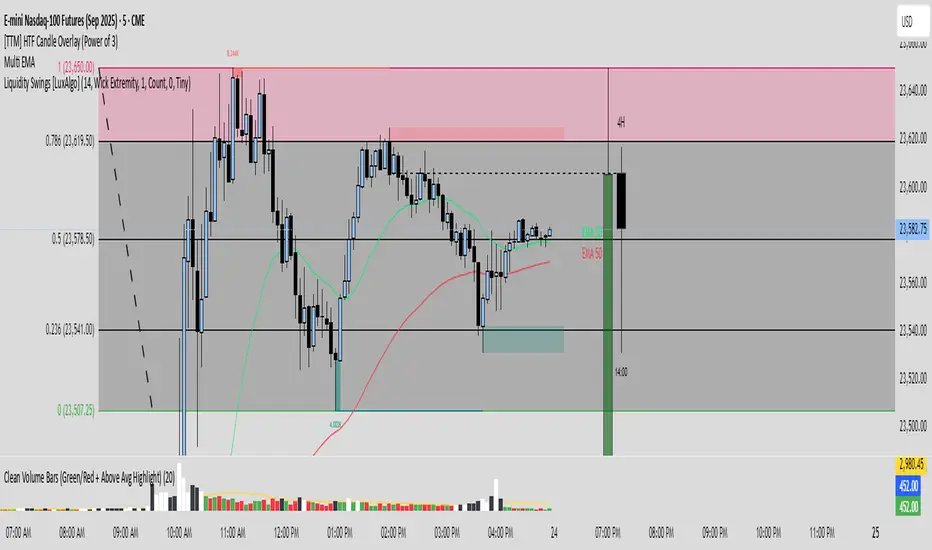
Clean Volume Bars (Green/Red + Above Avg Highlight)📊 Clean Volume Bars (Green/Red + Above Avg Highlight)
This script provides a clearer view of market volume by combining standard green/red volume bars with dynamic highlights for above-average activity.
Features:
✅ Green / Red Volume Bars – standard visualization:
Green when the candle closes higher than it opened
Red when the candle closes lower than it opened
✅ Average Volume Line – a simple moving average (default 20 periods) to track relative volume.
✅ Above Average Highlights – bars that exceed the average volume are emphasized:
White for above-average bullish volume
Black for above-average bearish volume
How to Use:
Look for white volume spikes during up candles → potential strong bullish activity.
Watch for black volume spikes during down candles → potential strong bearish pressure.
Combine with price action, trend, or other indicators for confluence (this is not a standalone trading system).
OBR 15min Session Opening Range Breakout + Volume Trend DeltaQuick Overview
This Pine Script plots the opening range for London and New York sessions, highlights breakout levels, draws previous session pivots, and offers a live volume delta table for trend confirmation.
Session Opening Range
- Captures the high/low of the first 15 minutes (configurable) for both London & NY sessions.
- Fills the range area with adjustable semi‑transparent colors.
- Optional alerts fire on breakout above the high or below the low.
Previous Session Levels
- Automatically draws previous day’s High, Low, Open and previous 4‑hour High/Low.
- Helps identify key S/R zones as price approaches ORB breakouts.
Volume Trend Delta
- Uses a CMO‑weighted moving average and ATR bands to detect trend state.
- Accumulates bullish vs. bearish volume during each trend.
- Displays Bull Vol, Bear Vol, and Delta % in a movable table for quick strength checks.
How to Use
1. Let the opening range complete (first 15 min).
2. Look for price closing above/below the ORB—enter long on an upside break, short on a downside break.
3. Check the Volume Delta table: positive delta confirms buying strength; negative delta confirms selling pressure.
4. Use previous day/4h levels as additional support/resistance filters.
Settings & Customization
- ORB Duration & Session Times (London/NY), fill colors, and toggles.
- Enable/disable Previous Day & 4H levels.
- Trend Period, Momentum Window, and Delta table position/size.
- Pre‑built alert conditions for all ORB breakouts.
Developer Notes
- Fully commented for easy adjustments.
- Modular sections: ORB, previous levels, trend delta, and alerts.
- No external libraries—pure Pine Script v6.
Tip
Combine ORB breakouts with Volume Delta and prior session pivots to filter false signals and trade stronger, more reliable moves.

Bull vs Bear Volume (Enhanced)Bull vs Bear Volume (Enhanced) is a custom volume histogram that separates and visualizes estimated buying vs. selling volume within each candle. This allows traders to better understand market sentiment and detect imbalances in demand and supply.
🔍 What It Does:
Plots bullish volume (green) above the x-axis and bearish volume (red) below.
Estimates bull/bear volume by analyzing the close location within the candle's range.
Highlights volume spikes with lime (bullish) or maroon (bearish) when volume exceeds a user-defined threshold.
Includes an optional total volume line for added context.
Supports smoothing via simple moving average (SMA) to reduce noise.
🛠️ Inputs:
Toggle smoothing and set its length.
Enable/disable threshold spike highlighting.
Show/hide the total volume overlay.
Adjust the threshold multiplier for spike detection.
⚠️ Important:
This script uses a proxy method based on candle structure to estimate volume split — it does not use real-time order flow or trade direction data.
Works best on liquid assets with consistent volume.

RVOL Color-Coded VolumeRVOL Color-Coded Volume Indicator
This tool visualizes volume intensity through color-coded bars in a separate panel, making it easy to identify significant market moves driven by unusual volume.
Key Features:
- Displays volume bars with varying colors and intensities based on RVOL (Relative Volume)
- Shows a customizable moving average line for volume reference
- Includes alert conditions for different RVOL thresholds
Color System:
Blue shades (Bullish):
- Light: Normal volume (RVOL < 1)
- Medium: Above average volume
- Dark: Heavy buying volume
- Solid: Extreme volume surge
Pink shades (Bearish):
- Light: Normal volume (RVOL < 1)
- Medium: Increased selling
- Dark: Heavy selling
- Solid: Extreme selling pressure
Gray shades (Neutral):
- Used when opening and closing prices are equal
- Intensity varies with RVOL level
Additional Features:
- Dotted threshold lines for easy reference
- Background highlighting for extreme volume events
- Data window shows exact RVOL values
- Multiple alert conditions for volume thresholds
The indicator helps traders spot potential trend changes and momentum shifts by highlighting unusual volume patterns without interfering with price analysis.

Highest Volume* 지표 설명
이 지표는 다양한 기간 동안의 최대 거래량을 시각적으로 표시하여 거래자들이 중요한 거래량 패턴을 쉽게 식별할 수 있도록 도와줍니다. 30, 60, 90, 120 캔들 기간 동안의 최대 거래량을 감지하고, 이를 차트 상에 색상 코드로 표시합니다.
다중 기간 분석: 30, 60, 90, 120 캔들 기간에 대한 최대 거래량을 동시에 추적합니다.
기간에 따른 색상 표시: 기간이 길어질수록 표시되는 색상이 짙어집니다.
* 주요 기능
거래량 급증 감지: 갑작스러운 거래량 증가를 빠르게 포착할 수 있습니다.
* 부가 설명
초록색 배경: 최근 120 캔들 중 최대 거래량
노란색 배경: 최근 90 캔들 중 최대 거래량 (120 캔들 최대가 아닌 경우)
주황색 배경: 최근 60 캔들 중 최대 거래량 (90, 120 캔들 최대가 아닌 경우)
빨간색 배경: 최근 30 캔들 중 최대 거래량 (60, 90, 120 캔들 최대가 아닌 경우)
* Indicator Description
This indicator visually displays the maximum trading volume over various periods, helping traders easily identify important volume patterns. It detects the highest volume over 30, 60, 90, and 120 candle periods and represents this on the chart using color codes.
Multi-period analysis: Simultaneously tracks the maximum volume for 30, 60, 90, and 120 candle periods.
Color display according to period: The color becomes darker as the period gets longer.
* Key Features
Rapid volume surge detection: Quickly captures sudden increases in trading volume.
* Additional Explanation
Green background: Highest volume among the most recent 120 candles
Yellow background: Highest volume among the most recent 90 candles (when not the highest in 120 candles)
Orange background: Highest volume among the most recent 60 candles (when not the highest in 90 or 120 candles)
Red background: Highest volume among the most recent 30 candles (when not the highest in 60, 90, or 120 candles)

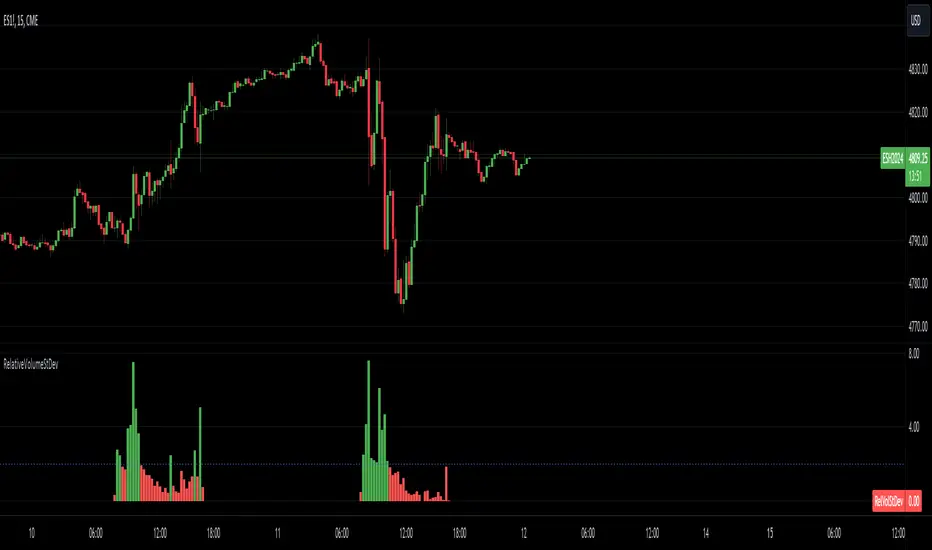
Relative Volume Standard DeviationThe Relative Volume Standard Deviation indicator is a powerful tool designed for traders seeking insights into volume dynamics. This indicator assesses the deviation of a security's trading volume from its moving average, shedding light on potential shifts in market sentiment.
Key Features:
-Length: Tailor the indicator's sensitivity by adjusting the length of the moving average.
-Number of Deviations: Customize the analysis by specifying the number of standard deviations to consider.
-Show Negative Values: Toggle the visibility of negative values in the plot for a comprehensive view.
How it Works:
-Moving Average Calculation: The script computes the simple moving average (SMA) of the trading volume over the specified length, providing a baseline for comparison.
-Standard Deviation Analysis: It calculates the standard deviation of the volume, identifying deviations from the average volume.
-Relative Volume Standard Deviation: The indicator then normalizes the difference between the volume and its moving average by the calculated standard deviation, producing a relative measure of volume deviation.
-Visual Representation: The result is visually represented on the chart using columns. Green columns signify relative volume standard deviation values greater than or equal to the specified number of deviations, while red columns represent values below this threshold.
-Enhancements:
Show Deviation Level: Optionally, a dashed horizontal line at the specified deviation level adds an extra layer of analysis, aiding in the identification of significant deviations.
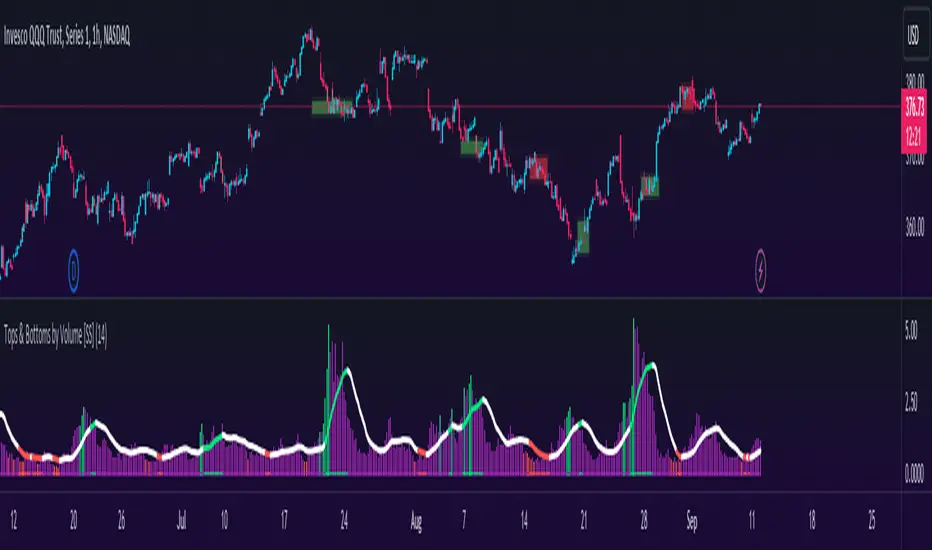
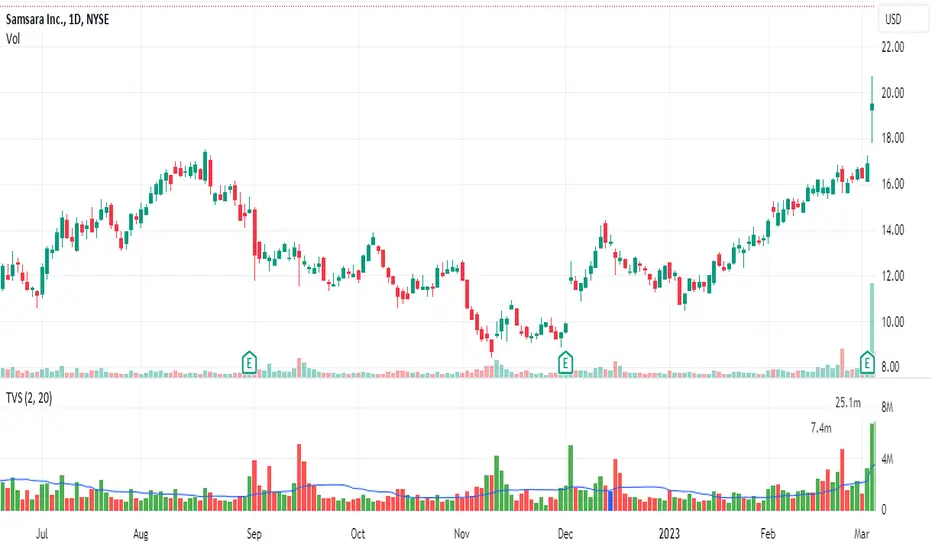
Tops & Bottoms by Volume [SS]Hey everyone,
Releasing this indicator that helps you time entries by alerting to potential tops and bottoms in the market.
Background to the indicator:
I was playing around with things that signalled reversals / tops and bottoms in SPSS and R using Pivot Points to mark tops and bottoms. Happened to come across a generally statistically significant relationship between sell to buy volume that was tracked over 10 to 50 candles back and pivot highs and pivot lows.
So I put it into a beta version of an indicator to see how it looked and was a bit surprised.
Since then, I have went back and narrowed down the details of what works/what doesn't work and this is the tentative result!
What it does / How to Use:
It tracks the cumulative buy vs sell volume. Buy volume is cumulated as close > open (or green candles) and sell is open > close (or red candles).
It then cumulates this over a user-defined period (defaulted to 14). It then looks back to see the highest vs lowest areas of sell and buy volume and makes determinations based on this relationship.
The relationship was determined by me using my own analysis and programmed into the indicators algorithm (using highest vs lowest function in pine).
It will plot areas of potential reversal to the upside as green on the histogram or red for a downside reversal. Once this becomes significant enough to signal an actual bottom or top, it will then change the SMA colour from white to green (for bottom) or red (for top).
Your entries generally should be once the SMA turns back to white. So from green to white, you would enter long or inverse for red to white (enter short).
Settings and Customizability:
Here are the key points to keep in mind if you are using this indicator:
Your lookback length should be between 10 to 50. I have left it open for you to modify it below and above this lookback period; however, this is the major periods deemed to be significant in identifying tops and bottoms. Thus, I advise against operating outside of those parameters.
You can toggle between smoothed look or historgram with SMA. The strength in this indicator comes from using the SMA and watching the SMA for signals of reversals, so if you want to filter out the background noise, you can simply look at the plotted SMA. If you want a more responsive indication of impending reversals, leave the smoothed option off and view the histogram in conjunction with the SMA.
The indicator will change the candle colour to red for bearish reversal and green to bullish reversal. This is based on the SMA. You can toggle this off and/or on as desired.
It is recommended to leave ETH (extended trading hours) turned off and RTH turned on.
Please read the instructions carefully.
If you require further assistance, I have posted a tutorial video.
Please be sure you are reading and/or watching carefully.
If you have questions, please feel free to post them below. But bear in mind I likely will not respond if it is already addressed in the description above (this happens often).
Also, feel free to leave your comments or suggestions below as well.
Thanks for checking this out. If you are interested in volume based trading, I suggest also checking out my Buyer to Seller volume indicator which cumulates total buying vs selling volume over a designated lookback period. Both of these used in conjunction are very powerful tools for volume based traders! ( Available here )
NOTE:
The boxes drawn in the chart are my own for demonstration purposes. I unfortunately cannot get the indicator to overlay the boxes on the chart in a separate viewing pane. That is why I opted to use the barcolor function to change the candle color instead :-).
Thanks again everyone and safe trades!
Truncate Volume SpikesTruncates or caps the height of the volume bar. Many times, there is a day where the volume eclipses the recent volume and makes the rest of the volume compressed and difficult to see.
This script cuts off the volume at a user defined multiple of average daily volume and places a label above and to the left showing the true volume.
My one gripe is that it doesn't yet handle overlapping labels. At some point, I will see if I can fix that.
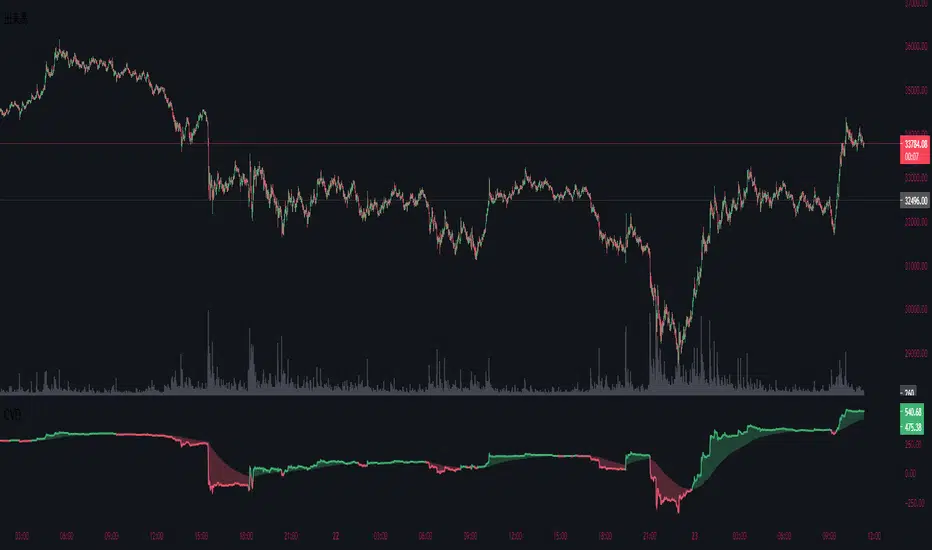
Cumulative Volume DeltaThis indicator is called Cumulative Volume Delta (CVD), and it is the cumulative difference between buying and selling pressure.
Note, however, that it is not an exact CVD, because Pine Script does not allow you to get the Bid Volume and Ask Volume.
Instead, it uses volume and candlestick length to determine the pressure.
Example: Volume is 100, price change is +1.0% → Buying pressure is 1
Volume is 100, price change is -0.5% → Selling pressure is 0.5
このインジケーターは、Cumulative Volume Delta(CVD)と呼ばれるもので、買い圧力と売り圧力の差を累積したものです。
しかし、Pine Scriptでは買い圧力と売り圧力(Bid VolumeとAsk Volume)を取得することはできないため、正確なCVDではないことに注意してください。
代わりに出来高とローソク足の長さで圧力を判断判断しています。
例:出来高が100、価格の変動が+1.0% → 買い圧力は1
出来高が100、価格の変動が-0.5% → 売り圧力は0.5
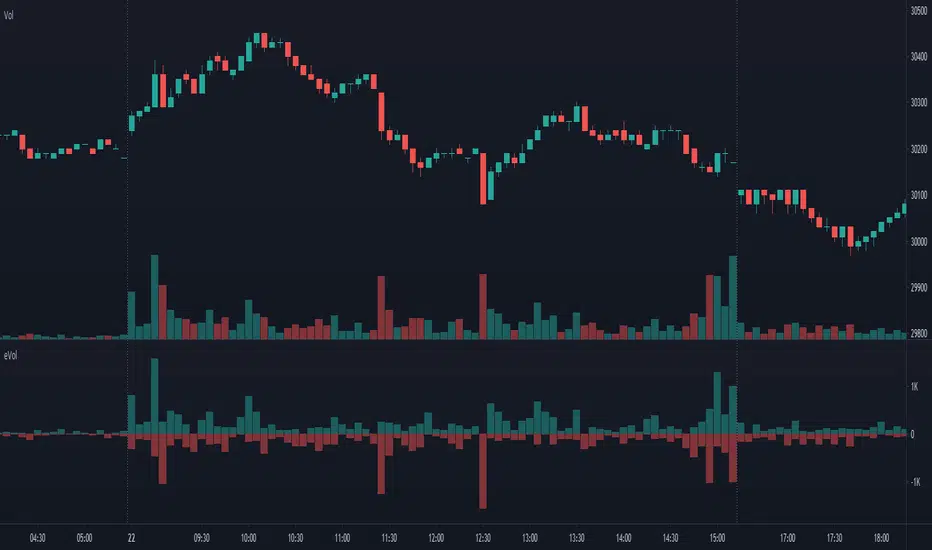
Estimated Up Down VolumeThis indicator plot estimated Up volume and Down volume.
Adjust colors to the default volume indicator.
Performante's Average Ethereum Volume IndicatorPerformante's Ethereum Volume Indicator takes the volume from the biggest exchanges and plots the average volume.

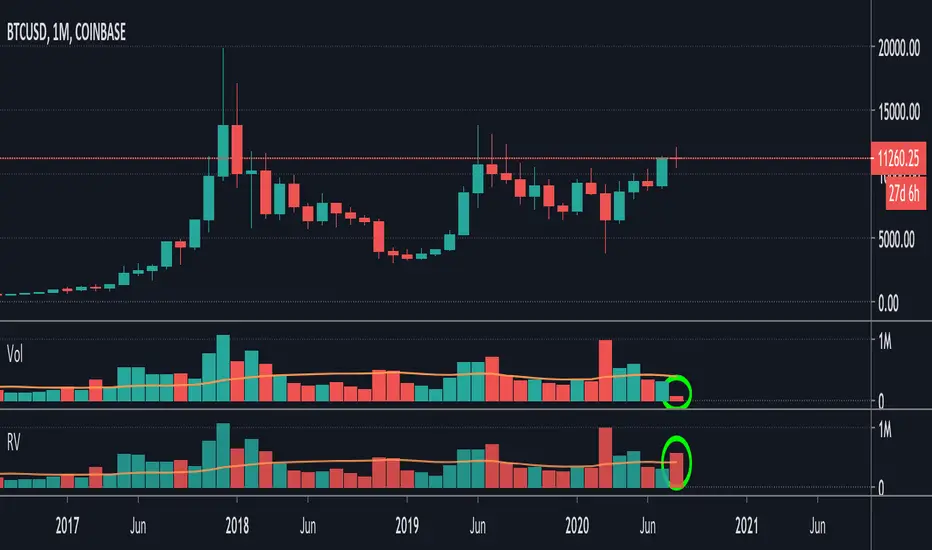
Relative VolumeIt is difficult to know how much volume is going on DURING the last bar,
therefore this "Relative Volume" (RV) script, previous bars are as usual, but the last one
adjusts the measured volume by comparing how much time passed and multiplying
this with the volume.
Examples:
Here (5 minute bar) there are 31 sec passed of the 5 minutes
The standard volume show little volume (since there is only 31s passed)
The "RV" multiplies this so you'll see how much this volume would be over 5 minutes,
IF everything goes the same for the rest of the 5'.
1' 5sec passed:
(so relatively more volume)
3' 4sec passed:
(With about 2' to go, you see there is a lot going on with the volime,
while seeing the standard volume, nothing much...)
Little 4' passed:
4,5':
Almost 5' gone:
Important:
This "RV" volume can diminish when during the bar the volume fades.
I think this can help evaluating the volume during the last bar
W example:
M example:
(You can clearly see that during the first 4 days there is a lot going on!)
Investonomer - BS VolumeBuy Sell Volume Indicator is a free indicator which can be used with any instrument (stock, index or CFD) where volume information is available on TradingView.This indicator shows us a volume based view of the market activity and it helps us distiguish whether buyer are aggressive or sellers are. Basically, this indicator plots first plots the buyer volume in green. Then the seller volume is printed in red.
If Sellers are more, you will red only, whereas if buyers are more, you will selling volumes and then extra green over it which shows how many buyers are there in the market.

Performante's Average Bitcoin Volume IndicatorPerformante's Bitcoin Volume Indicator takes the volume from the biggest exchanges and plots the average volume.
Happy Trading!

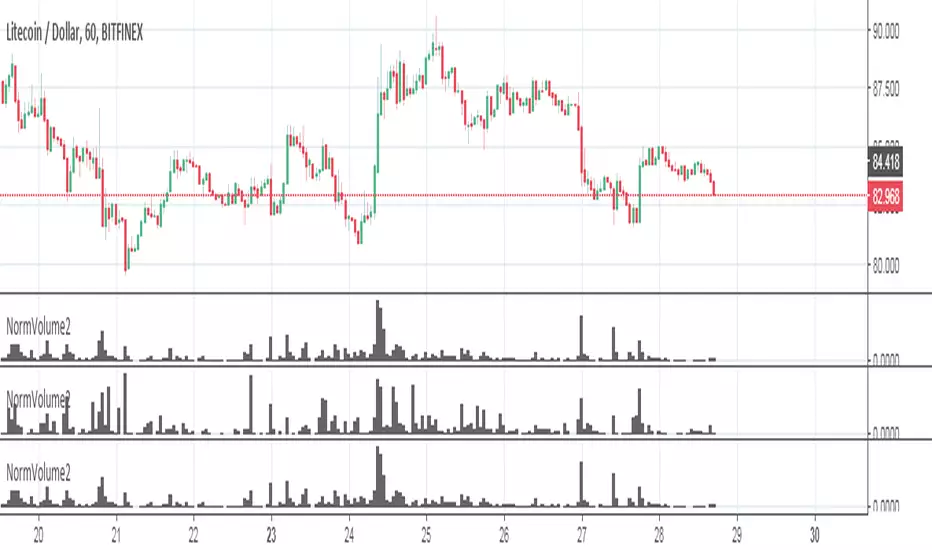
BBP (Bittex, Poloniex, Bitfinex) + standart volumeThe script wrote for pairs of crypto currency with XXX USD. On others it does not work. By and large, it is suitable only for analysis of TOP coins.
What it consists of:
The script pulls volumes from exchanges: Bitfinex, Bittrex, Poloniex + the volume of the coin itself through the dollar indicator normalized.
Based on the volume from the indicator "dollar normalized volume"
Works with pairs XXX USD (do not confuse with USDT)
Options Volume IndicatorShows the RSI volume based on options volume. Useful for comparing against asset buy and sell signals to see strength of demand for recent options.

Custom Monthly Volume Profile [Multi-Timeframe]This indicator renders a high-precision Monthly Volume Profile designed for intraday traders and practitioners of Auction Market Theory. Unlike standard volume profiles, this script utilizes Multi-Timeframe (MTF) data request capability to build the profile from lower timeframe data (e.g., 5-minute bars) while displaying it on your trading timeframe.
This tool is optimized to keep your chart clean while providing critical developing levels (POC, VAH, VAL) and historical context from the previous month.
Key Features:
1. Dynamic "Auto-Scaling" Width One of the biggest issues with monthly profiles is visual clutter.
Early Month: The profile starts wide (default 10% width) so you can clearly see the developing structure when data is scarce.
Late Month: As volume accumulates, the profile automatically shrinks (scales down to 2% width) to prevent the histogram from obscuring price action.
Note: This can be toggled off for a static width.
2. Developing & Static Levels
Current Month: Displays real-time Developing Point of Control (dPOC), Value Area High (dVAH), and Value Area Low (dVAL).
Previous Month: Automatically locks in the levels from the previous month at the close, providing immediate support/resistance references for the new month.
3. Time-Filtered Alerts Avoid waking up to notifications during low-volume overnight sessions. This script includes a Session Filter (Default: 0830-1500).
Alerts for crossing POC, VAH, or VAL will only trigger if the price cross occurs within the user-defined time window.
4. Calculation Precision
Multi-Timeframe Data: The profile is built using lower timeframe data (Input: Calculation Precision) rather than just the current chart bars. This ensures the Volume Profile shape remains accurate even when viewing higher timeframes.
Row Size: Fully adjustable "Tick/Row Size" to control the resolution of the volume buckets.
Settings Overview:
Calculation Precision: Determine the granularity of the data (e.g., "5" for 5-minute data).
Row Size: Controls vertical resolution (Lower = higher detail).
Value Area %: Standard 70% default, fully adjustable.
Auto-Width: Set the Start % (Day 1) and End % (Day 31).
Alerts: Toggle Current or Previous month alerts and define the active time session.
Visual Customization:
Customize colors for the Histogram (Value Area vs. Outer Area).
Customize line width and colors for POC, VAH, and VAL.
Supports Right or Left alignment.
Disclaimer: This tool is for informational purposes only. Past performance and volume levels do not guarantee future price action.

Weekly Volume USDT## Description
This Pine Script indicator displays the trading volume for each day of the current week (Monday through Sunday) in a clean table format on your TradingView chart. The volume is calculated in USDT equivalent and displayed in the top-right corner of the chart.
## Features
- **Weekly Volume Breakdown**: Shows individual daily volumes from Monday to Sunday
- **USDT Conversion**: Automatically converts volume to USDT using the average price (open + close / 2)
- **Smart Formatting**:
- Large numbers are formatted with K (thousands) and M (millions) suffixes
- Example: 1,234,567 → 1.23M USDT
- **Clean Table Display**: Fixed position table in the top-right corner
- **Current Week Focus**: Displays volumes for the current week only
- **Future Days Handling**: Days that haven't occurred yet in the current week show as "-"
## How It Works
1. The indicator calculates the average price for each day using (Open + Close) / 2
2. Multiplies the daily volume by the average price to get USDT-equivalent volume
3. Displays the results in an easy-to-read table format
## Use Cases
- **Volume Analysis**: Quickly identify which days of the week have the highest trading activity
- **Pattern Recognition**: Spot weekly volume patterns and trends
- **Trading Decisions**: Use volume information to inform your trading strategies
- **Market Activity Monitoring**: Keep track of market participation throughout the week
## Installation
Simply add this indicator to your TradingView chart and it will automatically display the weekly volume table in the top-right corner.
## Tags
#volume #weekly #USDT #table #analysis #trading #cryptocurrency

Forex Multi Exchange VolumeHi traders! Forex Multi Exchange Volume (FMEV) aggregates and plots trading volumes for supported forex pairs over multiple different major forex exchanges.
Supported exchanges
- FXCM
- OANDA
- FOREX.COM
- PEPPERSTONE
- GLOBALPRIME
Limitations
Because of the fact that FMEV is pulling data from from multiple different exchanges and is computationally intensive it can take a couple of seconds to load while charting certain forex pairs.

Noro's Multi-exchange VolumeThe sum of volumes (5 different exchanges) at the same time. The exchanges can be chosen. Less than five exchanges are possible. For this purpose it is necessary to erase the text in the field.
