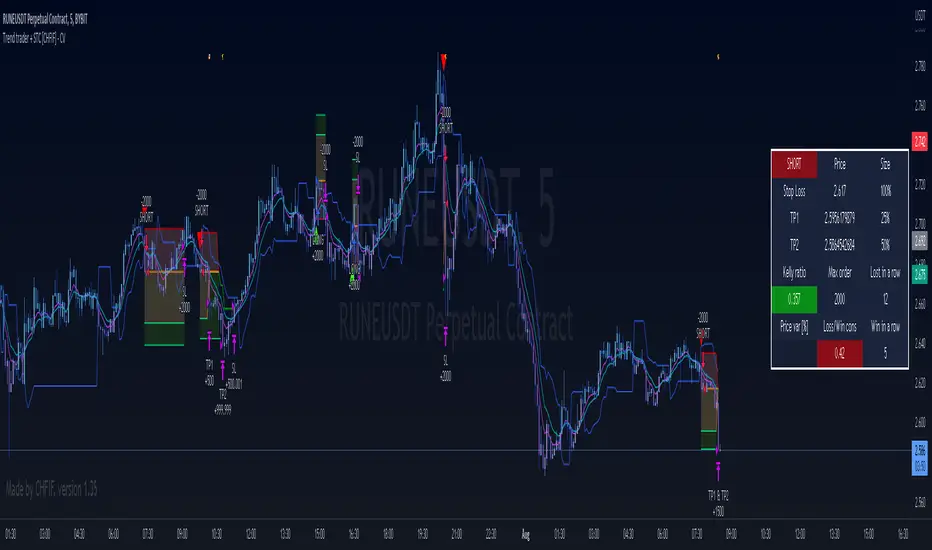
Trend trader + STC [CHFIF] - CV This script is my first strategy script coupling the Trend trader (indicator developed by Andrew Abraham in the Trading the Trend article of TASC September 1998.) and Schaff Trend Cycle . The STC indicator is widely used to identify trends and their directions. It is sometimes used by traders to predict trend reversals as well. Based on the movement of the Schaff Trend Cycle , buy or sell signals are generated, which are then used by traders to initiate either long or short positions.
Around I built a user interface to help you in creating a customized strategy to your need.
My idea behind doing this was to make customizable parameters and back testing easier than manually with a lot of flexibility and options. More possibility we have, more solutions we find right? So I started this script few weeks ago to be my first script (second in reality, but first to be published.)
Strategy it self is made out of 2 simple step:
1→ STC gives a Buy/Sell signal.
2→Price is closing above the TT (Buy) or below (Sell) and the signal is the same as given by the STC .
To complete your strategy in order to reach the best result, I added few options:
→ Money management: Define the type of risk you want to take (entry risk will always risk the same percentage of your portfolio disregarding the size of the SL, Fix amount of money, fix amount of the capital (portfolio). NOTE: Margin is not coded yet, target is to show liquidation price. Please keep an eye on the releases to know when it is released.
→ Stop loss and Take profit management: Define the type of target you want to use (ATR, fixed percentage, pivots points) and even customise different take profit level or activate the trailing. Each type of target is customizable via the menu
→ Moving average: You can also complete the strategy using different moving average. To draw it tick the box on the left, to use it in the calculation of the result, tick the box "Price>MA" in front of the needed EMA . You can select different type of MA ( SMA , EMA , DEMA , TEMA , RMA, HMA , WMA , VWAP , VWMA , etc...)
→ RSI: 4 possible approach to use the RSI to complement the strategy:
• OB/OS => short position will be taken only if RSI goes under the lower limit. Long if the RSI goes above the limit. Ticking confirmation will wait to cross back the limit to validate the condition
• Rev OB/OS => Short will be taken if RSI is below lower limit and stays below. Long will be taken if RSI is above upper limit and stays above.
• MA dominance => RSI has to be above MA for long, below for short. Confirmation box ticked requires 2 bars with the RSI on a side to validate signal.
• MA Dominance + limit => It is a combination of the requirement of the provious option and also Rev. OB/OS
→ Volume confirmation => This will consider the volume MA for entry confirmation. The volume will have to be above the MA define by the value entered in the field.
→ Waddah Attar explosion indicator can also be used as a filter for entries in this way:
• Explosion line > dead zone to validate entries
• Trend > dead zone to validate entry
• Both > dead zone is a compound of both rules above to get entry confirmation
→ ADX can also be used as a filter. I added 2 Threshold in order to have a minimum level of acceptance for valid entry but also a maximum level.
When your strategy is setup, you can setup alerts and I would recommend to setup the date range before doing the alerts. Why? Simply because the script do not cover pyramiding and will give a signal only if a trade is not ongoing.
In setting up the sessions at which you would want to trade, no signal within those range can be missed. You can setup 2 sessions, the days and also the global range of backtesting.
ابحث في النصوص البرمجية عن "vwap"
CAPTAIN ALTS VVMTCaptain Alts VVMT indicator provides signals and trend based on vlume , volatility , momentum and Trend
For volume it used on balance volume , Chaikin Moneey flow , vwap and candle pattern status
for Momentum it use ATR , S&R , RVI AND bOLLINGER BAND
Use 5min and 15min timeframe for scalping , The cap line change its colour according to the trend if it reds it means market is getting bearish if blue means market is turning bullish

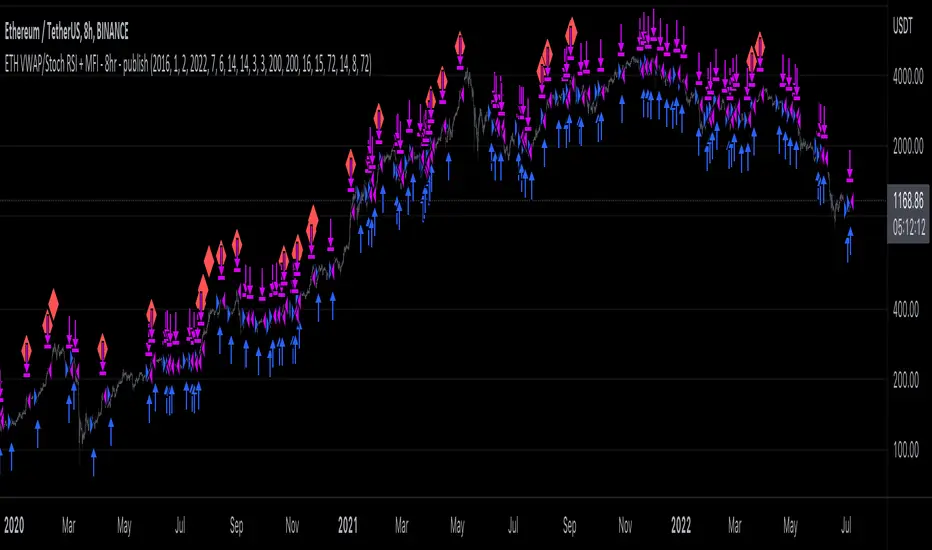
ETH long bot - 8hrThis is a high-latency algorithm, safely running on the Ethereum 8hr chart where it can execute trades on a multi-day timeframe, making it easy to enter and exit large positions and without incurring excessive commission fees.
As a long bot, this script should be ran in markets that are trending upwards. Nonetheless, the operator can be at ease knowing that the script can safely run autonomously during these extended periods. It is shown here performing full-time over a 46 month period, from January 2019 through October 2021, steadily increasing the available capital despite the asset's fluctuations. While the buy and hold return over this time was 714%, the algorithm produced a net profit 4,060%, outperforming the market by over 5.5x. This equates to a 40x return on investment in 4 years.
The strategy behind this algorithm is to always capitalize on significant jumps in the market. This is accomplished by using a simple combination of RSIs:
- One RSI uses VWAP as a source, which is primarily responsible for entering growth trends whenever they begin
- The other is a Stochastic RSI , which is primarily responsible for identifying exhausted periods of growth
These calculations are calibrated so that the bot can jump in and out of trades to improve its position when there isn't significant price action one way or the other, but is then able to remain in positions during uptrends that are backed by volume to achieve maximum gains. This strategy is reflected by the fact that while profitable trades are almost 3 times larger than losing trades, on average, they also last for an average of 6 days, whereas losing trades usually last about 2.
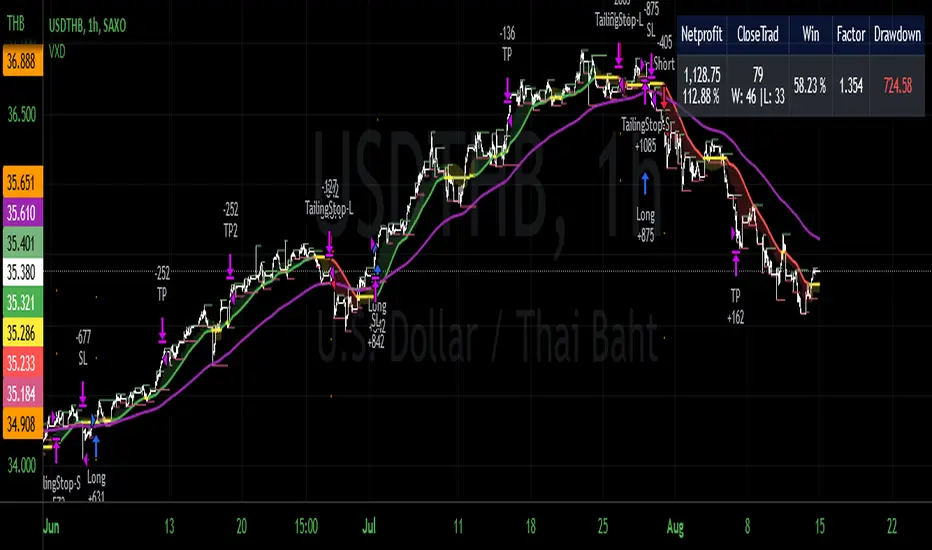
VXD Cloud EditionVXD Cloud Edition.
to overcome sideways market conditions this cloud configured for low timeframe.
every TA is same as VXD Supercycle but show as cloud.
Symbols on chart show Premium and Discount Prices
X-Cross = Engulfing Candle with weak volume .
O-circle - Engulfing Candle with strong volume .
Pivot point and Rejected Block
Pivot show last High and low of a price in past bars
Rejected Block show when that High or Low price are important level to determined if it's Hidden Divergence or Divergence (with RSI)
Setting
Momentum: RSI = 25 , RSI MA = 14
Trend: Rolling VWAP and ATR and Subhag (Everthing show as a cloud)
Trailing STOP: ATR 12 x 2.4
Highlight Bars color when volume is above SMA 6
SMA200 act as TP Line
Risk:Reward Calculation
if Buy your Stoploss will be previous Pivot low
if Sell your Stoploss will be previous Pivot high
and TP line will be calculated form there, then show in Orange color line
Buy condition : Close is above Cloud and close above pivot high
Sell condition : Close is below Cloud and close below pivot low
Trip : add this to alerts setting.
Order {{strategy.order.action}} filled on {{ticker}} @ {{strategy.order.price}} {{strategy.order.alert_message}}.
Big Snapper Alerts R3.0 + Chaiking Volatility condition + TP RSI//@version=5
//
// Bannos
// #NotTradingAdvice #DYOR
// Disclaimer.
// I AM NOT A FINANCIAL ADVISOR.
// THESE IDEAS ARE NOT ADVICE AND ARE FOR EDUCATION PURPOSES ONLY.
// ALWAYS DO YOUR OWN RESEARCH
//
// Author: Adaptation from JustUncleL Big Snapper by Bannos
// Date: May-2022
// Version: R1.0
//Description of this addon - Script using several new conditions to give Long/short and SL levels which was not proposed in the Big Snapper strategy "Big Snapper Alerts R3.0"
//"
//This strategy is based on the use of the Big Snapper outputs from the JustUncleL script and the addition of several conditions to define filtered conditions selecting signal synchrones with a trend and a rise of the volatility.
//Also the strategy proposes to define proportional stop losses and dynamic Take profit using an RSI strategy.
// After delivering the temporary ong/short signal and ploting a green or purple signal, several conditions are defined to consider a Signal is Long or short.
//Let s take the long signal as example(this is the same process with the opposite values for a short).
//step 1 - Long Definition:
// Snapper long signal stored in the buffer variable Longbuffer to say that in a close future, we could have all conditions for a long
// Now we need some conditions to combine with it:
//the second one is to be over the Ma_medium(55)
//and because this is not selective enough, the third one is a Volatility indicator "Chaikin Volatility" indicator giving an indication about the volatility of the price compared to the 10 last values
// -> Using the volatility indicator gives the possibility to increase the potential rise if the volatility is higher compared to the last periods.
//With these 3 signals, we get a robust indication about a potential long signal which is then stored in the variable "Longe"
//Now we have a long signal and can give a long signal with its Stop Loss
// The Long Signal is automatically given as the 3 conditions above are satisfied.
// The Stop loss is a function of the last Candle sizes giving a stop below the 70% of the overall candle which can be assimilated to a Fibonacci level. Below this level it makes sense to stop the trade as the chance to recover the complete Candle is more than 60%
//Now we are in an open Long and can use all the mentioned Stop loss condition but still need a Take Profit condition
//The take profit condition is based on a RSI strategy consisting in taking profit as soon as the RSI come back from the overbought area (which is here defined as a rsi over 70) and reaching the 63.5 level to trigger the Take Profit
//This TP condition is only active when Long is active and when an entry value as been defined.
//Entry and SL level appreas as soon as a Long or short arrow signal does appears. The Take profit will be conidtioned to the RSI.
//The final step in the cycle is a reinitialization of all the values giving the possibility to detect and treat any long new signal coming from the Big Snapper signal.

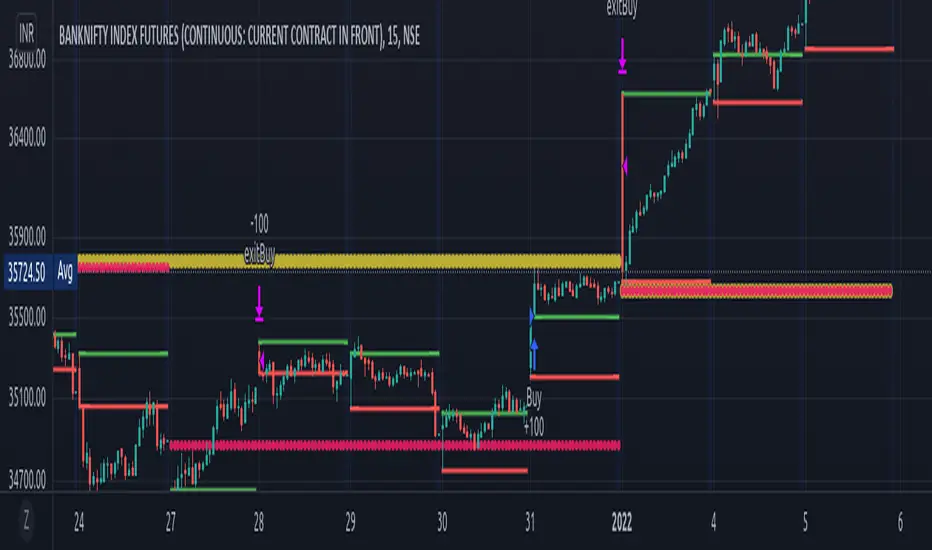
yuyutsu-banknifty-beta"yuyutsu-banknifty-beta" indicator is a strategy especially made for NSE/BSE Banknifty. Strategy has various sub strategies which can be selected to check back tested accuracy and profit factor. Strategies works best on 3m /15m for intraday. Sub strategy "Swing" can be applied on either nifty and banknifty.
I have also added checkboxes for 3m/15m which implictly selects best combination for desired results.
Below are the sub strategies which user can use and perform back testing.
HMA
Daily Weekly Closing
Daily Monthly Closing
Pivot
Previous day open close
Gap up/down
75m analysis
ORB
Swing
TDI
VMWA
VWAP
Ripster clouds
BBPBΔ(OBV-PVT)BB - Time Series Decomposition & Volume WeightedThis is an indicator that shows 5 different points of information:
#1 The Trendline is uses a time-series decomposition to remove noise and seasonality data to provide a trendline without using moving averages. This is then further processed by a custom VWAP block that weights it based on the time frame you're currently using.
#2 BB%B - This is the blue histogram that's partially transparent. This is used to find when a security is overbought or oversold.
#3 BB%B of the Δ(OBV-PVT). This is the green histogram. We took the OBV and subtracted the PVT from it, then we found the delta of that compared to the previous candle. This output a line, which we wrapped in bollinger bands to find the BB%B of this line. This line is represented as a histogram, for visual clarity.
#4 Long and Short Indicators: Long is represented by a green dot, and short is represented by a red dot.
#5 Zones - there are multiple zones, which are used to identify overbought and oversold zones.
How to use the indicator:
Simple way: Long on green dot, Short on red dot. Use stop losses and take profits.
Slightly More Complex: Same as above, but also close out longs, when the green histogram drops but the blue does not. As this means price action hasn't caught up with volume. Use stop losses and take profits.
Full Usage: Long only when both the green, blue and yellow lines are below 0, and sell when the blue or green histogram rises above 1. Perform the opposite for the shorting. Ignore the dots if you use this method, they are for simple reference points til you get used to this indicator. Use stop losses and take profits.

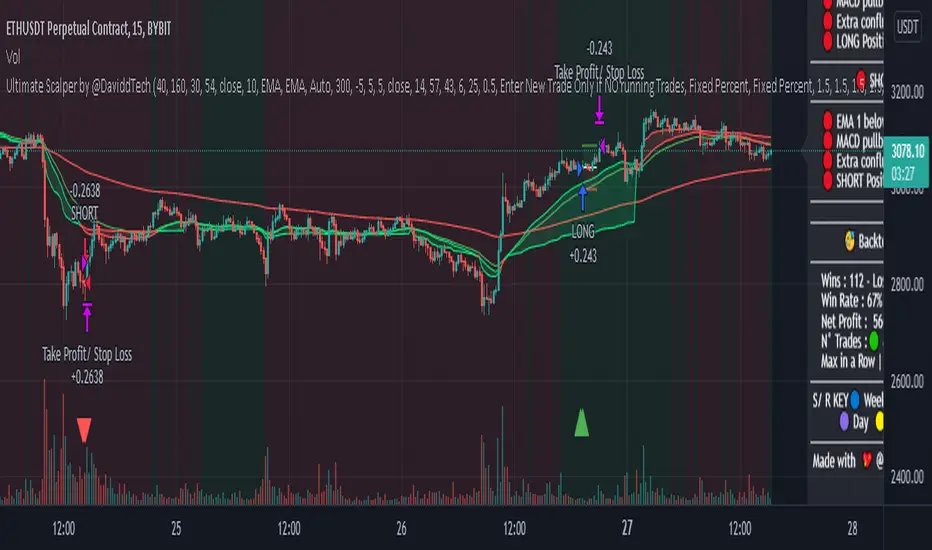
Ultimate Scalper 1.2 @DaviddTechThis script turns out to be a great scalper for Crypto.
Long
* Looks for a pullback in MACD
* EMA 50 over EMA 200
Short
* Looks for a pullback in MACD
* EMA 50 below EMA 200
I use also the ADX for filtering flat markets.
ATR, VWAP and RSI can be used for confluence.
WARNING:
- For purpose educate only - My mission is to debunk fake strategies with code to find THE ONE.
- Plots EMAs and other values on chart.
- This script to change bars colours.
Release Notes: Change the description tabs

TemaVWAPRSI StrategyExchange: Kraken
Timeframe: 5m
Pair: ETH/USD
If you use this for any other exchange or pair, you'll have to tweak the settings, most importantly are the trailing stop ticks. This strategy is currently in what I would call beta mode. It uses the volume weighted average price indicator, rate of change, two triple exponential moving averages and the relative strength index to find buy and sell signals.

Ultimate Scalper by @DaviddTechThis script turns out to be a great scalper for Crypto.
Long
* Looks for a pullback in MACD
* EMA 50 over EMA 200
Short
* Looks for a pullback in MACD
* EMA 50 below EMA 200
VWAP and RSI can be used for confluence.
WARNING:
- For purpose educate only - My mission is to debunk fake strategies with code to find THE ONE.
- Plots EMAs and other values on chart.
- This script to change bars colours.
Release Notes: Change the description tabs
RSI Hidden Divergence + Stochastic + 200 EMA @DaviddTechHey Traders,
This is my first strategy of many I hope. Inspired by a strategy I found on YouTube I wanted to see if it would work with a BOT strategy.
The idea is :
## LONG ##
* When the price is above 200 EMA take only LONG positions.
* Look for Bullish hidden divergence.
* Stochastic crossover to find our entry.
## SHORTS ##
* When the price is below 200 EMA take only SHORTpositions.
* Look for Bearish hidden divergence.
* Stochastic crossunder to find our entry.
You can used a fixed percentage, ATR, HH/LL or a FIB level to take profit.
Everything is very visual and can be connected easily to a bot.
I will be doing a video on HOW-TO setup in a couple of days.
## MUTLI LEVEL PROFITS ##
This will show you on backtest is you take profits at 3 levels however I have not tested on a BOT strategy.
NOTE : This is for educational purposes and please test on a paper account, as I said this is my first strategy.
I will be working and back testing new strategies every week.
- Made with ♥ @DaviddTech

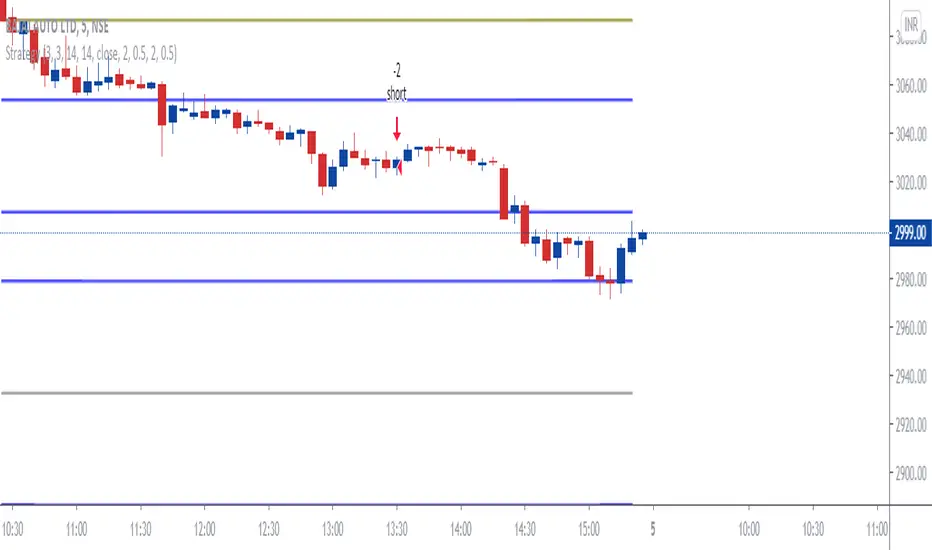
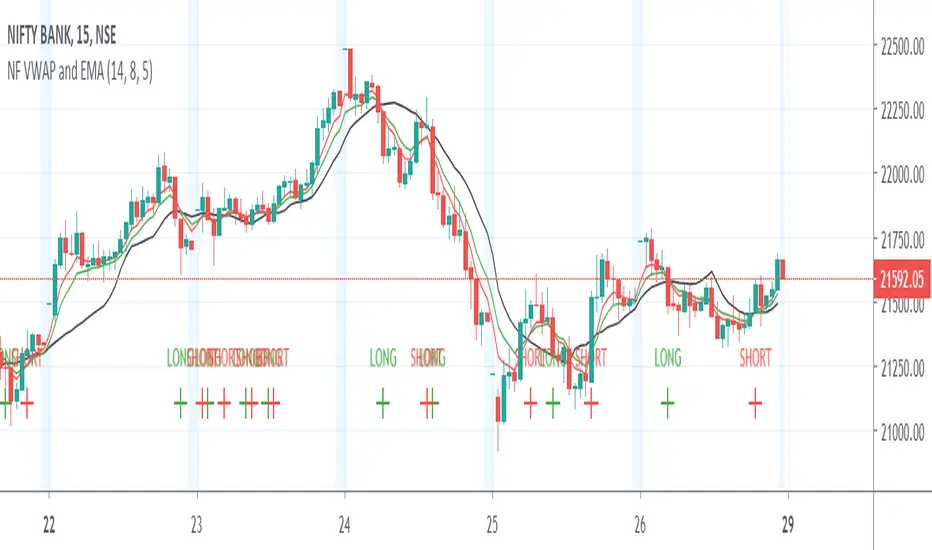
Intraday StrategyThis script helps you to determine entry for long trades and short trades.
Conditions checked:-
1. VWAP for long/short
2. 20 EMA for confirmation
3. STOCHASTIC RSI for momentum
How to enter:-
After the indicator plots the entry for long/short on chart, wait for the price to break nearest pivot point and close above it. Combine with price action for better results.
when long signal is plotted, wait for the nearest resistance to be broken, while entering make sure that the price has not been in a continues uptrend or downtrend.
Time Frame:-
5 & 15 minutes timeframe
When to exit:-
Exit the position after 1% raise of price. eg:- if stock price is 1000, exit after 10 points. you can trail SL if you see a long trend comming
Where to place SL :-
Place your SL 0.5%-1% from you entry or determine the nearest support.
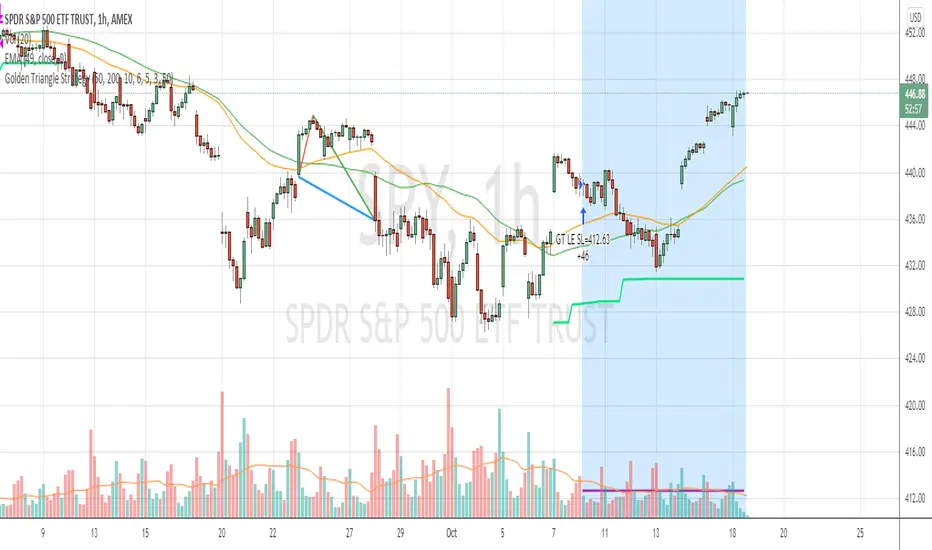
Golden Triangle StrategyGolden Triangle strategy setup is a variation of the buy-the-dip strategy, by Charlotte Hudgin.
You can find the detailed explanation here by Thomas N. Bulkowski thepatternsite.com
BUY
===
1. price should be trading above sma50
2. when it touches sma50 first time , check the starting rallypoint of where it initiated
3. from the above point to current close , see if you have white space , then draw the triangle
4. then check for volume confirmation ( current volume should be greater than last 4 ) --- I have slightly changed this to fit into hourly strategy by adding condition close>vwap
EXIT
====
1. Exit when close crossing down sma50 with at least 2% profit (slightly modified original condition)
StopLoss
========
2. stop loss is set to 6%
Warning
=======
For the use of educational purposes only
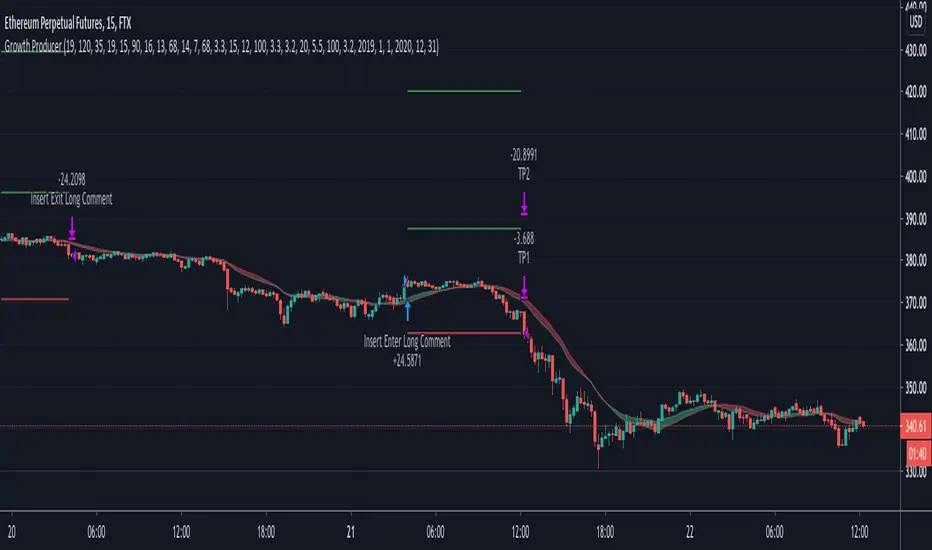
Growth Producer
Applicable to FTX:ETHPERP 15 min
Relative volatility index (RVI) that will determine the entry and exit points only when the volatility will start to increase and Money Flow index as an additional point for entry.
IMPORTANT
• Input Partial take profits in your Bot settings
• This is a trend strategy and works better in the trending market
• We added the trend identifier using the EMA and SMA interaction
• We added Take profit and stop loss levels
• We added inputs for the period selection, so you could see how the strategy is performing on a monthly basis.
• RVI for the entry conditions
• MFI was added for the additional entries.
• Partial Take-profits
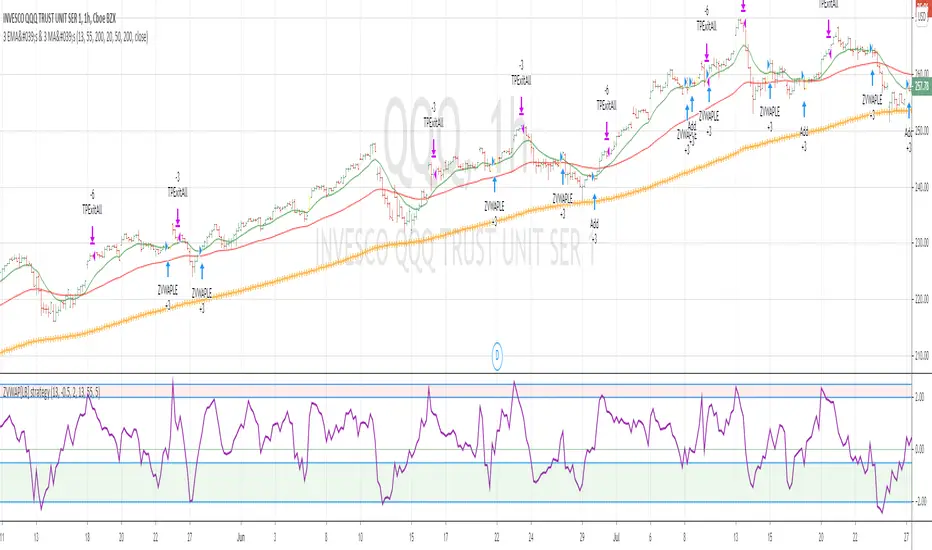
ZVWAP strategyThis strategy is based on Z distance from VWAP indicator by LazyBear
I have added few filters to utilize the indicator ...
BUY Rule
=======
1. fast ema is above slow ema
2. zvwap is dipped below oversold area (default set to -0.5)
3. after the dip , while crossing above zero --- BUY
Note , when the above criteria is met , bar color is changed to yellow
Exit Rule
========
1. Exit when zvwap enters overbought line (default set to 2.0)
Stop Loss
========
default set to 5% ( you can change it in settings )
Note : strategy does not draw ema lines on the chart. Please add manually to your chart
warning: for education purposes only
WMA CrossoverNormally we have Moving average which is lagging indicator but in this script we have removed the lag and get signal upfront to maximize the profit and minimize the losses.
This is good for Entry purpose, for exit also it can be used but profit might be less. It is suggested to use one of the below method for exit
Target based
RSI divergence or
Price & Volume Based Analysis
VWAP (Volume for Index (Nifty & BankNifty is not available on Tradingview. Investing.com can be used for the same.)
If need more information on any of the above method, Please comment i will share more information on this either on tradingview or could be on the yourtube video.

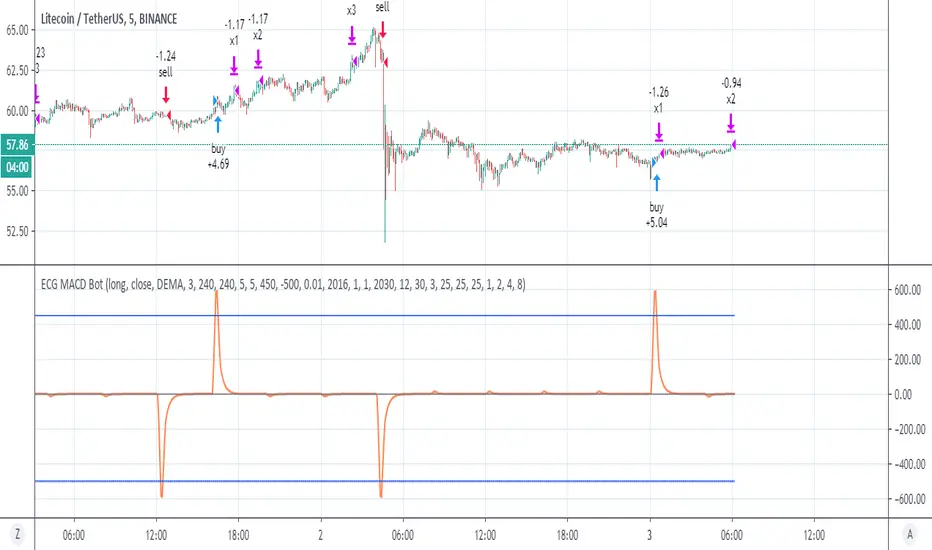
ECG MACD Botok this is hybrid of ECG bot -and MACD
in the ECG bot it combination of vwap and RSI
here I use different combination that may be even better which is a regular MACD and the rsi ECG bot .
you need to understand how this system work in order to make it best for you
first theory-
The ECG bot and this one base on simple but very strong idea which is there is differnt between repainted MTF to non repainted MTF
So if you put the same MTF 1 security (repaint ) and MTF 2 security (non repaint ) then the difference between them is the repaint distance.
so if i build model of buy force vs sell force on this diffrence.
SInce security is so dominant in the repaint model it force the signal to be at certain time . but also doing so it calculate the buy and sell force of the privoius day . which is very powerfull signal.
so puting to system of minus and plus the repaint model will produce signals. and due to security the strongest one will be when security finish it calculation at a specic time done by the MTF. so this is the "repaint signal" that make the repiant strategy to work so well.
my system is just to dump the unwanted noise and to keep the repaint ones. so by this reduce true repaint to be mimimum.
I hope you understand the idea . it not perfect but i thnk we are very close (i hope)
The MACD is your source so you can change the fast and slow to what ever you wish
the repaint system is conrol by the repaint control
if you use 60 min it need to to be 60 or more then that . if you use 30 min candle then use 30 etc
for each thing you do you must use the bar control to adjust it
as you need to adjust the upper treshold of the buy and the sell
for crypto this setting ok, you may change the lower treshold so use bar repaly to see where it was repaint and by that you can fix it
for stocks use 1 week MTF on 4 hour candle , increase repiant control to 240
for forex it same as crypto but you need to adjust to any coin that you use.
for further questions please let me know
once this project prove it idea that it safe i will make study version .
So do not put any 1 cent before you run all the test needed and live demo test to see how it work on real life
I put lower treshold on -450, on alts change it o -400
Trend plus !!
This script is like a toolbox for me. I don't use its long & short signals,but with default setting it's suitable for scalping in 1 minute chart in the direction of the trend.. its easy but you need to learn how to use it!!!!
so what do we have in it?
2 ema lines
1 sma line
2 wma line
1 hullma line
4 vwap line
bolinger bands
ichimoku
.....

Nifty Volume profile + VWAP + EMA The script picks up nifty stocks with their current respective weights and plots a Volume Weighted Average Price line along with 2 EMAs and an alert when the EMAs cross over.
You can customize the script for EMA lengths and to remove alert. Basic utility of the script is to analyse volumes driving the Nifty 50 index.
Credits to @daytraderph and his script (Custom Volume) who's code I used to build this script. Also thanks to my friend @Varun who helped me code it.
STRAT_STEMWAPHere is the update to the stem matcs strategy.
Here are the additions to the strategy.
1. VWAP tuning
2. Stop Loss adjusting fields now act more appropriate in relation to the super trend values.
3. Split out the volume checks to individual values for short and long
4. A max loss setting. This needs to be adjusted to which security and position size you are trading.
If you are using this on short time frames I suggest that you tweak your settings often.

Trading Associates slot saverIncludes:
Pivot Reversal Strategy (Source code: pastebin.com )
Donchian Channels
Bollinger Bands
6 MAs with crossing indicator
4 EMAs
Candlestick Patterns identified by repo32
Support and Resistance by RicardoSantos (I just changed it a bit)
Weekly and Daily Pivot Points
Ichimoku Cloud with my parameters
VWAP
You can save some slots with this indicator on Tradingview. Take advantage of it.
The pivot reversal strategy isn't bad on higher timeframes, bot it if you want to.
Cheers


Tangram Bot 2 - SmartbotPrimeira Versão do Script Tangram Bot 2 da Smartbot para tradingview.
A intenção é agilizar e fazer um teste prévio e rápido do setup.
O resultado indicado aqui jamais corresponderá a um resultado real. É apenas uma ferramenta de estudo.
Ainda falta fazer e melhorar a parte de gestão de risco.
Caso queria fazer alguma sugestão ao cógido para melhorar a gestão de risco ou caso tenha encontrado algum erro, favor comunicar.
O tangram bot 2 combina o uso de até dez Indicadores de Análise Técnica com Gerenciamento de Risco (stop gain, stop loss, stop móvel, realização parcial, bloqueio de reversões, lucro máximo por dia e prejuízo máximo por dia) e Filtros Diversos (sentido das operações, uso do after-market, bloqueio de nova entrada após saída, hora inicial e hora final para negociação). São utilizados os indicadores Médias Móveis, HiLo Activator, MACD, ADX, Estocástico, VWAP, IFR, Bandas de Bollinger, Stop ATR e SAR Parabólico
