Auto TrendLines [TradingFinder] Support Resistance Signal Alerts🔵 Introduction
The trendline is one of the most essential tools in technical analysis, widely used in financial markets such as Forex, cryptocurrency, and stocks. A trendline is a straight line that connects swing highs or swing lows and visually indicates the market’s trend direction.
Traders use trendlines to identify price structure, the strength of buyers and sellers, dynamic support and resistance zones, and optimal entry and exit points.
In technical analysis, trendlines are typically classified into three categories: uptrend lines (drawn by connecting higher lows), downtrend lines (formed by connecting lower highs), and sideways trends (moving horizontally). A valid trendline usually requires at least three confirmed touchpoints to be considered reliable for trading decisions.
Trendlines can serve as the foundation for a variety of trading strategies, such as the trendline bounce strategy, valid breakout setups, and confluence-based analysis with other tools like candlestick patterns, divergences, moving averages, and Fibonacci levels.
Additionally, trendlines are categorized into internal and external, and further into major and minor levels, each serving unique roles in market structure analysis.
🔵 How to Use
Trendlines are a key component in technical analysis, used to identify market direction, define dynamic support and resistance zones, highlight strategic entry and exit points, and manage risk. For a trendline to be reliable, it must be drawn based on structural principles—not by simply connecting two arbitrary points.
🟣 Selecting Pivot Types Based on Trend Direction
The first step is to determine the market trend: uptrend, downtrend, or sideways.
Then, choose pivot points that match the trend type :
In an uptrend, trendlines are drawn by connecting low pivots, especially higher lows.
In a downtrend, trendlines are formed by connecting high pivots, specifically lower highs.
It is crucial to connect pivots of the same type and structure to ensure the trendline is valid and analytically sound.
🟣 Pivot Classification
This indicator automatically classifies pivot points into two categories :
Major Pivots :
MLL : Major Lower Low
MHL : Major Higher Low
MHH : Major Higher High
MLH : Major Lower High
These define the primary structure of the market and are typically used in broader structural analysis.
Minor Pivots :
mLL: minor Lower Low
mHL: minor Higher Low
mHH: minor Higher High
mLH: minor Lower High
These are used for drawing more precise trendlines within corrective waves or internal price movements.
Example : In a downtrend, drawing a trendline from an MHH to an mHH creates structural inconsistency and introduces noise. Instead, connect points like MHL to MHL or mLH to mLH for a valid trendline.
🟣 Drawing High-Precision Trendlines
To ensure a reliable trendline :
Use pivots of the same classification (Major with Major or Minor with Minor).
Ensure at least three valid contact points (three touches = structural confirmation).
Draw through candles with the least deviation (choose wicks or bodies based on confluence).
Preferably draw from right to left for better alignment with current market behavior.
Use parallel lines to turn a single trendline into a trendline zone, if needed.
🟣 Using Trendlines for Trade Entries
Bounce Entry: When price approaches the trendline and shows signs of reversal (e.g., a reversal candle, divergence, or support/resistance), enter in the direction of the trend with a logical stop-loss.
Breakout Entry: When price breaks through the trendline with strong momentum and a confirmation (such as a retest or break of structure), consider trading in the direction of the breakout.
🟣 Trendline-Based Risk Management
For bounce entries, the stop-loss is placed below the trendline or the last pivot low (in an uptrend).
For breakout entries, the stop-loss is set behind the breakout candle or the last structural level.
A broken trendline can also act as an exit signal from a trade.
🟣 Combining Trendlines with Other Tools (Confluence)
Trendlines gain much more strength when used alongside other analytical tools :
Horizontal support and resistance levels
Moving averages (such as EMA 50 or EMA 200)
Fibonacci retracement zones
Candlestick patterns (e.g., Engulfing, Pin Bar)
RSI or MACD divergences
Market structure breaks (BoS / ChoCH)
🔵 Settings
Pivot Period : This defines how sensitive the pivot detection is. A higher number means the algorithm will identify more significant pivot points, resulting in longer-term trendlines.
Alerts
Alert :
Enable or disable the entire alert system
Set a custom alert name
Choose how often alerts trigger (every time, once per bar, or on bar close)
Select the time zone for alert timestamps (e.g., UTC)
Each trendline type supports two alert types :
Break Alert : Triggered when price breaks the trendline
React Alert : Triggered when price reacts or bounces off the trendline
These alerts can be independently enabled or disabled for all trendline categories (Major/Minor, Internal/External, Up/Down).
Display :
For each of the eight trendline types, you can control :
Whether to show or hide the line
Whether to delete the previous line when a new one is drawn
Color, line style (solid, dashed, dotted), extension direction (e.g., right only), and width
Major lines are typically thicker and more opaque, while minor lines appear thinner and more transparent.
All settings are designed to give the user full control over the appearance, behavior, and alert system of the indicator, without requiring manual drawing or adjustments.
🔵 Conclusion
A trendline is more than just a line on the chart—it is a structural, strategic, and flexible tool in technical analysis that can serve as the foundation for understanding price behavior and making trading decisions. Whether in trending markets or during corrections, trendlines help traders identify market direction, key zones, and high-potential entry and exit points with precision.
The accuracy and effectiveness of a trendline depend on using structurally valid pivot points and adhering to proper market logic, rather than relying on guesswork or personal bias.
This indicator is built to solve that exact problem. It automatically detects and draws multiple types of trendlines based on actual price structure, separating them into Major/Minor and Internal/External categories, and respecting professional analytical principles such as pivot type, trend direction, and structural location.
ابحث في النصوص البرمجية عن "wave"

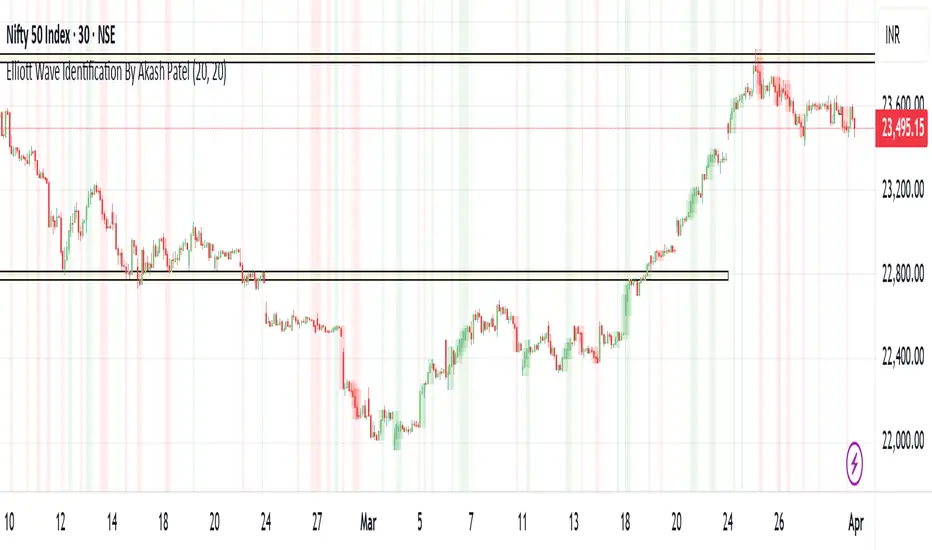
Elliott Wave Identification By Akash Patel
This script is designed to visually highlight areas on the chart where there are consecutive bullish (green) or bearish (red) candles. It also identifies sequences of three consecutive candles of the same type (bullish or bearish) and highlights those areas with adjustable box opacity. Here's a breakdown of the functionality:
---
### Key Features:
1. **Bullish & Bearish Candle Identification:**
- **Bullish Candle:** When the closing price is higher than the opening price (`close > open`).
- **Bearish Candle:** When the closing price is lower than the opening price (`close < open`).
2. **Consecutive Candle Counter:**
- The script counts consecutive bullish and bearish candles, which resets when the direction changes (from bullish to bearish or vice versa).
- The script tracks these counts using the `bullishCount` and `bearishCount` variables, which are incremented based on whether the current candle is bullish or bearish.
3. **Highlighting Candle Areas:**
- If there are **3 or more consecutive bullish candles**, the script will highlight the background in a green color with 90% transparency (adjustable).
- Similarly, if there are **3 or more consecutive bearish candles**, the script will highlight the background in a red color with 90% transparency (adjustable).
4. **Three-Candle Sequence:**
- The script checks if there are three consecutive bullish candles (`threeBullish`) or three consecutive bearish candles (`threeBearish`).
- A box is drawn around these areas to visually highlight the sequence. The boxes extend to the right edge of the chart, and their opacity can be adjusted.
5. **Box Creation:**
- For bullish sequences, a green box is created using the high and low prices of the three candles in the sequence.
- For bearish sequences, a red box is created in the same manner.
- The box size is determined by the highest high and the lowest low of the three consecutive candles.
6. **Box Opacity:**
- You can adjust the opacity of the boxes through the input parameters `Bullish Box Opacity` and `Bearish Box Opacity` (ranging from 0 to 100).
- A higher opacity will make the boxes more solid, while a lower opacity will make them more transparent.
7. **Box Cleanup:**
- The script also includes logic to remove boxes when they are no longer needed, ensuring the chart remains clean without excessive box overlays.
8. **Extending Boxes to the Right:**
- When a bullish or bearish sequence is identified, the boxes are extended to the right edge of the chart for continued visibility.
---
### How It Works:
- **Bullish Area Highlight:** When three or more consecutive bullish candles are detected, the background will turn green to indicate a strong bullish trend.
- **Bearish Area Highlight:** When three or more consecutive bearish candles are detected, the background will turn red to indicate a strong bearish trend.
- **Three Consecutive Candle Box:** A green box will appear around three consecutive bullish candles, and a red box will appear around three consecutive bearish candles. These boxes can be extended to the right edge of the chart, making the sequence visually clear.
---
### Adjustable Parameters:
1. **Bullish Box Opacity:** Set the opacity (transparency) level of the bullish boxes. Ranges from 0 (completely transparent) to 100 (completely opaque).
2. **Bearish Box Opacity:** Set the opacity (transparency) level of the bearish boxes. Ranges from 0 (completely transparent) to 100 (completely opaque).
---
This indicator is useful for identifying strong trends and visually confirming market momentum, especially in situations where you want to spot sequences of bullish or bearish candles over multiple bars. It can be customized to suit different trading styles and chart preferences by adjusting the opacity of the boxes and background highlights.
TriplePower55%🔴 Bearish Candle (Losing Candle)
🔹 Definition:
A candle that closes below the opening price.
Important condition: the body of the candle must be ≥ 55% of the entire candle's range.
It is automatically colored red on the platform.
🔹 Significance:
Used to identify resistance levels or initiate the Triple Power analysis.
The last valid bearish candle (with a body and that broke a bullish candle) is selected to draw Fibonacci levels.
🔹 How it's handled:
When the price closes above the high of the bearish candle, an upward wave begins.
The indicator draws a blue line at its high and a red line at its low, with the timeframe labeled (e.g., TF: M).
🟢 Bullish Candle (Winning Candle)
🔹 Definition:
A candle that closes above the opening price.
Its body must be ≥ 55% of the total candle's range.
It is automatically colored green on the platform.
🔹 Significance:
Used to identify support levels, or as a reference in extensions or pauses.
The last closed bullish candle is used to draw extension targets if there’s no valid bearish candle.
🔹 How it's handled:
If the price closes below the low of the monthly bullish candle, it signals the start of a strong downward trend.
If the low is not broken, the movement is considered a temporary pause.
The stop level is placed at the low of the last closed bullish candle.

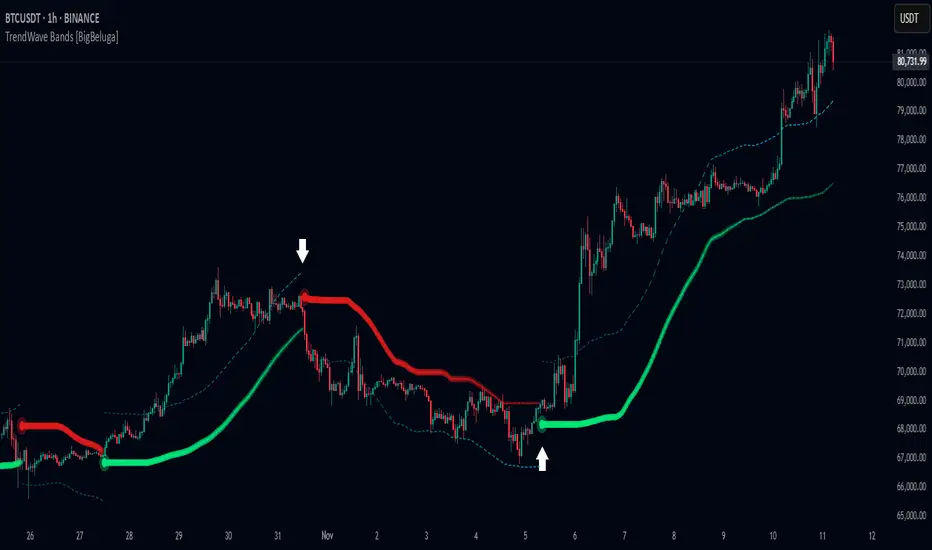
TrendWave Bands [BigBeluga]This is a trend-following indicator that dynamically adapts to market trends using upper and lower bands. It visually highlights trend strength and duration through color intensity while providing additional wave bands for deeper trend analysis.
🔵Key Features:
Adaptive Trend Bands:
➣ Displays a lower band in uptrends and an upper band in downtrends to indicate trend direction.
➣ The bands act as dynamic support and resistance levels, helping traders identify potential entry and exit points.
Wave Bands for Additional Analysis:
➣ A dashed wave band appears opposite the main trend band for deeper trend confirmation.
➣ In an uptrend, the upper dashed wave band helps analyze momentum, while in a downtrend, the lower dashed wave band serves the same purpose.
Gradient Color Intensity:
➣ The trend bands have a color gradient that fades as the trend continues, helping traders visualize trend duration.
➣ The wave bands have an inverse gradient effect—starting with low intensity at the trend's beginning and increasing in intensity as the trend progresses.
Trend Change Signals:
➣ Circular markers appear at trend reversals, providing clear entry and exit points.
➣ These signals mark transitions between bullish and bearish phases based on price action.
🔵Usage:
Trend Following: Use the lower band for confirmation in uptrends and the upper band in downtrends to stay on the right side of the market.
Trend Duration Analysis: Gradient wavebands give an idea of the duration of the current trend — new trends will have high-intensity colored wavebands and as time goes on, trends will fade.
Trend Reversal Detection: Circular markers highlight trend shifts, making it easier to spot entry and exit opportunities.
Volatility Awareness: Volatility-based bands help traders adjust their strategies based on market volatility, ensuring better risk management.
TrendWave Bands is a powerful tool for traders seeking to follow market trends with enhanced visual clarity. By combining trend bands, wave bands, and gradient-based color scaling, it provides a detailed view of market dynamics and trend evolution.
Bitcoin Polynomial Regression ModelThis is the main version of the script. Click here for the Oscillator part of the script.
💡Why this model was created:
One of the key issues with most existing models, including our own Bitcoin Log Growth Curve Model , is that they often fail to realistically account for diminishing returns. As a result, they may present overly optimistic bull cycle targets (hence, we introduced alternative settings in our previous Bitcoin Log Growth Curve Model).
This new model however, has been built from the ground up with a primary focus on incorporating the principle of diminishing returns. It directly responds to this concept, which has been briefly explored here .
📉The theory of diminishing returns:
This theory suggests that as each four-year market cycle unfolds, volatility gradually decreases, leading to more tempered price movements. It also implies that the price increase from one cycle peak to the next will decrease over time as the asset matures. The same pattern applies to cycle lows and the relationship between tops and bottoms. In essence, these price movements are interconnected and should generally follow a consistent pattern. We believe this model provides a more realistic outlook on bull and bear market cycles.
To better understand this theory, the relationships between cycle tops and bottoms are outlined below:https://www.tradingview.com/x/7Hldzsf2/
🔧Creation of the model:
For those interested in how this model was created, the process is explained here. Otherwise, feel free to skip this section.
This model is based on two separate cubic polynomial regression lines. One for the top price trend and another for the bottom. Both follow the general cubic polynomial function:
ax^3 +bx^2 + cx + d.
In this equation, x represents the weekly bar index minus an offset, while a, b, c, and d are determined through polynomial regression analysis. The input (x, y) values used for the polynomial regression analysis are as follows:
Top regression line (x, y) values:
113, 18.6
240, 1004
451, 19128
655, 65502
Bottom regression line (x, y) values:
103, 2.5
267, 211
471, 3193
676, 16255
The values above correspond to historical Bitcoin cycle tops and bottoms, where x is the weekly bar index and y is the weekly closing price of Bitcoin. The best fit is determined using metrics such as R-squared values, residual error analysis, and visual inspection. While the exact details of this evaluation are beyond the scope of this post, the following optimal parameters were found:
Top regression line parameter values:
a: 0.000202798
b: 0.0872922
c: -30.88805
d: 1827.14113
Bottom regression line parameter values:
a: 0.000138314
b: -0.0768236
c: 13.90555
d: -765.8892
📊Polynomial Regression Oscillator:
This publication also includes the oscillator version of the this model which is displayed at the bottom of the screen. The oscillator applies a logarithmic transformation to the price and the regression lines using the formula log10(x) .
The log-transformed price is then normalized using min-max normalization relative to the log-transformed top and bottom regression line with the formula:
normalized price = log(close) - log(bottom regression line) / log(top regression line) - log(bottom regression line)
This transformation results in a price value between 0 and 1 between both the regression lines. The Oscillator version can be found here.
🔍Interpretation of the Model:
In general, the red area represents a caution zone, as historically, the price has often been near its cycle market top within this range. On the other hand, the green area is considered an area of opportunity, as historically, it has corresponded to the market bottom.
The top regression line serves as a signal for the absolute market cycle peak, while the bottom regression line indicates the absolute market cycle bottom.
Additionally, this model provides a predicted range for Bitcoin's future price movements, which can be used to make extrapolated predictions. We will explore this further below.
🔮Future Predictions:
Finally, let's discuss what this model actually predicts for the potential upcoming market cycle top and the corresponding market cycle bottom. In our previous post here , a cycle interval analysis was performed to predict a likely time window for the next cycle top and bottom:
In the image, it is predicted that the next top-to-top cycle interval will be 208 weeks, which translates to November 3rd, 2025. It is also predicted that the bottom-to-top cycle interval will be 152 weeks, which corresponds to October 13th, 2025. On the macro level, these two dates align quite well. For our prediction, we take the average of these two dates: October 24th 2025. This will be our target date for the bull cycle top.
Now, let's do the same for the upcoming cycle bottom. The bottom-to-bottom cycle interval is predicted to be 205 weeks, which translates to October 19th, 2026, and the top-to-bottom cycle interval is predicted to be 259 weeks, which corresponds to October 26th, 2026. We then take the average of these two dates, predicting a bear cycle bottom date target of October 19th, 2026.
Now that we have our predicted top and bottom cycle date targets, we can simply reference these two dates to our model, giving us the Bitcoin top price prediction in the range of 152,000 in Q4 2025 and a subsequent bottom price prediction in the range of 46,500 in Q4 2026.
For those interested in understanding what this specifically means for the predicted diminishing return top and bottom cycle values, the image below displays these predicted values. The new values are highlighted in yellow:
And of course, keep in mind that these targets are just rough estimates. While we've done our best to estimate these targets through a data-driven approach, markets will always remain unpredictable in nature. What are your targets? Feel free to share them in the comment section below.

Bitcoin Polynomial Regression OscillatorThis is the oscillator version of the script. Click here for the other part of the script.
💡Why this model was created:
One of the key issues with most existing models, including our own Bitcoin Log Growth Curve Model , is that they often fail to realistically account for diminishing returns. As a result, they may present overly optimistic bull cycle targets (hence, we introduced alternative settings in our previous Bitcoin Log Growth Curve Model).
This new model however, has been built from the ground up with a primary focus on incorporating the principle of diminishing returns. It directly responds to this concept, which has been briefly explored here .
📉The theory of diminishing returns:
This theory suggests that as each four-year market cycle unfolds, volatility gradually decreases, leading to more tempered price movements. It also implies that the price increase from one cycle peak to the next will decrease over time as the asset matures. The same pattern applies to cycle lows and the relationship between tops and bottoms. In essence, these price movements are interconnected and should generally follow a consistent pattern. We believe this model provides a more realistic outlook on bull and bear market cycles.
To better understand this theory, the relationships between cycle tops and bottoms are outlined below:https://www.tradingview.com/x/7Hldzsf2/
🔧Creation of the model:
For those interested in how this model was created, the process is explained here. Otherwise, feel free to skip this section.
This model is based on two separate cubic polynomial regression lines. One for the top price trend and another for the bottom. Both follow the general cubic polynomial function:
ax^3 +bx^2 + cx + d.
In this equation, x represents the weekly bar index minus an offset, while a, b, c, and d are determined through polynomial regression analysis. The input (x, y) values used for the polynomial regression analysis are as follows:
Top regression line (x, y) values:
113, 18.6
240, 1004
451, 19128
655, 65502
Bottom regression line (x, y) values:
103, 2.5
267, 211
471, 3193
676, 16255
The values above correspond to historical Bitcoin cycle tops and bottoms, where x is the weekly bar index and y is the weekly closing price of Bitcoin. The best fit is determined using metrics such as R-squared values, residual error analysis, and visual inspection. While the exact details of this evaluation are beyond the scope of this post, the following optimal parameters were found:
Top regression line parameter values:
a: 0.000202798
b: 0.0872922
c: -30.88805
d: 1827.14113
Bottom regression line parameter values:
a: 0.000138314
b: -0.0768236
c: 13.90555
d: -765.8892
📊Polynomial Regression Oscillator:
This publication also includes the oscillator version of the this model which is displayed at the bottom of the screen. The oscillator applies a logarithmic transformation to the price and the regression lines using the formula log10(x) .
The log-transformed price is then normalized using min-max normalization relative to the log-transformed top and bottom regression line with the formula:
normalized price = log(close) - log(bottom regression line) / log(top regression line) - log(bottom regression line)
This transformation results in a price value between 0 and 1 between both the regression lines.
🔍Interpretation of the Model:
In general, the red area represents a caution zone, as historically, the price has often been near its cycle market top within this range. On the other hand, the green area is considered an area of opportunity, as historically, it has corresponded to the market bottom.
The top regression line serves as a signal for the absolute market cycle peak, while the bottom regression line indicates the absolute market cycle bottom.
Additionally, this model provides a predicted range for Bitcoin's future price movements, which can be used to make extrapolated predictions. We will explore this further below.
🔮Future Predictions:
Finally, let's discuss what this model actually predicts for the potential upcoming market cycle top and the corresponding market cycle bottom. In our previous post here , a cycle interval analysis was performed to predict a likely time window for the next cycle top and bottom:
In the image, it is predicted that the next top-to-top cycle interval will be 208 weeks, which translates to November 3rd, 2025. It is also predicted that the bottom-to-top cycle interval will be 152 weeks, which corresponds to October 13th, 2025. On the macro level, these two dates align quite well. For our prediction, we take the average of these two dates: October 24th 2025. This will be our target date for the bull cycle top.
Now, let's do the same for the upcoming cycle bottom. The bottom-to-bottom cycle interval is predicted to be 205 weeks, which translates to October 19th, 2026, and the top-to-bottom cycle interval is predicted to be 259 weeks, which corresponds to October 26th, 2026. We then take the average of these two dates, predicting a bear cycle bottom date target of October 19th, 2026.
Now that we have our predicted top and bottom cycle date targets, we can simply reference these two dates to our model, giving us the Bitcoin top price prediction in the range of 152,000 in Q4 2025 and a subsequent bottom price prediction in the range of 46,500 in Q4 2026.
For those interested in understanding what this specifically means for the predicted diminishing return top and bottom cycle values, the image below displays these predicted values. The new values are highlighted in yellow:
And of course, keep in mind that these targets are just rough estimates. While we've done our best to estimate these targets through a data-driven approach, markets will always remain unpredictable in nature. What are your targets? Feel free to share them in the comment section below.

Rolling Cumulative Volume DeltaRolling CVD is your market’s lie detector no resets, just raw volume truth! checks: close > open? Add volume (buyers flexing). Close < open? Subtract it (sellers sulking). Ties = zero. It rolls forever, plotting the vibe.
Use it when price fakes you out rising but CVD dips? Trouble. Dropping but CVD climbs? Sneaky strength. Perfect for scalpers sniffing momentum, swing traders riding waves, or that volume-obsessed buddy who overanalyses everything!
Shines best on timeframes under 15m to catch those sneaky price fibs in action!
Don’t bet your lunch money on Rolling CVD alone, you wild child! Pair it with your fave indicators RSI, moving averages, tea leaves, whatever because confluence is king. It’s a sly hint, not a crystal ball, so trade smart or the market’ll spank ya!

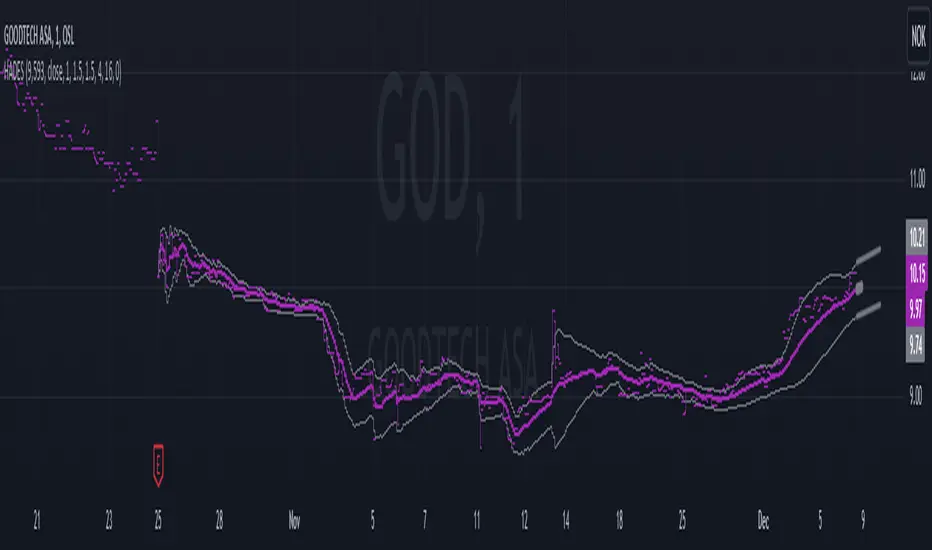
RSI Volatility Suppression Zones [BigBeluga]RSI Volatility Suppression Zones is an advanced indicator that identifies periods of suppressed RSI volatility and visualizes these suppression zones on the main chart. It also highlights breakout dynamics, giving traders actionable insights into potential market momentum.
🔵 Key Features:
Detection of Suppression Zones:
Identifies periods where RSI volatility is suppressed and marks these zones on the main price chart.
Breakout Visualization:
When the price breaks above the suppression zone, the box turns aqua, and an upward label is drawn to indicate a bullish breakout.
If the price breaks below the zone, the box turns purple, and a downward label is drawn for a bearish breakout.
Breakouts accompanied by a "+" label represent strong moves caused by short-lived, tight zones, signaling significant momentum.
Wave Labels for Consolidation:
If the suppression zone remains unbroken, a "wave" label is displayed within the gray box, signifying continued price stability within the range.
Gradient Intensity Below RSI:
A gradient strip below the RSI line increases in intensity based on the duration of the suppressed RSI volatility period.
This visual aid helps traders gauge how extended the low volatility phase is.
🔵 Usage:
Identify Breakouts: Use color-coded boxes and labels to detect breakouts and their direction, confirming potential trend continuation or reversals.
Evaluate Market Momentum: Leverage "+" labels for strong breakout signals caused by short suppression phases, indicating significant market moves.
Monitor Price Consolidation: Observe gray boxes and wave labels to understand ongoing consolidation phases.
Analyze RSI Behavior: Utilize the gradient strip to measure the longevity of suppressed volatility phases and anticipate breakout potential.
RSI Volatility Suppression Zones provides a powerful visual representation of RSI volatility suppression, breakout signals, and price consolidation, making it a must-have tool for traders seeking to anticipate market movements effectively.

Adaptive Fourier Transform Supertrend [QuantAlgo]Discover a brand new way to analyze trend with Adaptive Fourier Transform Supertrend by QuantAlgo , an innovative technical indicator that combines the power of Fourier analysis with dynamic Supertrend methodology. In essence, it utilizes the frequency domain mathematics and the adaptive volatility control technique to transform complex wave patterns into clear and high probability signals—ideal for both sophisticated traders seeking mathematical precision and investors who appreciate robust trend confirmation!
🟢 Core Architecture
At its core, this indicator employs an adaptive Fourier Transform framework with dynamic volatility-controlled Supertrend bands. It utilizes multiple harmonic components that let you fine-tune how market frequencies influence trend detection. By combining wave analysis with adaptive volatility bands, the indicator creates a sophisticated yet clear framework for trend identification that dynamically adjusts to changing market conditions.
🟢 Technical Foundation
The indicator builds on three innovative components:
Fourier Wave Analysis: Decomposes price action into primary and harmonic components for precise trend detection
Adaptive Volatility Control: Dynamically adjusts Supertrend bands using combined ATR and standard deviation
Harmonic Integration: Merges multiple frequency components with decreasing weights for comprehensive trend analysis
🟢 Key Features & Signals
The Adaptive Fourier Transform Supertrend transforms complex wave calculations into clear visual signals with:
Dynamic trend bands that adapt to market volatility
Sophisticated cloud-fill visualization system
Strategic L/S markers at key trend reversals
Customizable bar coloring based on trend direction
Comprehensive alert system for trend shifts
🟢 Practical Usage Tips
Here's how you can get the most out of the Adaptive Fourier Transform Supertrend :
1/ Setup:
Add the indicator to your favorites, then apply it to your chart ⭐️
Start with close price as your base source
Use standard Fourier period (14) for balanced wave detection
Begin with default harmonic weight (0.5) for balanced sensitivity
Start with standard Supertrend multiplier (2.0) for reliable band width
2/ Signal Interpretation:
Monitor trend band crossovers for potential signals
Watch for convergence of price with Fourier trend
Use L/S markers for trade entry points
Monitor bar colors for trend confirmation
Configure alerts for significant trend reversals
🟢 Pro Tips
Fine-tune Fourier parameters for optimal sensitivity:
→ Lower Base Period (8-12) for more reactive analysis
→ Higher Base Period (15-30) to filter out noise
→ Adjust Harmonic Weight (0.3-0.7) to control shorter trend influence
Customize Supertrend settings:
→ Lower multiplier (1.5-2.0) for tighter bands
→ Higher multiplier (2.0-3.0) for wider bands
→ Adjust ATR length based on market volatility
Strategy Enhancement:
→ Compare signals across multiple timeframes
→ Combine with volume analysis
→ Use with support/resistance levels
→ Integrate with other momentum indicators

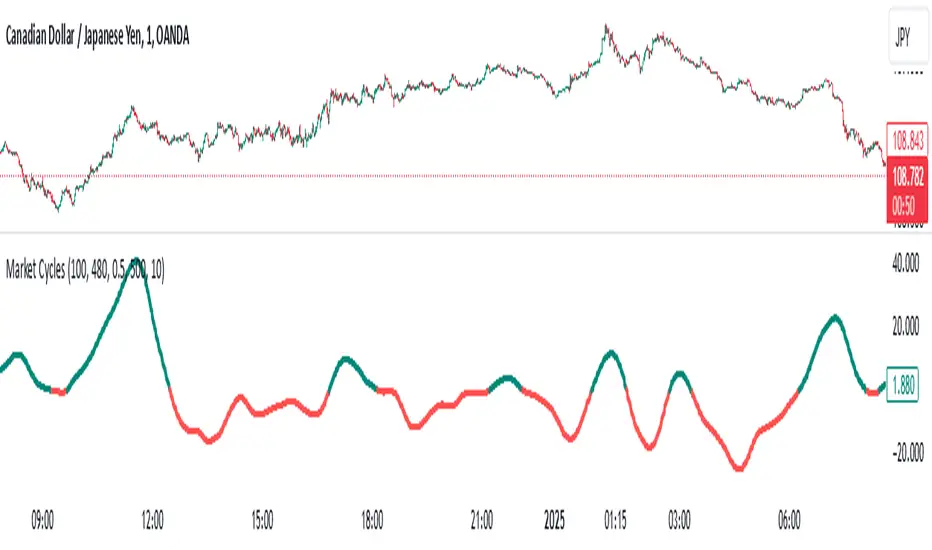
Market Cycles
The Market Cycles indicator transforms market price data into a stochastic wave, offering a unique perspective on market cycles. The wave is bounded between positive and negative values, providing clear visual cues for potential bullish and bearish trends. When the wave turns green, it signals a bullish cycle, while red indicates a bearish cycle.
Designed to show clarity and precision, this tool helps identify market momentum and cyclical behavior in an intuitive way. Ideal for fine-tuning entries or analyzing broader trends, this indicator aims to enhance the decision-making process with simplicity and elegance.
DemaRSI StrategyThis is a repost to a old script that cant be updated anymore, the request was made on Feb, 27, 2016.
Here's a engaging description for the tradingview script:
**DemaRSI Strategy: A Proven Trading System**
Join thousands of traders who have already experienced the power of this highly effective strategy. The DemaRSI system combines two powerful indicators - DEMA (Double Exponential Moving Average) and RSI (Relative Strength Index) - to generate profitable trades with minimal risk.
**Key Features:**
* **Trend-Following**: Our algorithm identifies strong trends using a combination of DEMA and RSI, allowing you to ride the waves of market momentum.
* **Risk Management**: The system includes built-in stop-loss and take-profit levels, ensuring that your gains are protected and losses are minimized.
* **Session-Based Trading**: Trade during specific sessions only (e.g., London or New York) for even more targeted results.
* **Customizable Settings**: Adjust the length of moving averages, RSI periods, and other parameters to suit your trading style.
**What You'll Get:**
* A comprehensive strategy that can be used with any broker or platform
* Easy-to-use interface with customizable settings
* Real-time performance metrics and backtesting capabilities
**Start Trading Like a Pro Today!**
This script is designed for intermediate to advanced traders who want to take their trading game to the next level. With its robust risk management features, this strategy can help you achieve consistent profits in various market conditions.
**Disclaimer:** This script is not intended as investment advice and should be used at your own discretion. Trading carries inherent risks, and losses are possible.
~Llama3

BTC/USDT Volume-Based StrategyOverview
There is a distinct difference between the buying pressure exerted by individual investors and the buying pressure of institutional or "whale" traders. Monitoring volume data over a shorter period of time is crucial to distinguish these subtle differences. When whale investors or other significant market players signal price increases, volume often surges noticeably. Indeed, volume often acts as an important leading indicator in market dynamics.
Key Features
This metric, calibrated with a 5-minute Bitcoin spot chart, identifies a significant inflow of trading volume. For every K-plus surge in trading volume, those candles are shown in a green circle.
When a green circle appears, consider active long positions in subsequent declines and continue to accumulate long positions despite temporary price declines. Pay attention to the continuity of the increase in volume before locking in earnings even after the initial bullish wave.
Conversely, it may be wise to reevaluate the long position if the volume is not increasing in parallel and the price is rising. Under these conditions, starting a partial short position may be advantageous until a larger surge in volume reappears.

Hybrid Adaptive Double Exponential Smoothing🙏🏻 This is HADES (Hybrid Adaptive Double Exponential Smoothing) : fully data-driven & adaptive exponential smoothing method, that gains all the necessary info directly from data in the most natural way and needs no subjective parameters & no optimizations. It gets applied to data itself -> to fit residuals & one-point forecast errors, all at O(1) algo complexity. I designed it for streaming high-frequency univariate time series data, such as medical sensor readings, orderbook data, tick charts, requests generated by a backend, etc.
The HADES method is:
fit & forecast = a + b * (1 / alpha + T - 1)
T = 0 provides in-sample fit for the current datum, and T + n provides forecast for n datapoints.
y = input time series
a = y, if no previous data exists
b = 0, if no previous data exists
otherwise:
a = alpha * y + (1 - alpha) * a
b = alpha * (a - a ) + (1 - alpha) * b
alpha = 1 / sqrt(len * 4)
len = min(ceil(exp(1 / sig)), available data)
sig = sqrt(Absolute net change in y / Sum of absolute changes in y)
For the start datapoint when both numerator and denominator are zeros, we define 0 / 0 = 1
...
The same set of operations gets applied to the data first, then to resulting fit absolute residuals to build prediction interval, and finally to absolute forecasting errors (from one-point ahead forecast) to build forecasting interval:
prediction interval = data fit +- resoduals fit * k
forecasting interval = data opf +- errors fit * k
where k = multiplier regulating intervals width, and opf = one-point forecasts calculated at each time t
...
How-to:
0) Apply to your data where it makes sense, eg. tick data;
1) Use power transform to compensate for multiplicative behavior in case it's there;
2) If you have complete data or only the data you need, like the full history of adjusted close prices: go to the next step; otherwise, guided by your goal & analysis, adjust the 'start index' setting so the calculations will start from this point;
3) Use prediction interval to detect significant deviations from the process core & make decisions according to your strategy;
4) Use one-point forecast for nowcasting;
5) Use forecasting intervals to ~ understand where the next datapoints will emerge, given the data-generating process will stay the same & lack structural breaks.
I advise k = 1 or 1.5 or 4 depending on your goal, but 1 is the most natural one.
...
Why exponential smoothing at all? Why the double one? Why adaptive? Why not Holt's method?
1) It's O(1) algo complexity & recursive nature allows it to be applied in an online fashion to high-frequency streaming data; otherwise, it makes more sense to use other methods;
2) Double exponential smoothing ensures we are taking trends into account; also, in order to model more complex time series patterns such as seasonality, we need detrended data, and this method can be used to do it;
3) The goal of adaptivity is to eliminate the window size question, in cases where it doesn't make sense to use cumulative moving typical value;
4) Holt's method creates a certain interaction between level and trend components, so its results lack symmetry and similarity with other non-recursive methods such as quantile regression or linear regression. Instead, I decided to base my work on the original double exponential smoothing method published by Rob Brown in 1956, here's the original source , it's really hard to find it online. This cool dude is considered the one who've dropped exponential smoothing to open access for the first time🤘🏻
R&D; log & explanations
If you wanna read this, you gotta know, you're taking a great responsability for this long journey, and it gonna be one hell of a trip hehe
Machine learning, apprentissage automatique, машинное обучение, digital signal processing, statistical learning, data mining, deep learning, etc., etc., etc.: all these are just artificial categories created by the local population of this wonderful world, but what really separates entities globally in the Universe is solution complexity / algorithmic complexity.
In order to get the game a lil better, it's gonna be useful to read the HTES script description first. Secondly, let me guide you through the whole R&D; process.
To discover (not to invent) the fundamental universal principle of what exponential smoothing really IS, it required the review of the whole concept, understanding that many things don't add up and don't make much sense in currently available mainstream info, and building it all from the beginning while avoiding these very basic logical & implementation flaws.
Given a complete time t, and yet, always growing time series population that can't be logically separated into subpopulations, the very first question is, 'What amount of data do we need to utilize at time t?'. Two answers: 1 and all. You can't really gain much info from 1 datum, so go for the second answer: we need the whole dataset.
So, given the sequential & incremental nature of time series, the very first and basic thing we can do on the whole dataset is to calculate a cumulative , such as cumulative moving mean or cumulative moving median.
Now we need to extend this logic to exponential smoothing, which doesn't use dataset length info directly, but all cool it can be done via a formula that quantifies the relationship between alpha (smoothing parameter) and length. The popular formulas used in mainstream are:
alpha = 1 / length
alpha = 2 / (length + 1)
The funny part starts when you realize that Cumulative Exponential Moving Averages with these 2 alpha formulas Exactly match Cumulative Moving Average and Cumulative (Linearly) Weighted Moving Average, and the same logic goes on:
alpha = 3 / (length + 1.5) , matches Cumulative Weighted Moving Average with quadratic weights, and
alpha = 4 / (length + 2) , matches Cumulative Weighted Moving Average with cubic weghts, and so on...
It all just cries in your shoulder that we need to discover another, native length->alpha formula that leverages the recursive nature of exponential smoothing, because otherwise, it doesn't make sense to use it at all, since the usual CMA and CMWA can be computed incrementally at O(1) algo complexity just as exponential smoothing.
From now on I will not mention 'cumulative' or 'linearly weighted / weighted' anymore, it's gonna be implied all the time unless stated otherwise.
What we can do is to approach the thing logically and model the response with a little help from synthetic data, a sine wave would suffice. Then we can think of relationships: Based on algo complexity from lower to higher, we have this sequence: exponential smoothing @ O(1) -> parametric statistics (mean) @ O(n) -> non-parametric statistics (50th percentile / median) @ O(n log n). Based on Initial response from slow to fast: mean -> median Based on convergence with the real expected value from slow to fast: mean (infinitely approaches it) -> median (gets it quite fast).
Based on these inputs, we need to discover such a length->alpha formula so the resulting fit will have the slowest initial response out of all 3, and have the slowest convergence with expected value out of all 3. In order to do it, we need to have some non-linear transformer in our formula (like a square root) and a couple of factors to modify the response the way we need. I ended up with this formula to meet all our requirements:
alpha = sqrt(1 / length * 2) / 2
which simplifies to:
alpha = 1 / sqrt(len * 8)
^^ as you can see on the screenshot; where the red line is median, the blue line is the mean, and the purple line is exponential smoothing with the formulas you've just seen, we've met all the requirements.
Now we just have to do the same procedure to discover the length->alpha formula but for double exponential smoothing, which models trends as well, not just level as in single exponential smoothing. For this comparison, we need to use linear regression and quantile regression instead of the mean and median.
Quantile regression requires a non-closed form solution to be solved that you can't really implement in Pine Script, but that's ok, so I made the tests using Python & sklearn:
paste.pics
^^ on this screenshot, you can see the same relationship as on the previous screenshot, but now between the responses of quantile regression & linear regression.
I followed the same logic as before for designing alpha for double exponential smoothing (also considered the initial overshoots, but that's a little detail), and ended up with this formula:
alpha = sqrt(1 / length) / 2
which simplifies to:
alpha = 1 / sqrt(len * 4)
Btw, given the pattern you see in the resulting formulas for single and double exponential smoothing, if you ever want to do triple (not Holt & Winters) exponential smoothing, you'll need len * 2 , and just len * 1 for quadruple exponential smoothing. I hope that based on this sequence, you see the hint that Maybe 4 rounds is enough.
Now since we've dealt with the length->alpha formula, we can deal with the adaptivity part.
Logically, it doesn't make sense to use a slower-than-O(1) method to generate input for an O(1) method, so it must be something universal and minimalistic: something that will help us measure consistency in our data, yet something far away from statistics and close enough to topology.
There's one perfect entity that can help us, this is fractal efficiency. The way I define fractal efficiency can be checked at the very beginning of the post, what matters is that I add a square root to the formula that is not typically added.
As explained in the description of my metric QSFS , one of the reasons for SQRT-transformed values of fractal efficiency applied in moving window mode is because they start to closely resemble normal distribution, yet with support of (0, 1). Data with this interesting property (normally distributed yet with finite support) can be modeled with the beta distribution.
Another reason is, in infinitely expanding window mode, fractal efficiency of every time series that exhibits randomness tends to infinitely approach zero, sqrt-transform kind of partially neutralizes this effect.
Yet another reason is, the square root might better reflect the dimensional inefficiency or degree of fractal complexity, since it could balance the influence of extreme deviations from the net paths.
And finally, fractals exhibit power-law scaling -> measures like length, area, or volume scale in a non-linear way. Adding a square root acknowledges this intrinsic property, while connecting our metric with the nature of fractals.
---
I suspect that, given analogies and connections with other topics in geometry, topology, fractals and most importantly positive test results of the metric, it might be that the sqrt transform is the fundamental part of fractal efficiency that should be applied by default.
Now the last part of the ballet is to convert our fractal efficiency to length value. The part about inverse proportionality is obvious: high fractal efficiency aka high consistency -> lower window size, to utilize only the last data that contain brand new information that seems to be highly reliable since we have consistency in the first place.
The non-obvious part is now we need to neutralize the side effect created by previous sqrt transform: our length values are too low, and exponentiation is the perfect candidate to fix it since translating fractal efficiency into window sizes requires something non-linear to reflect the fractal dynamics. More importantly, using exp() was the last piece that let the metric shine, any other transformations & formulas alike I've tried always had some weird results on certain data.
That exp() in the len formula was the last piece that made it all work both on synthetic and on real data.
^^ a standalone script calculating optimal dynamic window size
Omg, THAT took time to write. Comment and/or text me if you need
...
"Versace Pip-Boy, I'm a young gun coming up with no bankroll" 👻
∞
lib_kernelLibrary "lib_kernel"
Library "lib_kernel"
This is a tool / library for developers, that contains several common and adapted kernel functions as well as a kernel regression function and enum to easily select and embed a list into the settings dialog.
How to Choose and Modify Kernels in Practice
Compact Support Kernels (e.g., Epanechnikov, Triangular): Use for localized smoothing and emphasizing nearby data.
Oscillatory Kernels (e.g., Wave, Cosine): Ideal for detecting periodic patterns or mean-reverting behavior.
Smooth Tapering Kernels (e.g., Gaussian, Logistic): Use for smoothing long-term trends or identifying global price behavior.
kernel_Epanechnikov(u)
Parameters:
u (float)
kernel_Epanechnikov_alt(u, sensitivity)
Parameters:
u (float)
sensitivity (float)
kernel_Triangular(u)
Parameters:
u (float)
kernel_Triangular_alt(u, sensitivity)
Parameters:
u (float)
sensitivity (float)
kernel_Rectangular(u)
Parameters:
u (float)
kernel_Uniform(u)
Parameters:
u (float)
kernel_Uniform_alt(u, sensitivity)
Parameters:
u (float)
sensitivity (float)
kernel_Logistic(u)
Parameters:
u (float)
kernel_Logistic_alt(u)
Parameters:
u (float)
kernel_Logistic_alt2(u, sigmoid_steepness)
Parameters:
u (float)
sigmoid_steepness (float)
kernel_Gaussian(u)
Parameters:
u (float)
kernel_Gaussian_alt(u, sensitivity)
Parameters:
u (float)
sensitivity (float)
kernel_Silverman(u)
Parameters:
u (float)
kernel_Quartic(u)
Parameters:
u (float)
kernel_Quartic_alt(u, sensitivity)
Parameters:
u (float)
sensitivity (float)
kernel_Biweight(u)
Parameters:
u (float)
kernel_Triweight(u)
Parameters:
u (float)
kernel_Sinc(u)
Parameters:
u (float)
kernel_Wave(u)
Parameters:
u (float)
kernel_Wave_alt(u)
Parameters:
u (float)
kernel_Cosine(u)
Parameters:
u (float)
kernel_Cosine_alt(u, sensitivity)
Parameters:
u (float)
sensitivity (float)
kernel(u, select, alt_modificator)
wrapper for all standard kernel functions, see enum Kernel comments and function descriptions for usage szenarios and parameters
Parameters:
u (float)
select (series Kernel)
alt_modificator (float)
kernel_regression(src, bandwidth, kernel, exponential_distance, alt_modificator)
wrapper for kernel regression with all standard kernel functions, see enum Kernel comments for usage szenarios. performance optimized version using fixed bandwidth and target
Parameters:
src (float) : input data series
bandwidth (simple int) : sample window of nearest neighbours for the kernel to process
kernel (simple Kernel) : type of Kernel to use for processing, see Kernel enum or respective functions for more details
exponential_distance (simple bool) : if true this puts more emphasis on local / more recent values
alt_modificator (float) : see kernel functions for parameter descriptions. Mostly used to pronounce emphasis on local values or introduce a decay/dampening to the kernel output

Hybrid Triple Exponential Smoothing🙏🏻 TV, I present you HTES aka Hybrid Triple Exponential Smoothing, designed by Holt & Winters in the US, assembled by me in Saint P. I apply exponential smoothing individually to the data itself, then to residuals from the fitted values, and lastly to one-point forecast (OPF) errors, hence 'hybrid'. At the same time, the method is a closed-form solution and purely online, no need to make any recalculations & optimize anything, so the method is O(1).
^^ historical OPFs and one-point forecasting interval plotted instead of fitted values and prediction interval
Before the How-to, first let me tell you some non-obvious things about Triple Exponential smoothing (and about Exponential Smoothing in general) that not many catch. Expo smoothing seems very straightforward and obvious, but if you look deeper...
1) The whole point of exponential smoothing is its incremental/online nature, and its O(1) algorithm complexity, making it dope for high-frequency streaming data that is also univariate and has no weights. Consequently:
- Any hybrid models that involve expo smoothing and any type of ML models like gradient boosting applied to residuals rarely make much sense business-wise: if you have resources to boost the residuals, you prolly have resources to use something instead of expo smoothing;
- It also concerns the fashion of using optimizers to pick smoothing parameters; honestly, if you use this approach, you have to retrain on each datapoint, which is crazy in a streaming context. If you're not in a streaming context, why expo smoothing? What makes more sense is either picking smoothing parameters once, guided by exogenous info, or using dynamic ones calculated in a minimalistic and elegant way (more on that in further drops).
2) No matter how 'right' you choose the smoothing parameters, all the resulting components (level, trend, seasonal) are not pure; each of them contains a bit of info from the other components, this is just how non-sequential expo smoothing works. You gotta know this if you wanna use expo smoothing to decompose your time series into separate components. The only pure component there, lol, is the residuals;
3) Given what I've just said, treating the level (that does contain trend and seasonal components partially) as the resulting fit is a mistake. The resulting fit is level (l) + trend (b) + seasonal (s). And from this fit, you calculate residuals;
4) The residuals component is not some kind of bad thing; it is simply the component that contains info you consciously decide not to include in your model for whatever reason;
5) Forecasting Errors and Residuals from fitted values are 2 different things. The former are deltas between the forecasts you've made and actual values you've observed, the latter are simply differences between actual datapoints and in-sample fitted values;
6) Residuals are used for in-sample prediction intervals, errors for out-of-sample forecasting intervals;
7) Choosing between single, double, or triple expo smoothing should not be based exclusively on the nature of your data, but on what you need to do as well. For example:
- If you have trending seasonal data and you wanna do forecasting exclusively within the expo smoothing framework, then yes, you need Triple Exponential Smoothing;
- If you wanna use prediction intervals for generating trend-trading signals and you disregard seasonality, then you need single (simple) expo smoothing, even on trending data. Otherwise, the trend component will be included in your model's fitted values → prediction intervals.
8) Kind of not non-obvious, but when you put one smoothing parameter to zero, you basically disregard this component. E.g., in triple expo smoothing, when you put gamma and beta to zero, you basically end up with single exponential smoothing.
^^ data smoothing, beta and gamma zeroed out, forecasting steps = 0
About the implementation
* I use a simple power transform that results in a log transform with lambda = 0 instead of the mainstream-used transformers (if you put lambda on 2 in Box-Cox, you won't get a power of 2 transform)
* Separate set of smoothing parameters for data, residuals, and errors smoothing
* Separate band multipliers for residuals and errors
* Both typical error and typical residuals get multiplied by math.sqrt(math.pi / 2) in order to approach standard deviation so you can ~use Z values and get more or less corresponding probabilities
* In script settings → style, you can switch on/off plotting of many things that get calculated internally:
- You can visualize separate components (just remember they are not pure);
- You can switch off fit and switch on OPF plotting;
- You can plot residuals and their exponentially smoothed typical value to pick the smoothing parameters for both data and residuals;
- Or you might plot errors and play with data smoothing parameters to minimize them (consult SAE aka Sum of Absolute Errors plot);
^^ nuff said
More ideas on how to use the thing
1) Use Double Exponential Smoothing (data gamma = 0) to detrend your time series for further processing (Fourier likes at least weakly stationary data);
2) Put single expo smoothing on your strategy/subaccount equity chart (data alpha = data beta = 0), set prediction interval deviation multiplier to 1, run your strat live on simulator, start executing on real market when equity on simulator hits upper deviation (prediction interval), stop trading if equity hits lower deviation on simulator. Basically, let the strat always run on simulator, but send real orders to a real market when the strat is successful on your simulator;
3) Set up the model to minimize one-point forecasting errors, put error forecasting steps to 1, now you're doing nowcasting;
4) Forecast noisy trending sine waves for fun.
^^ nuff said 2
All Good TV ∞

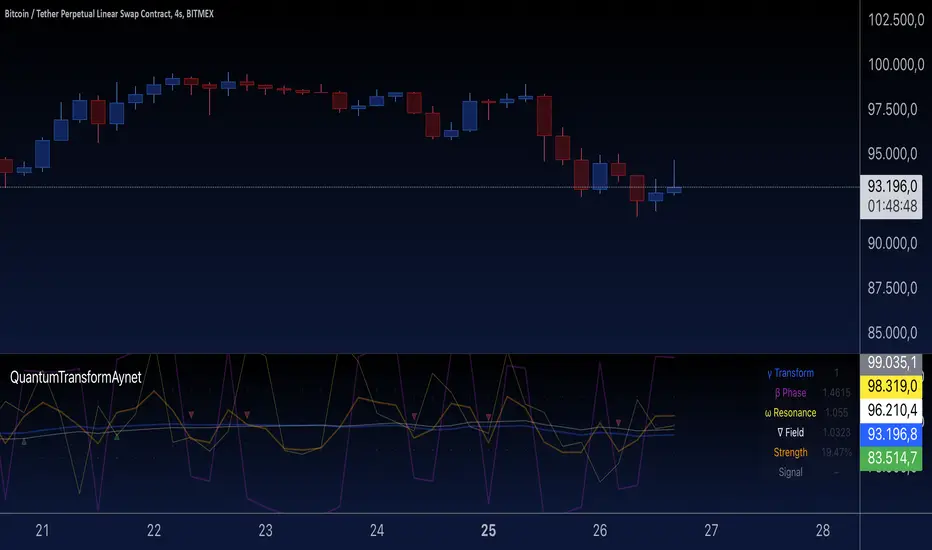
Quantum Transform - AynetQuantum Transform Trading Indicator: Explanation
This script is called a "Quantum Transform Trading Indicator" and aims to enhance market analysis by applying complex mathematical models. Written in Pine Script, the indicator includes the following elements:
1. General Structure
Quantum Parameters: Inspired by physical and mathematical concepts (Planck constant ℏ, wave function Ψ, time τ, etc.), it uses specific parameters.
Transformation Functions: Applies various mathematical operations to transform price data in different ways.
Signal Generation: Produces signals for long and short positions.
Visualization: Displays different price transformations and signals on the chart.
2. Core Parameters
The parameters allow users to control various transformations:
Planck Constant (ℏ): A scaling factor for wave modulation.
Wave (Ψ): Controls oscillation in price data.
Time (τ): The length of the lookback period for calculations.
Relativity (γ): Power factor in the Lorentz transformation.
Phase Shift (β): Manages phase shift in transformations.
Frequency (ω): Represents the frequency of price movements.
Dimensions (∇): Enables multi-dimensional field analysis.
3. Functions
a) Relativistic Transform
Inspired by the theory of relativity.
Calculates the Lorentz factor using the rate of price change.
Transforms price data to amplify the relativity effect.
b) Phase Transform
Calculates the phase of price data and applies wave modulation.
Creates phase and amplitude modulation based on the bar index.
c) Resonance Transform
Calculates resonance effects using natural frequency and oscillations.
Highlights periodic behaviors of price movements.
d) Field Transform
Applies multi-dimensional field calculations.
Combines strength, wave, and coherence aspects of price data.
e) Chaos Transform
Implements a chaos effect based on sensitivity analysis.
Simulates chaotic behaviors of price movements.
4. Main Calculations
Quantum Price: The average of all transformation functions.
Bands:
Upper Band: The highest level of quantum price.
Lower Band: The lowest level of quantum price.
Mid Band: The average of upper and lower bands.
Momentum: Calculates the rate of change in quantum price.
5. Signal Generation
Long Signal:
Triggered when the phase price crosses above the field price.
Momentum must be positive, and the price above the mid-band.
Short Signal:
Triggered when the phase price crosses below the field price.
Momentum must be negative, and the price below the mid-band.
Signal strength is calculated relative to the momentum moving average.
6. Visualization
Each transformation is displayed in a unique color.
Bands and Momentum: Visualize price behavior.
Signal Icons: Show buy/sell signals using up/down arrows on the chart.
7. Information Panel
A table in the top-right corner of the chart displays:
The current values of each transformation.
Signal strength (as a percentage).
The type of signal (⬆: Long, ⬇: Short).
Applications
Trend Following: Analyze trends with complex transformations.
Resonance and Chaos Analysis: Understand dynamic behaviors of price.
Signal Strategies: Create strong and reliable buy/sell signals.
If you have any additional questions or customization requests regarding this indicator, feel free to ask!
Optimized Future Time Cycles V2Time Cycle-Based Indicator Overview
This script utilizes Time Cycles to visually display the periodic fluctuations of the past and future, helping to predict key market turning points and trend shifts.
The indicator is fully customizable and marks periodic vertical lines and labels on the chart based on a specified reference date.
1. Key Features
Time Cycle Settings
Displays various user-defined time cycles (e.g., 9 days, 17 days, 26 days) visually on the chart.
Each cycle is distinguished by unique colors and labels for clear identification.
Allows users to set a reference date, from which past and future cycles are calculated.
Past and Future Cycle Visualization
Future Cycles:
Predicts potential points of market fluctuations or trend changes in the future.
Vertical lines represent future turning points based on the defined time cycles.
Past Cycles:
Displays how cyclical patterns manifested in historical market data.
Helps identify recurring patterns and similar historical market conditions.
Customizable Visuals
Adjust line styles (solid, dashed, etc.) and label spacing for a cleaner chart, even with multiple cycles displayed.
Separately toggle the visibility of past and future cycles for a more tailored analysis experience.
2. How to Use and Interpret the Indicator
Setting the Reference Date
The reference date is crucial for this indicator and works best when set to significant market events or turning points.
Both past and future cycles are calculated based on the reference date, and overlapping cycles may indicate periods of high volatility or strong trend shifts.
Cycle Analysis
Interpretation by Cycle Duration:
Short-term Cycles (9, 17 days): Useful for predicting quick market fluctuations.
Mid- to Long-term Cycles (26, 52, 200 days): Ideal for identifying major trend changes.
Overlapping Cycles:
When multiple cycles converge, significant turning points or strong market movements are likely.
Importance of Past Cycles
Past cycles are invaluable for identifying repetitive patterns in the market.
For example, analyzing strong turning points from past cycles can help anticipate similar scenarios in the future.
3. Tips for Using the Indicator
Optimize Line Styles:
When displaying both past and future cycles, charts may become cluttered. Adjusting line styles or colors can help maintain visual clarity.
Short-term vs. Long-term Cycles:
Short-term Cycles: Best suited for strategies like scalping or day trading.
Long-term Cycles: Useful for capturing major trend shifts or identifying macroeconomic changes.
Recommended Combination with Other Indicators:
Combine the Time Cycle indicator with moving averages, wave indicators, RSI, or Bollinger Bands for better results.
The time cycle identifies the timing of turning points, while tools like moving averages or RSI provide insights into trend direction during these critical moments.
4. Conclusion
This Time Cycle indicator visualizes past and future periodic fluctuations, enabling effective predictions of market trends and turning points.
The reference date and overlapping cycles are essential for pinpointing critical turning points.
The newly added past cycle visualization feature enhances the ability to recognize recurring patterns and leverage historical data for more accurate predictions.
시간 주기(Time Cycle) 기반 지표 소개
이 스크립트는 **시간 주기(Time Cycle)**를 활용해 과거와 미래의 주기적 변동을 시각적으로 보여주어, 시장의 추세 변화 시점과 변곡점을 예측하는 데 도움을 줍니다.
지표는 사용자 정의가 가능하며, 설정된 기준 날짜를 기반으로 주기적인 수직선과 레이블을 차트에 표시합니다.
1. 주요 기능
시간 주기 설정
사용자가 설정한 다양한 시간 주기(예: 9일, 17일, 26일 등)를 시각적으로 표시.
각 주기는 고유한 색상과 레이블로 구분되어 명확하게 차트에 나타납니다.
**기준 날짜(reference date)**를 설정하여, 해당 날짜를 기준으로 과거와 미래의 주기를 계산합니다.
미래와 과거 주기 표시
미래 주기:
미래의 시장 변동 시점이나 추세 변화 가능성이 높은 지점을 예측할 수 있습니다.
설정된 시간 주기에 따라 미래 변곡점을 차트에 수직선으로 나타냅니다.
과거 주기:
과거 시장에서 주기적 변동이 어떻게 나타났는지 확인 가능합니다.
이를 통해 반복되는 패턴이나 과거와 유사한 시장 상황을 파악할 수 있습니다.
시각적 사용자 설정
수직선 스타일(실선, 점선 등)과 레이블 간격을 조정하여, 복잡한 차트에서도 깔끔하게 정보를 확인할 수 있습니다.
과거와 미래의 주기 표시를 개별적으로 조정 가능하여 사용자 맞춤형 분석이 가능합니다.
2. 지표 사용 및 해석 방법
기준 날짜 설정
**기준 날짜(reference date)**는 시장에서 중요한 변동이 있었던 날을 기준으로 설정하는 것이 가장 효과적입니다.
기준 날짜를 기반으로 과거와 미래 주기가 계산되며, 주기가 겹치는 시점에서 강한 변동성이 나타날 가능성이 높습니다.
주기 분석
주기별 해석:
단기 주기 (9일, 17일): 빠른 변동성을 예측.
중·장기 주기 (26일, 52일, 200일): 큰 추세 변화를 예측.
주기가 겹치는 시점은 중요한 변곡점이 될 가능성이 크며, 추세 전환의 신호로 볼 수 있습니다.
과거 주기의 중요성
과거 주기는 시장의 반복 패턴을 찾는 데 유용합니다.
예를 들어, 과거 주기에서 강한 변곡점이 나타났던 시점을 분석하면, 미래에도 유사한 상황이 발생할 가능성을 예측할 수 있습니다.
3. 지표 활용 팁
수직선 스타일 최적화:
과거와 미래 주기를 모두 표시하면 차트가 복잡해질 수 있으므로, 선 스타일이나 색상을 조정하여 시각적으로 덜 혼란스럽게 설정하세요.
단기 vs. 장기 주기:
단기 주기는 스캘핑과 같은 빠른 매매 전략에 유용하며,
장기 주기는 대세 추세 변화를 포착하는 데 유리합니다.
결합 사용 추천:
시간 주기(Time Cycle) 지표는 이평선 파동 지표 또는 RSI, 볼린저 밴드와 함께 사용하면 더욱 효과적입니다.
시간 주기는 변곡점의 시점을 알려주고, 이평선 파동이나 RSI는 그 시점에서의 추세 방향성을 보완해 줍니다.
4. 결론
이 시간 주기(Time Cycle) 지표는 과거와 미래의 주기적 변동을 시각화하여, 시장의 추세 변화와 변곡점을 효과적으로 예측할 수 있습니다.
특히, 기준 날짜 설정과 주기적 겹침은 중요한 변곡점을 파악하는 핵심입니다.
새롭게 추가된 과거 주기 표시 기능은 반복 패턴을 확인하고 과거 데이터를 바탕으로 더 정교한 예측을 가능하게 합니다.

Hosoda ProjectionsThis script, written in Pine Script v5, introduces a technical analysis tool called "Hosoda Projections." Inspired by Ichimoku Kinkō Hyō and wave-based forecasting methods, this indicator helps traders visualize potential future price levels using a combination of pivot detection and projected price movements. It offers a unique way to anticipate market dynamics and define potential targets, making it particularly useful for those who seek to combine historical price patterns with forward-looking strategies.
The script works by detecting key pivot points in the market using a customizable lookback period and then calculating a ZigZag pattern based on price fluctuations that exceed a specified percentage threshold. These pivots are used to identify three recent swing points, which serve as the foundation for projecting possible future price levels. Using these swings, the script generates levels that correspond to Fibonacci-based extensions and projections, such as 38.2%, 61.8%, 100%, 161.8%, and additional extensions like 261.8% and 361.8%. These levels are visualized on the chart as horizontal lines and labeled with their respective values for easy interpretation.
The primary advantage of the Hosoda Projections script is its ability to provide a structured approach to identifying potential price targets. By leveraging the natural rhythm of price movements, it offers insights into where the market might find support or resistance in the future. This can help traders refine their entry and exit points, manage risk more effectively, and gain a deeper understanding of market sentiment. Additionally, the dynamic nature of the projections adapts to new price data, ensuring the tool remains relevant across changing market conditions.
This script is particularly valuable for traders who appreciate the harmony between historical price action and predictive analysis. Whether you are trading forex, stocks, or cryptocurrencies, the Hosoda Projections tool can enhance your trading strategy by providing actionable and visually intuitive forecasts.

Multi-Symbol Scanner: Advanced EMA-RSI-Volume Strategy# Multi-Symbol Tech Stock Scanner: Advanced EMA-RSI-Volume Strategy
## Technical Analysis Methodology
This scanner implements a sophisticated multi-timeframe analysis approach combining three key technical elements:
### 1. Dual EMA System (Primary Trend Detection)
- **Long-term EMA (820 periods)**: Acts as the primary trend identifier
- Chosen specifically for tech stocks' longer-term price waves
- Helps filter out minor market noise while capturing major trend changes
- 820 periods approximately represents 3.2 years of trading days
- **Medium-term EMA (320 periods)**: Serves as trend confirmation
- Approximately 1.25 years of trading data
- Provides earlier entry signals while maintaining trend reliability
- Helps identify potential trend reversals before the major trend shift
### 2. Volume Analysis Component
The script employs a dynamic volume analysis system:
- Calculates 20-period moving average of volume as baseline
- Requires 1.5x surge above baseline for signal confirmation
- Volume surge requirement helps filter out weak moves and potential false breakouts
- Different from standard volume indicators as it uses adaptive thresholds
### 3. RSI Momentum Filter
Implements a specialized RSI configuration:
- 14-period RSI with dynamic overbought/oversold levels
- Oversold threshold: 30 (customizable)
- Overbought threshold: 70 (customizable)
- Used as a confirmation tool rather than primary signal generator
## Signal Generation Logic
### Buy Signal Requirements
1. Price must cross above 820 EMA (PRIMARY CONDITION)
2. Current price must be above 320 EMA (CONFIRMATION)
3. RSI must be above 30 but below 70 (MOMENTUM CHECK)
4. Volume must be 1.5x above 20-period average (STRENGTH VALIDATION)
### Sell Signal Requirements
1. Price must cross below 820 EMA (PRIMARY CONDITION)
2. Current price must be below 320 EMA (CONFIRMATION)
3. RSI must be above 30 but below 70 (MOMENTUM CHECK)
4. Volume must be 1.5x above 20-period average (STRENGTH VALIDATION)
## Risk Management Integration
The script automatically calculates key risk levels based on volatility:
1. **Stop Loss Calculation**:
- Default: 2% below entry for buys
- Dynamically adjusted based on price point
- Can be modified through input parameters
2. **Take Profit Targets**:
- Primary target: 6% above entry (3:1 reward-risk ratio)
- Based on historical tech stock movement patterns
- Adjustable through input parameters
## Multi-Symbol Implementation
The scanner monitors 6 symbols simultaneously using:
- Separate security calls for each data point
- Optimized data requests to prevent overload
- Individual signal processing for each symbol
- Synchronized alert generation system
## Technical Implementation Details
1. **Data Processing**:
```
- Security data requests on 10-minute timeframe
- Individual EMA calculations per symbol
- Separate volume analysis threads
- RSI calculations with standard deviation normalization
```
2. **Signal Processing**:
```
- Cross-verification of all conditions
- Time-based signal validation
- Volume surge confirmation
- Trend alignment check
```
3. **Alert System**:
```
- Bar-close confirmation required
- Multi-condition validation
- Detailed price level inclusion
- Risk parameter integration
```
## Optimization Features
1. **Memory Usage**:
- Optimized security calls
- Efficient data structure
- Reduced redundant calculations
2. **Processing Efficiency**:
- Single-pass data analysis
- Combined indicator calculations
- Streamlined alert generation
## Practical Application
The system is designed for:
1. Swing Trading (primary use)
2. Position Trading (secondary use)
3. Technical Breakout Trading
Optimal timeframes:
- Primary: 4H charts
- Secondary: Daily charts
- Verification: 1H charts
## Default Configuration
The scanner is preset to monitor key tech stocks:
- TSLA: High-volatility tech leader
- NVDA: Semiconductor sector benchmark
- AVGO: Stable tech infrastructure
- TSM: Global chip manufacturer
- META: Social media sector leader
- AMZN: E-commerce/Cloud computing leader
Each symbol can be modified through input parameters.
## Version Information
- Current Version: 1.3
- Last Updated: November 2024
- Compatibility: TradingView Pro/Pro+/Premium
## Limitations & Considerations
- Limited to 6 symbols due to TradingView security request limits
- Requires consistent market volume for optimal performance
- Best suited for liquid stocks with significant daily volume
- May need parameter adjustments during extreme market conditions

Math Art with Fibonacci, Trigonometry, and Constants-AYNETScientific Explanation of the Code
This Pine Script code is a dynamic visual representation that combines mathematical constants, trigonometric functions, and Fibonacci sequences to generate geometrical patterns on a TradingView chart. The code leverages Pine Script’s drawing functions (line.new) and real-time bar data to create evolving shapes. Below is a detailed scientific explanation of its components:
1. Inputs and User-Defined Parameters
num_points: Specifies the number of points used to generate the geometrical pattern. Higher values result in more complex and smoother shapes.
scale: A scaling factor to adjust the size of the shape.
rotation: A dynamic rotation factor that evolves the shape over time based on the bar index (bar_index).
shape_color: Defines the color of the drawn shapes.
2. Mathematical Constants
The script employs essential mathematical constants:
Phi (ϕ): Known as the golden ratio
(
1
+
5
)
/
2
(1+
5
)/2, which governs proportions in Fibonacci spirals and natural growth patterns.
Pi (π): Represents the ratio of a circle's circumference to its diameter, crucial for trigonometric calculations.
Euler’s Number (e): The base of natural logarithms, incorporated in exponential growth modeling.
3. Geometric and Trigonometric Calculations
Fibonacci-Based Radius: The radius for each point is determined using a Fibonacci-inspired formula:
𝑟
=
scale
×
𝜙
⋅
𝑖
num_points
r=scale×
num_points
ϕ⋅i
Here,
𝑖
i is the point index. This ensures the shape grows proportionally based on the golden ratio.
Angle Calculation: The angular position of each point is calculated as:
𝜃
=
𝑖
⋅
Δ
𝜃
+
rotation
⋅
bar_index
100
θ=i⋅Δθ+rotation⋅
100
bar_index
where
Δ
𝜃
=
2
𝜋
num_points
Δθ=
num_points
2π
. This generates evenly spaced points along a circle, with dynamic rotation.
Coordinates: Cartesian coordinates
(
𝑥
,
𝑦
)
(x,y) for each point are derived using:
𝑥
=
𝑟
⋅
cos
(
𝜃
)
,
𝑦
=
𝑟
⋅
sin
(
𝜃
)
x=r⋅cos(θ),y=r⋅sin(θ)
These coordinates describe a polar-to-Cartesian transformation.
4. Dynamic Line Drawing
Connecting Points: For each pair of consecutive points, a line is drawn using:
line.new
(
𝑥
1
,
𝑦
1
,
𝑥
2
,
𝑦
2
)
line.new(x
1
,y
1
,x
2
,y
2
)
The coordinates are adjusted by:
bar_index: Aligns the x-axis to the chart’s time-based bar index.
int() Conversion: Ensures x-coordinates are integers, as required by line.new.
Line Properties:
Color: Set by the user.
Width: Fixed at 1 for simplicity.
5. Real-Time Adaptation
The shapes evolve dynamically as new bars form:
Rotation Over Time: The rotation parameter modifies angles proportionally to bar_index, creating a rotating effect.
Bar Index Alignment: Shapes are positioned relative to the current bar on the chart, ensuring synchronization with market data.
6. Visualization and Applications
This script generates evolving geometrical shapes, which have both aesthetic and educational value. Potential applications include:
Mathematical Visualization: Demonstrating the interplay of Fibonacci sequences, trigonometry, and geometry.
Technical Analysis: Serving as a visual overlay for price movement patterns, highlighting cyclical or wave-like behavior.
Dynamic Art: Creating visually appealing and evolving patterns on financial charts.
Scientific Relevance
This code synthesizes principles from:
Mathematical Analysis: Incorporates constants and formulas central to calculus, trigonometry, and algebra.
Geometry: Visualizes patterns derived from polar coordinates and Fibonacci scaling.
Real-Time Systems: Adapts dynamically to market data, showcasing practical applications of mathematics in financial visualization.
If further optimization or additional functionality is required, let me know! 😊

Trend of Multiple Oscillator Dashboard ModifiedDescription: The "Trend of Multiple Oscillator Dashboard Modified" is a powerful Pine Script indicator that provides a dashboard view of various oscillator and trend-following indicators across multiple timeframes. This indicator helps traders to assess trend conditions comprehensively by integrating popular technical indicators, including MACD, EMA, Stochastic, Elliott Wave, DID (Curta, Media, Longa), Price Volume Trend (PVT), Kuskus Trend, and Wave Trend Oscillator. Each indicator’s trend signal (bullish, bearish, or neutral) is displayed in a color-coded dashboard, making it easy to spot the consensus or divergence in trends across different timeframes.
Key Features:
Multi-Timeframe Analysis: Displays trend signals across five predefined timeframes (1, 2, 3, 5, and 10 minutes) for each included indicator.
Customizable Inputs: Allows for customization of key parameters for each oscillator and trend-following indicator.
Trend Interpretation: Each indicator is visually represented with green (bullish), red (bearish), and yellow (neutral) trend markers, making trend identification intuitive and quick.
Trade Condition Controls: Input options for the number of positive and negative conditions needed to trigger entries and exits, allowing users to refine the decision-making criteria.
Delay Management: Options for re-entry conditions based on both price movement (in points) and the minimum number of candles since the last exit, giving users flexibility in managing trade entries.
Usage: This indicator is ideal for traders who rely on multiple oscillators and moving averages to gauge trend direction and strength across timeframes. The dashboard allows users to observe trends at a glance and make informed decisions based on the alignment of various trend indicators. It’s particularly useful in consolidating signals for strategies that require multiple conditions to align before entering or exiting trades.
Note: Ensure that you’re familiar with each oscillator’s functionality, as some indicators like Elliott Wave and Wave Trend are simplified for visual coherence in this dashboard.
Disclaimer: This script is intended for educational and informational purposes only. Use it with caution and adapt it to your specific trading plan.
Developer's Remark: "This indicator's comprehensive design allows traders to filter noise and identify the most robust trends effectively. Use it to visualize trends across timeframes, understand oscillator behavior, and enhance decision-making with a more strategic approach."

Kalman Based VWAP [EdgeTerminal]Kalman VWAP is a different take on volume-weighted average price (VWAP) indicator where we enhance the results with Kalman filtering and dynamic wave visualization for a more smooth and improved trend identification and volatility analysis.
A little bit about Kalman Filter:
Kalman filtering (also known as linear quadratic estimation) is an algorithm that uses a series of measurements observed over time, including statistical noise and other inaccuracies, to produce estimates of unknown variables that tend to be more accurate than those based on a single measurement, by estimating a joint probability distribution over the variables for each time-step. The filter is constructed as a mean squared error minimiser, but an alternative derivation of the filter is also provided showing how the filter relates to maximum likelihood statistics
This indicator combines:
Volume-Weighted Average Price (VWAP) for institutional price levels
Kalman filtering for noise reduction and trend smoothing
Dynamic wave visualization for volatility zones
This creates a robust indicator that helps traders identify trends, support/resistance zones, and potential reversal points with high precision.
What makes this even more special is the fact that we use open price as a data source instead of usual close price. This allows you to tune the indicator more accurately when back testing it and generally get results that are closer to real time market data.
The math:
In case if you're interested in the math of this indicator, the indicator employs a state-space Kalman filter model:
State Equation: x_t = x_{t-1} + w_t
Measurement Equation: z_t = x_t + v_t
x_t is the filtered VWAP state
w_t is process noise ~ N(0, Q)
v_t is measurement noise ~ N(0, R)
z_t is the traditional VWAP measurement
The Kalman filter recursively updates through:
Prediction: x̂_t|t-1 = x̂_{t-1}
Update: x̂_t = x̂_t|t-1 + K_t(z_t - x̂_t|t-1)
Where K_t is the Kalman gain, optimally balancing between prediction and measurement.
Input Parameters
Measurement Noise: Controls signal smoothing (0.0001 to 1.0)
Process Noise: Adjusts trend responsiveness (0.0001 to 1.0)
Wave Size: Multiplier for volatility bands (0.1 to 5.0)
Trend Lookback: Period for trend determination (1 to 100)
Bull/Bear Colors: Customizable color schemes
Application:
I recommend using this along other indicators. This is best used for assets that don't have a close time, such as BTC but can be used with anything as long as the data is there.
With default settings, this works better for swing trades but you can adjust it for day trading as well, by adjusting the lookback and also process noise.

Rainbow EMA Areas with Volatility HighlightThe indicator provides traders with an enhanced visual tool to observe price movements, trend strength, and market volatility on their charts. It combines multiple EMAs (Exponential Moving Averages) with color-coded areas to indicate the market’s directional bias and a high-volatility highlight for detecting times of increased market activity.
Explanation of Key Components
Multiple EMAs (Exponential Moving Averages):
Six different EMAs are calculated for various periods (15, 45, 100, 150, 200, 300).
Each EMA period represents a different timeframe, from short-term to long-term trends, providing a well-rounded view of price behavior across different market cycles.
The EMAs are color-coded for easy differentiation:
Green shades indicate bullish trends when prices are above the EMAs.
Red shades indicate bearish trends when prices are below the EMAs.
The space between each EMA is filled with a gradient color, creating a "wave" effect that helps identify the market’s overall direction.
ATR-Based Volatility Detection:
The ATR (Average True Range), a measure of market volatility, is used to assess how much the price is fluctuating. When volatility is high, price movements are typically more significant, indicating potential trading opportunities or times to exercise caution.
The indicator calculates ATR and uses a customizable multiplier to set a high-volatility threshold.
When the ATR exceeds this threshold, it signals that the market is experiencing high volatility.
Visual High Volatility Highlight:
A yellow background appears on the chart during periods of high volatility, giving a subtle but clear visual indication that the market is active.
This highlight helps traders spot potential breakout areas or increased activity zones without obstructing the EMA areas.
Volatility Signal Markers:
Small, red triangular markers are plotted above price bars when high volatility is detected, marking these areas for additional emphasis.
These signals serve as alerts to help traders quickly recognize high volatility moments where price moves may be stronger.
How to Use This Indicator
Identify Trends Using EMA Areas:
Bullish Trend: When the price is above most or all EMAs, and the EMA areas are colored in shades of green, it indicates a strong bullish trend. Traders might look for buy opportunities in this scenario.
Bearish Trend: When the price is below most or all EMAs, and the EMA areas are colored in shades of red, it signals a bearish trend. This condition can suggest potential sell opportunities.
Consolidation or Neutral Trend: If the price is moving within the EMA bands without a clear green or red dominance, the market may be in a consolidation phase. This period often precedes a breakout in either direction.
Volatility-Based Entries and Exits:
High Volatility Areas: The yellow background and red triangular markers signal high-volatility areas. This information can be valuable for identifying potential breakout points or strong moves.
Trading in High Volatility: During high-volatility phases, the market may experience rapid price changes, which can be ideal for breakout trades. However, high volatility also involves higher risk, so traders may adjust their strategies accordingly (e.g., setting wider stops or adjusting position sizes).
Trading in Low Volatility: When the yellow background and markers are absent, volatility is lower, indicating a calmer market. In these times, traders may choose to look for range-bound trading opportunities or wait for the next trend to develop.
Combining with Other Indicators:
This indicator works well in combination with momentum or oscillating indicators like RSI or MACD, providing a well-rounded view of the market.
For example, if the indicator shows a bullish EMA area with high volatility, and an RSI is trending up, it could be a stronger buy signal. Conversely, if the indicator shows a bearish EMA area with high volatility and RSI is trending down, this could be a stronger sell signal.
Practical Trading Examples
Bullish Trend in High Volatility:
Price is above the EMAs, showing green EMA areas, and the high volatility background is active.
This indicates a strong bullish trend with significant price movement potential.
A trader could look for breakout or continuation entries in the direction of the trend.
Bearish Reversal Signal:
Price crosses below the EMAs, showing red EMA areas, while high volatility is also detected.
This suggests that the market may be reversing to a bearish trend with increased price movement.
Traders could consider taking short positions or setting stops on existing long trades.
This indicator is designed to provide a rich visual experience, making it easy to spot trends, consolidations, and volatility zones at a glance. It is best used by traders who benefit from visual cues and who seek a quick understanding of both trend direction and market activity. Let me know if you'd like further customization or additional functionalities!
