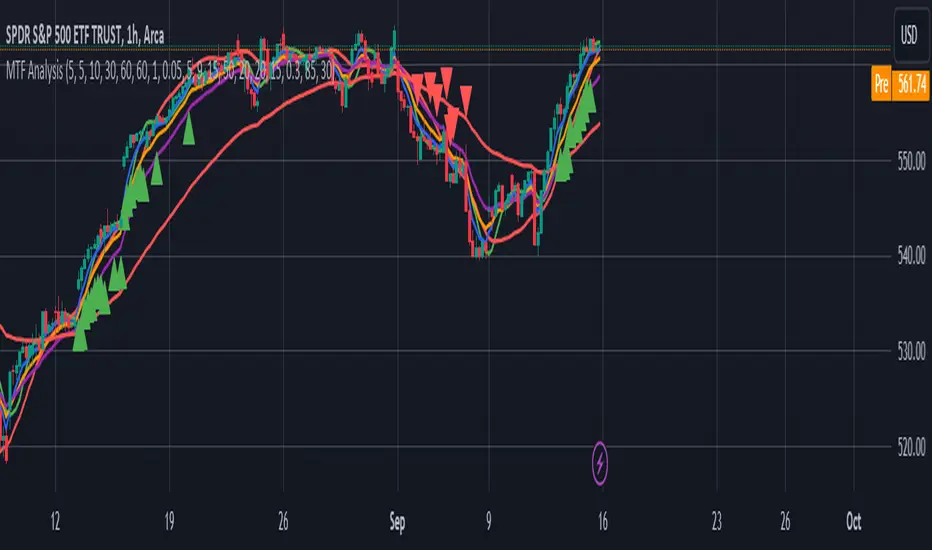
MTF AnalysisMTF Analysis - Multi-Timeframe TradingView Script
Overview: The "MTF Analysis" script provides a comprehensive approach to analyzing price trends across daily, weekly, and monthly timeframes using linear regression channels. It helps traders identify strong and weak bullish or bearish conditions based on the relationship between the current price and regression lines derived from multiple timeframes.
Key Features:
User-Defined Inputs:
Regression Lengths: Customize regression lengths for daily, weekly, and monthly timeframes.
Smoothing Length: Apply smoothing to regression lines.
Near-Zero Threshold: Filter out signals near a defined slope threshold for more refined analysis.
Daily Time Frame Filter: Optional filter to consider daily regression slope in signal generation.
Regression Line Calculation:
The script calculates linear regression lines for each timeframe (daily, weekly, monthly) and applies a smoothing function to refine the signals.
Signal Conditions:
Strong Bullish/Bearish: Signals generated when the price is consistently above/below weekly and monthly regression lines, with the option to apply the daily timeframe filter.
Weak Bullish/Bearish: Signals generated when the price is above/below the monthly regression line alone.
Visual Indicators:
The script plots regression lines on the chart with different colors for easy identification.
It also displays arrows on the chart to indicate strong or weak bullish/bearish signals.
Alerts:
Custom alerts for each signal condition help traders stay informed of potential trading opportunities.
This script is highly customizable, allowing traders to tailor it to their specific trading style and preferences.
This summary can be used to introduce the script to other traders or for publication on platforms like TradingView.
ابحث في النصوص البرمجية عن "weekly"
ICT NWOG/NDOG Gaps [TradingFinder] New Opening Gaps🔵 Introduction
🟣 Understanding ICT Opening Gaps
In the realm of technical analysis, mastering the art of recognizing market behavior and pinpointing key price levels is vital for making sound trading decisions. Among the array of tools available, the concept of opening gaps stands out for its ability to provide crucial insights.
The ICT (Inner Circle Trader) methodology offers a distinctive approach to understanding the importance of New Day Opening Gaps (NDOG), New Week Opening Gaps (NWOG), and New Monthly Opening Gaps (NMOG).
These gaps, representing the price differences between the close of a previous period and the open of the next, serve as key reference points that can greatly impact price movements.
The ICT trading approach highlights these gaps as potential zones of support and resistance. Prices often respond to these areas, either bouncing off or passing through and then retesting them. Within these gaps, significant levels such as the high and low are particularly important.
Additionally, the Event Horizon PD Array (EHPDA) concept, which is an intermediate level calculated from the average of neighboring NWOGs or NDOGs, adds another layer to this analysis.
This guide delves into ICT's New Daily, Weekly, and Monthly Opening Ranges, showing how these gaps can be effectively utilized in trading. By grasping the nuances of these gaps, traders can better forecast market behavior, identify key support and resistance levels, and refine their trading strategies.
🟣 The Gaps
1. New Week Opening Gap (NWOG) : The NWOG is the price gap between Friday's closing price and Sunday's opening price. This gap is particularly crucial for traders who monitor weekly trends. Depending on the direction of the gap, the NWOG often serves as a pivotal support or resistance level.
2. New Day Opening Gap (NDOG) : The NDOG signifies the price difference between the closing price of the previous day and the opening price of the current day. Much like the NWOG, the NDOG is a key reference point for intraday traders.
Prices typically react to these levels, either reversing or continuing through the gap after a retest. NDOGs are instrumental in identifying short-term support and resistance levels, aiding traders in making decisions based on daily price movements.
3. New Monthly Opening Gap (NMOG) : The NMOG represents the gap between the closing price of the previous month and the opening price of the current month.
This gap is especially valuable for traders focusing on long-term trends and macroeconomic factors. As with NWOGs and NDOGs, the NMOG can act as a significant support or resistance level.
🔵 How to Use
Identifying Support and Resistance : Opening gaps often indicate potential zones where prices might reverse or find support/resistance. For example, if a new day opens below the previous day’s close (creating a NDOG), this gap could act as resistance, prompting traders to consider short positions if the price retests this level without breaking through.
Conversely, if the price opens above the previous day’s close, the gap might serve as support, offering a potential entry point for long trades.
Gap Fill Strategy : A popular strategy associated with opening gaps is the "gap fill" approach, where traders anticipate that the price will eventually return to fill the gap.
For instance, if there’s a significant NDOG at market open, a trader might expect the price to retrace back to the previous day’s close, effectively "filling" the gap. This strategy is particularly effective in markets that exhibit mean-reverting behavior.
Combining Gaps with Other Indicators : Traders often enhance their analysis of NDOG, NWOG, and NMOG by integrating other technical indicators. Aligning gap levels with tools such as Fibonacci retracements, moving averages, or existing support and resistance zones can provide additional confirmation for trade entries and exits.
🔵 Setting
Show and Color : You can control the display or non-display of the range as well as the color of the range.
Max Opening Range Update Method : You can control the number of ranges that are updated. If it is "All", all ranges that are not mitigated will be displayed. If "Custom", the ranges will be updated based on the number you specify.
Max Opening Range Update : The number of ranges to update.
🔵 Conclusion
The ICT New Daily, Weekly, and Monthly Opening Ranges provide traders with a systematic approach to understanding market dynamics and identifying critical support and resistance levels.
By analyzing these gaps, traders can gain deeper insights into potential price movements, spot high-probability trade setups, and strengthen their overall trading strategy. Whether you are focused on short-term day trading or long-term market trends, incorporating NDOG, NWOG, and NMOG analysis into your trading plan can be a powerful addition to your toolkit.

Dual Chain StrategyDual Chain Strategy - Technical Overview
How It Works:
The Dual Chain Strategy is a unique approach to trading that utilizes Exponential Moving Averages (EMAs) across different timeframes, creating two distinct "chains" of trading signals. These chains can work independently or together, capturing both long-term trends and short-term price movements.
Chain 1 (Longer-Term Focus):
Entry Signal: The entry signal for Chain 1 is generated when the closing price crosses above the EMA calculated on a weekly timeframe. This suggests the start of a bullish trend and prompts a long position.
bullishChain1 = enableChain1 and ta.crossover(src1, entryEMA1)
Exit Signal: The exit signal is triggered when the closing price crosses below the EMA on a daily timeframe, indicating a potential bearish reversal.
exitLongChain1 = enableChain1 and ta.crossunder(src1, exitEMA1)
Parameters: Chain 1's EMA length is set to 10 periods by default, with the flexibility for user adjustment to match various trading scenarios.
Chain 2 (Shorter-Term Focus):
Entry Signal: Chain 2 generates an entry signal when the closing price crosses above the EMA on a 12-hour timeframe. This setup is designed to capture quicker, shorter-term movements.
bullishChain2 = enableChain2 and ta.crossover(src2, entryEMA2)
Exit Signal: The exit signal occurs when the closing price falls below the EMA on a 9-hour timeframe, indicating the end of the shorter-term trend.
exitLongChain2 = enableChain2 and ta.crossunder(src2, exitEMA2)
Parameters: Chain 2's EMA length is set to 9 periods by default, and can be customized to better align with specific market conditions or trading strategies.
Key Features:
Dual EMA Chains: The strategy's originality shines through its dual-chain configuration, allowing traders to monitor and react to both long-term and short-term market trends. This approach is particularly powerful as it combines the strengths of trend-following with the agility of momentum trading.
Timeframe Flexibility: Users can modify the timeframes for both chains, ensuring the strategy can be tailored to different market conditions and individual trading styles. This flexibility makes it versatile for various assets and trading environments.
Independent Trade Logic: Each chain operates independently, with its own set of entry and exit rules. This allows for simultaneous or separate execution of trades based on the signals from either or both chains, providing a robust trading system that can handle different market phases.
Backtesting Period: The strategy includes a configurable backtesting period, enabling thorough performance assessment over a historical range. This feature is crucial for understanding how the strategy would have performed under different market conditions.
time_cond = time >= startDate and time <= finishDate
What It Does:
The Dual Chain Strategy offers traders a distinctive trading tool that merges two separate EMA-based systems into one cohesive framework. By integrating both long-term and short-term perspectives, the strategy enhances the ability to adapt to changing market conditions. The originality of this script lies in its innovative dual-chain design, providing traders with a unique edge by allowing them to capitalize on both significant trends and smaller, faster price movements.
Whether you aim to capture extended market trends or take advantage of more immediate price action, the Dual Chain Strategy provides a comprehensive solution with a high degree of customization and strategic depth. Its flexibility and originality make it a valuable tool for traders seeking to refine their approach to market analysis and execution.
How to Use the Dual Chain Strategy
Step 1: Access the Strategy
Add the Script: Start by adding the Dual Chain Strategy to your TradingView chart. You can do this by searching for the script by name or using the link provided.
Select the Asset: Apply the strategy to your preferred trading pair or asset, such as #BTCUSD, to see how it performs.
Step 2: Configure the Settings
Enable/Disable Chains:
The strategy is designed with two independent chains. You can choose to enable or disable each chain depending on your trading style and the market conditions.
enableChain1 = input.bool(true, title='Enable Chain 1')
enableChain2 = input.bool(true, title='Enable Chain 2')
By default, both chains are enabled. If you prefer to focus only on longer-term trends, you might disable Chain 2, or vice versa if you prefer shorter-term trades.
Set EMA Lengths:
Adjust the EMA lengths for each chain to match your trading preferences.
Chain 1: The default EMA length is 10 periods. This chain uses a weekly timeframe for entry signals and a daily timeframe for exits.
len1 = input.int(10, minval=1, title='Length Chain 1 EMA', group="Chain 1")
Chain 2: The default EMA length is 9 periods. This chain uses a 12-hour timeframe for entries and a 9-hour timeframe for exits.
len2 = input.int(9, minval=1, title='Length Chain 2 EMA', group="Chain 2")
Customize Timeframes:
You can customize the timeframes used for entry and exit signals for both chains.
Chain 1:
Entry Timeframe: Weekly
Exit Timeframe: Daily
tf1_entry = input.timeframe("W", title='Chain 1 Entry Timeframe', group="Chain 1")
tf1_exit = input.timeframe("D", title='Chain 1 Exit Timeframe', group="Chain 1")
Chain 2:
Entry Timeframe: 12 Hours
Exit Timeframe: 9 Hours
tf2_entry = input.timeframe("720", title='Chain 2 Entry Timeframe (12H)', group="Chain 2")
tf2_exit = input.timeframe("540", title='Chain 2 Exit Timeframe (9H)', group="Chain 2")
Set the Backtesting Period:
Define the period over which you want to backtest the strategy. This allows you to see how the strategy would have performed historically.
startDate = input.time(timestamp('2015-07-27'), title="StartDate")
finishDate = input.time(timestamp('2026-01-01'), title="FinishDate")
Step 3: Analyze the Signals
Understand the Entry and Exit Signals:
Buy Signals: When the price crosses above the entry EMA, the strategy generates a buy signal.
bullishChain1 = enableChain1 and ta.crossover(src1, entryEMA1)
Sell Signals: When the price crosses below the exit EMA, the strategy generates a sell signal.
bearishChain2 = enableChain2 and ta.crossunder(src2, entryEMA2)
Review the Visual Indicators:
The strategy plots buy and sell signals on the chart with labels for easy identification:
BUY C1/C2 for buy signals from Chain 1 and Chain 2.
SELL C1/C2 for sell signals from Chain 1 and Chain 2.
This visual aid helps you quickly understand when and why trades are being executed.
Step 4: Optimize the Strategy
Backtest Results:
Review the strategy’s performance over the backtesting period. Look at key metrics like net profit, drawdown, and trade statistics to evaluate its effectiveness.
Adjust the EMA lengths, timeframes, and other settings to see how changes affect the strategy’s performance.
Customize for Live Trading:
Once satisfied with the backtest results, you can apply the strategy settings to live trading. Remember to continuously monitor and adjust as needed based on market conditions.
Step 5: Implement Risk Management
Use Realistic Position Sizing:
Keep your risk exposure per trade within a comfortable range, typically between 1-2% of your trading capital.
Set Alerts:
Set up alerts for buy and sell signals, so you don’t miss trading opportunities.
Paper Trade First:
Consider running the strategy in a paper trading account to understand its behavior in real market conditions before committing real capital.
This dual-layered approach offers a distinct advantage: it enables the strategy to adapt to varying market conditions by capturing both broad trends and immediate price action without one chain's activity impacting the other's decision-making process. The independence of these chains in executing transactions adds a level of sophistication and flexibility that is rarely seen in more conventional trading systems, making the Dual Chain Strategy not just unique, but a powerful tool for traders seeking to navigate complex market environments.

Support and resistance levels (Day, Week, Month) + EMAs + SMAs(ENG): This Pine 5 script provides various tools for configuring and displaying different support and resistance levels, as well as moving averages (EMA and SMA) on charts. Using these tools is an essential strategy for determining entry and exit points in trades.
Support and Resistance Levels
Daily, weekly, and monthly support and resistance levels play a key role in analyzing price movements:
Daily levels: Represent prices where a cryptocurrency has tended to bounce within the current trading day.
Weekly levels: Reflect strong prices that hold throughout the week.
Monthly levels: Indicate the most significant levels that can influence price movement over the month.
When trading cryptocurrencies, traders use these levels to make decisions about entering or exiting positions. For example, if a cryptocurrency approaches a weekly resistance level and fails to break through it, this may signal a sell opportunity. If the price reaches a daily support level and starts to bounce up, it may indicate a potential long position.
Market context and trading volumes are also important when analyzing support and resistance levels. High volume near a level can confirm its significance and the likelihood of subsequent price movement. Traders often combine analysis across different time frames to get a more complete picture and improve the accuracy of their trading decisions.
Moving Averages
Moving averages (EMA and SMA) are another important tool in the technical analysis of cryptocurrencies:
EMA (Exponential Moving Average): Gives more weight to recent prices, allowing it to respond more quickly to price changes.
SMA (Simple Moving Average): Equally considers all prices over a given period.
Key types of moving averages used by traders:
EMA 50 and 200: Often used to identify trends. The crossing of the 50-day EMA with the 200-day EMA is called a "golden cross" (buy signal) or a "death cross" (sell signal).
SMA 50, 100, 150, and 200: These periods are often used to determine long-term trends and support/resistance levels. Similar to the EMA, the crossings of these averages can signal potential trend changes.
Settings Groups:
EMA Golden Cross & Death Cross: A setting to display the "golden cross" and "death cross" for the EMA.
EMA 50 & 200: A setting to display the 50-day and 200-day EMA.
Support and Resistance Levels: Includes settings for daily, weekly, and monthly levels.
SMA 50, 100, 150, 200: A setting to display the 50, 100, 150, and 200-day SMA.
SMA Golden Cross & Death Cross: A setting to display the "golden cross" and "death cross" for the SMA.
Components:
Enable/disable the display of support and resistance levels.
Show level labels.
Parameters for adjusting offset, display of EMA and SMA, and their time intervals.
Parameters for configuring EMA and SMA Golden Cross & Death Cross.
EMA Parameters:
Enable/disable the display of 50 and 200-day EMA.
Color and style settings for EMA.
Options to use bar gaps and the "LookAhead" function.
SMA Parameters:
Enable/disable the display of 50, 100, 150, and 200-day SMA.
Color and style settings for SMA.
Options to use bar gaps and the "LookAhead" function.
Effective use of support and resistance levels, as well as moving averages, requires an understanding of technical analysis, discipline, and the ability to adapt the strategy according to changing market conditions.
(RUS) Данный Pine 5 скрипт предоставляет разнообразные инструменты для настройки и отображения различных уровней поддержки и сопротивления, а также скользящих средних (EMA и SMA) на графиках. Использование этих инструментов является важной стратегией для определения точек входа и выхода из сделок.
Уровни поддержки и сопротивления
Дневные, недельные и месячные уровни поддержки и сопротивления играют ключевую роль в анализе движения цен:
Дневные уровни: Представляют собой цены, на которых криптовалюта имела тенденцию отскакивать в течение текущего торгового дня.
Недельные уровни: Отражают сильные цены, которые сохраняются в течение недели.
Месячные уровни: Указывают на наиболее значимые уровни, которые могут влиять на движение цены в течение месяца.
При торговле криптовалютами трейдеры используют эти уровни для принятия решений о входе в позицию или закрытии сделки. Например, если криптовалюта приближается к недельному уровню сопротивления и не удается его преодолеть, это может стать сигналом для продажи. Если цена достигает дневного уровня поддержки и начинает отскакивать вверх, это может указывать на возможность открытия длинной позиции.
Контекст рынка и объемы торговли также важны при анализе уровней поддержки и сопротивления. Высокий объем при приближении к уровню может подтвердить его значимость и вероятность последующего движения цены. Трейдеры часто комбинируют анализ различных временных рамок для получения более полной картины и улучшения точности своих торговых решений.
Скользящие средние
Скользящие средние (EMA и SMA) являются еще одним важным инструментом в техническом анализе криптовалют:
EMA (Exponential Moving Average): Экспоненциальная скользящая средняя, которая придает большее значение последним ценам. Это позволяет более быстро реагировать на изменения в ценах.
SMA (Simple Moving Average): Простая скользящая средняя, которая равномерно учитывает все цены в заданном периоде.
Основные виды скользящих средних, которые используются трейдерами:
EMA 50 и 200: Часто используются для выявления трендов. Пересечение 50-дневной EMA с 200-дневной EMA называется "золотым крестом" (сигнал на покупку) или "крестом смерти" (сигнал на продажу).
SMA 50, 100, 150 и 200: Эти периоды часто используются для определения долгосрочных трендов и уровней поддержки/сопротивления. Аналогично EMA, пересечения этих средних могут сигнализировать о возможных изменениях тренда.
Группы настроек:
EMA Golden Cross & Death Cross: Настройка для отображения "золотого креста" и "креста смерти" для EMA.
EMA 50 & 200: Настройка для отображения 50-дневной и 200-дневной EMA.
Уровни поддержки и сопротивления: Включает настройки для дневных, недельных и месячных уровней.
SMA 50, 100, 150, 200: Настройка для отображения 50, 100, 150 и 200-дневных SMA.
SMA Golden Cross & Death Cross: Настройка для отображения "золотого креста" и "креста смерти" для SMA.
Компоненты:
Включение/отключение отображения уровней поддержки и сопротивления.
Показ ярлыков уровней.
Параметры для настройки смещения, отображения EMA и SMA, а также их временных интервалов.
Параметры для настройки EMA и SMA Golden Cross & Death Cross.
Параметры EMA:
Включение/отключение отображения 50 и 200-дневных EMA.
Настройки цвета и стиля для EMA.
Опции для использования разрыва баров и функции "LookAhead".
Параметры SMA:
Включение/отключение отображения 50, 100, 150 и 200-дневных SMA.
Настройки цвета и стиля для SMA.
Опции для использования разрыва баров и функции "LookAhead".
Эффективное использование уровней поддержки и сопротивления, а также скользящих средних, требует понимания технического анализа, дисциплины и умения адаптировать стратегию в зависимости от изменяющихся условий рынка.

COT IndexReference:
Trade Stocks and Commodities with the Insiders
Secrets of the COT Report by Larry Williams pg34
The equation is as below:
Current week's value- Lowest value of last three years
---------------------------------------------------------------------------- X 100%
Highest high of last three years-Lowest low of last three years
According to Larry Williams, traders should follow commercials direction. When the commercial index line (yellow line) is above 80, this indicates commercials are bullish. Hence, traders can look for potential buy setup. Conversely, when commercials index line (yellow line) is below 20, this indicates commercials are bearish, we can look for sell setup.
Do note that this is only applicable on Weekly chart as COT reports come out on weekly basis.
Modification from the original COT index from Larry Williams:
1) I've added 1year and 6months period, so traders maybe can look for pullback using shorter period. By default, Larry Williams uses 3 years Commercial index.
2) I've added non-commercials and retail traders index, they basically trade opposite way of commercials.
This indicator should not be used as a timing tool or entry tool, you can use it as your weekly or monthly bias tool. For more information, please read the books. Feel free to modify the code, if u have a better version of this, you may share to me if you want, I will be very grateful!

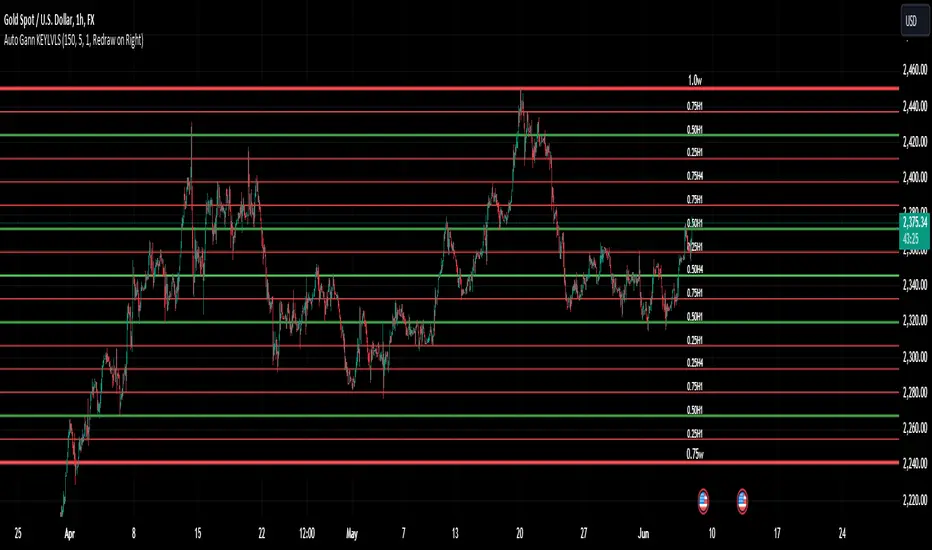
Auto Gann KEYLVLS "Auto Gann KEYLVLS" indicator can be a valuable tool for traders, especially those who employ Gann theory in their analysis. Here are some ways to effectively use this indicator:
Identifying Key Price Levels: Gann lines are known for their ability to identify key support and resistance levels. Use the plotted Gann lines to identify significant price levels where the market may react.
Confirmation of Trend Reversals: When price approaches a Gann line, observe how the price reacts. A bounce off a Gann line can confirm the continuation of the trend, while a break of a Gann line may indicate a potential trend reversal.
Entry and Exit Points: Gann lines can serve as entry and exit points for trades. Look for confluence between Gann lines and other technical indicators or patterns to identify high-probability trade setups.
Trading with the Trend: In an uptrend, consider buying opportunities near Gann support levels, while in a downtrend, look for selling opportunities near Gann resistance levels.
Risk Management: Use Gann lines to set stop-loss and take-profit levels. Place stop-loss orders below Gann support levels for long trades and above Gann resistance levels for short trades to manage risk effectively.
Timeframe Analysis: Utilize the flexibility of this indicator to plot Gann lines on different timeframes. Compare Gann lines across multiple timeframes to identify alignment or divergence, which can provide additional confirmation for trading decisions.
Combination with Other Indicators: Combine the information provided by Gann lines with other technical indicators, such as moving averages, RSI, or MACD, to strengthen your trading decisions.
Input Parameters:
The script defines several input parameters that control the behavior of the Gann lines, such as the number of weeks to look back for highs and lows, the number of Gann lines to plot, line extension settings, and options to show or hide specific Gann lines like .25, .37, .50, .63, and .75.
Auto Gann Functionality:
The script calculates the highest high and lowest low for the specified number of weeks, hours, and minutes.
It then calculates quartile levels (0.25, 0.50, 0.75) based on the weekly high and low.
Gann lines are drawn based on these levels, with options to extend them left and/or right.
Labels are added to the Gann lines indicating their values.
Weekly Gann Lines:
The script plots Gann lines and labels based on the weekly high and low levels.
Labels are added to these lines indicating their values.
Sub Gann Lines:
Additional Gann lines are plotted based on the weekly high and low levels, with subdivisions for lower timeframes like H4, H1, M15, and M1.
Label Management:
Labels are managed based on user preferences, including options to show labels once on the left side, redraw labels on the right side, or not show labels at all.
B A N K $ - Opening Lines / Daily Separators This is a simple indicator that aids the trader in being able to visualise each trading day of the week;
Key Features
Weekly Open Line
Daily Open Line
Option for Background Lines
Weekly & Daily Open Lines
Information ℹ️
These are vertical lines that are anchored to the hour of the Weekly Open and the hour of each Daily Candle Open. The settings are customisable, allowing to you edit the Width, Style & Colour. You can also select Monday as the Weekly Open if Monday is a no-trade day for you.
Settings ⚙️
1h Toggle - by default Daily Open Lines are only visible under the 1h, you can select to also make them visible on the 1h.
Background Lines - you can replace the chart lines with background lines, this can improve performance and allow you to load more lines on the chart when going back in price.
Show Days of Week - this prints the current day on the chart.

Auto Price LevelsMain Function:
This script creates horizontal lines on the chart at the market open price levels for different timeframes (4H, Daily, Weekly, Monthly). It helps traders track the open price levels and analyze their impact on the current price movements.
Unique Features:
Multi-Timeframe Support: The script allows users to display horizontal lines for 4-hour, daily, weekly, and monthly timeframes, providing a comprehensive view of market open prices across different periods.
Customization Options: Users can customize the line color, width, and style (solid, dotted, or dashed) for each timeframe separately, offering flexibility to match their charting preferences.
Sensitivity Setting: The script includes a sensitivity setting to filter lines based on the price movement percentage, allowing traders to focus on significant price levels.
Day Filter: Users can enable a day filter to limit the display of lines to a specific number of days, which helps in reducing chart clutter and focusing on recent price levels.
Automatic Updates: The script automatically updates the lines based on the latest market data, ensuring that traders always have the most relevant information.
Alerts: Integrated alert conditions notify traders when the price crosses above or below the open price on any of the specified timeframes, enabling timely decision-making.
How It Works:
Line Creation: For each selected timeframe, the script calculates the open price and compares it to the close price to determine the level at which the horizontal line should be drawn.
Line Management: The script manages the creation and deletion of lines to ensure only relevant lines are displayed, based on the user-defined sensitivity and day filter settings.
Customization: Through the input settings, traders can personalize the appearance and behavior of the lines to suit their specific trading strategies and preferences.
Alerts: The script sets up alert conditions that trigger notifications when the price crosses the open price levels, helping traders stay informed of critical market movements.
How to Use:
Select Timeframes: Enable or disable the display of lines for 4-hour, daily, weekly, and monthly timeframes as needed.
Customize Lines: Adjust the line color, width, and style for each timeframe using the input settings.
Set Sensitivity: Define the sensitivity percentage to filter lines based on significant price movements.
Enable Day Filter: If desired, enable the day filter and set the number of days to display lines.
Monitor Alerts: Set up alerts to receive notifications when the price crosses the open price levels on any of the chosen timeframes.
This script is designed to enhance traders' ability to monitor key price levels and make informed trading decisions. Its unique features and customization options provide a valuable tool for analyzing market open prices across multiple timeframes.

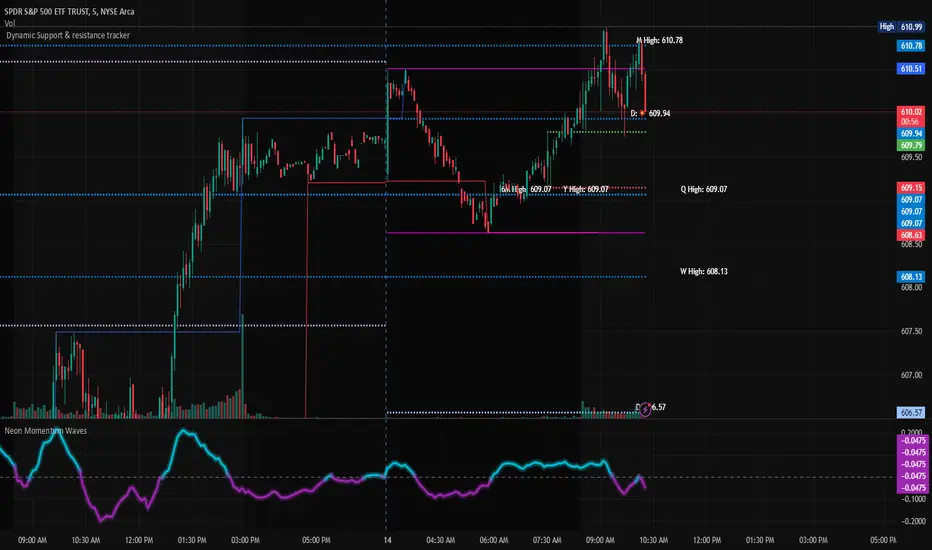
Dynamic Support & Resistance TrackerThe "Dynamic Support & Resistance Tracker" is a powerful Pine Script study designed to identify and visualize key support and resistance levels on a trading chart. This study dynamically adjusts to market conditions, providing traders with valuable insights for making informed trading decisions.
Key Features:
Dynamic Support & Resistance Lines:
The script identifies and plots support and resistance levels using pivot points based on a user-defined number of left and right bars.
Resistance lines are plotted in red, while support lines are plotted in blue, making it easy to distinguish between the two.
Toggle Breaks:
Users can choose to display or hide break signals for support and resistance levels using a simple toggle input.
Volume Threshold:
The study includes daily and weekly high and low calculations to provide a comprehensive view of market ranges.
Previous high and low lines are plotted for both daily and weekly timeframes, aiding in identifying potential breakout or breakdown levels.
Regular Market Hours:
The script defines regular market hours and tracks sessions, ensuring that support and resistance levels are relevant to active trading periods.
Midline and Extension Lines:
The study calculates and plots a midline between the previous high and low, along with extension lines above and below the range. These lines help identify potential target levels and extensions beyond the current range.
Real-time Updates:
The script ensures that all lines are updated in real-time, adjusting to new bars as they form. This dynamic feature keeps the levels relevant and accurate throughout the trading session.
Usage Instructions:
Adjust the number of left and right bars to define the sensitivity of the support and resistance levels.
Toggle the display of break signals to highlight significant breaks in support or resistance.
Monitor the daily and weekly high and low lines to understand the broader market context.
Utilize the midline and extension lines to set potential price targets and manage risk effectively.
This study provides traders with a robust tool for identifying and reacting to key market levels, enhancing their trading strategies with dynamic and real-time insights.
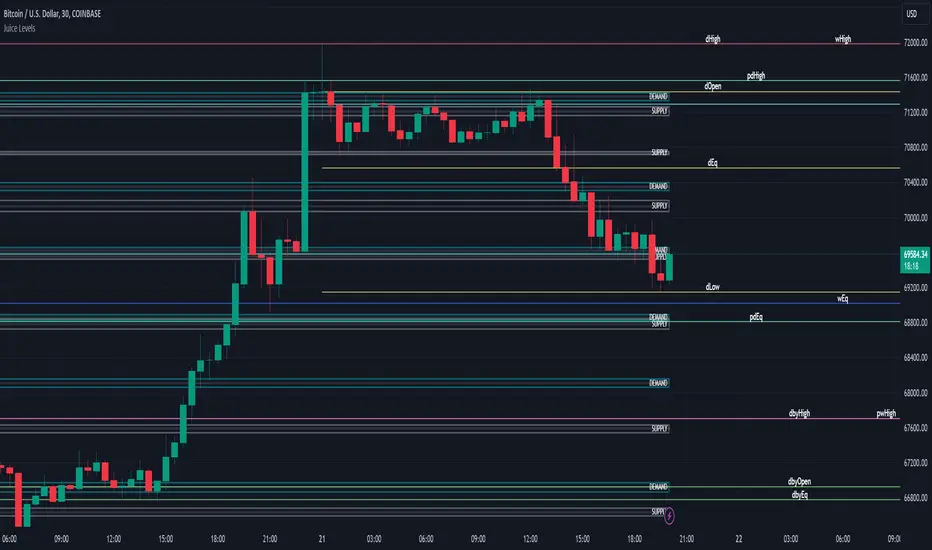
Juice LevelsSupply and Demand Key Levels
These levels encompass key price points derived from various timeframes, providing crucial insights into market dynamics and potential trading opportunities. These levels include daily, prior day, day before yesterday, weekly, prior weekly, monthly, and prior monthly levels.
Daily, Prior Day, Day Before Yesterday Levels
Offer intraday reference points and historical context for analyzing short-term price movements.
Weekly, Prior Weekly Levels
Provide insights into longer-term trends and potential areas of price consolidation or breakout over a one-week timeframe.
Monthly, Prior Monthly Levels
Offer significant insights into macroeconomic trends and investor sentiment over longer timeframes, spanning one month.
Equilibrium Levels
Indicate points where supply and demand are relatively balanced, often serving as pivot points for price movements.
Supply and Demand Zones
Highlight areas on a price chart where significant buying or selling pressure is expected, aiding traders in identifying potential reversal or breakout zones.
These levels and zones are essential tools for traders to analyze market sentiment, identify support and resistance levels, and make informed trading decisions across various timeframes.
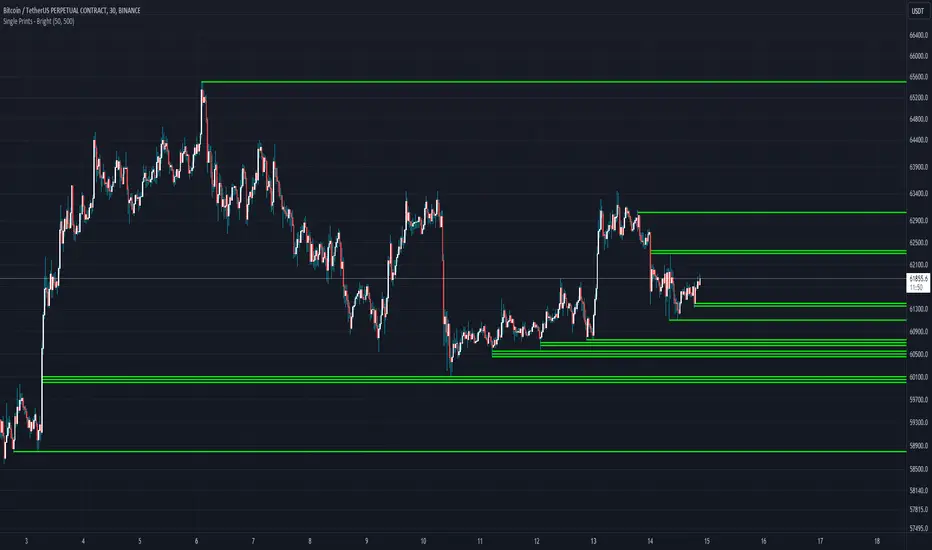
Single Prints - BrightSingle Prints - Bright is a Pine Script indicator designed to identify and visualize significant price levels based on the concept of "single prints." Single prints are price levels where trading activity occurred but with little or no follow-up trading. This indicator plots these levels as lines on the chart, allowing traders to easily identify areas of potential support and resistance.
Features:
Customizable Line Distance: Adjust the distance between single print lines to suit your trading style and time frame.
Maximum Array Size: Set the maximum number of single print lines to be displayed on the chart.
Remove Gaps: Option to remove lines if the price gaps over them.
Multiple Time Frames: Choose to display single prints for daily, weekly, monthly, or yearly sessions.
Color Gradient: Lines are color-coded from red (oldest) to green (newest), providing a visual indication of their relative age.
Thicker, Lime-Colored Lines: Improved visibility with thicker lines and a more lime-like color scheme for easier identification on the chart.
How to Use:
Adding the Indicator:
Open TradingView and navigate to the chart where you want to apply the indicator.
Click on "Indicators" in the top menu.
Select "Pine Editor" and paste the provided Pine Script code into the editor.
Click "Add to Chart" to apply the indicator to your chart.
Configuring the Indicator:
Distance Between Lines (i_line_distance): Set the distance between single print lines. Adjust this value based on the volatility and time frame of the asset you are trading.
Maximum Array Size (i_max_array): Define the maximum number of single print lines to be displayed on the chart. This helps in managing the clutter on the chart.
Remove Gaps (i_remove_gaps): Enable or disable the option to remove lines if the price gaps over them.
Show Daily Single Prints (ShowDailySP): Enable or disable the display of daily single print lines.
Show Daily Extended Single Prints (ShowDailyExtendSP): Enable or disable the display of extended daily single print lines.
Show Weekly Single Prints (ShowWeeklySP): Enable or disable the display of weekly single print lines.
Show Monthly Single Prints (ShowMonthlySP): Enable or disable the display of monthly single print lines.
Show Yearly Single Prints (ShowYearlySP): Enable or disable the display of yearly single print lines.
Interpreting the Lines:
Color Gradient: The lines are color-coded to indicate their relative age. Red lines are the oldest, transitioning through orange and yellow to green, which are the newest. This color gradient helps in identifying how long a particular level has been significant.
Support and Resistance: Use the lines as potential support and resistance levels. Multiple lines close together indicate stronger levels of support or resistance.
Volatility Analysis: The number of lines within a gap can provide insights into market volatility. More lines indicate higher volatility and multiple potential reversal points within that range.
Trading Strategies:
Entry Points: Consider using the single print lines as entry points. For example, if the price approaches a support level with multiple lines, it may be a good buying opportunity.
Stop Loss and Take Profit: Use the single print lines to set stop-loss and take-profit levels. Placing stop-loss orders below multiple support lines can provide additional protection.
Trend Analysis: Analyze the overall trend and momentum in conjunction with the single print lines to make informed trading decisions. If the price is in an uptrend and approaching resistance lines, watch for potential breakouts or reversals.
TASC 2024.06 REIT ETF Trading System█ OVERVIEW
This strategy script demonstrates the application of the Real Estate Investment Trust (REIT) ETF trading system presented in the article by Markos Katsanos titled "Is The Price REIT?" from TASC's June 2024 edition of Traders' Tips .
█ CONCEPTS
REIT stocks and ETFs offer a simplified, diversified approach to real estate investment. They exhibit sensitivity to interest rates, often moving inversely to interest rate and treasury yield changes. Markos Katsanos explores this relationship and the correlation of prices with the broader market to develop a trading strategy for REIT ETFs.
The script employs Bollinger Bands and Donchian channel indicators to identify oversold conditions and trends in REIT ETFs. It incorporates the 10-year treasury yield index (TNX) as a proxy for interest rates and the S&P 500 ETF (SPY) as a benchmark for the overall market. The system filters trade entries based on their behavior and correlation with the REIT ETF price.
█ CALCULATIONS
The strategy initiates long entries (buy signals) under two conditions:
1. Oversold condition
The weekly ETF low price dips below the 15-week Bollinger Band bottom, the closing price is above the value by at least 0.2 * ATR ( Average True Range ), and the price exceeds the week's median.
Either of the following:
– The TNX index is down over 15% from its 25-week high, and its correlation with the ETF price is less than 0.3.
– The yield is below 2%.
2. Uptrend
The weekly ETF price crosses above the previous week's 30-week Donchian channel high.
The SPY ETF is above its 20-week moving average.
Either of the following:
– Over ten weeks have passed since the TNX index was at its 30-week high.
– The correlation between the TNX value and the ETF price exceeds 0.3.
– The yield is below 2%.
The strategy also includes three exit (sell) rules:
1. Trailing (Chandelier) stop
The weekly close drops below the highest close over the last five weeks by over 1.5 * ATR.
The TNX value rises over the latest 25 weeks, with a yield exceeding 4%, or its value surges over 15% above the 25-week low.
2. Stop-loss
The ETF's price declines by at least 8% of the previous week's close and falls below the 30-week moving average.
The SPY price is down by at least 8%, or its correlation with the ETF's price is negative.
3. Overbought condition
The ETF's value rises above the 100-week low by over 50%.
The ETF's price falls over 1.5 * ATR below the 3-week high.
The ETF's 10-week Stochastic indicator exceeds 90 within the last three weeks.
█ DISCLAIMER
This strategy script educates users on the system outlined by the TASC article. However, note that its default properties might not fully represent real-world trading conditions for an individual. By default, it uses 10% of equity as the order size and a slippage amount of 5 ticks. Traders should adjust these settings and the commission amount when using this script. Additionally, since this strategy utilizes compound conditions on weekly data to trigger orders, it will generate significantly fewer trades than other, higher-frequency strategies.

Danger Signals from The Trading MindwheelThe " Danger Signals " indicator, a collaborative creation from the minds at Amphibian Trading and MARA Wealth, serves as your vigilant lookout in the volatile world of stock trading. Drawing from the wisdom encapsulated in "The Trading Mindwheel" and the successful methodologies of legends like William O'Neil and Mark Minervini, this tool is engineered to safeguard your trading journey.
Core Features:
Real-Time Alerts: Identify critical danger signals as they emerge in the market. Whether it's a single day of heightened risk or a pattern forming, stay informed with specific danger signals and a tally of signals for comprehensive decision-making support. The indicator looks for over 30 different signals ranging from simple closing ranges to more complex signals like blow off action.
Tailored Insights with Portfolio Heat Integration: Pair with the "Portfolio Heat" indicator to customize danger signals based on your current positions, entry points, and stops. This personalized approach ensures that the insights are directly relevant to your trading strategy. Certain signals can have different meanings based on where your trade is at in its lifecycle. Blow off action at the beginning of a trend can be viewed as strength, while after an extended run could signal an opportunity to lock in profits.
Forward-Looking Analysis: Leverage the 'Potential Danger Signals' feature to assess future risks. Enter hypothetical price levels to understand potential market reactions before they unfold, enabling proactive trade management.
The indicator offers two different modes of 'Potential Danger Signals', Worst Case or Immediate. Worst Case allows the user to input any price and see what signals would fire based on price reaching that level, while the Immediate mode looks for potential Danger Signals that could happen on the next bar.
This is achieved by adding and subtracting the average daily range to the current bars close while also forecasting the next values of moving averages, vwaps, risk multiples and the relative strength line to see if a Danger Signal would trigger.
User Customization: Flexibility is at your fingertips with toggle options for each danger signal. Tailor the indicator to match your unique trading style and risk tolerance. No two traders are the same, that is why each signal is able to be turned on or off to match your trading personality.
Versatile Application: Ideal for growth stock traders, momentum swing traders, and adherents of the CANSLIM methodology. Whether you're a novice or a seasoned investor, this tool aligns with strategies influenced by trading giants.
Validation and Utility:
Inspired by the trade management principles of Michael Lamothe, the " Danger Signals " indicator is more than just a tool; it's a reflection of tested strategies that highlight the importance of risk management. Through rigorous validation, including the insights from "The Trading Mindwheel," this indicator helps traders navigate the complexities of the market with an informed, strategic approach.
Whether you're contemplating a new position or evaluating an existing one, the " Danger Signals " indicator is designed to provide the clarity needed to avoid potential pitfalls and capitalize on opportunities with confidence. Embrace a smarter way to trade, where awareness and preparation open the door to success.
Let's dive into each of the components of this indicator.
Volume: Volume refers to the number of shares or contracts traded in a security or an entire market during a given period. It is a measure of the total trading activity and liquidity, indicating the overall interest in a stock or market.
Price Action: the analysis of historical prices to inform trading decisions, without the use of technical indicators. It focuses on the movement of prices to identify patterns, trends, and potential reversal points in the market.
Relative Strength Line: The RS line is a popular tool used to compare the performance of a stock, typically calculated as the ratio of the stock's price to a benchmark index's price. It helps identify outperformers and underperformers relative to the market or a specific sector. The RS value is calculated by dividing the close price of the chosen stock by the close price of the comparative symbol (SPX by default).
Average True Range (ATR): ATR is a market volatility indicator used to show the average range prices swing over a specified period. It is calculated by taking the moving average of the true ranges of a stock for a specific period. The true range for a period is the greatest of the following three values:
The difference between the current high and the current low.
The absolute value of the current high minus the previous close.
The absolute value of the current low minus the previous close.
Average Daily Range (ADR): ADR is a measure used in trading to capture the average range between the high and low prices of an asset over a specified number of past trading days. Unlike the Average True Range (ATR), which accounts for gaps in the price from one day to the next, the Average Daily Range focuses solely on the trading range within each day and averages it out.
Anchored VWAP: AVWAP gives the average price of an asset, weighted by volume, starting from a specific anchor point. This provides traders with a dynamic average price considering both price and volume from a specific start point, offering insights into the market's direction and potential support or resistance levels.
Moving Averages: Moving Averages smooth out price data by creating a constantly updated average price over a specific period of time. It helps traders identify trends by flattening out the fluctuations in price data.
Stochastic: A stochastic oscillator is a momentum indicator used in technical analysis that compares a particular closing price of an asset to a range of its prices over a certain period of time. The theory behind the stochastic oscillator is that in a market trending upwards, prices will tend to close near their high, and in a market trending downwards, prices close near their low.
While each of these components offer unique insights into market behavior, providing sell signals under specific conditions, the power of combining these different signals lies in their ability to confirm each other's signals. This in turn reduces false positives and provides a more reliable basis for trading decisions
These signals can be recognized at any time, however the indicators power is in it's ability to take into account where a trade is in terms of your entry price and stop.
If a trade just started, it hasn’t earned much leeway. Kind of like a new employee that shows up late on the first day of work. It’s less forgivable than say the person who has been there for a while, has done well, is on time, and then one day comes in late.
Contextual Sensitivity:
For instance, a high volume sell-off coupled with a bearish price action pattern significantly strengthens the sell signal. When the price closes below an Anchored VWAP or a critical moving average in this context, it reaffirms the bearish sentiment, suggesting that the momentum is likely to continue downwards.
By considering the relative strength line (RS) alongside volume and price action, the indicator can differentiate between a normal retracement in a strong uptrend and a when a stock starts to become a laggard.
The integration of ATR and ADR provides a dynamic framework that adjusts to the market's volatility. A sudden increase in ATR or a character change detected through comparing short-term and long-term ADR can alert traders to emerging trends or reversals.
The "Danger Signals" indicator exemplifies the power of integrating diverse technical indicators to create a more sophisticated, responsive, and adaptable trading tool. This approach not only amplifies the individual strengths of each indicator but also mitigates their weaknesses.
Portfolio Heat Indicator can be found by clicking on the image below
Danger Signals Included
Price Closes Near Low - Daily Closing Range of 30% or Less
Price Closes Near Weekly Low - Weekly Closing Range of 30% or Less
Price Closes Near Daily Low on Heavy Volume - Daily Closing Range of 30% or Less on Heaviest Volume of the Last 5 Days
Price Closes Near Weekly Low on Heavy Volume - Weekly Closing Range of 30% or Less on Heaviest Volume of the Last 5 Weeks
Price Closes Below Moving Average - Price Closes Below One of 5 Selected Moving Averages
Price Closes Below Swing Low - Price Closes Below Most Recent Swing Low
Price Closes Below 1.5 ATR - Price Closes Below Trailing ATR Stop Based on Highest High of Last 10 Days
Price Closes Below AVWAP - Price Closes Below Selected Anchored VWAP (Anchors include: High of base, Low of base, Highest volume of base, Custom date)
Price Shows Aggressive Selling - Current Bars High is Greater Than Previous Day's High and Closes Near the Lows on Heaviest Volume of the Last 5 Days
Outside Reversal Bar - Price Makes a New High and Closes Near the Lows, Lower Than the Previous Bar's Low
Price Shows Signs of Stalling - Heavy Volume with a Close of Less than 1%
3 Consecutive Days of Lower Lows - 3 Days of Lower Lows
Close Lower than 3 Previous Lows - Close is Less than 3 Previous Lows
Character Change - ADR of Last Shorter Length is Larger than ADR of Longer Length
Fast Stochastic Crosses Below Slow Stochastic - Fast Stochastic Crosses Below Slow Stochastic
Fast & Slow Stochastic Curved Down - Both Stochastic Lines Close Lower than Previous Day for 2 Consecutive Days
Lower Lows & Lower Highs Intraday - Lower High and Lower Low on 30 Minute Timeframe
Moving Average Crossunder - Selected MA Crosses Below Other Selected MA
RS Starts Curving Down - Relative Strength Line Closes Lower than Previous Day for 2 Consecutive Days
RS Turns Negative Short Term - RS Closes Below RS of 7 Days Ago
RS Underperforms Price - Relative Strength Line Not at Highs, While Price Is
Moving Average Begins to Flatten Out - First Day MA Doesn't Close Higher
Price Moves Higher on Lighter Volume - Price Makes a New High on Light Volume and 15 Day Average Volume is Less than 50 Day Average
Price Hits % Target - Price Moves Set % Higher from Entry Price
Price Hits R Multiple - Price hits (Entry - Stop Multiplied by Setting) and Added to Entry
Price Hits Overhead Resistance - Price Crosses a Swing High from a Monthly Timeframe Chart from at Least 1 Year Ago
Price Hits Fib Level - Price Crosses a Fib Extension Drawn From Base High to Low
Price Hits a Psychological Level - Price Crosses a Multiple of 0 or 5
Heavy Volume After Significant Move - Above Average and Heaviest Volume of the Last 5 Days 35 Bars or More from Breakout
Moving Averages Begin to Slope Downward - Moving Averages Fall for 2 Consecutive Days
Blow Off Action - Highest Volume, Largest Spread, Multiple Gaps in a Row 35 Bars or More Post Breakout
Late Buying Frenzy - ANTS 35 Bars or More Post Breakout
Exhaustion Gap - Gap Up 5% or Higher with Price 125% or More Above 200sma

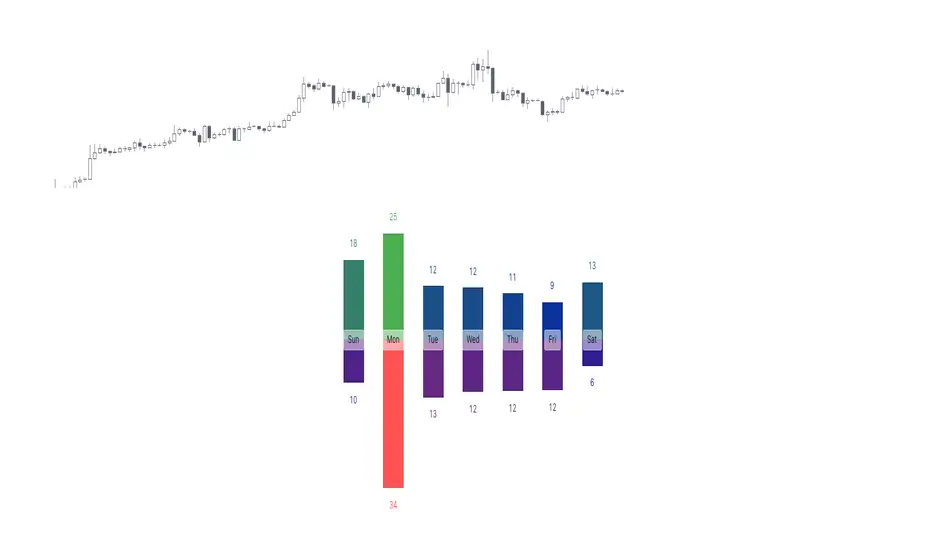
Periodic Activity Tracker [LuxAlgo]The Periodic Activity Tracker tool periodically tracks the cumulative buy and sell volume in a user-defined period and draws the corresponding matching bars and volume delta for each period.
Users can select a predefined aggregation period from the following options: Hourly, Daily, Weekly, and Monthly.
🔶 USAGE
This tool provides a simple and clear way of analyzing volumes for each aggregated period and is made up of the following elements:
Buy and sell volumes by period as red and green lines with color gradient area
Delta (difference) between buy & sell volume for each period
Buy & sell volume bars for each period
Separator between lines and bars, and period tags below each pair of bars for ease of reading
On the chart above we can see all the elements displayed, the volume level on the lines perfectly matches the volume level on the bars for each period.
In this case, the tool has the default settings so the anchor period is set to Daily and we can see how the period tag (each day of the week) is displayed below each pair of bars.
Users can disable the delta display and adjust the bar size.
🔹 Reading The Tool
In trading, assessing the strength of the bulls (buyers) and bears (sellers) is key to understanding the current trading environment. Which side, if any, has the upper hand? To answer this question, some traders look at volume in relation to price.
This tool provides you with a view of buy volume versus sell volume, allowing you to compare both sides of the market.
As with any volume tool, the key is to understand when the forces of the two groups are balanced or unbalanced.
As we can observe on the chart:
NOV '23: Buy volume greater than sell volume, both moving up close together, flat delta. We can see that the price is in range.
DEC '23: Buy volume bigger than Sell volume, both moving up but with a bigger difference, bigger delta than last month but still flat. We can see the price in the range above last month's range.
JAN '24: Buy and sell volume tied together, no delta whatsoever. We can see the price in range but testing above and below last month's range.
FEB '24: Buy volume explodes higher and sell volume cannot keep up, big growing delta. Price explodes higher above last month's range.
Traders need to understand that there is always an equal number of buyers and sellers in a liquid market, the quality here is how aggressive or passive they are. Who is 'attacking' and who is 'defending', who is using market orders to move prices, and who is using limit orders waiting to be filled?
This tool gives you the following information:
Lines: if the top line is green, the buyers are attacking, if it is red, the sellers are attacking.
Delta: represents the difference in their strength, if it is above 0 the buyers are stronger, if it is below 0 the sellers are stronger.
Bars: help you to see the difference in strength between buyers and sellers for each period at a glance.
🔹 Anchor Period
By default, the tool is set to Hourly. However, users can select from a number of predefined time periods.
Depending on the user's selection, the bars are displayed as follows:
Hourly : hours of the current day
Daily : days of the current week
Weekly : weeks of the current month
Monthly : months of the current year
On the chart above we can see the four periods displayed, starting at the top left and moving clockwise we have hourly, daily, weekly, and monthly.
🔶 DETAILS
🔹 Chart TimeFrame
The chart timeframe has a direct impact on the visualization of the tool, and the user should select a chart timeframe that is compatible with the Anchor period in the tool's settings panel.
For the chart timeframe to be compatible it must be less than the Anchor period parameter. If the user selects an incompatible chart timeframe, a warning message will be displayed.
As a rule of thumb, the smaller the chart timeframe, the more data the tool will collect, returning indications for longer-term price variations.
These are the recommended chart timeframes for each period:
Hourly : 5m charts or lower
Daily : 1H charts or lower
Weekly : 4H charts or lower
Monthly : 1D charts or lower
🔹 Warnings
This chart shows both types of warnings the user may receive
At the top, we can see the warning that is given when the 'Bar Width' parameter exceeds the allowed value.
At the bottom is the incompatible chart timeframe warning, which prompts the user to select a smaller chart timeframe or a larger "Anchor Period" parameter.
🔶 SETTINGS
🔹 Data Gathering
Anchor period: Time period representing each bar: hours of the day, days of the week, weeks of the month, and months of the year. The timeframe of the chart must be less than this parameter, otherwise a warning will be displayed.
🔹 Style
Bars width: Size of each bar, there is a maximum limit so a warning will be displayed if it is reached.
Volume color
Delta: Enable/Disable Delta Area Display

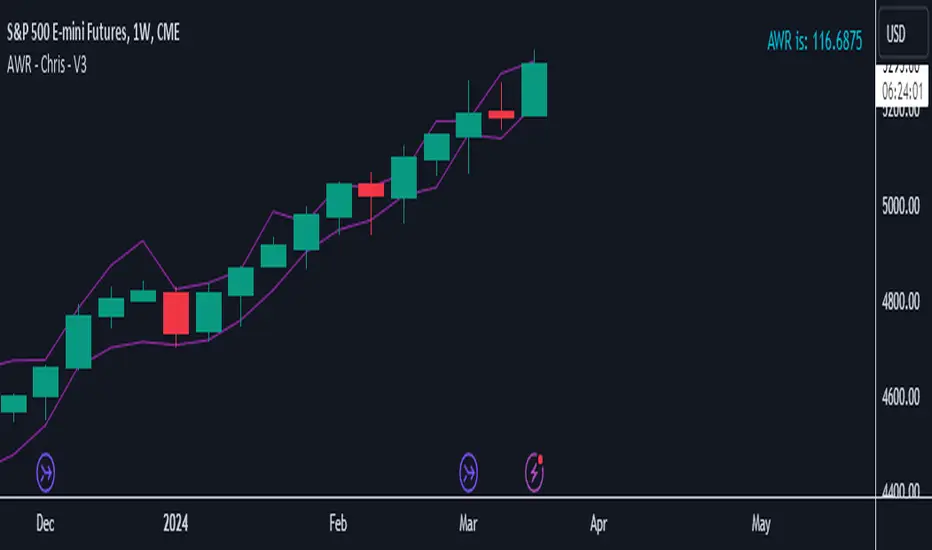
AWR - Chris - V3Calculates the AWR based on Dr. Coles formula. Takes the last 12 weeks (not including the current one) highs and lows, adds them and then divides by twelve, give the average weekly range. Then takes the AWR and show the playing field based on the high and low of the current weekly candle. Must be used on the weekly chart to get the data needed then manually plot your lines on the required charts.
TTrades Daily Bias [TFO]Inspired by @TTrades_edu video on daily bias, this indicator aims to develop a higher timeframe bias and collect data on its success rate. While a handful of concepts were introduced in said video, this indicator focuses on one specific method that utilizes previous highs and lows. The following description will outline how the indicator works using the daily timeframe as an example, but the weekly timeframe is also an included option that functions in the exact same manner.
On the daily timeframe, there are a handful of possible scenarios that we consider: if price closes above its previous day high (PDH), the following day's bias will target PDH; if price trades above its PDH but closes back below it, the following day's bias will target its previous day low (PDL).
Similarly, if price closes below its PDL, the following day's bias will target PDL. If price trades below its PDL but closes back above it, the following day's bias will target PDH.
If price trades as an inside bar that doesn't take either PDH or PDL, it will refer to the previous candle for bias. If the previous day closed above its open, it will target PDH and vice versa. If price trades as an outside bar that takes both PDH and PDL, but closes inside that range, no bias is assigned.
With a rigid framework in place, we can apply it to the charts and observe the results.
As shown above, each new day starts by drawing out the PDH and PDL levels. They start out as blue and turn red once traded through (these are the default colors which can be changed in the indicator's settings). The triangles you see are plotted to indicate the time at which PDH or PDL was traded through. This color scheme is also applied to the table in the top right; once a bias is determined, that cell's color starts out as blue and turns red once the level is traded through.
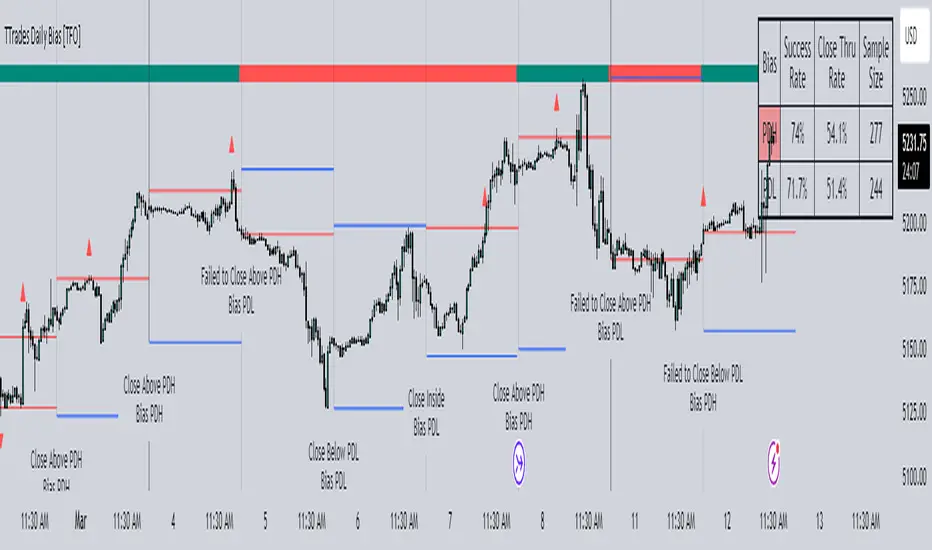
The table indicates the success rate of price hitting the levels provided by each period's bias, followed by the success rate of price closing through said levels after reaching them, as well as the sample size of data collected for each scenario.
In the above crude oil futures (CL1!) 30m chart, we can glean a lot of information from the table in the top right. First we may note that the "PDH" cell is red, which indicates that the current day's bias was targeting PDH and it has already traded through that level. We might also note that the "PWH" cell is blue, which indicates that the weekly bias is targeting the previous week high (PWH) but price has yet to reach that level.
As an example of how to read the table's data, we can look at the "PDH" row of the crude oil chart above. The sample size here indicates that there were 279 instances where the daily bias was assigned as PDH. From this sample size, 76.7% of instances did go on to trade through PDH, and only 53.7% of those instances actually went on to close through PDH after hitting that level.
Of course, greater sample sizes and therefore greater statistical significance may be derived from higher timeframe charts that may go further back in time. The amount of data you can observe may also depend on your TradingView plan.
If we don't want to see the labels describing why bias is assigned a certain way, we can simply turn off the "Show Bias Reasoning" option. Additionally, if we want to see a visual of what the daily and weekly bias currently is, we can plot that along the top and bottom of the chart, as shown above. Here I have daily bias plotted at the top and weekly bias at the bottom, where the default colors of green and red indicate that the bias logic is expecting price to draw towards the given timeframe's previous high or low, respectively.
For a compact table view that doesn't take up much chart space, simply deselect the "Show Statistics" option. This will only show the color-coded bias column for a quick view of what levels are being anticipated (more user-friendly for mobile and other smaller screens).
Alerts can be configured to indicate the bias for a new period, and/or when price hits its previous highs and lows. Simply enable the alerts you want from the indicator's settings and create a new alert with this indicator as the condition. There will be options to use "Any alert() function call" which will alert whatever is selected from the settings, or you can use more specific alerts for bullish/bearish bias, whether price hit PDH/PDL, etc.
Lastly, while the goal of this indicator was to evaluate the effectiveness of a very specific bias strategy, please understand that past performance does not guarantee future results.
Multi-Time AVWAP_BEARConcept
Collaboration Highlight:
This was a collaboration with @Chart_School and @KioseffTrading Thank you to both, along with Ricardo Santos for his awesome library we used.
Overview
See how you view different time frame charts with one indicator and little to no adjustment.
Innovation:
The concept of using Anchored VWAP (AVWAP) with time events is a powerful technique in trading and technical analysis. Anchored VWAP differs from the traditional Volume Weighted Average Price (VWAP) by allowing traders to select a specific starting point or "anchor," from which the VWAP calculation begins. This approach is particularly useful for assessing price movements in relation to significant market events or specific periods of interest.
Utility and Flexibility:
Explaining the flexibility in turning on and off different time slices without much adjustment showcases a user-friendly design.
Key Uses and Benefits
Comparative Performance:
Anchoring the VWAP at the start of different time frames (e.g., weekly, monthly, quarterly) enables traders to compare the current price performance against previous periods. This comparison can highlight trends or shifts in trading momentum relative to past activity.
Support and Resistance Levels:
AVWAP lines can act as dynamic support and resistance levels. When anchored to significant time events, these levels gain additional relevance as they reflect the market's valuation of an asset since a notable point in time. Traders often watch for price interactions with these levels to make informed trading decisions.
Risk Management:
Anchored VWAP can serve as a benchmark for setting stop-loss orders or profit targets. By considering the price's relation to the AVWAP of a specific period or after a key event, traders can define exit points that are aligned with market-generated information.
Trend Confirmation: The direction and stability of the price relative to an anchored VWAP can indicate the strength of a trend. If the price consistently remains above an AVWAP anchored at a bullish event (or below for a bearish event), it may confirm the trend's continuation.
Further Reading
Educational Resource:
Becuase we are using Volume with a relation to price AVWAP is very powerful to show data that cannot be eye balled on its own. Brian Shannon's book "Maximum Trading Gains With Anchored VWAP - The Perfect Combination of Price, Time & Volume", is an excellent guide to best practices on how to use AVWAP to your advatage while trading. His book goes into depth about the best way to use this indicator to its fullest potencial.
Tips for Using This Indicator
Weekly / Monthly / Quarterly Settings:
All the settings for the lower timeframe charts are similar. Here is an example of seeing a Weekly AVWAP for 6 weeks, showing:
1. The start of the 6-week AVWAP is using a High Low Close source for the first candle of the 6 weeks.
2. The lines are colored "Red" for the AVWAPs.
3. The line thickness is "1".
Yearly Settings
Simlair to the other settings with the Yearly we give you a couple more options along with 3 years to toggle on and off. The idea was to allow the user to see which AVWAP most effected by price and quickly toggle them on and off to unclutter their chart.
Watch for how and if the labels over lap and choose the one you feel is most in play. In Shannon's Book he talks about "Hand off's" and "Pinches". These concepts are easy to spot with being able to see all the Major Time Events, then simply toggle off the one you dont need.
A great benefit to how we coded this script you can buzz through a watch list without having to re-adjust the Anchor points. This will save you time if following a basket of symbols and show coorlations in the overall market.
Secret Feature
When looking at these becuase the user doesn't need to hand plot the anchor points and we are fouced on major time slices, I encourge you to use the Trading View "Bar Replay" Feature. You think that you are missing a high or low AVWAP but what is happening is the indicator is re-plotting a level that is super hard to see, then you will see the hand-offs like Shannon discusses in his book. This blew me away while we were discussing it post development.
Conclusion
There are so many uses of how to use VWAP and therories on its best practice. We are only using "TIME EVENTS". For more ways to use AVWAP, I would encourge you to also handplot them with Trading View's new "Anchored VWAP", as seen in the standard toolbar.
Using your ideas along with this indicator i think its a powerful combination.
Also Check Out: allanster's - Anchored VWAP Pinch & Handoff, Intervals, and Signals
He has a great AVWAP script that incorporates many AVWAP ideas.

Tops & Bottoms - Day of Week Report█ OVERVIEW
The indicator tracks when the weekly tops and bottoms occur and reports the statistics by the days of the week.
█ CONCEPTS
Not all the days of the week are equal, and the market dynamic can follow through or shift over the trading week. Tops and bottoms are vital when entering a trade, as they will decide if you are catching the train or being straight offside. They are equally crucial when exiting a position, as they will determine if you are closing at the optimal price or seeing your unrealized profits vanish.
This indicator is before all for educational purposes. It aims to make the knowledge available to all traders, facilitate understanding of the various markets, and ultimately get to know your trading pairs by heart (and saving a lot of your time backtesting!).
USDJPY tops and bottoms percentages on any given week.
USDJPY tops and bottoms percentages on up weeks versus down weeks.
█ FEATURES
Custom interval
By default, the indicator uses the weekly interval defined by the symbol (e.g., Monday to Sunday). This option allows you to specify your custom interval.
Weekly interval type filter
Analyze the weekly interval on any weeks, up weeks, or down weeks.
Configurable time range filter
Select the period to report from.
█ NOTES
Trading session
The indicator analyzes the days of the week from the daily chart. The daily trading sessions are defined by the symbol (e.g., 17:00 - 17:00 on EURUSD).
Extended/electronic trading session
The indicator can include the extended hours when activated on the chart, using the 24-hour or 1440-minute timeframe.
█ HOW TO USE
Plot the indicator and navigate on the 1-day or 24-hour timeframe.
Multi VWAP [MW]Introduction
The Multi VWAP tool extends the concept of using the Anchored Volume Weighted Average Price, popularized by its founder, Brian Shannon, founder of AlphaTrends, and creates automatic AVWAPS for multiple anchor points, such as for 2-day, 3-day, 4-day, 5-day, and custom date anchors as well as automagically creating month-to-date and year-to-date anchors. Currently, most standard VWAP tools allow users to place custom anchored VWAPs, but the routine of doing this for every equity being watched can become cumbersome. This tool makes that process multi-times easier. Brian Shannon is also the author of “Maximum Trading Gains With Anchored VWAP: The Perfect Combination of Price, Time, and Volume”. Available at Amazon.
Settings
Daily VWAP : A continuous line of the the daily Volume Weighted Average Price (VWAP)
Weekly VWAP : A continuous line of the weekly VWAP
2-Day AVWAP : The anchored VWAP from 2 trading days ago (holidays and weekends are excluded in this calculation)
3-Day AVWAP : The anchored VWAP from 3 trading days ago
4-Day AVWAP : The anchored VWAP from 4 trading days ago
5-Day AVWAP : The anchored VWAP from 5 trading days ago. The slope of this line and the position of the price relative to this line can be used to determine trend direction.
10-Day AVWAP : The anchored VWAP from 10 trading days ago
Month-to-Date AVWAP : The anchored VWAP from the beginning of the current month
Year-to-Date AVWAP : The anchored VWAP from the beginning of the current year
Custom Date AVWAP : Sets a date to begin an anchored VWAP starting from any time.
Use only the most recent VWAP for Week, Month, and Year: Toggles on and off the continuous weekly, monthly, and yearly VWAPs
Calculations
This indicator does not provide buy or sell signals. It is simply the VWAP calculated starting from an “anchor point”, or start time. It is the calculated by the summation of Price x Volume / Volume for the period starting at the anchor point.
How to Interpret
According to Brian Shannon, VWAP is an objective measure of what the average trader has paid for a particular equity over a given period, and is the value that large institutional investors frequently use as a trade signal. Therefore, by definition, when the price is above an AVWAP, buyers are in control for that period of time. Likewise, if the price is below the AVWAP, sellers are in control for that period of time.
Shannon also distinguishes the importance of an increasing or decreasing 5 day VWAP, which reflects the price sentiment, objectively, for roughly the last trading week, or 5 trading days. Pricing below a decreasing 5-day VWAP is considered very bearish, while pricing above an increasing 5-day VWAP is considered bullish and is recommended before considering long positions.
Additionally, a custom VWAP can be generated to coincide with important events, such as FOMC meetings, CPI reports, earnings reports, etc.
Practically speaking, price action can tend to change direction when a significant VWAP is hit, voiding buy and sell signals. Like moving averages, this indicator can show, in real-time, how a buy or sell signal should be interpreted. A significant AVWAP line is a point of interest, and can serve as strong support or resistance, because large institutions may be using those values for entries or exits. For a great analysis of how to use AVWAP, visit the AlphaTrends channel on Youtube here or you can buy Brian Shannon’s “Anchored VWAP” book on Amazon.
Other Usage Notes and Limitations
It's important for traders to be aware of the limitations of any indicator and to use them as part of a broader, well-rounded trading strategy that includes risk management, fundamental analysis, and other tools that can help with reducing false signals, determining trend direction, and providing additional confirmation for a trade decision. Diversifying strategies and not relying solely on one type of indicator or analysis can help mitigate some of these risks.
Additionally, the indicator may take a little longer to load than usual. On the rare occasion where it fails to load, you may need to remove the indicator and add it back to your chart. Also, if you do encounter this problem, avoid redrawing your chart while the indicator is being added to the screen.
Acknowledgements
This script uses the MarketHolidays library by @Protervus. Also, for debugging, the JavaScript-style Debug Console by @algotraderdev and the TimeFormattingLibrary by @twingall were invaluable. And, of course, without Brian Shannon's books, videos, and interviews, this indicator would would not be possible.

WRESBAL PlusWRESBAL Plus is an improved way of looking at the same data that drives WRESBAL, which is a commonly used series on FRED.
WRESBAL is a weekly average of combined balances on FRED using inputs that are weekly averages in some cases. For example the Treasury General Account has multiple FRED series including WDTGAL (wednesday level) and WTREGEN (wednesday weekly average) There are data sets that are tracking the same metrics which are updated daily such as RRPONTSYD as opposed to WLRRAL.
This situation leads to an opportunity to create a new and improved WRESBAL with the data that is updated more frequently. WRESBAL Plus solves the problem of waiting for weekly averages to update trends.
WRESBAL plus combines data sets from FRED that are updated more frequently and are the basis for the original WRESBAL equation. WRESBAL Plus offers a signal that predicts where WRESBAL will go, and this is important when determining the direction of asset prices as they relate to liquidity. One example of an asset that closely follows WRESBAL is Bitcoin.

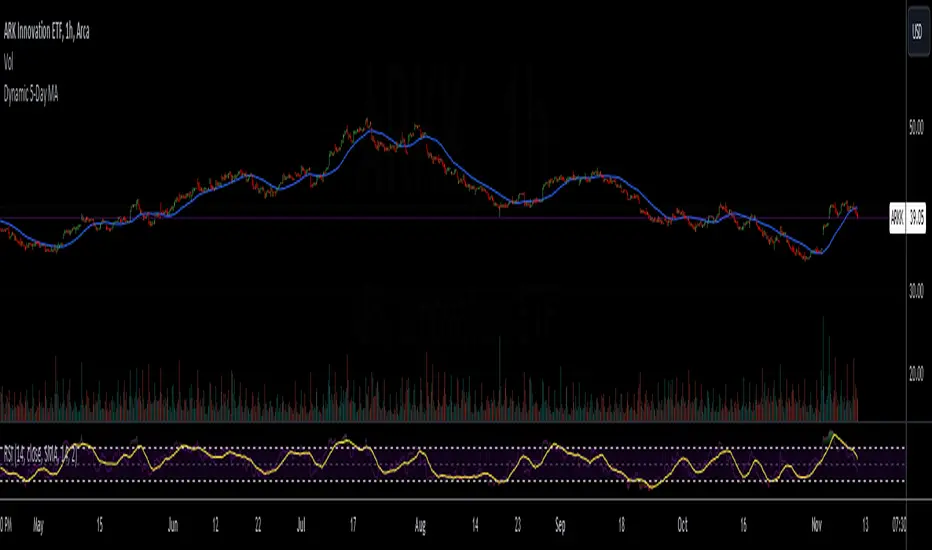
ayogetit Trades™ Dynamic 5DMAThe Dynamic 5-Day Moving Average (MA) indicator is designed to provide traders with a consistent, time-adjusted moving average line across various timeframes. This indicator is especially useful for traders who switch between multiple timeframes and want a moving average that represents a fixed 5-day period, ensuring that the MA reflects a consistent lookback period relative to the amount of trading time each candle represents.
Features:
Timeframe Adaptability: Automatically adjusts the MA period to correspond to a 5-day lookback, regardless of the selected timeframe.
Intraday Precision: For intraday charts (5m, 15m, 30m, 1h, 2h, 4h), the indicator calculates the number of periods within the 5-day span based on the chart's timeframe.
Daily and Weekly Timeframe Compatibility: Sets the period to 5 for daily charts to maintain the 5-day MA, and to 1 for weekly charts, where each candlestick represents a week's worth of trading days.
Calculation Logic:
The indicator begins by defining the total number of trading minutes in 5 days, based on a standard 6.5-hour trading day.
A dynamic period calculation function then determines the number of those intervals that fit into the 5-day minute total for the selected timeframe.
For daily charts, the period is a straightforward 5, while for weekly charts, the period is set to 1, reflecting the average of the past 5 trading days.
Dynamic 5-Day Moving AverageThe Dynamic 5-Day Moving Average (MA) indicator is designed to provide traders with a consistent, time-adjusted moving average line across various timeframes. This indicator is especially useful for traders who switch between multiple timeframes and want a moving average that represents a fixed 5-day period, ensuring that the MA reflects a consistent lookback period relative to the amount of trading time each candle represents.
Features:
Timeframe Adaptability: Automatically adjusts the MA period to correspond to a 5-day lookback, regardless of the selected timeframe.
Intraday Precision: For intraday charts (5m, 15m, 30m, 1h, 2h, 4h), the indicator calculates the number of periods within the 5-day span based on the chart's timeframe.
Daily and Weekly Timeframe Compatibility: Sets the period to 5 for daily charts to maintain the 5-day MA, and to 1 for weekly charts, where each candlestick represents a week's worth of trading days.
Calculation Logic:
The indicator begins by defining the total number of trading minutes in 5 days, based on a standard 6.5-hour trading day.
A dynamic period calculation function then determines the number of those intervals that fit into the 5-day minute total for the selected timeframe.
For daily charts, the period is a straightforward 5, while for weekly charts, the period is set to 1, reflecting the average of the past 5 trading days.
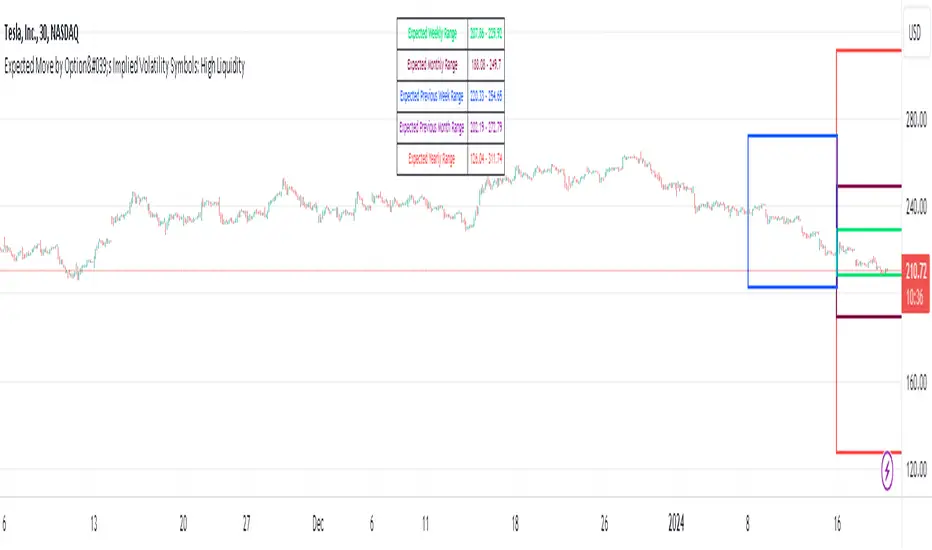
Expected Move by Option's Implied Volatility High Liquidity
This script plots boxes to reflect weekly, monthly and yearly expected moves based on "At The Money" put and call option's implied volatility.
Symbols in range: This script will display Expected Move data for Symbols with high option liquidity.
Weekly Updates: Each weekend, the script is updated with fresh expected move data, a job that takes place every Saturday following the close of the markets on Friday.
In the provided script, several boxes are created and plotted on a price chart to represent the expected price moves for various timeframes.
These boxes serve as visual indicators to help traders and analysts understand the expected price volatility.
Definition of Expected Move: Expected Move refers to the anticipated range within which the price of an underlying asset is expected to move over a specific time frame, based on the current implied volatility of its options. Calculation: Expected Move is typically calculated by taking the current stock price and applying a multiple of the implied volatility. The most commonly used multiple is the one-standard-deviation move, which encompasses approximately 68% of potential price outcomes.
Example: Suppose a stock is trading at $100, and the implied volatility of its options is 20%. The one-standard-deviation expected move would be $100 * 0.20 = $20.
This suggests that there is a 68% probability that the stock's price will stay within a range of $80 to $120 over the specified time frame. Usage: Traders and investors use the expected move as a guideline for setting trading strategies and managing risk. It helps them gauge the potential price swings and make informed decisions about buying or selling options.There is a 68% chance that the underlying asset stock or ETF price will be within the boxed area at option expiry. The data on this script is updating weekly at the close of Friday, calculating the implied volatility for the week/month/year based on the "at the money" put and call options with the relevant expiry. This script will display Expected Move data for Symbols within the range of JBL-NOTE in alphabetical order.
In summary, implied volatility reflects market expectations about future price volatility, especially in the context of options. Expected Move is a practical application of implied volatility, helping traders estimate the likely price range for an asset over a given period. Both concepts play a vital role in assessing risk and devising trading strategies in the options and stock markets.