Combo Backtest 123 Reversal & Klinger Volume Oscillator This is combo strategies for get a cumulative signal.
First strategy
This System was created from the Book "How I Tripled My Money In The
Futures Market" by Ulf Jensen, Page 183. This is reverse type of strategies.
The strategy buys at market, if close price is higher than the previous close
during 2 days and the meaning of 9-days Stochastic Slow Oscillator is lower than 50.
The strategy sells at market, if close price is lower than the previous close price
during 2 days and the meaning of 9-days Stochastic Fast Oscillator is higher than 50.
Second strategy
The Klinger Oscillator (KO) was developed by Stephen J. Klinger. Learning
from prior research on volume by such well-known technicians as Joseph Granville,
Larry Williams, and Marc Chaikin, Mr. Klinger set out to develop a volume-based
indicator to help in both short- and long-term analysis.
The KO was developed with two seemingly opposite goals in mind: to be sensitive
enough to signal short-term tops and bottoms, yet accurate enough to reflect the
long-term flow of money into and out of a security.
The KO is based on the following tenets:
Price range (i.e. High - Low) is a measure of movement and volume is the force behind
the movement. The sum of High + Low + Close defines a trend. Accumulation occurs when
today's sum is greater than the previous day's. Conversely, distribution occurs when
today's sum is less than the previous day's. When the sums are equal, the existing trend
is maintained.
Volume produces continuous intra-day changes in price reflecting buying and selling pressure.
The KO quantifies the difference between the number of shares being accumulated and distributed
each day as "volume force". A strong, rising volume force should accompany an uptrend and then
gradually contract over time during the latter stages of the uptrend and the early stages of
the following downtrend. This should be followed by a rising volume force reflecting some
accumulation before a bottom develops.
WARNING:
- For purpose educate only
- This script to change bars colors.
ابحث في النصوص البرمجية عن "williams"

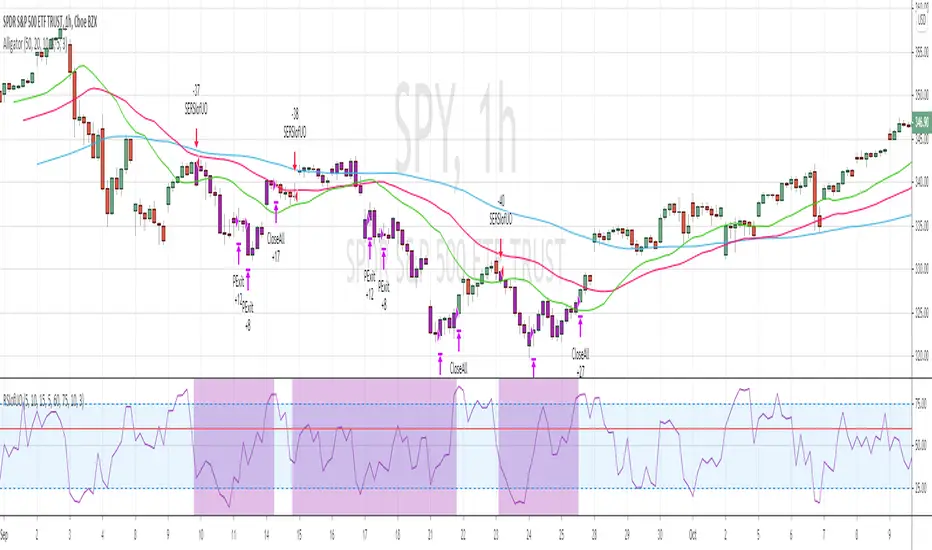
RSI of Ultimate Oscillator [SHORT Selling] StrategyThis is SHORT selling strategy with Ultimate Oscillator. Instead of drectly using the UO oscillator , I have used RSI on UO (as I did in my previous strategies )
Ultimator Oscillator settings are 5, 10 and 15
RSI of UO setting is 5
Short Sell
==========
I have used moving averages from WilliamAlligator indicator --- settings are 10(Lips), 20(teeth) and 50 (Jaw)
when Lips , Teeth and Jaw are aligned to downtrend (that means Lips < Teeth < Jaw )
Look for RSIofUO dropping below 60 ( setting parameter is Sell Line )
Partial Exit
==========
When RSIofUO crossing up Oversold line i.e 30
Cover Short / Exit
=================
When RSIofUO crosisng above overbought line i.e 70
StopLoss
========
StopLoss defaulted to 3 % , Though it is mentioned in settings , it has not been not used to calcuate and StopLoss Exit... Reason is, when RSIofUO already crossed 60 line (for SHORTING) , then it would take more efforts go up beynd 60. There is saying price takes stairs to climb up but it takes elevator to go down. I have not purely depend on this to exit stop loss, however noticed the trades in this stratgey did not get out with loss higher than when RSIofUO reaching 70 level.
Note
======
Williams Alligator is not drawn from the script. It is manually added to chart for illustration purpose. Please add it when you are using this strategy , whch woould give an idea how the strategy is taking Short Trades.
This is tested on Hourly chart for SPY
Bar color changes to purple when the strategy is in SHORT trade
Warning
========
For the eductional purposes only
RSI Moving Average with Signal LineDefault values:
RSI = white
RSI Prime ( RSI of RSI ) = yellow
EMA 34 = blue
EMA 55 = red
They are listed in order of reactiveness to price changes. Think of them like the Williams Alligator...
White and yellow work the fastest, with WHITE being signal and YELLOW being trigger. Great for LTF
Blue and red work the slowest, with BLUE being frequently testing RED as support/resistance. Great for HTF
Long Entry:
RSIs both > SMAS (signal)
RSI > RSI Prime (confirmation)
Long Exit:
RSI < RSI Prime (signal)
RSIs both < SMAs (confirmation)
Short Entry:
RSIs both < SMAS (signal)
RSI < RSI Prime (confirmation)
Short Exit:
RSI > RSI Prime (signal)
RSIs both > SMAS (confirmation)

Public & Pro ActionBased on Larry Williams Pro-Go logic for public and pro actions. This indicator works on all timeframes.
The public action is previous close to today's open.
The pro action is today's close to today's open.
The series is smoothened with a simple moving average.
It works best after the candle is formed.

Nubia - Auto Midas Anchored VWAP [xdecow]This indicator looks for the highs and lows using the highest / lowest of 4 different periods. The default values are 17, 72, 305 and 1292 inspired by BO Williams phicube fractals.
The indicator will show anchored vwaps from those 8 dynamic points (4 tops and 4 bottoms).
A true trend is defined when 4 fractals line up without much opposite resistance (only the two smallest opposing vwaps).
When the price is between several vwaps it is a sign of consolidation or pullback. You can use larger timeframes to check for possible targets in large consolidations and pullbacks.

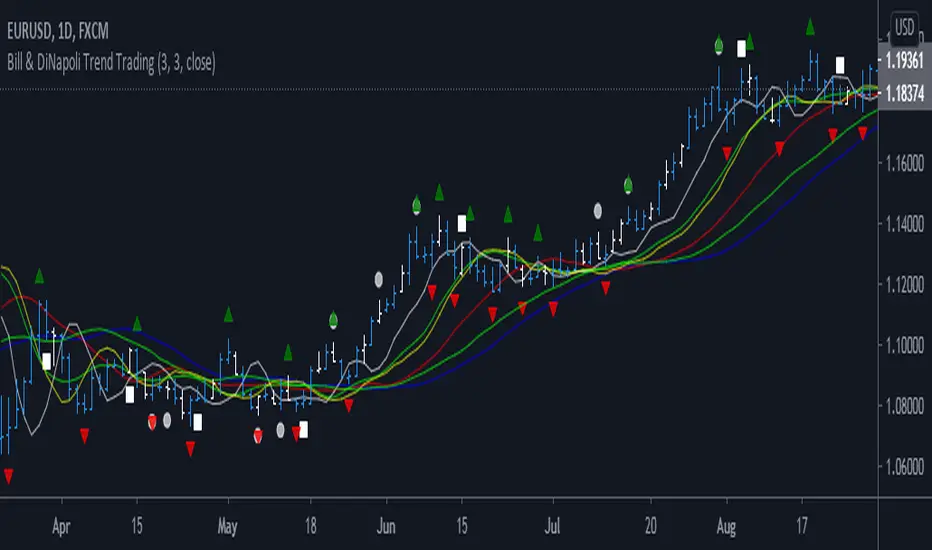
Bill & DiNapoli TradingThis Indicator is a pack of set of Indicators. I am a Bill Williams Chaos and DiNapoli system trader. It includes following indicators,
1. Wiseman 1 - Divergent Bar indicated by Circle. Angulation to be manually observed
2. Wiseman 2 - The Super AO signal, indicated by a square
3. Wiseman 3 - Bill William's Fractal indicated as Triangle
4. DiNapoli DMA1 - 3 Bar SMA, Shifted 3 Periods forward
5. DiNapoli DMA2 - 7 Bar SMA, Shifted 5 Periods forward
6. DiNapoli DMA3 - 25 Bar SMA, Shifted 5 Periods forward
7. Squat Bar - Bill William's Trading System
You can check out Bill Willam's Trading Chaos 2nd Edition and DiNapoli Level Book
Finnie's RSI + 3EMA crossover + MFI + Vix Fix-added a medium and long term rsiEMA, in addition to the previous short term, except this time there's a visual crossover :)
-added CM Williams vix fix
-and finally just a general visual overhaul!

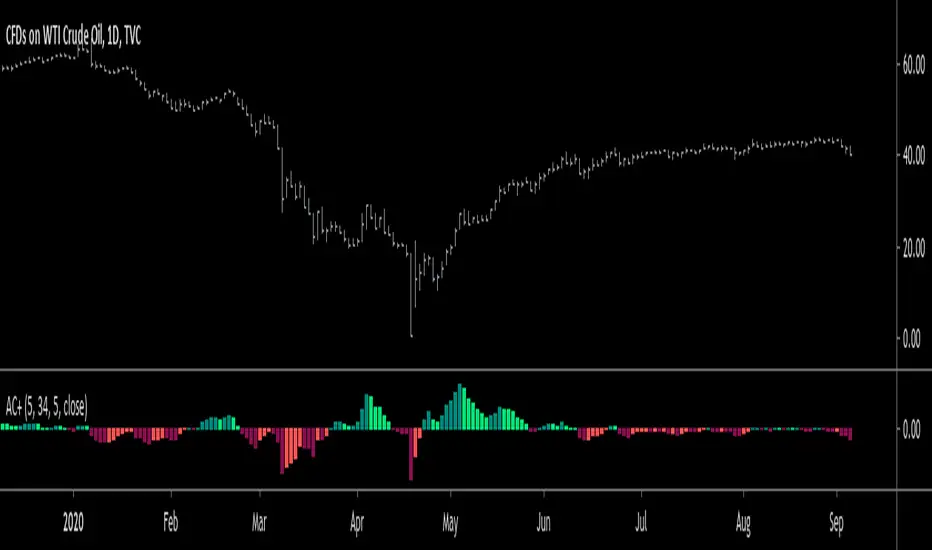
Accelerator Oscillator PlusBill Williams designed the Accelerator Oscillator (AC) to provide the earliest indications possible to changes in the trend, and he claimed that it gives traders a significant advantage in the market.
Improving upon his indicator, I give you Accelerator Oscillator Plus (AC+). Currently, Accelerator Oscillator Plus sets itself apart from other Accelerator Oscillators in Tradingview because it has a source option that allows the user to choose between close, hl2, etc.
Calculation:
AO(5,34) = sma(close,5) - sma(close,34)
AC(5,34,5)+ = AO - sma(AO,5)
The default & recommended settings for Accelerator Oscillator Plus are:
AO ma1: 5
AO ma2: 34
AC ma: 5
AO Source: Close
How to trade with this oscillator:
When values are greater than zero, oscillator is green/bullish.
When values are lesser than zero, oscillator is red/bearish.
A signal to buy occurs when the oscillator changes from (-) to (+) values...and vise versa for a sell signal.
If you have any questions or concerns, please leave a comment down below.
Also, hit the like & follow buttons if you haven't already!
I come up with new indicators every month!
Good luck, and enjoy :)
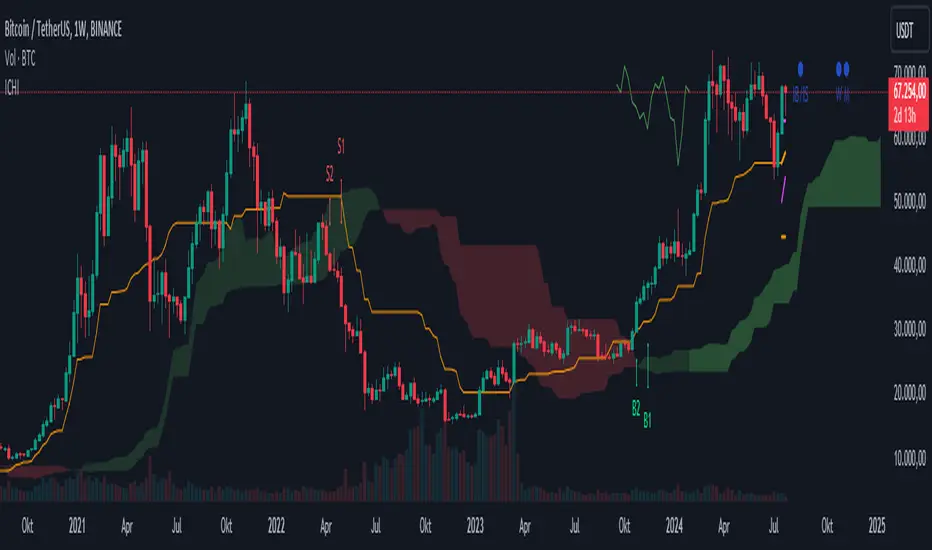
Ichimoku Kinko Hyo + FractalsIn contrast to my Ichimoku ++ Study this is a pure Ichimoku Konko Hyo Study with Bill Williams Fractals (I couldn't leave out the fractals as these levels are too important for Ichimoku trading).
In this study you can find many visualisation options for the Ichimoku Indicator and the signals the Ichimoku Tradingsystem can provide.
Tenkan-sen and Kijun-sen are provided optionally as mtf levels.
An mtf price cloud relationship is shown in the upper right.
The included signals are:
B1/S1 is a strong filtered signal. The condition for long entry is:
price > Kumo AND Chikou > price AND Chikou > Kumo AND Tenkan > Kijun AND Komo is green
B2/S2 is a less filtered signal. The condition for long entry is:
price > Kumo AND Chikou > price AND Tenkan > Kijun
IB/IS is a confluence signal. The condition for a long/short entry is: more than 50% of the 8 defined conditions must trigger a long signal. Below 50% long, it is a short signal because more than 50% of the entry conditions have triggered a short signal.
Effort v RewardI made this indicator to make it easier to compare volume and price movement. This is similar in concept to the Market Facilitation Index by Bill Williams, although hopefully this can make that analysis easier to see at a glance (similar to the way some bar overlays/recolors work but with more detail and in its own pane). The primary use for this indicator would be paying attention to the red EMA, which shows the difference between price movement and volume, normalized within the normalization lookback period (adjustable, defaults to 30 bars). When the red ema moves up, it means there is less effort required to move price more, which means the trend (if there is one) is probably stronger or has had resistance removed/shaken out already; if the red ema moves down into the negative, it means there is a lot of effort for very little price movement, meaning a large battle between the bears and the bulls currently (squat). Enjoy, let me know if you want adjustments, and safe and successful trading!

Larry Williams 9.2 with EMA21 filter - ValenteIndicator for the setup Larry Willians 9.2
there is a option to include the EMA21 as a filter.

Riley's Percent RangeThis indicator is based on Williams Percent Range, but uses a slightly different formula.
When the indicator line is green = buy, red = sell, gray = neutral.
Enjoy! and hit the follow button to stay up to date with my latest indicators!

Two Fractals TrendlinesThis study draws a trend line for the last two Bill Williams up-fractals and down-fractals.
Trend line break signals and alerts can optionally be added.

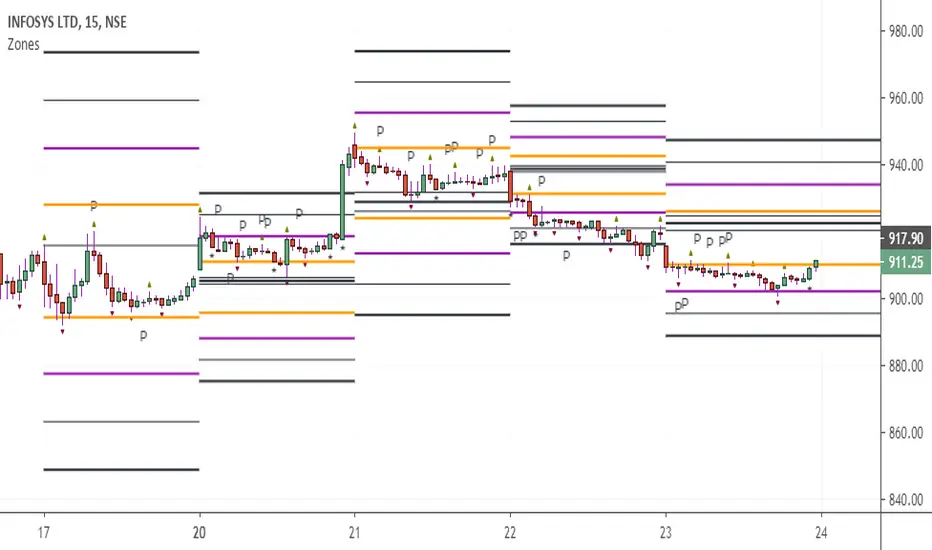
CAMZONEAdded Fractals which establishes high and low based on Bill Williams definition. Added one type of Pinbar (where the open and close is near extreme of the range and with long shadow that is at least 80% of the range). It is a powerful reversal pattern especially on the daily charts. These bars are identified with the character P. Also included dots below momentum candles.
Ichimoku ++ public v0.9Description:
The intention of this script is to build/provide a kind of work station / work bench for analysing markets and especially Bitcoin . Another goal is to get maximum market information while maintaining a good chart overview. A chart overloaded with indicators is useless because it obscures the view of the chart as the most important indicator. The chart should be clear and market structure should be easy to see. In addition, some indicator signals can be activated to better assess the quality of signals from the past. The chart environment or the chart context is important for the quality of a signal.
The intention of this script is not to teach someone how to trade or how to use these Indicators but to provide a tool to analyse markets better and to help to draw conclusions of market behaviour in a higher quality.
A general advise:
Use the included indicators and signals in a confluent way to get stoploss, buy and sell entry points. SR clusters can be identified for use in conjunction with fractals as entry and exit pints. My other scripts can also help. Prefer 4 hours, daily and a longer time frame. There is no "Holy Grail" :).
If someone is new to trading you should learn about the indicators first. Definitely learn about Ichimoku Cloud Indicator.
Integrated indicators are:
Ichimoku Cloud and signals
Parabolic SAR and signal
ATR stop
Bollinger Bands
EMA / SMA and background color as signal
Williams Fractals and signal
Puell Multiple signal

Larry Williams 9.1 with Optional Filters - ValenteThis indicator is based on the Larry Willians 9.1 Strategy.
It will paint the candles WHITE when Long entries are activated and BLACK when short entries are activated.
There is an option to include an EMA or SMA filter.

Gator RibbonThere's nothing fancy here--I just like the look of this one. And it works pretty well. This started out as the standard Alligator indicator. There I reset all the offsets to 0 and added an Ichimoku Cloudish fill.
Astute observers will notice a fourth line has been added at 34 SMA. It's a bit of a cheat. 34 SMA is the zero line of another classic B. Williams indicator, the Awesome Oscillator. When the green line crosses over 34 SMA, it's quite likely the Awesome Oscillator will have changed sentiment as well. It also makes a nice loose trailing stop loss reference if you're hoping to get into some long trends.

Bayesian BBSMA OscillatorSometime ago (very long ago), one of my tinkering project was to do a spam or ham classification type app to filter news I'd wanna read. So I built myself a Naive Bayes Classifier to feed me my relevant articles. It worked great, I can cut through the noise.
The hassle was I needed to manually train it to understand what I wanna read. I trained it using 50 articles and to my surprise, it's enough.
Complexity Theory
I've been reading a book called The Road to Ruin by Jim Rickards. He described how he got to his conclusion of how the stock market works by using Complexity Theory. Bill Williams would agree. Jim tells us that by using just enough data, we calculate the probability of an event to occur. We can't say for sure when but we know it's coming. This was my light bulb moment.
While Jim talks much about Bayesian Inference in which a probability of an event can always be updated as more evidence comes to light, I had my eyes set on binary probabilities of when prices are going up and down.
Assumptions
These are my assumptions:
Prices breaking up a Bollinger basis line will have fuel to go up even higher
Prices will go down when prices have broken up a Bollinger upper band
Scalping is the main method so we should use a lower period Moving Average (MA)
When prices are above MA, it's likelier a correction to the downside is imminent
When prices are below MA, it's likelier a correction to the upside is imminent
Optimize parameters for 1 hour timeframe which will give us time to react while still having more opportunities to trade
Building Blocks
Jim Rickards started with limited data (events) while in technical trading, data are plentiful. I decided to classify 2 events which are:
Next candles would be breaking up
Next candles would be breaking down
Key facts:
We won't know for sure when prices are going to break
We won't know for sure how much the prices movements are going to be
Formulas
Breaking up:
Pr(Up|Indicator) = Pr(Indicator|Up) * Pr(Up) / Pr(Indicator|Up) * Pr(Up) + Pr(Indicator|Down) * Pr(Down)
Breaking down:
Pr(Down|Indicator) = Pr(Indicator|Down) * Pr(Down) / Pr(Indicator|Down) * Pr(Down) + Pr(Indicator|Up) * Pr(Up)
Reading The Oscillator
Green is the probability of prices breaking up
Red is the probability of prices breaking down
When either green or red is flatlining ceiling, immediately on the next candle when the probability decreases go short or long based on which direction you're observing - Strong Signal
When either green or red is flatlining ceiling, take no action while it's ceiled
Usually when either green or red is flatlining bottom, the next candle when the probability increases, immediately take a short long position based on the direction you're observing - Weak Signal
When either green or red is flatlining bottom, take no action while it's bottomed
Alerts
Use Once per Bar option when generating alerts.

Dynamic Support and ResistanceSupport is a price level where a downtrend can be expected to pause due to a concentration of demand or buying interest. As the price of assets or securities drops, demand for the shares increases, thus forming the support line.
Meanwhile, resistance zones arise due to selling interest when prices have increased.s their name implies, dynamic support and resistance levels change their level with each new price-tick.To draw dynamic support and resistance levels, traders usually use moving averages which are automatically drawn by your trading platform. The 200-day exponential moving average (EMA), 100-day EMA, and 20-30-40-50-day EMA are very popular dynamic support and resistance levels.also in some references Williams Fractal level used for dynamic support and resistance levels. and it also includes other support and resistance levels that are projected based on the pivot point calculation. All these levels help traders see where the price could experience support or resistance. Similarly, if the price moves through these levels it lets the trader know the price is trending in that direction.

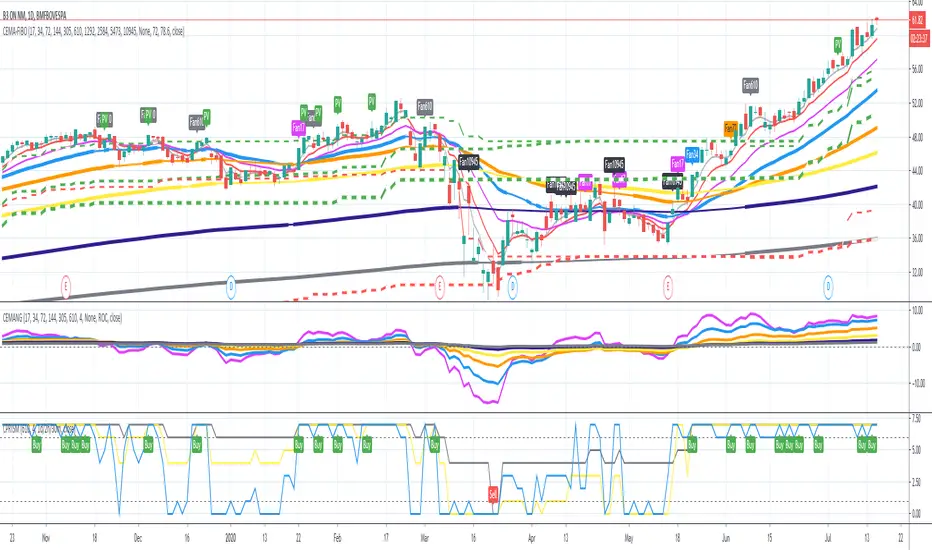
Custom EMA PrismThis script implements the Binary Logic Trading (BLT) algorithm to calculate a score from 0 to 7. This score is calculated assigning a power of 2 weight to the positive sign of 3 Phi^3 distant EMAs' slopes. The largest EMA slope positive sign receives weight 4, the middle length EMA slope positive sign receives weight 2 and the shortest EMA slope positive sign receives weight 1. The positive sign of an EMA is defined as 1 if the slope of the EMA is positive and 0, otherwise. Therefore, for EMAs 305, 72 and 17, if slope(EMA305) > 0, slope(EMA72) < 0 and slope(EMA17) > 0, then score will be 4*1 + 2*0 + 1*1 = 5. Up to my knowledge, this score was first proposed by Bo Williams and named by him as Prisma.
Due too sampling issues, this script ONLY WORKS with graphic time of 1d. I would like to thanks to MrBitmanBob for showing me how to get quotations from a graphic time distinct from the current one.
This script also gets sampling data from graphic times 2h and 30m to calculate their score. As, even for smaller graphic times, price data is sampled at the current time frequency, the EMA lengths for those smaller graphic times needed to be proportionally decreased, meaning that when calculating the score for 1d with lengths 305, 72 and 17, the score for 2h must be calculated with lengths 72, 17 and 4, and the score for 30m must be calculated with lengths 17, 4 an 1. I understand that some precision may be lost but it is the best that is possible.
There is an optional setting for Crypto Currencies that instead of calculating the score for 1d, 2h and 30m, it calculates the score for 1d, 4h and 60m. This is due to the fact that Crypto Currencies are traded 24x7. Despite of this setting, the labels at the Style tab of the settings window remains 2h and 30m, because they must be constants.
This script with the corresponding EMAs chart and the EMAs Angle chart provides a broader view of the trading scenario.

Trade System Crypto InvestidorTrade System created to facilitate the visualization of crossing and extensions of the movements with Bollinger bands.
Composed by:
Moving Averages of 21, 50, 100 and 200.
Exponential Moving Averages: 17,34,72,144, 200 and 610.
Bollinger bands with standard deviation 2 and 3.
How it works?
The indicators work together, however there are some important cross-averages that need to be identified.
- Crossing the MA21 with 50, 100 and 200 up or down will dictate an up or down trend.
- MA200 and EMA200 are excellent indicators of resistance and support zone, if the price is above these averages it will be a great support, if the price is below these averages it will indicate strong resistance.
- Another important crossover refers to exponential moving averages of 17 to 72 indicates a possible start of a trend
- The crossing of the exponential moving average of 34 with 144 will confirm the crossing mentioned above.
- In addition, the exponential moving average of 610 used by Bo Williams is an excellent reference for dictating an upward or downward trend, if the price is above it it will possibly confirm an upward trend and the downside.
- To conclude we have bollinger bands with standard deviation 2 and 3, they help to identify the maximum movements.

Momentum Sentiment Indicator by mattzabThis indicator uses 3 moving averages and includes volume to display sentiment and momentum.
By default, a 5, 8, and 13 SMA is displayed (black lines).
The colored bands are the corresponding volume weighted moving averages.
When the colored band is above the black line, sentiment is bullish.
Think of the color as being a show of volume, and the black lines as support and resistance.
When the lines are trending up, and colors are above the black lines, an uptrend is in progress.
When the colors are mixed above and below, and the lines are intertwined, it is a ranging market.
The lines operate similar to the Williams Alligator.
